
Tools for Predicting Forage Growth in Rangelands and Economic Analyses—A Systematic Review
 , , , , , , , , and
Abstract
:1. Introduction
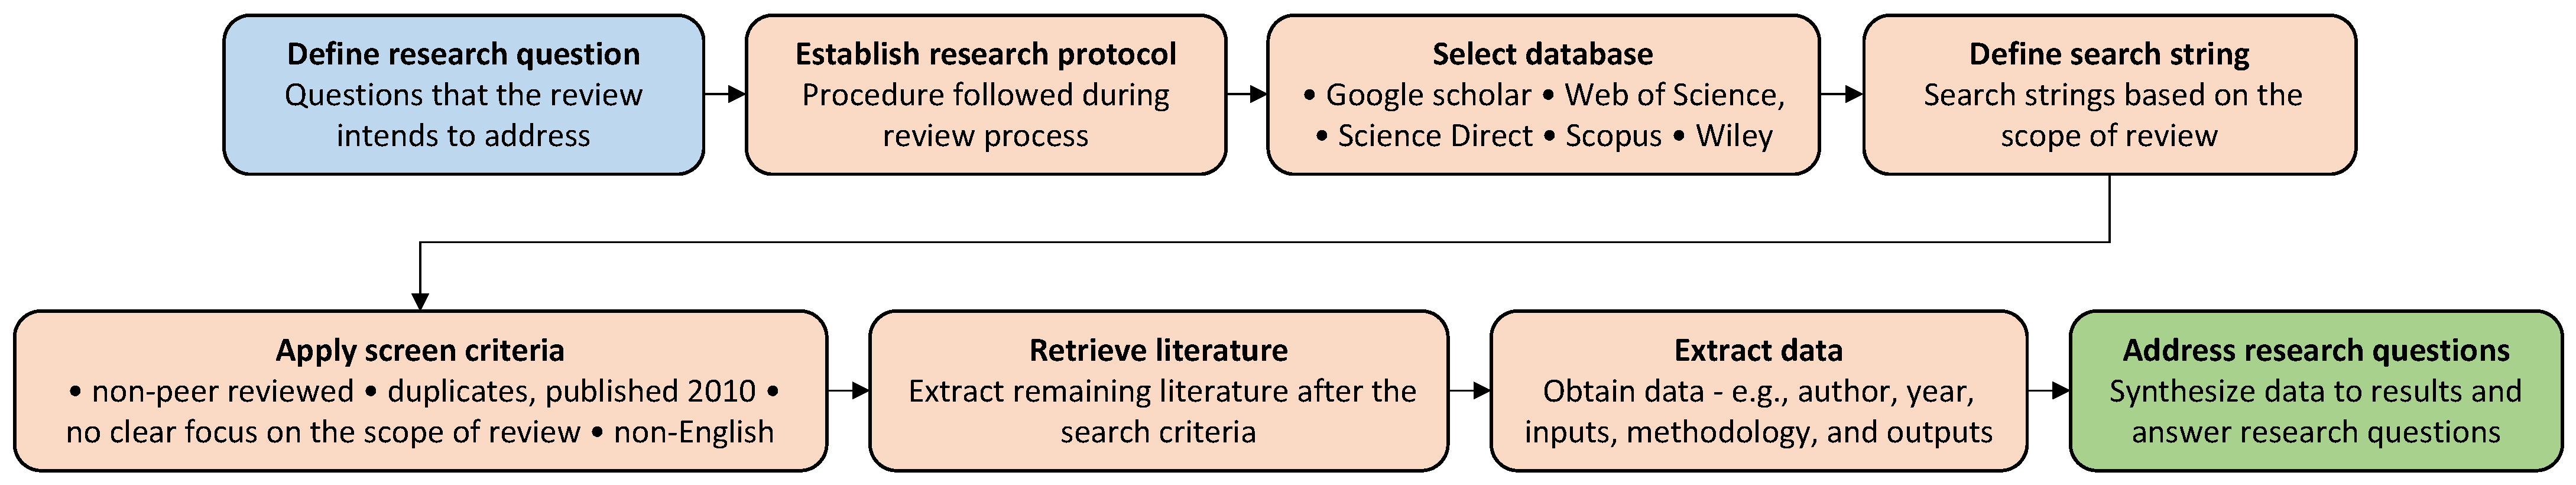
2. Material and Methods
2.1. Review Methodology
2.1.1. Defining Research Questions
- Q1:
- What significantly influences grass and forage biomass yield prediction?
- Q2:
- What regression and machine learning modeling techniques can be used for biomass yield prediction?
- Q3:
- What tools are currently available for grass/forage monitoring and yield prediction?
- Q4:
- What tools are available for forage economic analysis?
2.1.2. Literature Search
2.1.3. Exclusion Criteria
- C1:
- Literature that did not have a clear focus on grass or forage prediction
- C2:
- Literature not in English
- C3:
- Duplicate publications already retrieved from another database source
- C4:
- Literature published before 2010 (latest 10+ years considered)
- C5:
- Literature published in conference proceedings and magazines
3. Results
3.1. Important Features Predicting Grass/Forage Yield
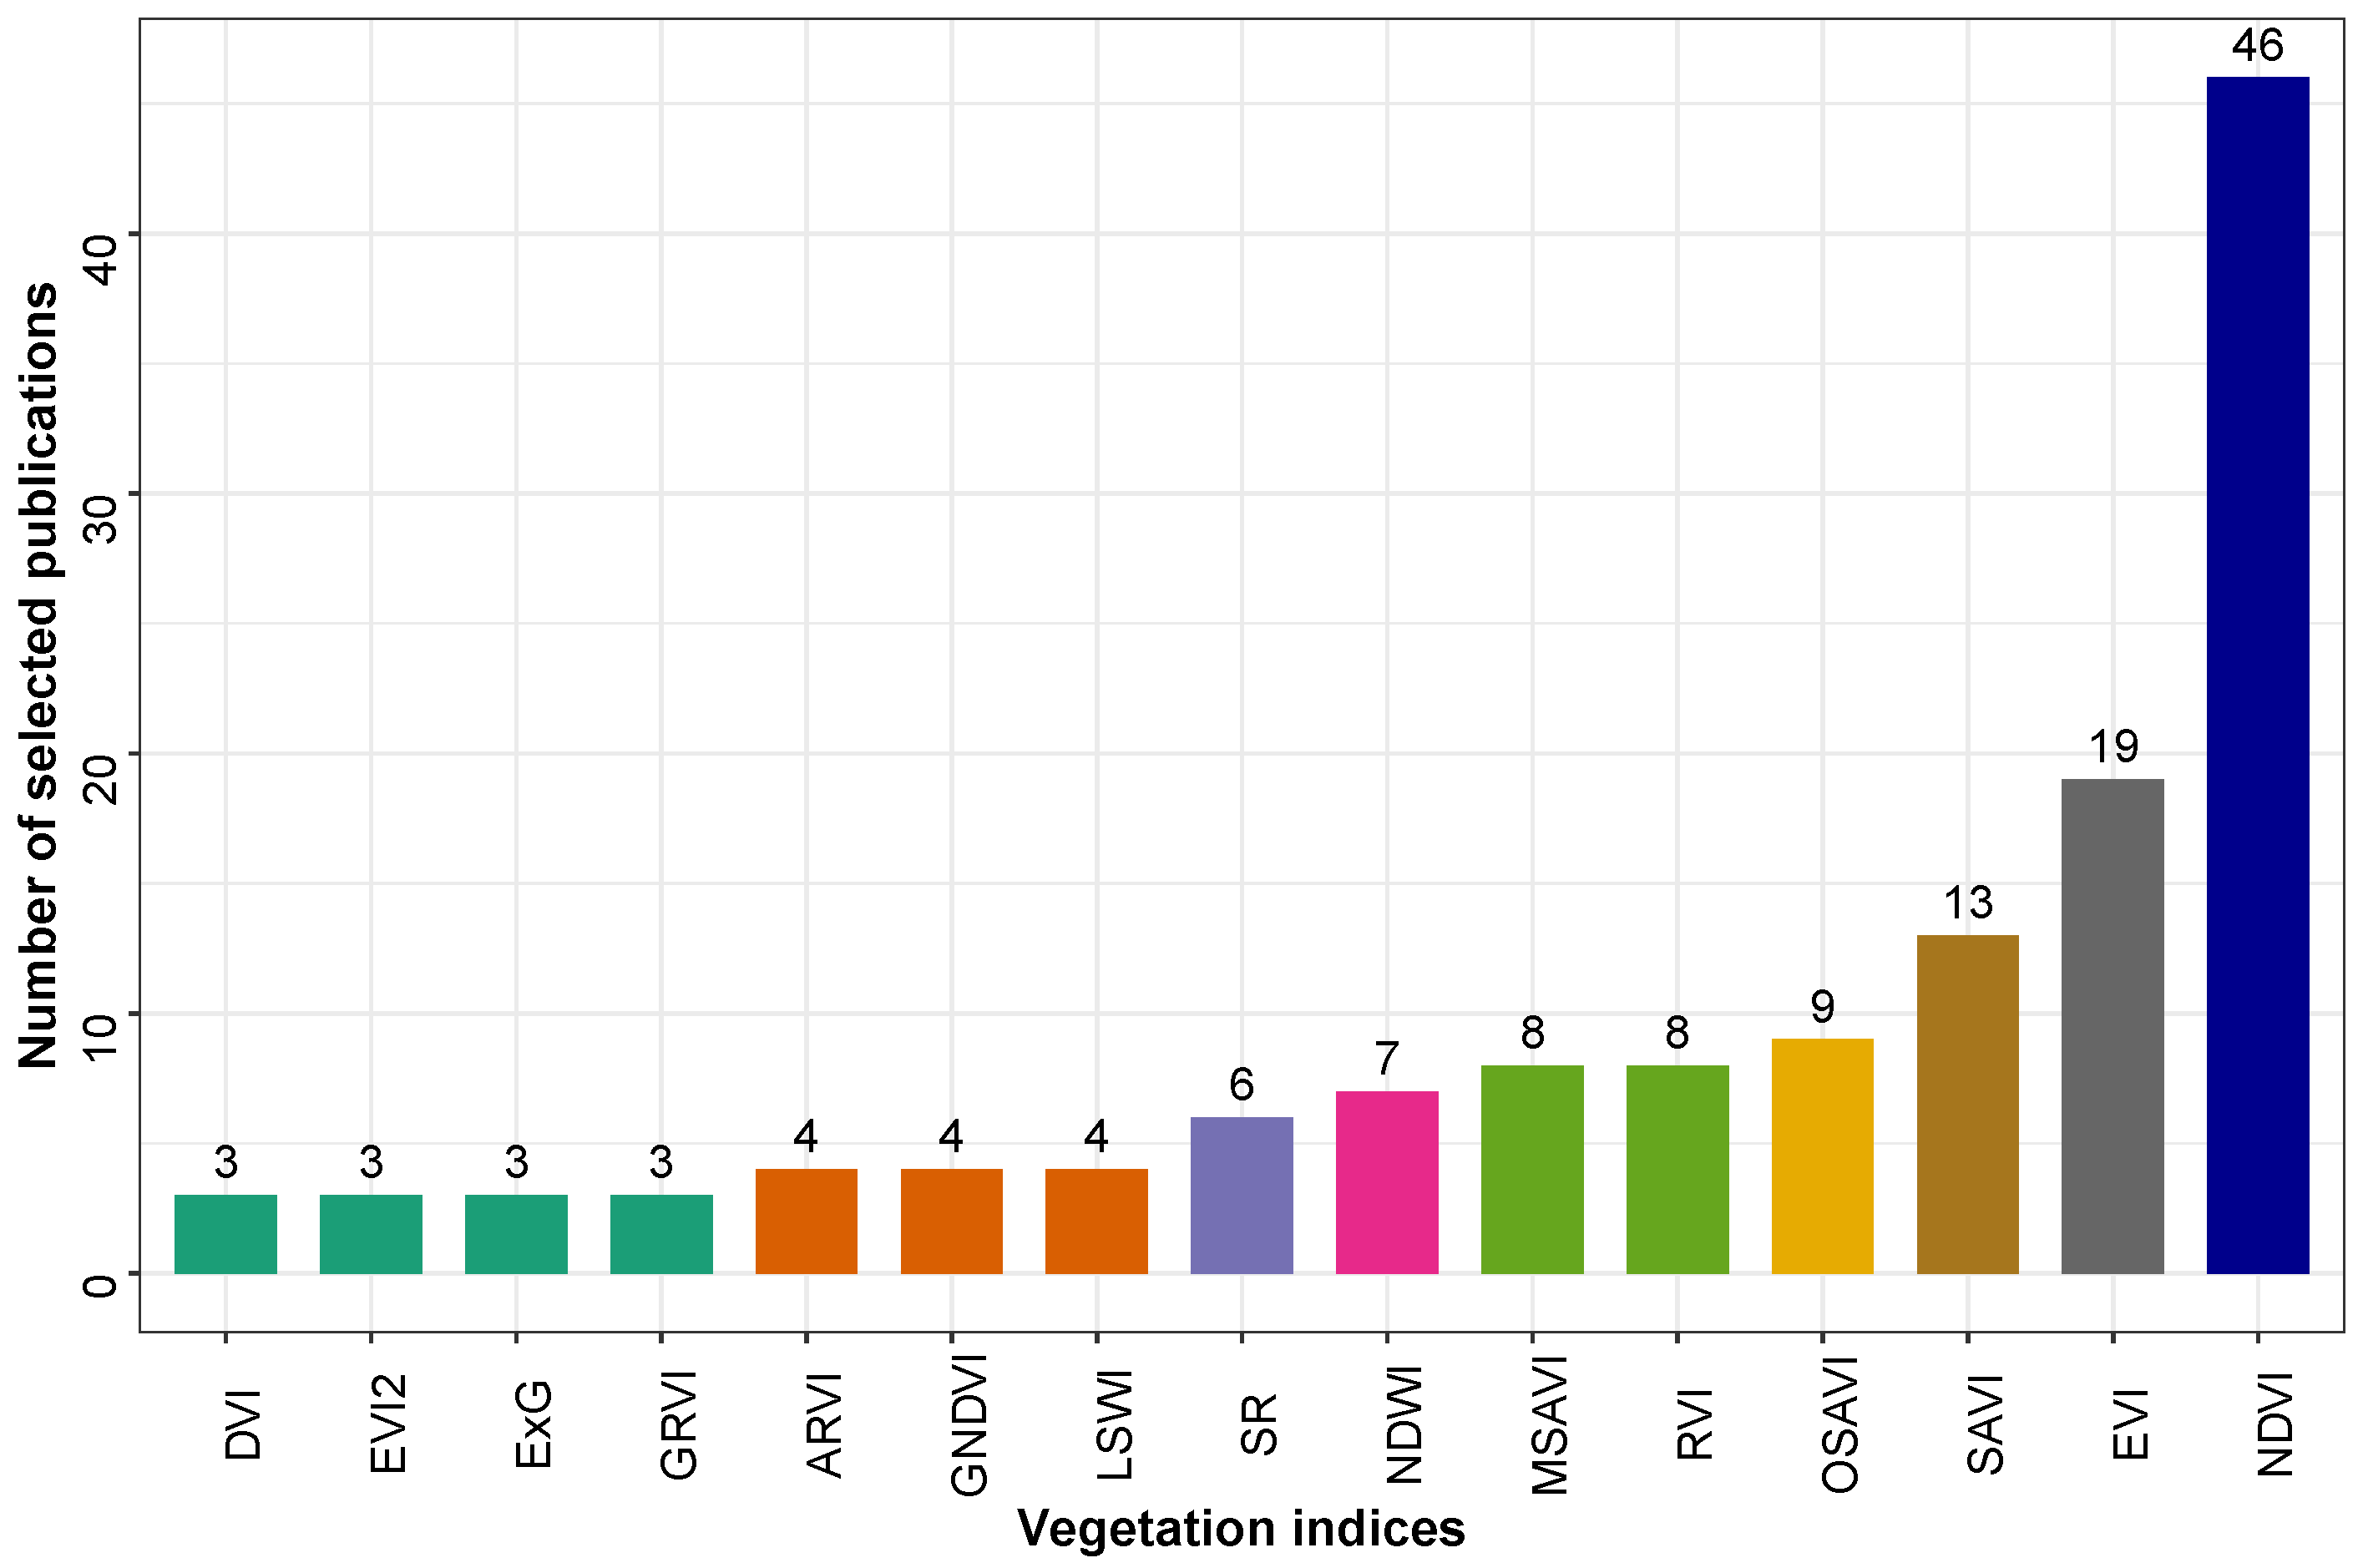
3.1.1. Vegetation Indices
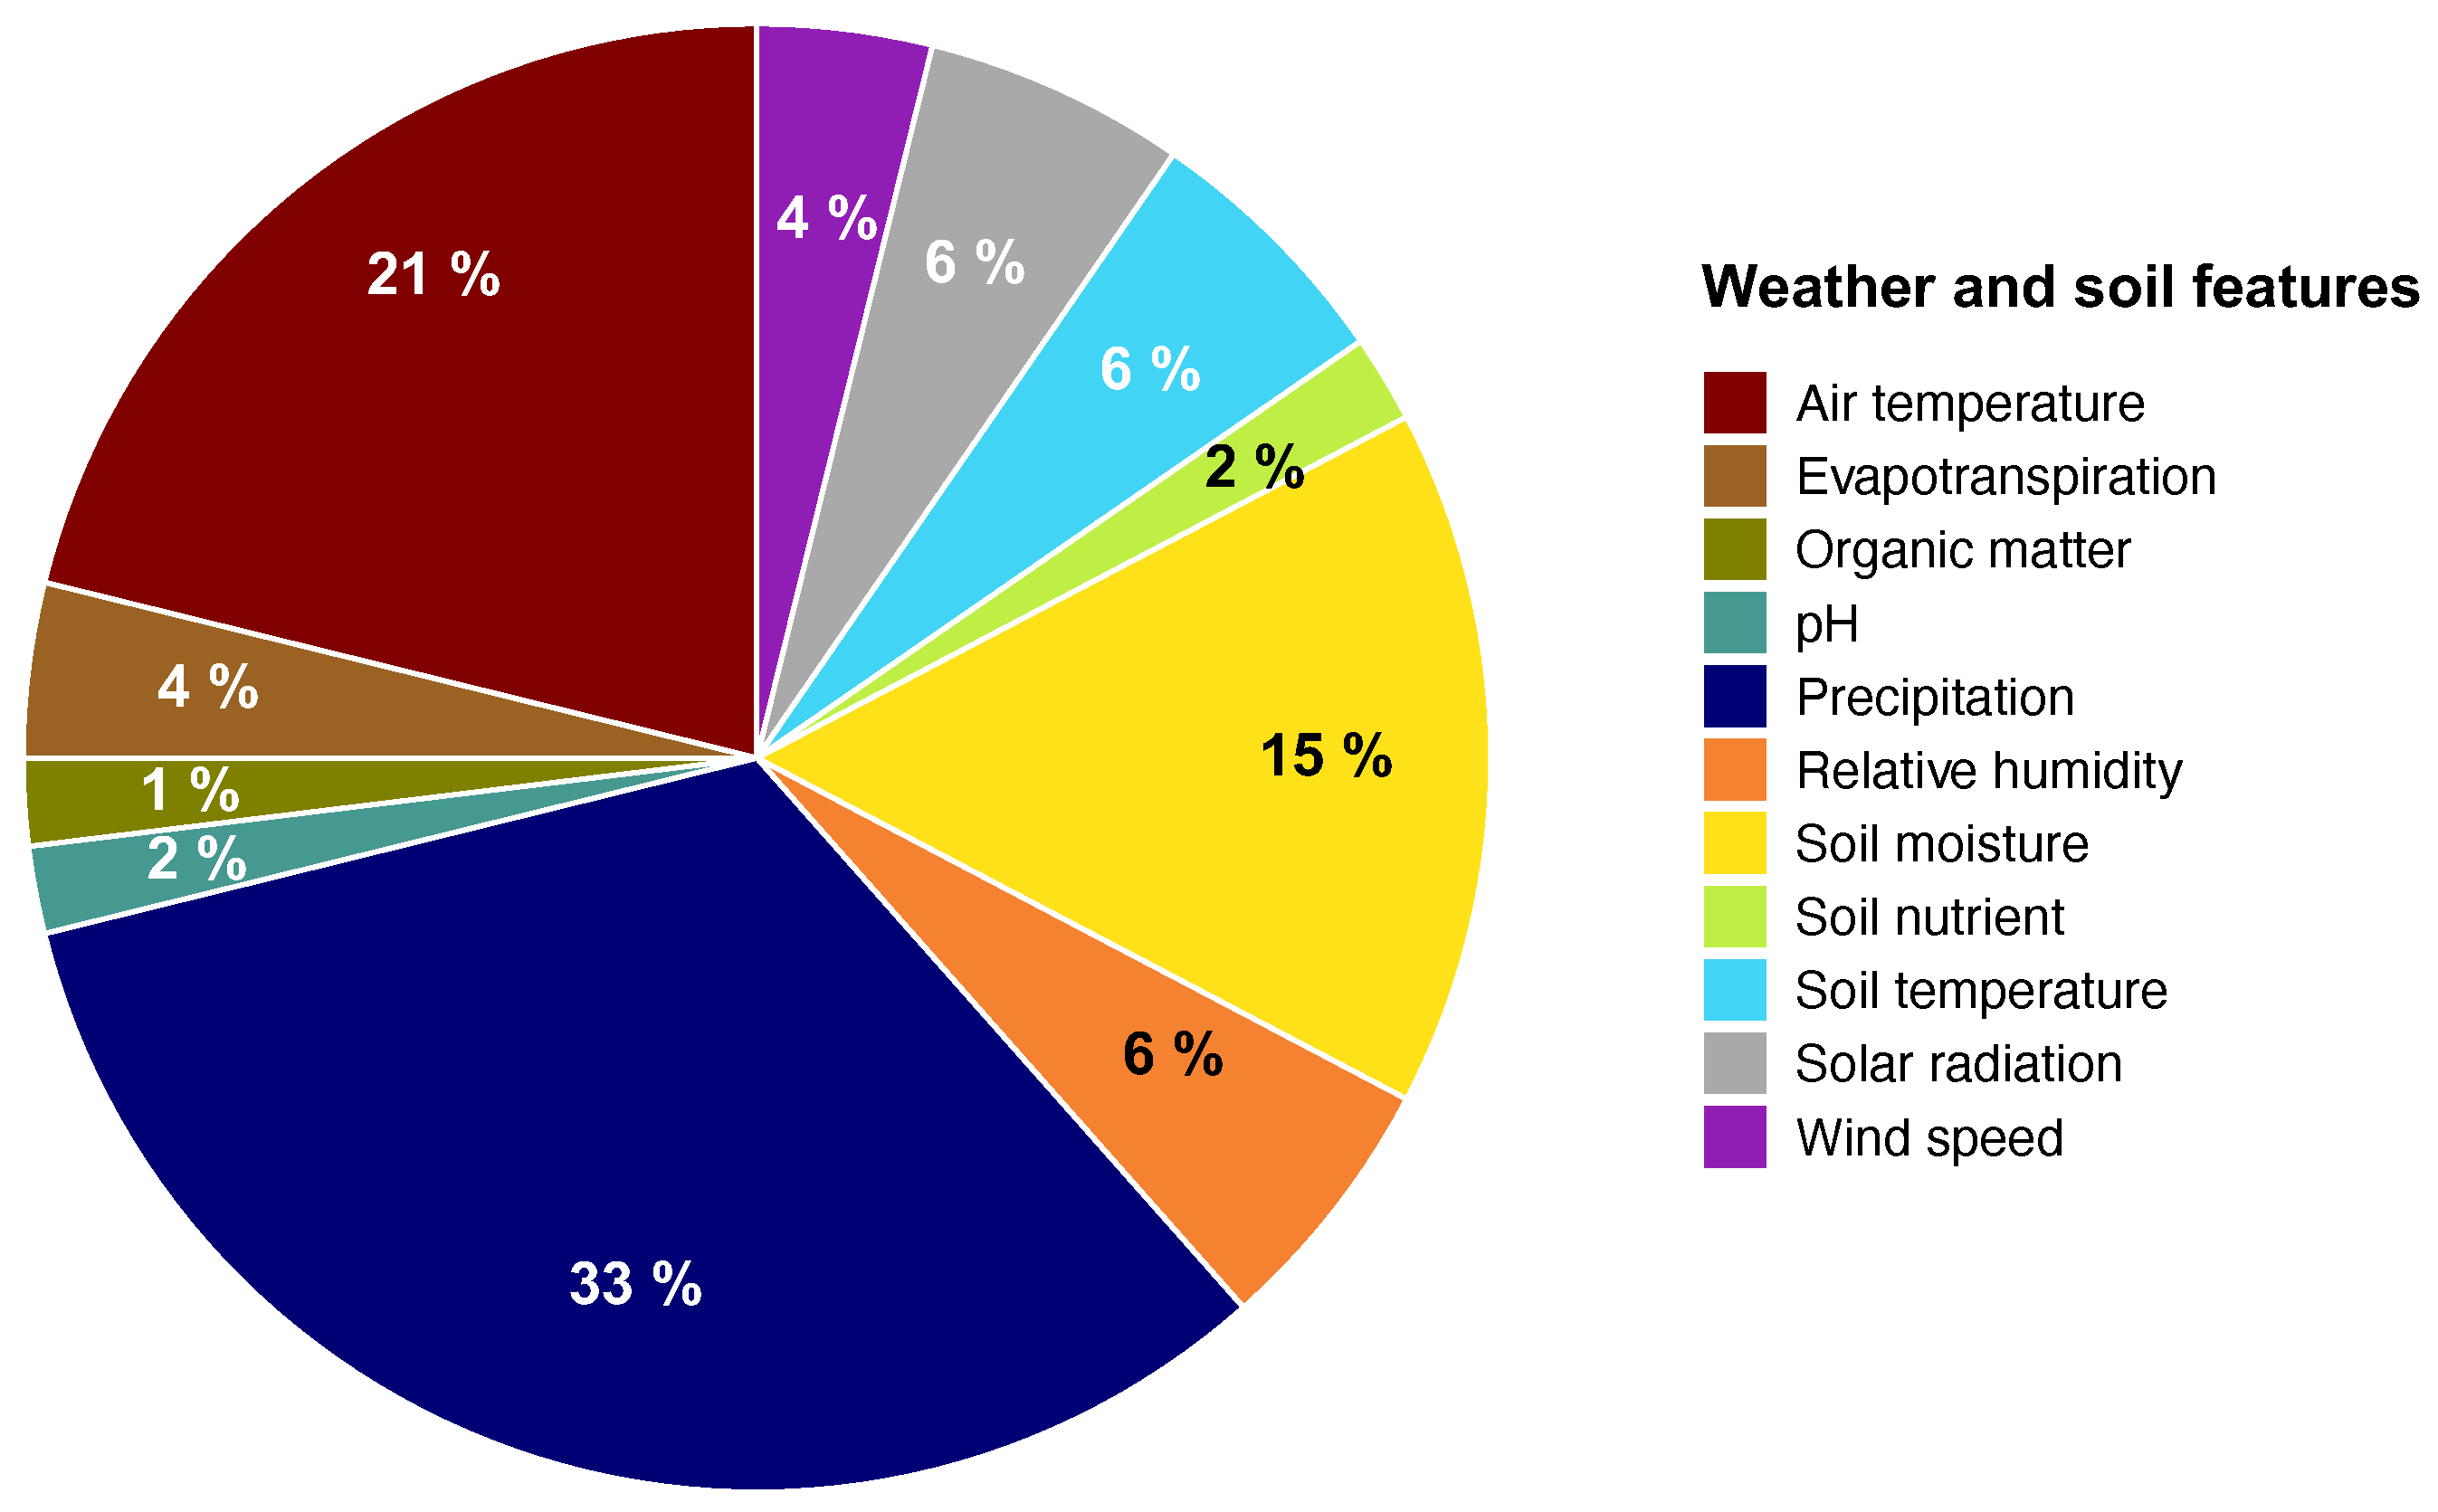
3.1.2. Weather and Soil Features
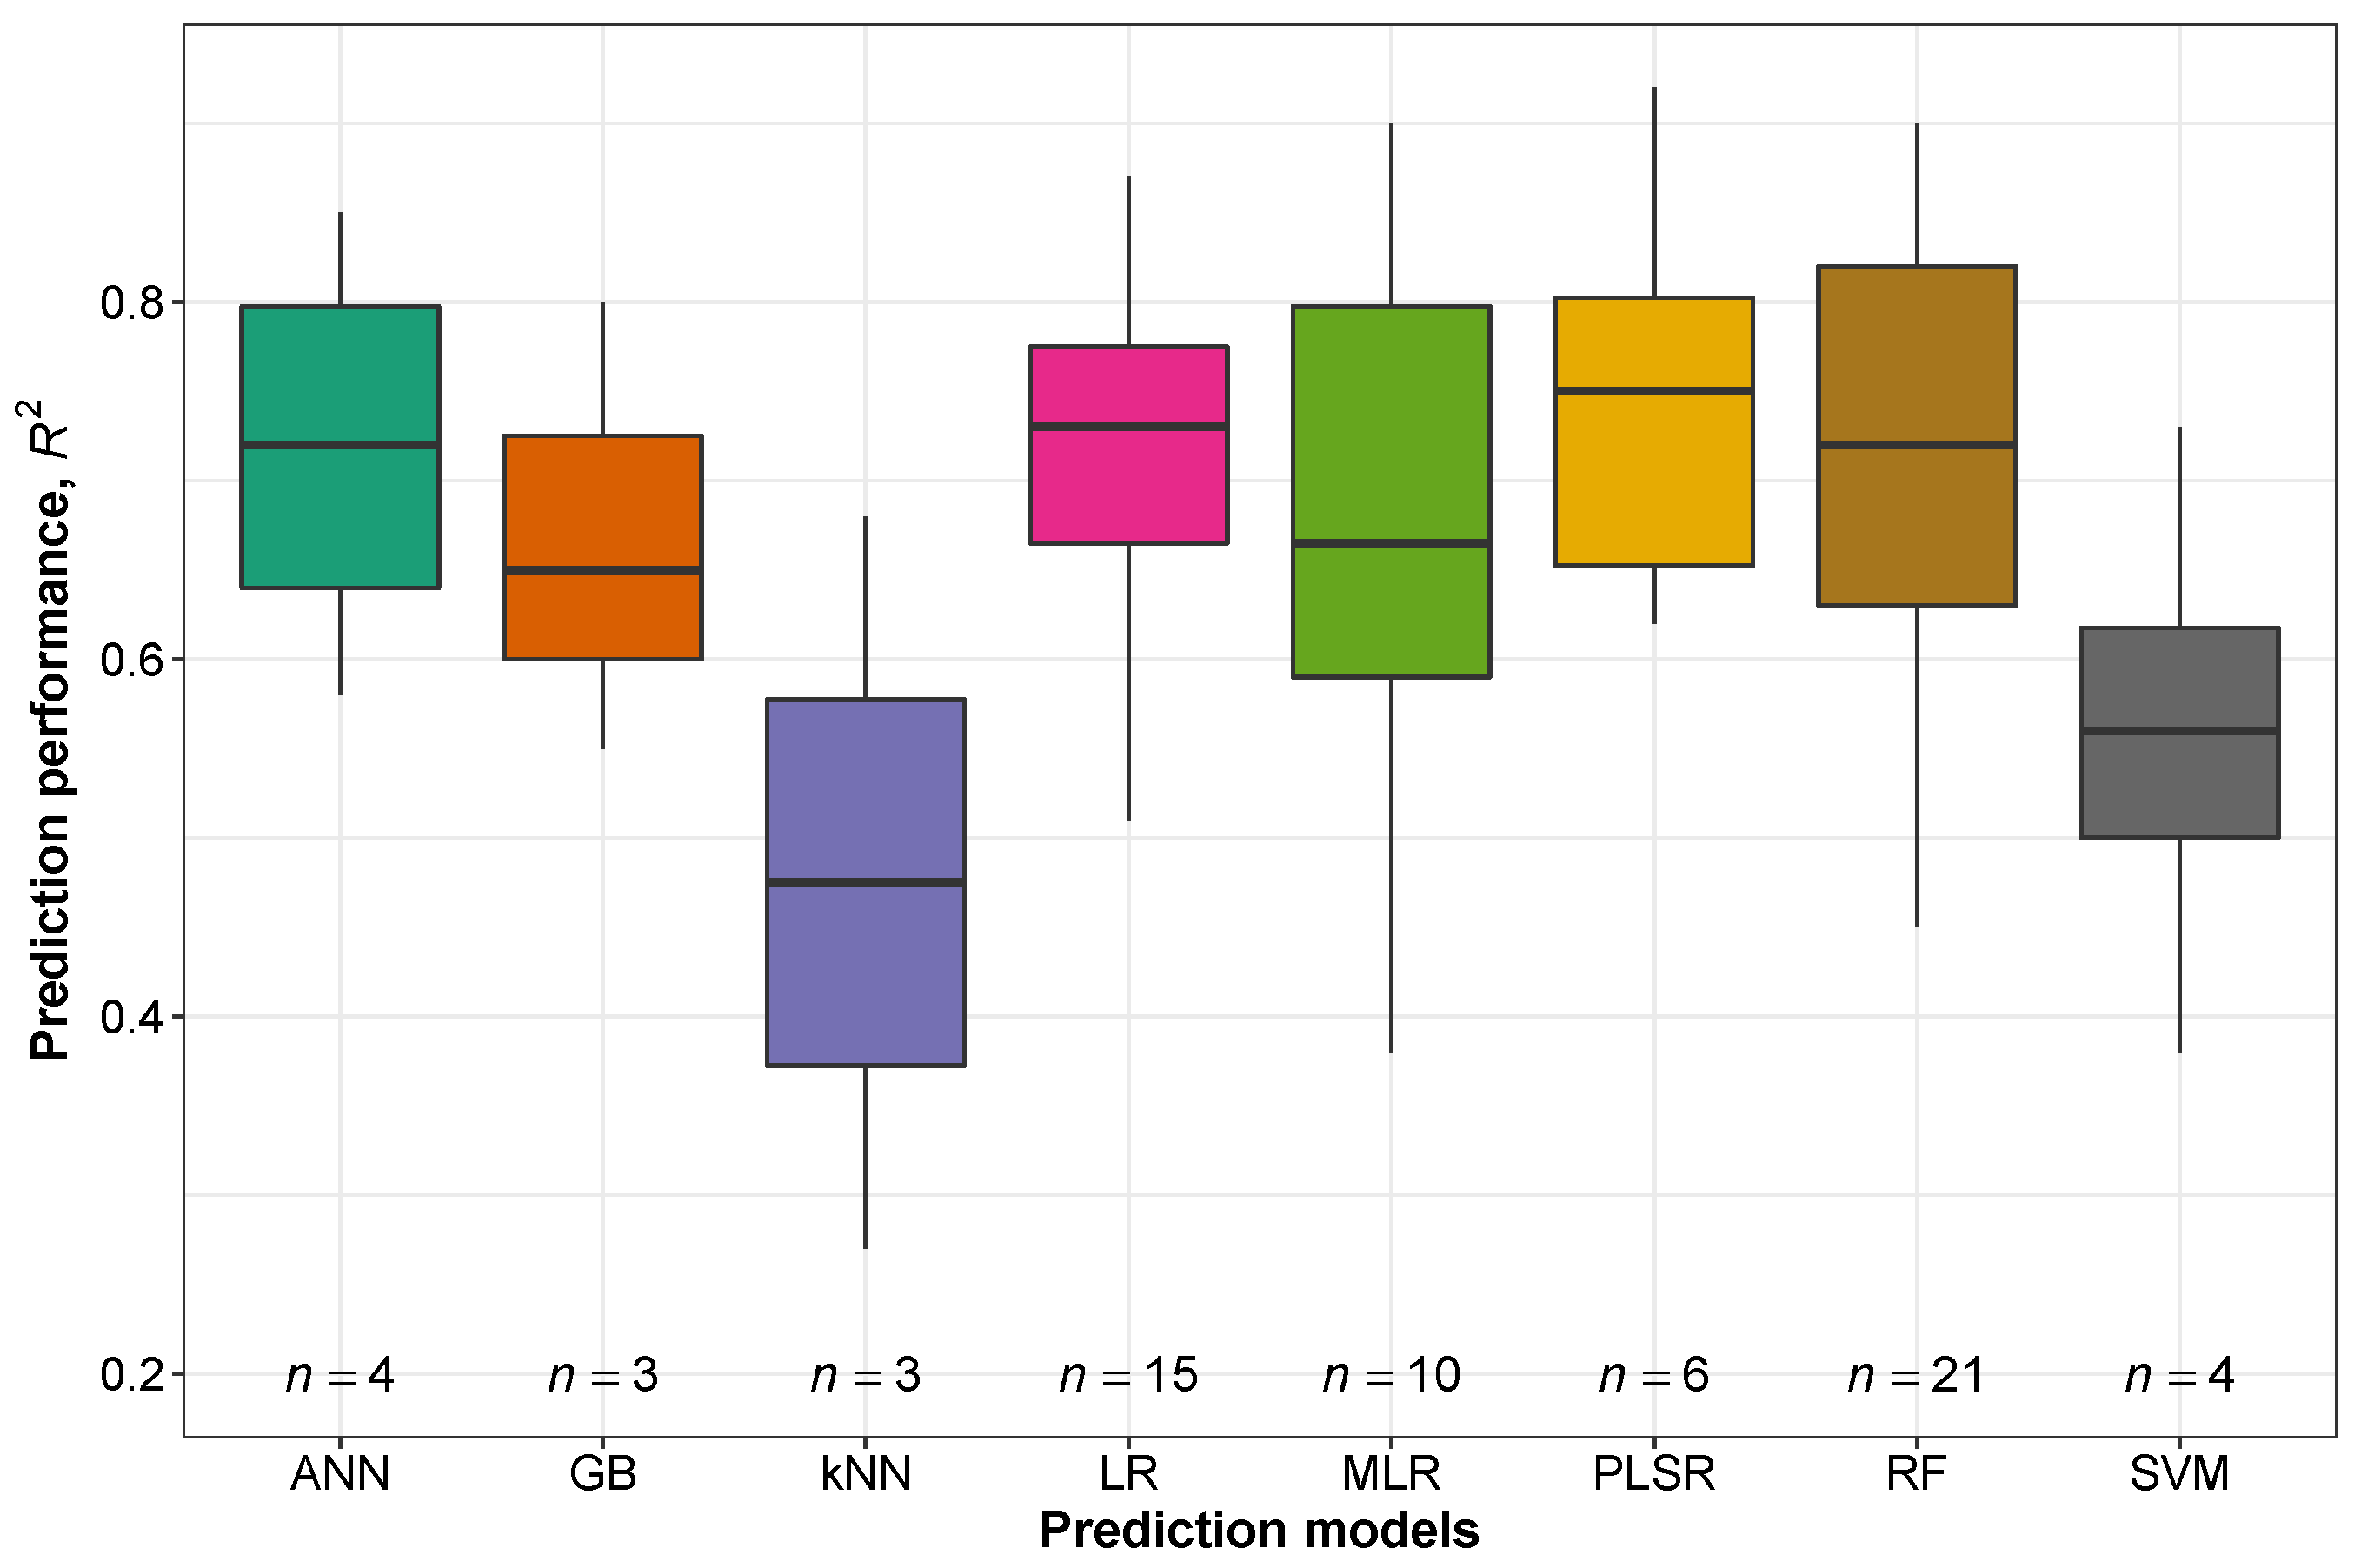
3.2. Overview of Forage/Grass Prediction Models
3.3. Existing Tools for Grass/Forage Prediction
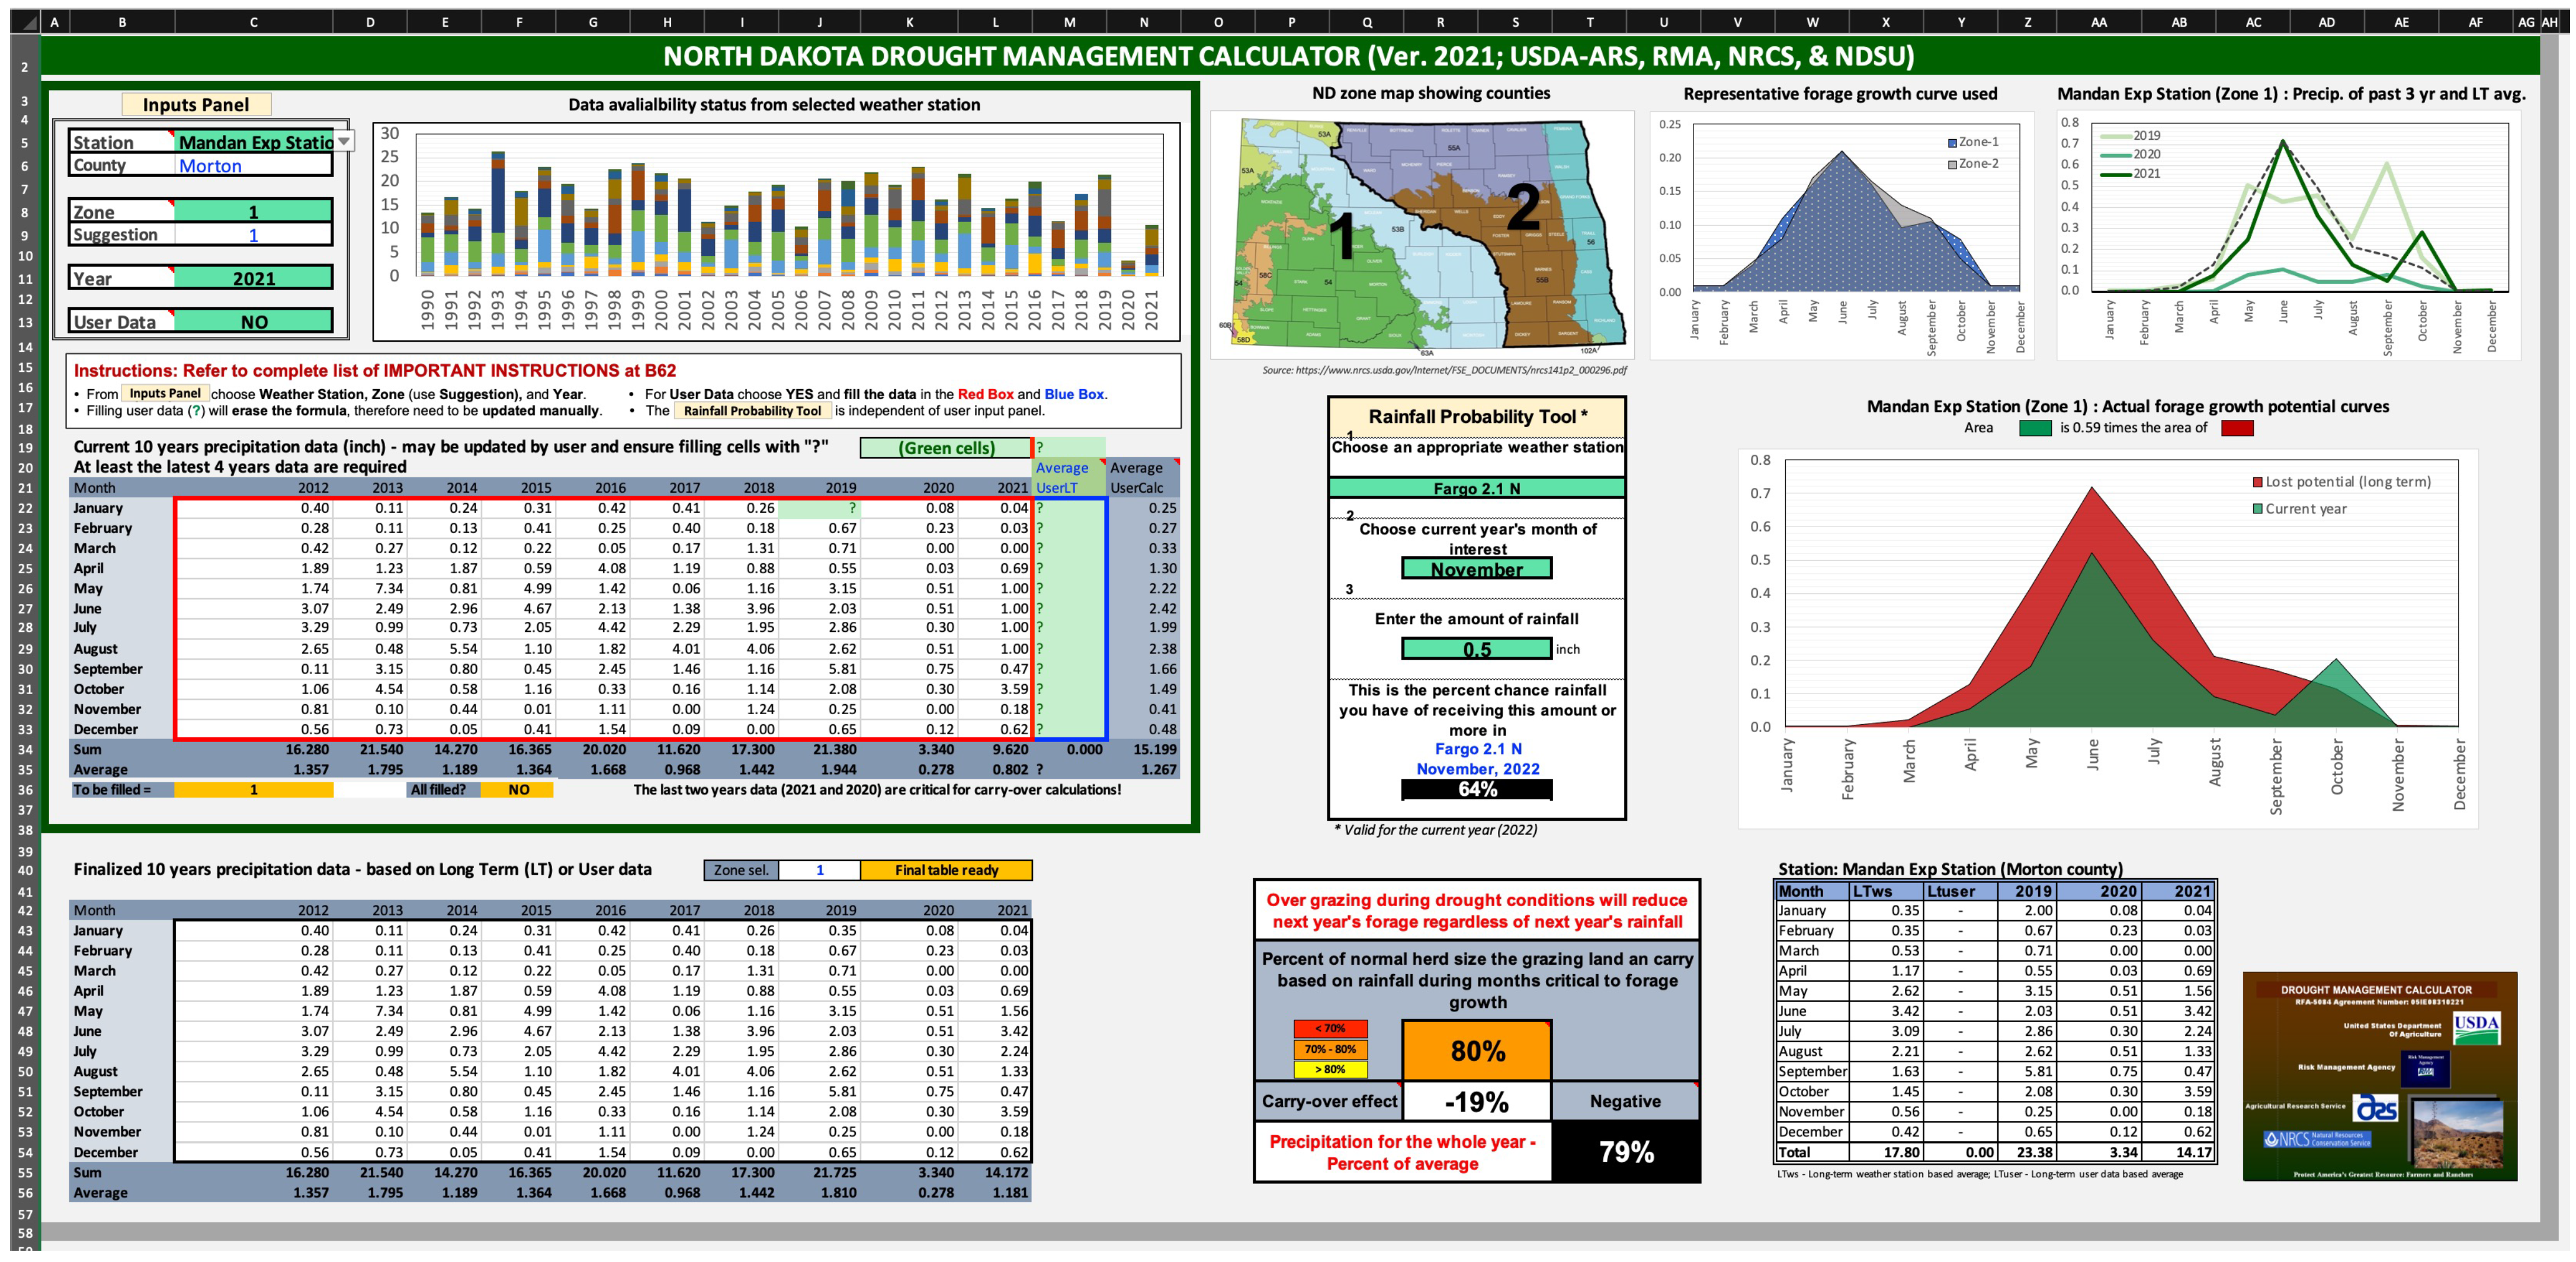
3.3.1. North Dakota Drought Calculator
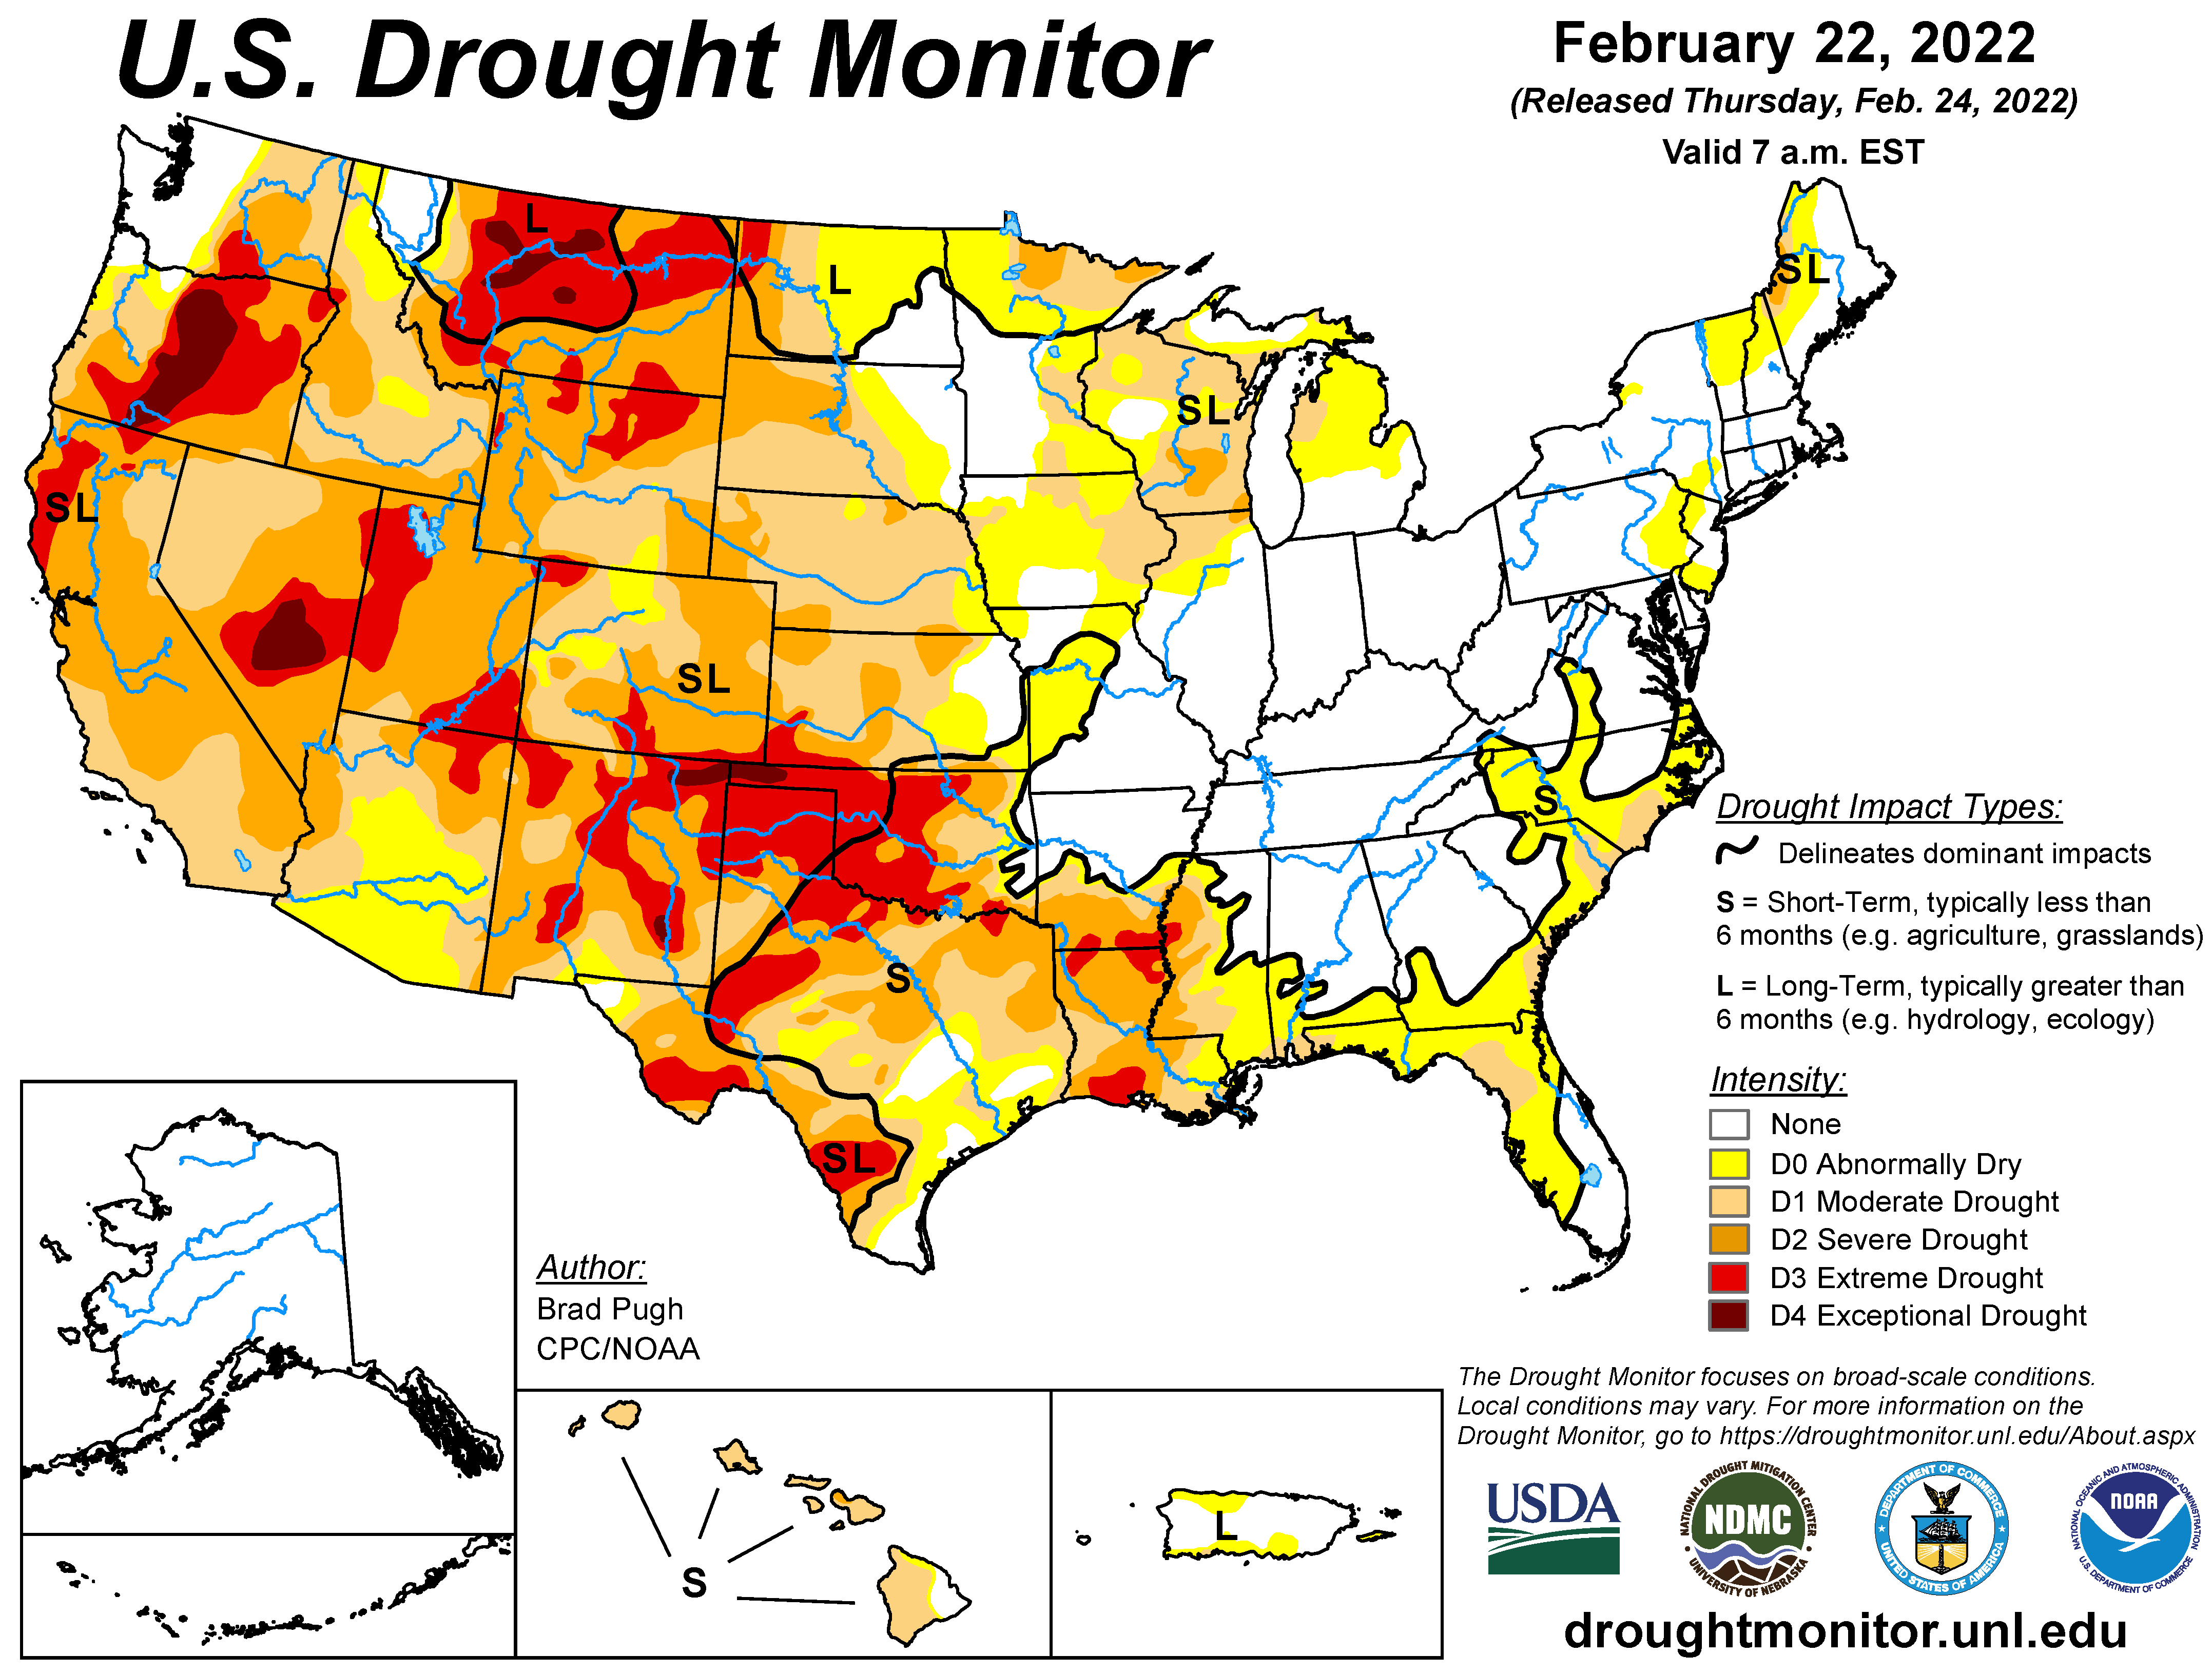
3.3.2. US Drought Monitor
3.3.3. Grass-Cast
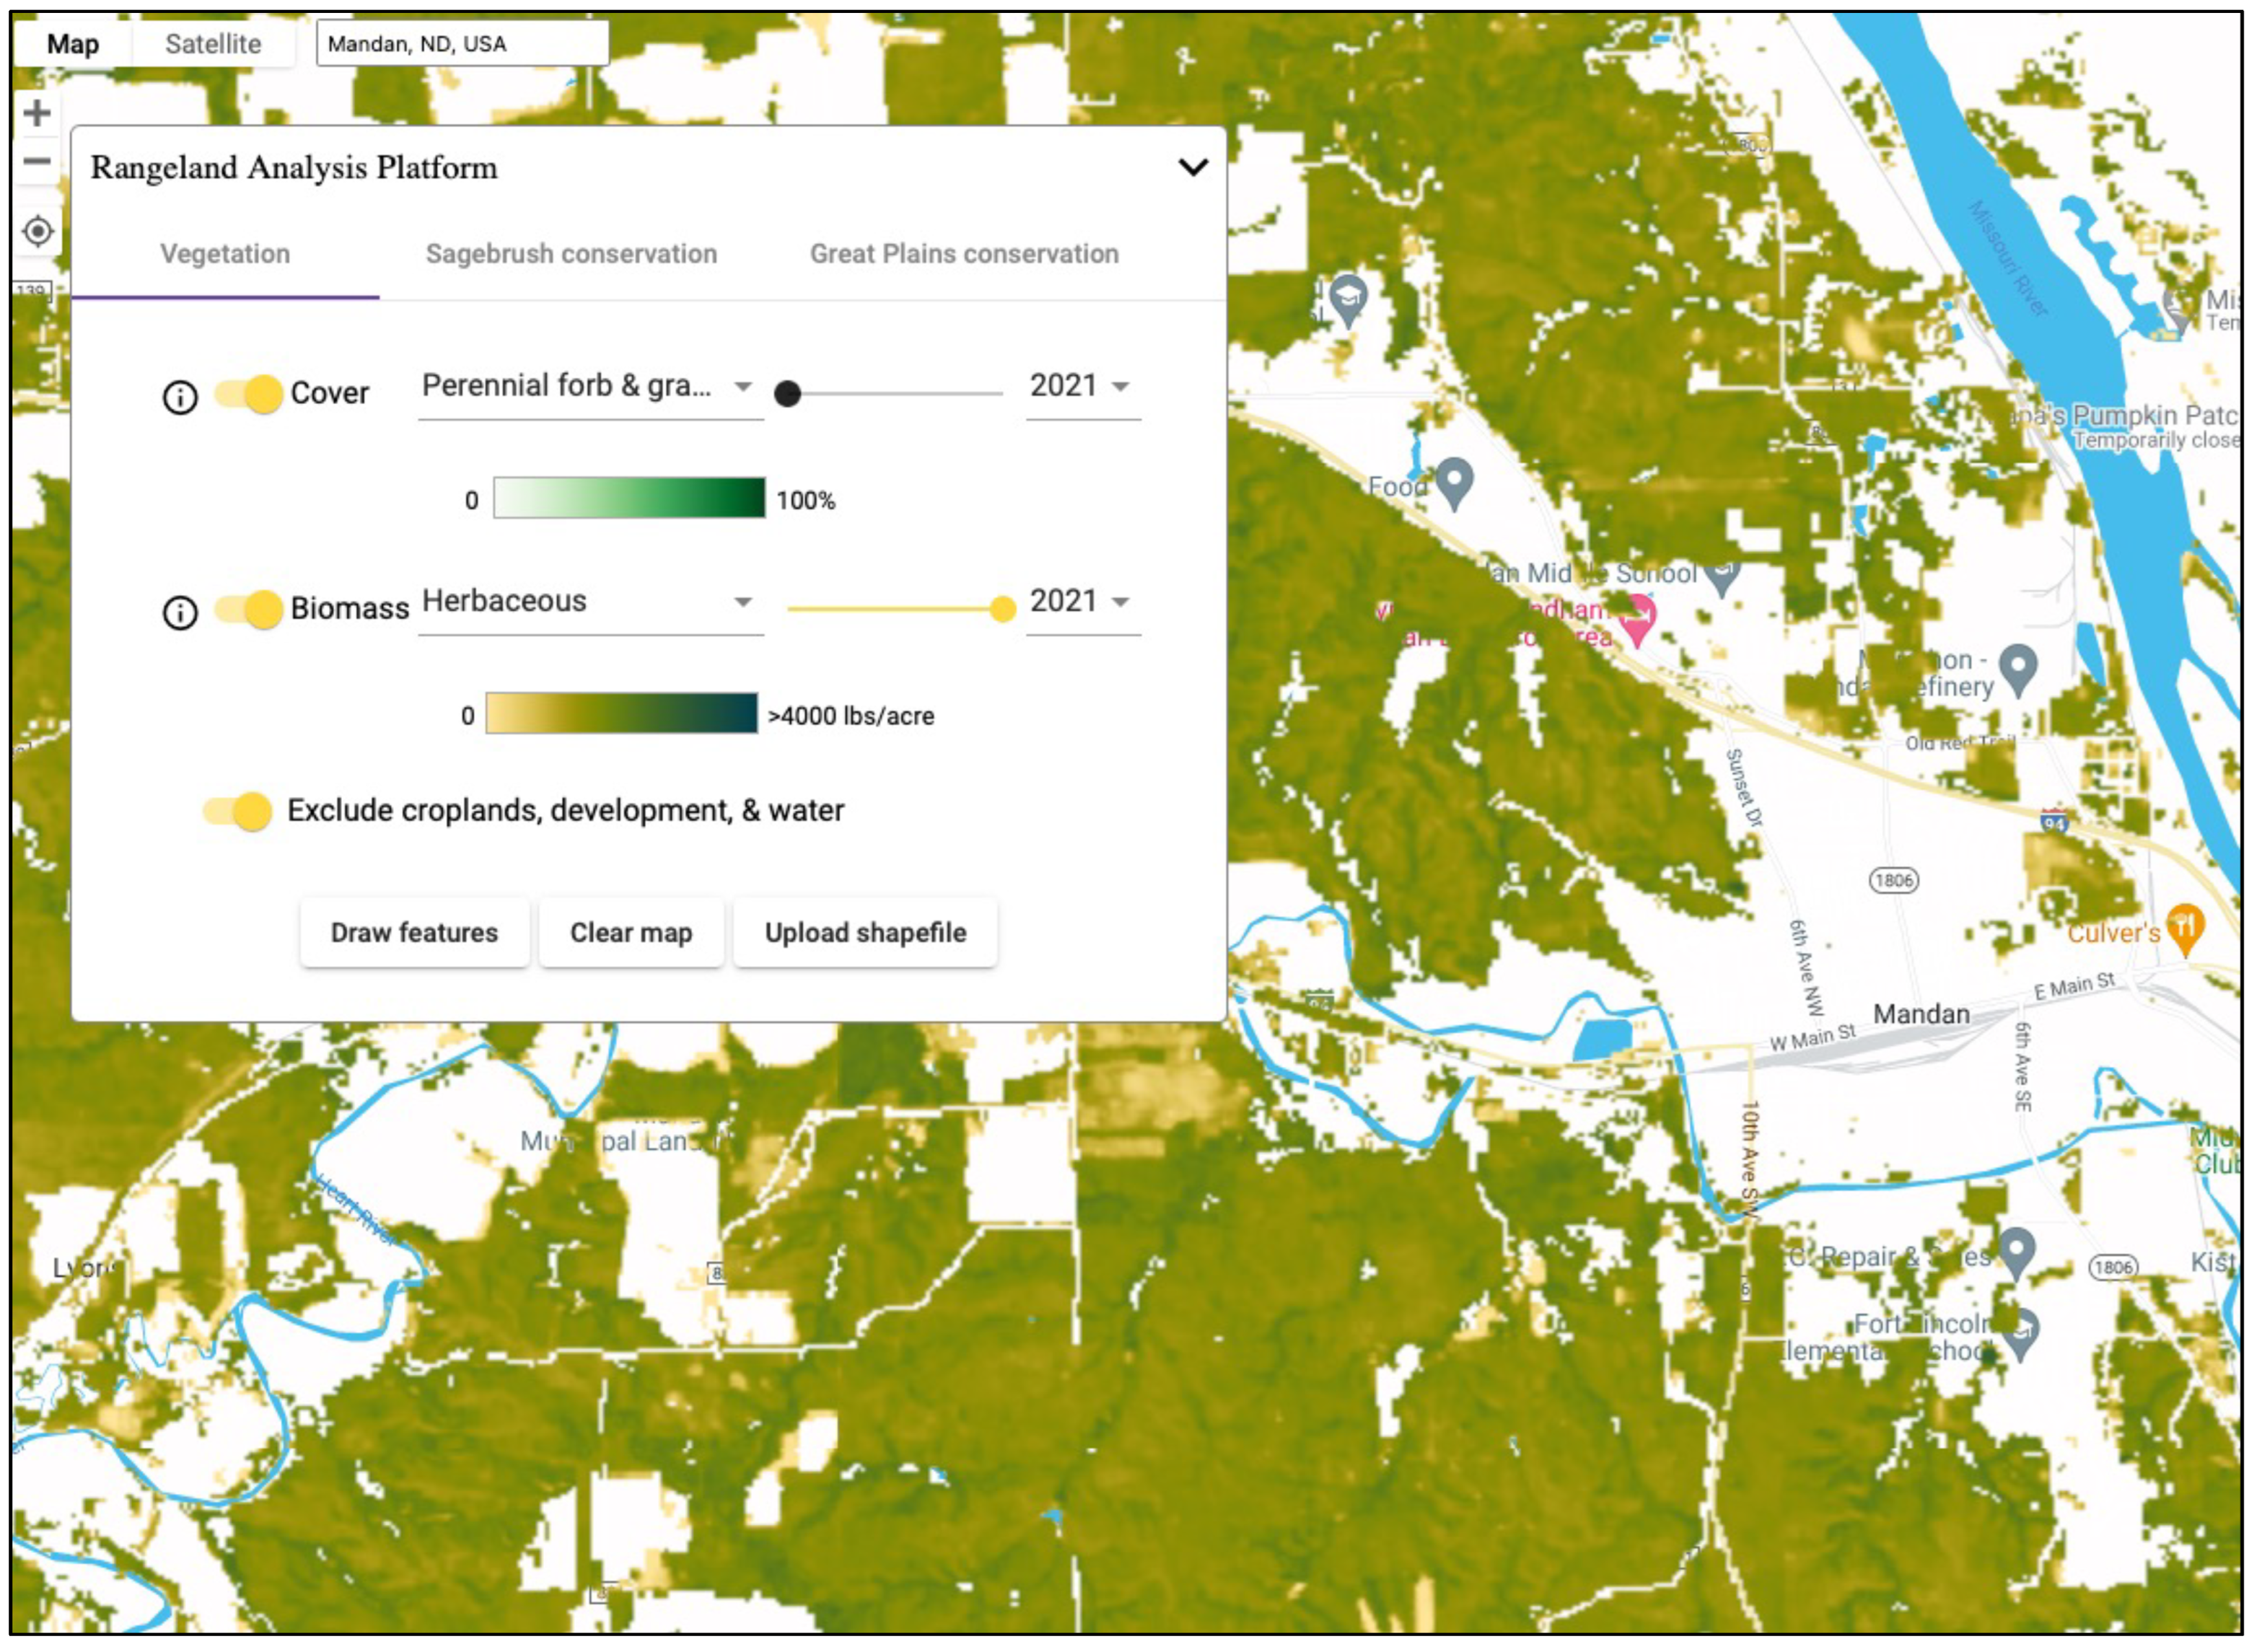
3.3.4. Rangeland Analysis Platform
3.4. Tools Available for Forage Economic Analysis
3.4.1. Alfalfa Cost Calculator
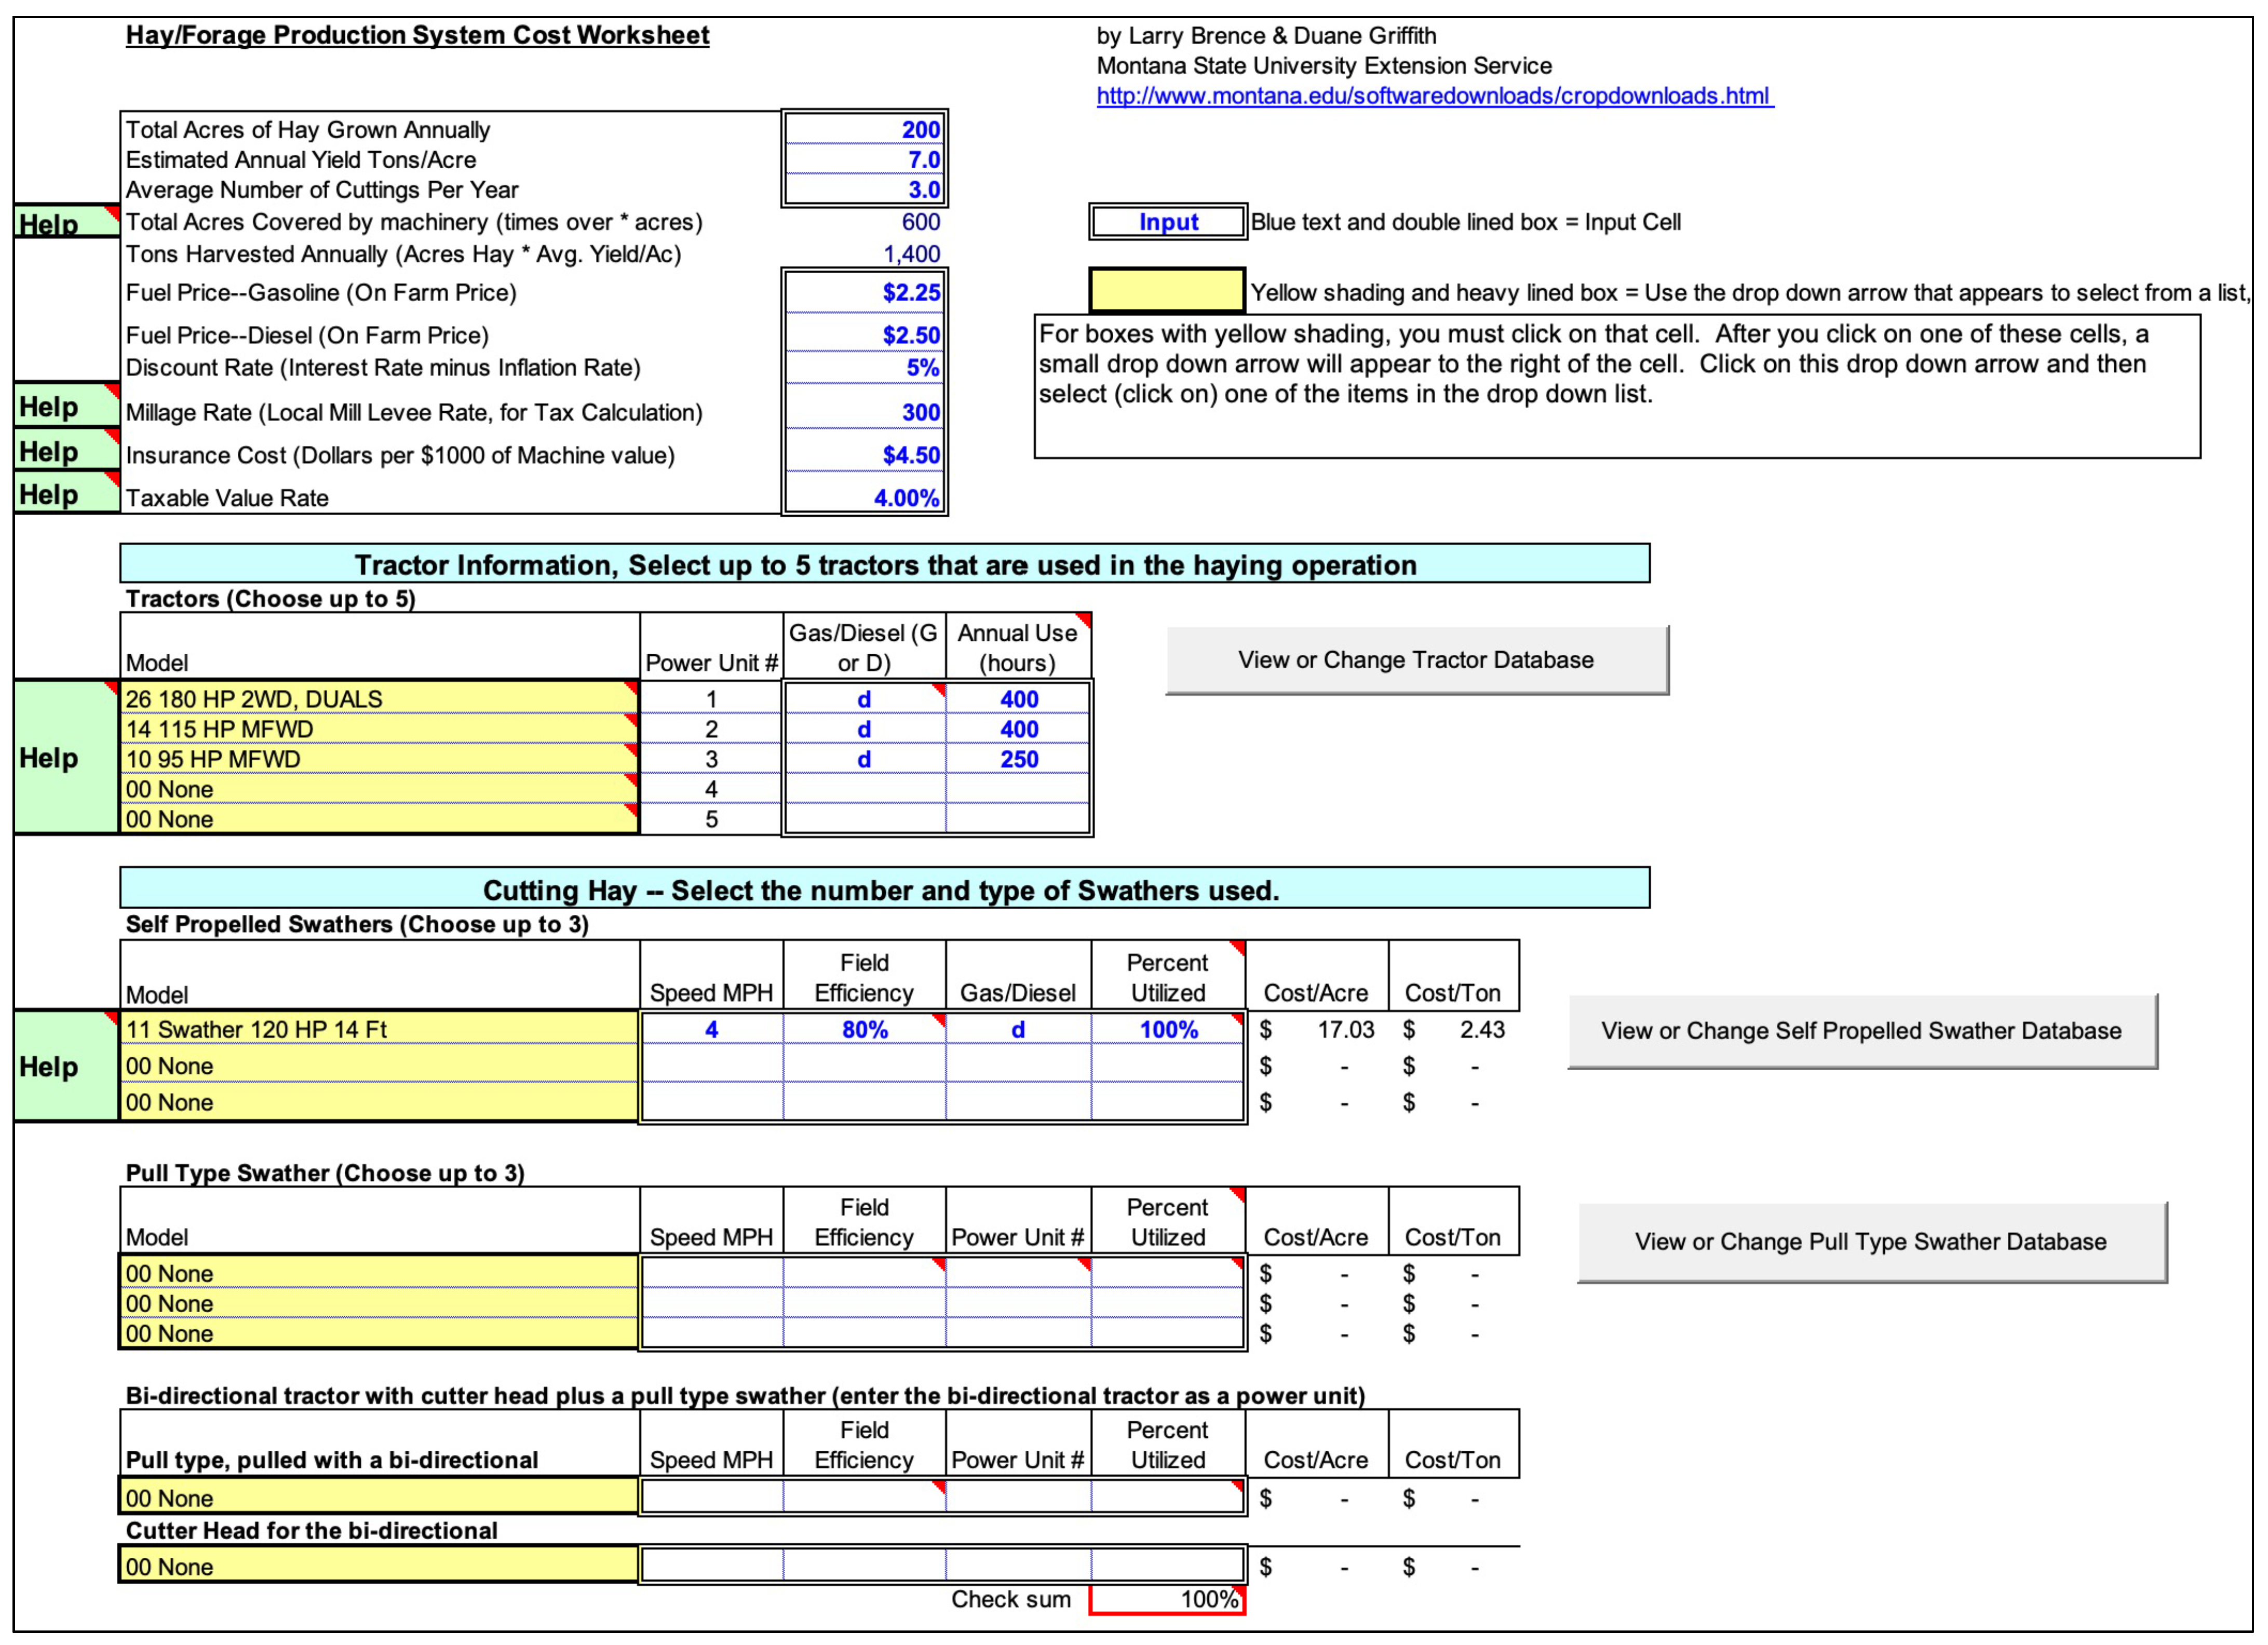
3.4.2. Haying System Enterprise Budgeting
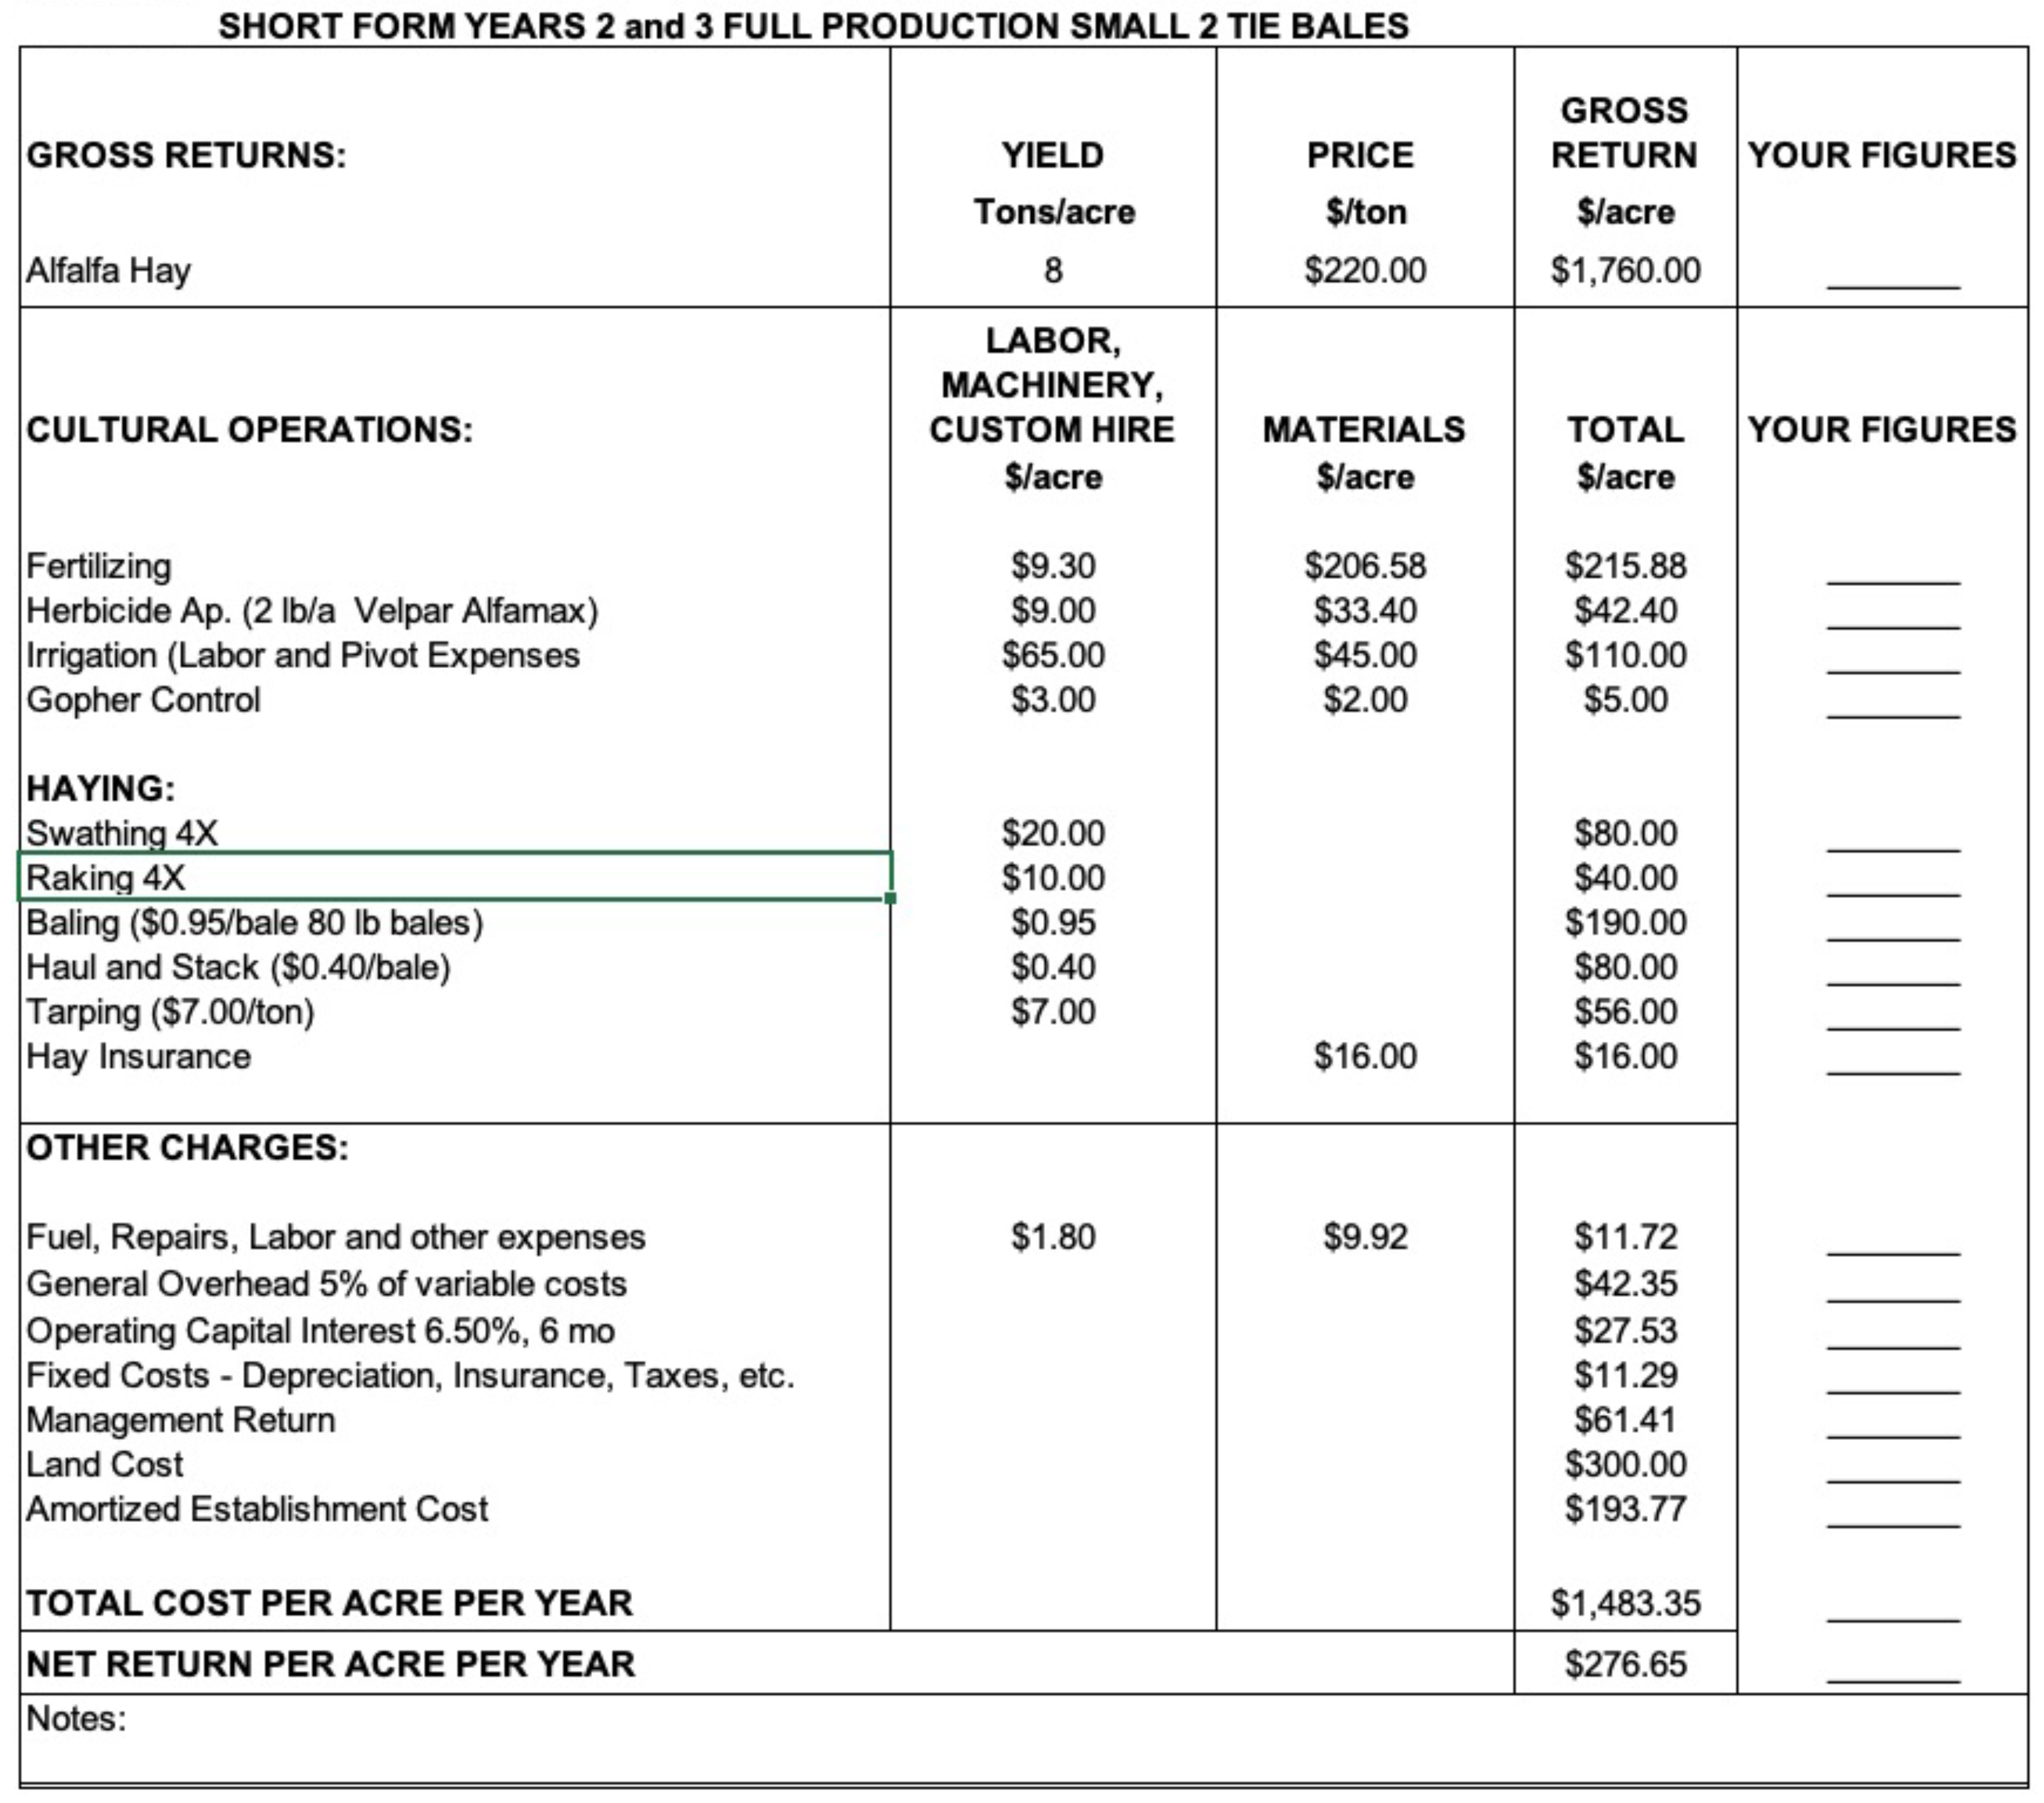
3.4.3. Enterprise Budgeting for Producing Irrigated Alfalfa
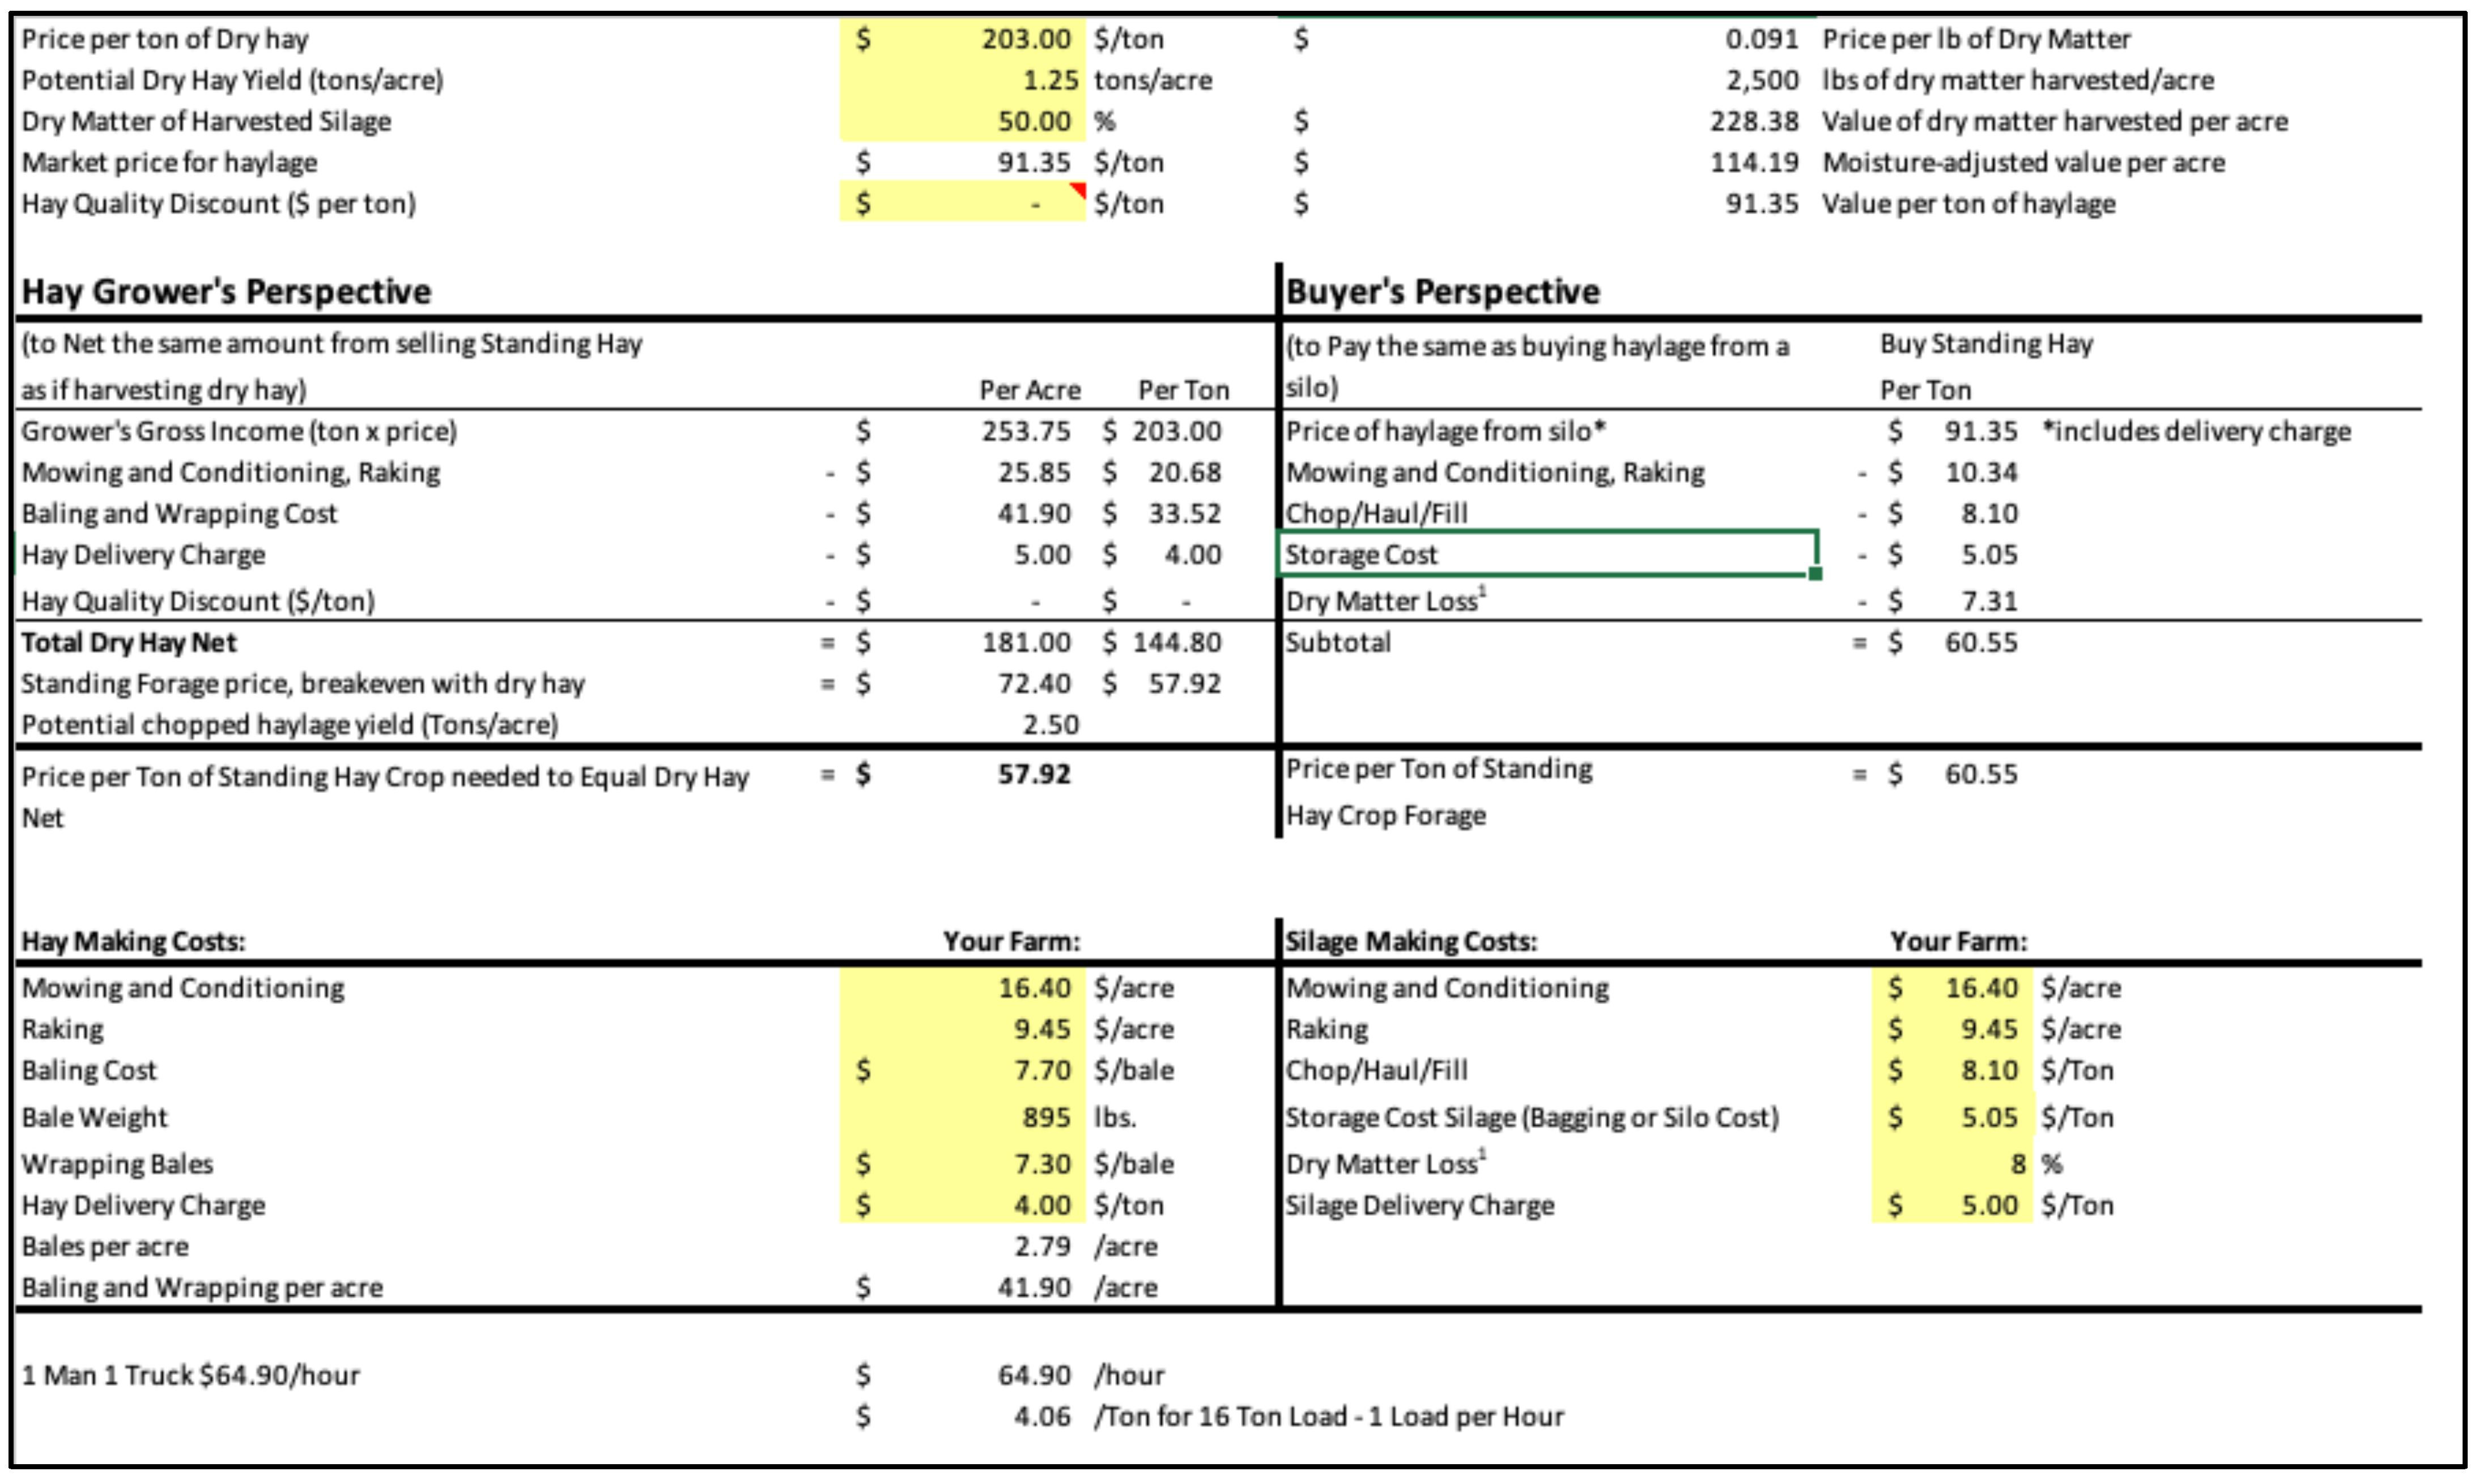
3.4.4. Price of Standing Hay Crop Forage
3.4.5. Decision Support Tool for Hay Production vs. Hay Cost
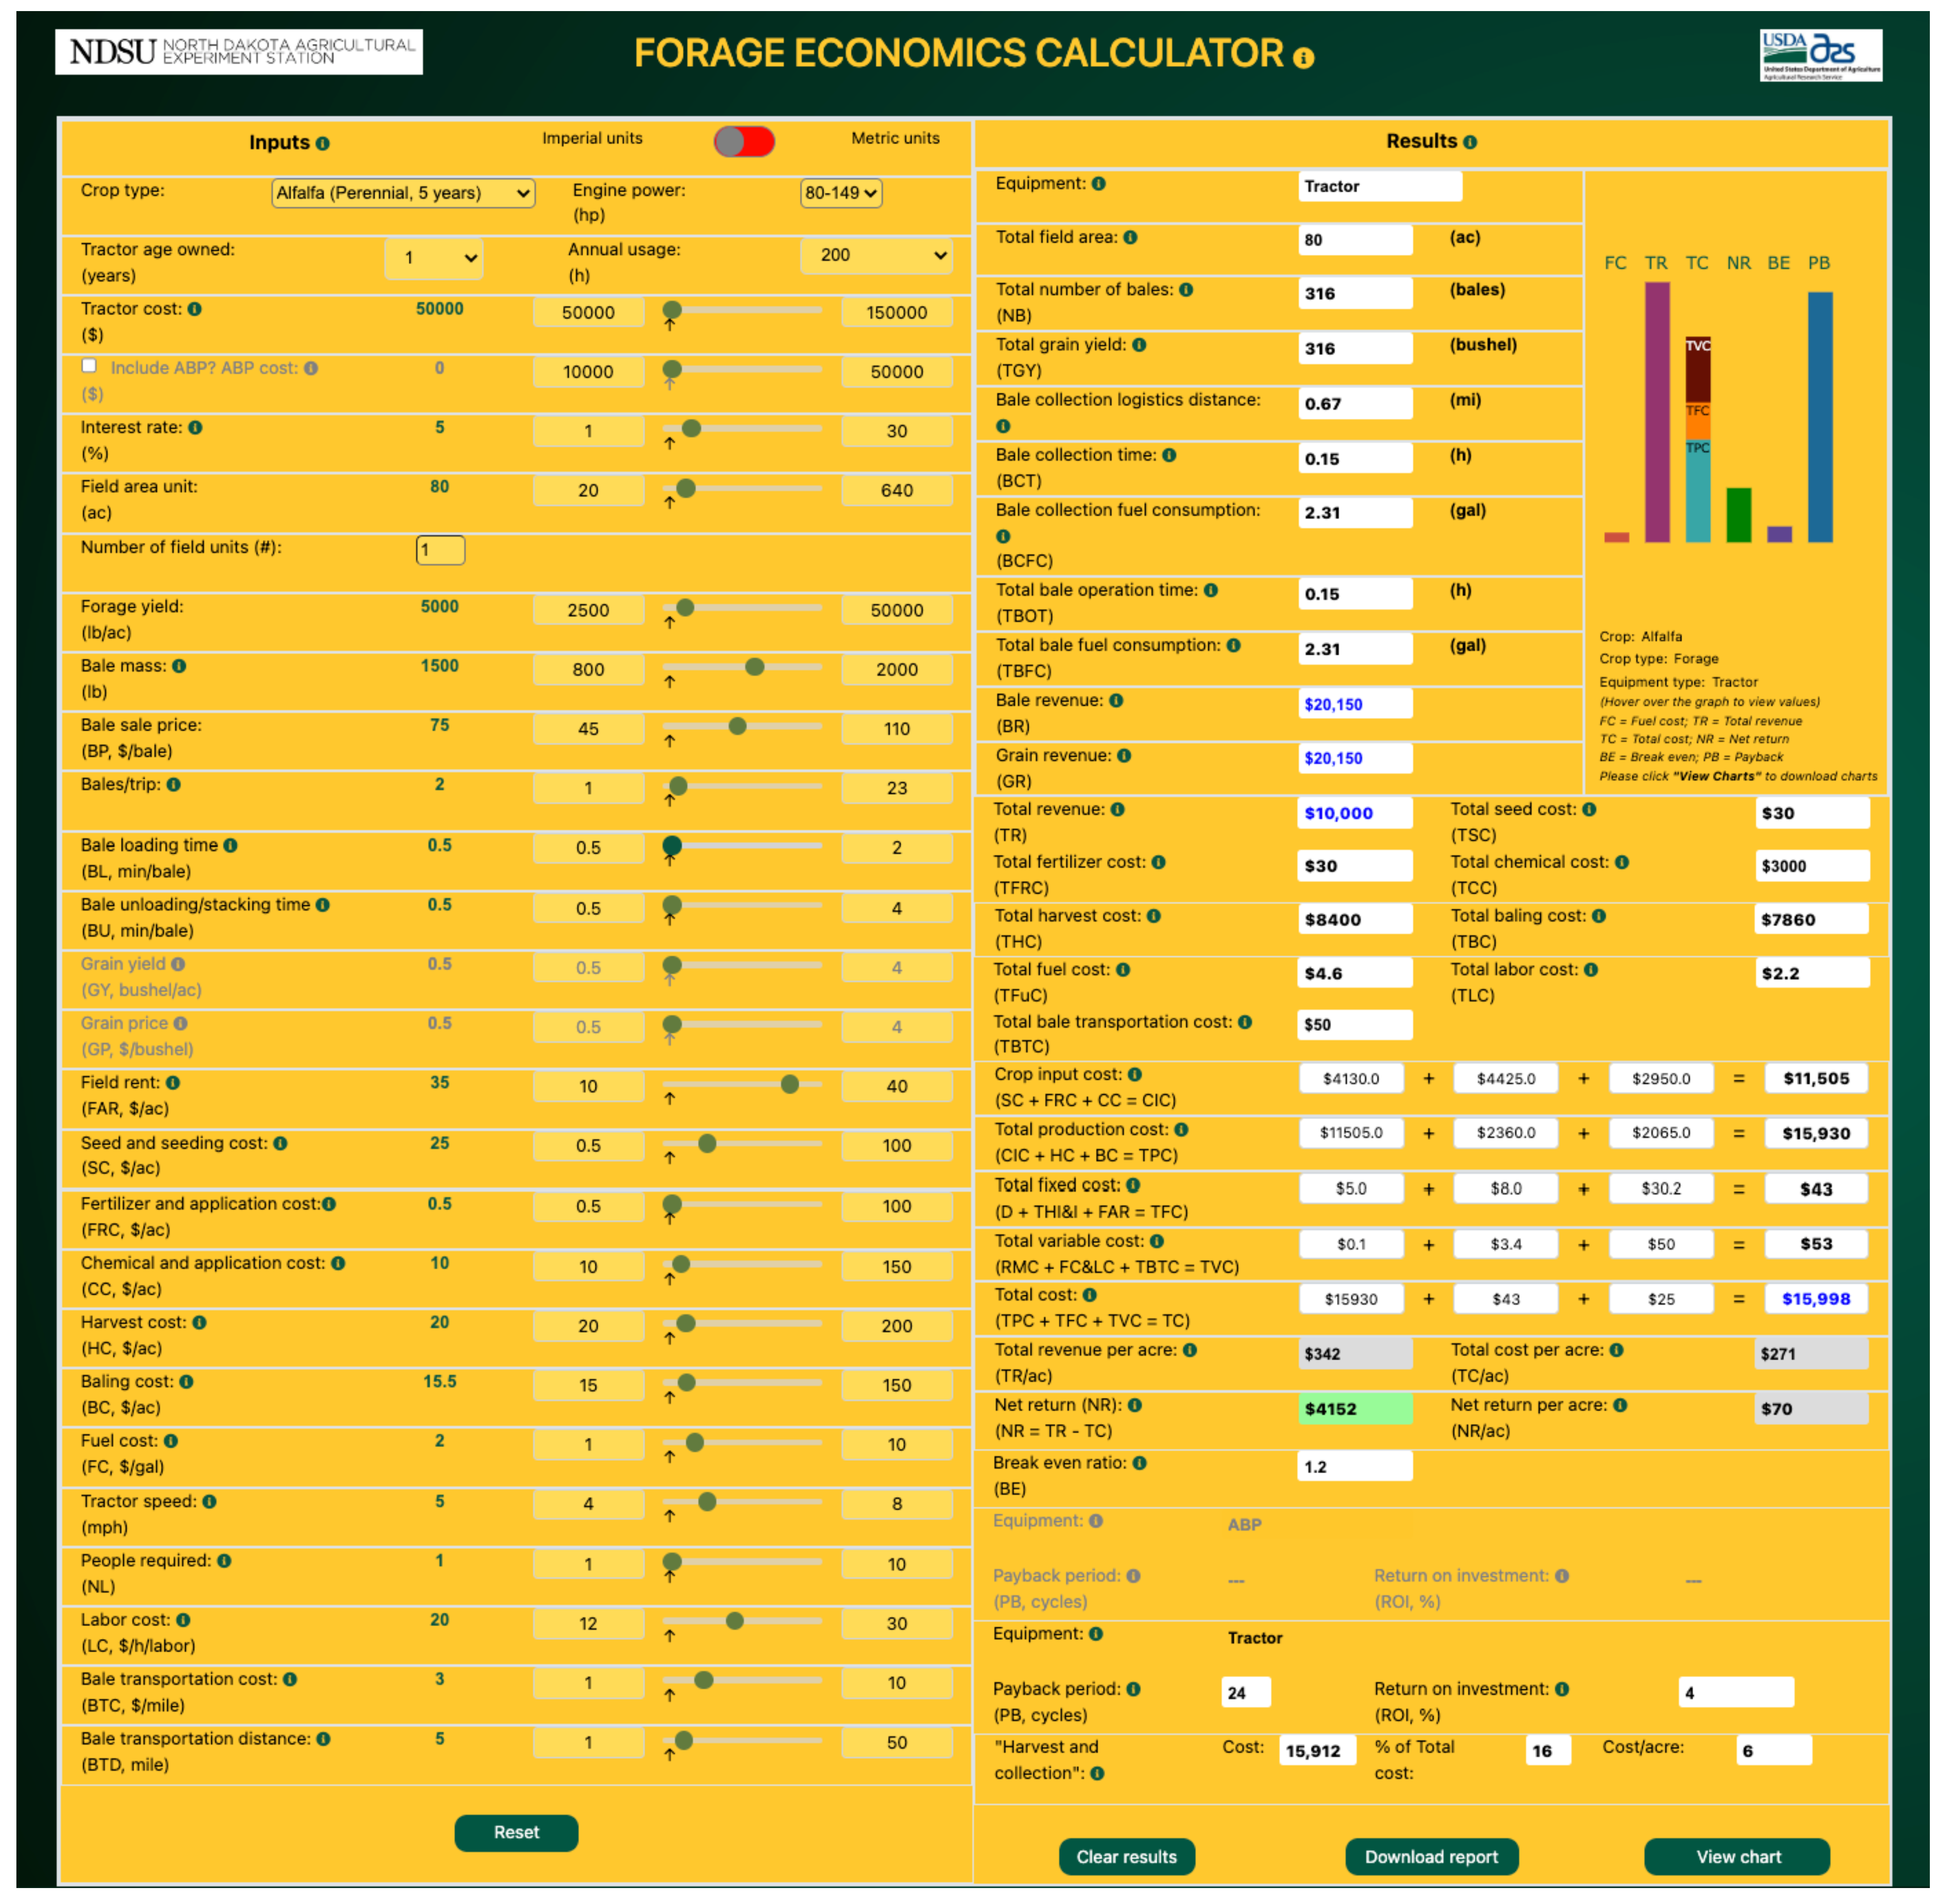
3.4.6. Forage Economics Calculator
4. Discussion
4.1. Important Features Predicting Grass/Forage Yield
4.1.1. Vegetation Indices
4.1.2. Weather and Soil Features
4.2. Overview of Forage/Grass Prediction Models
4.3. Existing Tools for Grass/Forage Prediction
4.3.1. North Dakota Drought Calculator
4.3.2. US Drought Monitor
4.3.3. Grass-Cast
4.3.4. Rangeland Analysis Platform
4.4. Tools Available for Forage Economic Analysis
4.5. Research Gaps and Future Research Recommendations
5. Conclusions
Author Contributions
Funding
Institutional Review Board Statement
Data Availability Statement
Acknowledgments
Conflicts of Interest
Appendix A. Selected Publications from Literature Review

| S.No. | Database | Year | Title | Citations | Reference |
|---|---|---|---|---|---|
| 1 | Sci-Dir | 2022 | A non-destructive method for rapid acquisition of grassland aboveground biomass for satellite ground verification using UAV RGB images | * | Zhang et al. [57] |
| 2 | Sci-Dir | 2022 | Classification of Zambian grasslands using random forest feature importance selection during the optimal phenological period | 1 | Zhao et al. [58] |
| 3 | Sci-Dir | 2022 | Estimating pasture quality of Mediterranean grasslands using hyperspectral narrow bands from field spectroscopy by Random Forest and PLS regressions | * | Fernández-Habas et al. [59] |
| 4 | Sci-Dir | 2022 | Monitoring standing herbaceous biomass and thresholds in semiarid rangelands from harmonized Landsat 8 and Sentinel-2 imagery to support within-season adaptive management | * | Kearney et al. [60] |
| 5 | Sci-Dir | 2022 | Monitoring the available forage using Sentinel 2-derived NDVI data for sustainable rangeland management | * | Ileri and Koç [61] |
| 6 | Goo-Sch | 2021 | A machine learning method for predicting vegetation indices in China | 3 | Li et al. [62] |
| 7 | Sci-Dir | 2021 | A novel UAV-based approach for biomass prediction and grassland structure assessment in coastal meadow | 7 | Pecina et al. [63] |
| 8 | Goo-Sch | 2021 | A practical satellite-derived vegetation drought index for arid and semi-arid grassland drought monitoring | 5 | Chang et al. [64] |
| 9 | Goo-Sch | 2021 | Applicability of different vegetation indices for pasture biomass estimation in the north-central region of Mongolia | * | Bayaraa et al. [65] |
| 10 | Sci-Dir | 2021 | Changes and controls of aboveground net primary production in response to grassland policy in Inner Mongolian grasslands of China | * | Zheng et al. [66] |
| 11 | Sci-Dir | 2021 | Comparing vegetation indices from Sentinel-2 and Landsat 8 under different vegetation gradients based on a controlled grazing experiment | * | Qin et al. [31] |
| 12 | Goo-Sch | 2021 | Enhanced drought detection and monitoring using sun-induced chlorophyll fluorescence over Hulun Buir Grassland, China | 4 | Liu et al. [11] |
| 13 | Goo-Sch | 2021 | Estimating pasture biomass using Sentinel-2 imagery and machine learning | 9 | Chen et al. [67] |
| 14 | Goo-Sch | 2021 | Estimation of rangeland production in the arid oriental region (Morocco) combining remote sensing vegetation and rainfall Indices: Challenges and lessons learned | 2 | Lang et al. [68] |
| 15 | Goo-Sch | 2021 | Grassland productivity estimates informed by Soil moisture measurements: Statistical and mechanistic approaches | 2 | Krueger et al. [12] |
| 16 | Goo-Sch | 2021 | Improving the estimation of alpine grassland fractional vegetation cover using optimized algorithms and multi-dimensional features | * | Lin et al. [69] |
| 17 | Goo-Sch | 2021 | Monitoring rainfed alfalfa growth in semiarid agrosystems using Sentinel-2 imagery | * | Echeverría et al. [70] |
| 18 | Web-Sci | 2021 | National mapping of New Zealand pasture productivity using temporal Sentinel-2 data | 4 | Amies et al. [71] |
| 19 | Goo-Sch | 2021 | Precipitation rather than evapotranspiration determines the warm-season water supply in an alpine shrub and an alpine meadow | 5 | Li et al. [72] |
| 20 | Sci-Dir | 2021 | Remote sensing inversion of grassland aboveground biomass based on high accuracy surface modeling | 5 | Zhou et al. [73] |
| 21 | Goo-Sch | 2021 | Remote sensing of aboveground grass biomass between protected and non–protected areas in savannah rangelands | * | Dube et al. [74] |
| 22 | Web-Sci | 2021 | Remote-sensing inversion method for aboveground biomass of typical steppe in inner Mongolia, China | 4 | Lyu et al. [75] |
| 23 | Sci-Dir | 2021 | The superiority of the normalized difference phenology index (NDPI) for estimating grassland aboveground fresh biomass | 3 | Xu et al. [76] |
| 24 | Goo-Sch | 2021 | Cool-season grass productivity estimation model evaluating the effects of global warming and climate adaptation strategies | 1 | Tarumi et al. [77] |
| 25 | Web-Sci | 2021 | A new method for grassland degradation monitoring by vegetation species composition using hyperspectral remote sensing | 12 | Lyu et al. [78] |
| 26 | Goo-Sch | 2020 | Estimating grassland parameters from Sentinel-2: A model comparison study | 6 | Schwieder et al. [79] |
| 27 | Sci-Dir | 2020 | Effects of climate change on the growing season of alpine grassland in Northern Tibet, China | 5 | Zhang et al. [36] |
| 28 | Goo-Sch | 2020 | Estimating plant pasture biomass and quality from UAV imaging across Queensland’s Rangelands | 10 | Barnetson et al. [80] |
| 29 | Goo-Sch | 2020 | Influence of climate variability on the potential forage production of a mown permanent grassland in the French Massif Central | 7 | Gómara et al. [81] |
| 30 | Goo-Sch | 2020 | Long-term grass biomass estimation of pastures from satellite data | 4 | Clementini et al. [82] |
| 31 | Goo-Sch | 2020 | Monitoring and modeling rangeland health with remote sensing | 1 | Soubry and Guo [83] |
| 32 | Goo-Sch | 2020 | Monitoring pasture aboveground biomass and canopy height in an integrated crop livestock system using textural information from PlanetScope imagery | 8 | Dos Reis et al. [10] |
| 33 | Goo-Sch | 2020 | Remote sensing applications for insurance: A predictive model for pasture yield in the presence of systemic weather | 6 | Brock Porth et al. [84] |
| 34 | Goo-Sch | 2020 | Spatial and temporal pasture biomass estimation integrating electronic plate meter, Planet CubeSats and Sentinel-2 satellite data | 9 | Gargiulo et al. [32] |
| 35 | Goo-Sch | 2020 | The fusion of spectral and structural datasets derived from an airborne multispectral sensor for estimation of pasture dry matter yield at paddock scale with time | 10 | Karunaratne et al. [85] |
| 36 | Goo-Sch | 2020 | Estimating natural grassland biomass by vegetation indices using Sentinel 2 remote sensing data | 34 | Guerini Filho et al. [86] |
| 37 | Goo-Sch | 2019 | A new approach to predict normalized difference vegetation index using time-delay neural network in the arid and semi-arid grassland | 8 | Wu et al. [87] |
| 38 | Sci-Dir | 2019 | Application of the MODIS MOD 17 net primary production product in grassland carrying capacity assessment | 24 | De Leeuw et al. [88] |
| 39 | Web-Sci | 2019 | Canopy height measurements and non?destructive biomass estimation of Lolium perenne swards using UAV imagery | 31 | Borra-Serrano et al. [89] |
| 40 | Goo-Sch | 2019 | Drought-induced decline of productivity in the dominant grassland species Lolium perenne L. depends on soil type and prevailing climatic conditions | 15 | Buttler et al. [90] |
| 41 | Goo-Sch | 2019 | Effect of irrigation management on pasture yield and nitrogen losses | 20 | Vogeler et al. [91] |
| 42 | Web-Sci | 2019 | Estimating grassland aboveground biomass on the Tibetan Plateau using a random forest algorithm | 21 | Zeng et al. [92] |
| 43 | Web-Sci | 2019 | Estimating leaf area index and aboveground biomass of grazing pastures using Sentinel-1, Sentinel-2 and Landsat images | 85 | Wang et al. [33] |
| 44 | Goo-Sch | 2019 | Estimating rangeland forage production using remote sensing data from a small unmanned aerial system (sUAS) and PlanetScope satellite | 18 | Liu et al. [93] |
| 45 | Goo-Sch | 2019 | Yield estimates by a two-step approach using hyperspectral methods in grasslands at high latitudes | 11 | Ancin-Murguzur et al. [94] |
| 46 | Goo-Sch | 2019 | Estimating the basis risk of rainfall index insurance for pasture, rangeland, and forage | 21 | Yu et al. [95] |
| 47 | Web-Sci | 2019 | Evaluation of grass quality under different soil management scenarios using remote sensing techniques | 21 | Askari et al. [96] |
| 48 | Web-Sci | 2019 | Grassland ecosystem services in a changing environment: The potential of hyperspectra monitoring | 19 | Obermeier et al. [97] |
| 49 | Goo-Sch | 2019 | Integrating traditional ecological knowledge and remote sensing for monitoring rangeland dynamics in the Altai Mountain region | 12 | Paltsyn et al. [98] |
| 50 | Web-Sci | 2019 | LIDAR provides novel insights into the effect of pixel size and grazing intensity on measures of spatial heterogeneity in a native bunchgrass ecosystem | 10 | Jansen et al. [99] |
| 51 | Sci-Dir | 2019 | Quantitative estimation of biomass of alpine grasslands using hyperspectral remote sensing | 14 | Kong et al. [100] |
| 52 | Sci-Dir | 2019 | The classification of grassland types based on object-based image analysis with multisource data | 9 | Xu et al. [101] |
| 53 | Web-Sci | 2018 | Grassland canopy cover and aboveground biomass in Mongolia and Inner Mongolia: Spatiotemporal estimates and controlling factors | 65 | John et al. [102] |
| 54 | Goo-Sch | 2018 | A novel machine learning method for estimating biomass of grass swards using a photogrammetric canopy height model, images and vegetation indices captured by a drone | 108 | Viljanen et al. [34] |
| 55 | Web-Sci | 2018 | Characterizing the spatio-temporal variations of C3 and C4 dominated grasslands aboveground biomass in the Drakensberg, South Africa | 15 | Shoko et al. [103] |
| 56 | Web-Sci | 2018 | Estimates of grassland biomass and turnover time on the Tibetan Plateau | 35 | Xia et al. [104] |
| 57 | Web-Sci | 2018 | Estimating vegetation biomass and cover across large plots in shrub and grass dominated drylands using terrestrial lidar and machine learning | 57 | Anderson et al. [105] |
| 58 | Goo-Sch | 2018 | Innovation in rangeland monitoring: Annual, 30 m, plant functional type percent cover maps for us rangelands, 1984–2017 | 115 | Jones et al. [106] |
| 59 | Web-Sci | 2018 | Modeling grassland above-ground biomass based on artificial neural network and remote sensing in the Three-River Headwaters Region | 105 | Yang et al. [107] |
| 60 | Goo-Sch | 2018 | Modelling inter-annual variation in dry matter yield and precipitation use efficiency of perennial pastures and annual forage crops sequences | 25 | Ojeda et al. [35] |
| 61 | Sci-Dir | 2018 | Predicting habitat quality of protected dry grasslands using Landsat NDVI phenology | 36 | Weber et al. [108] |
| 62 | Goo-Sch | 2018 | Remote sensing as a tool to assess botanical composition, structure, quantity and quality of temperate grasslands | 4 | Wachendorf et al. [109] |
| 63 | Goo-Sch | 2018 | Spatial and temporal variability of grassland yield and its response to climate change and anthropogenic activities on the Tibetan Plateau from 1988 to 2013 | 28 | Zhang et al. [110] |
| 64 | Goo-Sch | 2017 | Constructing Italian ryegrass yield prediction model based on climatic data by locations in South Korea | 17 | Peng et al. [111] |
| 65 | Sci-Dir | 2017 | Estimating grassland LAI using the Random Forests approach and Landsat imagery in the meadow steppe of Hulunber, China | 36 | LI et al. [112] |
| 66 | Sci-Dir | 2017 | Estimation and prediction of grassland cover in western Mongolia using MODIS-derived vegetation indices | 6 | Paltsyn et al. [113] |
| 67 | Goo-Sch | 2017 | Evaluation of remote sensing inversion error for the above-ground biomass of alpine meadow grassland based on multi-source satellite data | 32 | Meng et al. [114] |
| 68 | Goo-Sch | 2017 | Multi-model simulation of soil temperature, soil water content and biomass in Euro-Mediterranean grasslands: Uncertainties and ensemble performance | 52 | Sandor et al. [115] |
| 69 | Goo-Sch | 2017 | Identification of high nature value grassland with remote sensing and minimal field data | 54 | Stenzel et al. [116] |
| 70 | Goo-Sch | 2017 | Remote sensing of above-ground biomass | 119 | Kumar and Mutanga [117] |
| 71 | Goo-Sch | 2017 | The relationship between soil moisture and temperature vegetation on Kirklareli city Luleburgaz district a natural pasture vegetation | 5 | Sen and Ozturk [118] |
| 72 | Goo-Sch | 2017 | The signature of sea surface temperature anomalies on the dynamics of semiarid grassland productivity. | 21 | Chen et al. [119] |
| 73 | Goo-Sch | 2017 | Modelling biomass of mountainous grasslands by including a species composition map | 23 | Magiera et al. [120] |
| 74 | Web-Sci | 2016 | Modeling managed grassland biomass estimation by using multitemporal remote sensing data—A machine learning approach | 80 | Ali et al. [121] |
| 75 | Goo-Sch | 2016 | Calibration of GrassMaster II to estimate green and dry matter yield in Mediterranean pastures: Effect of pasture moisture content | 24 | Serrano et al. [122] |
| 76 | Web-Sci | 2016 | Comparison of machine-learning methods for above-ground biomass estimation based on Landsat imagery | 52 | Wu et al. [43] |
| 77 | Web-Sci | 2016 | Grassland and cropland net ecosystem production of the US Great Plains: Regression tree model development and comparative analysis | 10 | Wylie et al. [123] |
| 78 | Sci-Dir | 2016 | Modeling grassland aboveground biomass using a pure vegetation index | 50 | Li et al. [124] |
| 79 | Web-Sci | 2016 | Application of synthetic NDVI time series blended from Landsat and MODIS data for grassland biomass estimation | 76 | Zhang et al. [125] |
| 80 | Goo-Sch | 2016 | Modeling phenological responses of Inner Mongolia grassland species to regional climate change | 24 | Li et al. [126] |
| 81 | Sci-Dir | 2015 | Estimating above-ground biomass on mountain meadows and pastures through remote sensing | 64 | Barrachina et al. [127] |
| 82 | Web-Sci | 2015 | Estimating plant traits of grasslands from UAV-acquired hyperspectral images: A comparison of statistical approaches | 98 | Capolupo et al. [128] |
| 83 | Goo-Sch | 2015 | Water use efficiency of six rangeland grasses under varied soil moisture content levels in the arid Tana River County, Kenya | 19 | Koech et al. [129] |
| 84 | Goo-Sch | 2013 | The North Dakota drought calculator: Decision support tool for predicting forage growth during drought | 8 | Dunn et al. [17] |
| 85 | Sci-Dir | 2010 | Using remote sensing and GIS technologies to estimate grass yield and livestock carrying capacity of alpine grasslands in Golog Prefecture, China | 98 | Long et al. [130] |
Appendix B. Visual and Hyperspectral Vegetation Indices from Literature Review
| Vegetation Index | Equation | Reference |
|---|---|---|
| Normalized difference vegetation index (NDVI) | [131] | |
| Enhanced vegetation index (EVI) | [132] | |
| Soil-adjusted vegetation index (SAVI) | [133] | |
| Optimized soil-adjusted vegetation index (OSAVI) | [134] | |
| Modified soil-adjusted vegetation index (MSAVI) | [135] | |
| Normalized difference water index (NDWI) | [136] | |
| Simple ratio index (SR) | [137] | |
| Land surface water index (LSWI) | [138] | |
| Green normalized vegetation index (GNDVI) | [139] | |
| Atmospherically resistant vegetation index (ARVI) | [140] | |
| Green red vegetation index (GRVI) | [141] | |
| Excess green (ExG ) | [142] | |
| Enhanced vegetation index 2-band (EVI2) | [143] | |
| Difference vegetation index (DVI) | [144] |
References
- Reeves, M.C.; Mitchell, J.E. Extent of coterminous US rangelands: Quantifying implications of differing agency perspectives. Rangel. Ecol. Manag. 2011, 64, 585–597. [Google Scholar] [CrossRef] [Green Version]
- Derner, J.D.; Briske, D.; Reeves, M.C.; Brown-Brandl, T.; Meehan, M.; Blumenthal, D.; Travis, W.; Augustine, D.; Wilmer, H.; Scasta, D.; et al. Vulnerability of grazing and confined livestock in the Northern Great Plains to projected mid-and late-twenty-first century climate. Clim. Chang. 2018, 146, 19–32. [Google Scholar] [CrossRef]
- Jin, Y.; Yang, X.; Qiu, J.; Li, J.; Gao, T.; Wu, Q.; Zhao, F.; Ma, H.; Yu, H.; Xu, B. Remote sensing-based biomass estimation and its spatio-temporal variations in temperate grassland, Northern China. Remote Sens. 2014, 6, 1496–1513. [Google Scholar] [CrossRef] [Green Version]
- Feng, L.; Zhang, Z.; Ma, Y.; Du, Q.; Williams, P.; Drewry, J.; Luck, B. Alfalfa yield prediction using UAV-based hyperspectral imagery and ensemble learning. Remote Sens. 2020, 12, 2028. [Google Scholar] [CrossRef]
- Catchpole, W.; Wheeler, C. Estimating plant biomass: A review of techniques. Aust. J. Ecol. 1992, 17, 121–131. [Google Scholar] [CrossRef]
- Atzberger, C. Advances in remote sensing of agriculture: Context description, existing operational monitoring systems and major information needs. Remote Sens. 2013, 5, 949–981. [Google Scholar] [CrossRef] [Green Version]
- Xie, X.; He, B.; Guo, L.; Miao, C.; Zhang, Y. Detecting hotspots of interactions between vegetation greenness and terrestrial water storage using satellite observations. Remote Sens. Environ. 2019, 231, 111259. [Google Scholar] [CrossRef]
- Pal, S.C.; Chakrabortty, R.; Malik, S.; Das, B. Application of forest canopy density model for forest cover mapping using LISS-IV satellite data: A case study of Sali watershed, West Bengal. Model. Earth Syst. Environ. 2018, 4, 853–865. [Google Scholar] [CrossRef]
- Hashim, H.; Abd Latif, Z.; Adnan, N.A. Urban vegetation classification with NDVI threshold value method with very high resolution (VHR) Pleiades imagery. Int. Arch. Photogramm. Remote G Spat. Inf. Sci. 2019, 42, 237–240. [Google Scholar] [CrossRef] [Green Version]
- Dos Reis, A.A.; Werner, J.P.; Silva, B.C.; Figueiredo, G.K.; Antunes, J.F.; Esquerdo, J.C.; Coutinho, A.C.; Lamparelli, R.A.; Rocha, J.V.; Magalhães, P.S. Monitoring pasture aboveground biomass and canopy height in an integrated crop–livestock system using textural information from PlanetScope imagery. Remote Sens. 2020, 12, 2534. [Google Scholar] [CrossRef]
- Liu, Y.; Dang, C.; Yue, H.; Lyu, C.; Dang, X. Enhanced drought detection and monitoring using sun-induced chlorophyll fluorescence over Hulun Buir Grassland, China. Sci. Total Environ. 2021, 770, 145271. [Google Scholar] [CrossRef] [PubMed]
- Krueger, E.S.; Ochsner, T.E.; Levi, M.R.; Basara, J.B.; Snitker, G.J.; Wyatt, B.M. Grassland productivity estimates informed by soil moisture measurements: Statistical and mechanistic approaches. Agron. J. 2021, 113, 3498–3517. [Google Scholar] [CrossRef]
- Leroux, C.; Jones, H.; Pichon, L.; Guillaume, S.; Lamour, J.; Taylor, J.; Naud, O.; Crestey, T.; Lablee, J.L.; Tisseyre, B. GeoFIS: An open source, decision-support tool for precision agriculture data. Agriculture 2018, 8, 73. [Google Scholar] [CrossRef] [Green Version]
- Garg, A.; Sapkota, A.; Haghverdi, A. SAMZ-Desert: A Satellite-based agricultural management zoning tool for the desert agriculture region of Southern California. Comput. Electron. Agric. 2022, 194, 106803. [Google Scholar] [CrossRef]
- Keele, S.; Kitchenham, B.A.; Charters, S.M. Guidelines for Performing Systematic Literature Reviews in Software Engineering; Technical report, Technical Report, Ver. 2.3 EBSE Technical Report; EBSE: Keele University: Newcastle, UK, 2007. [Google Scholar]
- Dunn, G.H. Drought Calculator. 2013. Available online: https://www.nrcs.usda.gov/conservation-basics/conservation-by-state/north-dakota/drought-calculator (accessed on 9 February 2023).
- Dunn, G.H.; Gutwein, M.; Green, T.R.; Menger, A.; Printz, J. The drought calculator: Decision support tool for predicting forage growth during drought. Rangel. Ecol. Manag. 2013, 66, 570–578. [Google Scholar] [CrossRef]
- USDM. United States Drought Monitor. 1999. Available online: https://droughtmonitor.unl.edu/Maps/CompareTwoWeeks.aspx (accessed on 9 February 2023).
- Peck, D. Grass-Cast: Grassland Production Forecast. 2018. Available online: https://grasscast.unl.edu (accessed on 9 February 2023).
- Peck, D.; Derner, J.D.; Parton, W.; Hartman, M.; Fuchs, B. Flexible stocking with Grass-Cast: A new grassland productivity forecast to translate climate outlooks for ranchers. West. Econ. Forum 2019, 17, 24–39. [Google Scholar]
- Hartman, M.D.; Parton, W.J.; Derner, J.D.; Schulte, D.K.; Smith, W.K.; Peck, D.E.; Day, K.A.; Del Grosso, S.J.; Lutz, S.; Fuchs, B.A.; et al. Seasonal grassland productivity forecast for the US Great Plains using Grass-Cast. Ecosphere 2020, 11, e03280. [Google Scholar] [CrossRef]
- Allred, B. Rangeland Analysis Platform, 2019. 2019. Available online: https://rangelands.app (accessed on 9 February 2023).
- Allred, B.W.; Bestelmeyer, B.T.; Boyd, C.S.; Brown, C.; Davies, K.W.; Duniway, M.C.; Ellsworth, L.M.; Erickson, T.A.; Fuhlendorf, S.D.; Griffiths, T.V.; et al. Improving Landsat predictions of rangeland fractional cover with multitask learning and uncertainty. Methods Ecol. Evol. 2021, 12, 841–849. [Google Scholar] [CrossRef]
- Undersander, D.; Barnett, K. Value of Short Rotations for Alfalfa Profitability; University of Wisconsin Extension, Madison, WI, USA. 2008. Available online: https://fyi.extension.wisc.edu/forage/files/2014/01/ValueShortRotations08.pdf (accessed on 9 February 2023).
- Barnett, K. University of Wisconsin-Madison: Team Forage, Division of Extension. 2009. Available online: https://fyi.extension.wisc.edu/forage/economics/ (accessed on 9 February 2023).
- Brence, L.; Griffith, D. Montana State University Extension Economics. 2012. Available online: http://www.montana.edu/softwaredownloads/livestockdownloads.html (accessed on 9 February 2023).
- Norberg, S.; Neibergs, S.J. 2012 Irrigated alfalfa hay budget under center pivot in the Columbia Basin. Washington Extension Publication FS133E. 2012. Available online: http://ses.wsu.edu/wp-content/uploads/2018/10/FS133E.pdf (accessed on 9 February 2023).
- Ishler, V.A.a. Penn State Extension. 2020. Available online: https://extension.psu.edu/spreadsheet-to-price-standing-hay-crop-forage (accessed on 9 February 2023).
- Kirwan, B. NRCS—Hay Production vs. Buying. 2020. Available online: https://www.nrcs.usda.gov/wps/portal/nrcs/main/national/technical/econ/tools/ (accessed on 13 March 2021).
- Subhashree, S.N.; Igathinathane, C.; Liebig, M.; Halvorson, J.; Archer, D.; Hendrickson, J.; Kronberg, S. Biomass bales infield aggregation logistics energy for tractors and automatic bale pickers—A simulation study. Biomass Bioenergy 2021, 144, 105915. [Google Scholar] [CrossRef]
- Qin, Q.; Xu, D.; Hou, L.; Shen, B.; Xin, X. Comparing vegetation indices from Sentinel-2 and Landsat 8 under different vegetation gradients based on a controlled grazing experiment. Ecol. Indic. 2021, 133, 108363. [Google Scholar] [CrossRef]
- Gargiulo, J.; Clark, C.; Lyons, N.; de Veyrac, G.; Beale, P.; Garcia, S. Spatial and temporal pasture biomass estimation integrating electronic plate meter, planet cubesats and Sentinel-2 satellite data. Remote Sens. 2020, 12, 3222. [Google Scholar] [CrossRef]
- Wang, J.; Xiao, X.; Bajgain, R.; Starks, P.; Steiner, J.; Doughty, R.B.; Chang, Q. Estimating leaf area index and aboveground biomass of grazing pastures using Sentinel-1, Sentinel-2 and Landsat images. ISPRS J. Photogramm. Remote Sens. 2019, 154, 189–201. [Google Scholar] [CrossRef] [Green Version]
- Viljanen, N.; Honkavaara, E.; Näsi, R.; Hakala, T.; Niemeläinen, O.; Kaivosoja, J. A novel machine learning method for estimating biomass of grass swards using a photogrammetric canopy height model, images and vegetation indices captured by a drone. Agriculture 2018, 8, 70. [Google Scholar] [CrossRef] [Green Version]
- Ojeda, J.J.; Caviglia, O.P.; Irisarri, J.G.N.; Agnusdei, M.G. Modelling inter-annual variation in dry matter yield and precipitation use efficiency of perennial pastures and annual forage crops sequences. Agric. For. Meteorol. 2018, 259, 1–10. [Google Scholar] [CrossRef]
- Zhang, X.; Du, X.; Hong, J.; Du, Z.; Lu, X.; Wang, X. Effects of climate change on the growing season of alpine grassland in Northern Tibet, China. Glob. Ecol. Conserv. 2020, 23, e01126. [Google Scholar] [CrossRef]
- Sen, C. The effects of soil moisture and temperature on vegetation composition and yield at different pasture sites. Int. J. Agric. Sci. Vet. Med. 2018, 5, 1–10. [Google Scholar]
- Kaul, M.; Hill, R.L.; Walthall, C. Artificial neural networks for corn and soybean yield prediction. Agric. Syst. 2005, 85, 1–18. [Google Scholar] [CrossRef]
- Fan, J.; Zheng, J.; Wu, L.; Zhang, F. Estimation of daily maize transpiration using support vector machines, extreme gradient boosting, artificial and deep neural networks models. Agric. Water Manag. 2021, 245, 106547. [Google Scholar] [CrossRef]
- Ahamed, A.M.S.; Mahmood, N.T.; Hossain, N.; Kabir, M.T.; Das, K.; Rahman, F.; Rahman, R.M. Applying data mining techniques to predict annual yield of major crops and recommend planting different crops in different districts in Bangladesh. In Proceedings of the 2015 IEEE/ACIS 16th International Conference on Software Engineering, Artificial Intelligence, Networking and Parallel/Distributed Computing (SNPD), Takamatsu, Japan, 1–3 June 2015; IEEE: Takamatsu, Japan, 2015; pp. 1–6. [Google Scholar]
- Mathieu, J.A.; Aires, F. Assessment of the agro-climatic indices to improve crop yield forecasting. Agric. For. Meteorol. 2018, 253, 15–30. [Google Scholar] [CrossRef]
- Dang, C.; Liu, Y.; Yue, H.; Qian, J.; Zhu, R. Autumn crop yield prediction using data-driven approaches:-support vector machines, random forest, and deep neural network methods. Can. J. Remote Sens. 2021, 47, 162–181. [Google Scholar] [CrossRef]
- Wu, C.; Shen, H.; Shen, A.; Deng, J.; Gan, M.; Zhu, J.; Xu, H.; Wang, K. Comparison of machine-learning methods for above-ground biomass estimation based on Landsat imagery. J. Appl. Remote Sens. 2016, 10, 035010. [Google Scholar] [CrossRef]
- Reeves, J.L.; Derner, J.D.; Sanderson, M.A.; Kronberg, S.L.; Hendrickson, J.R.; Vermeire, L.T.; Petersen, M.K.; Irisarri, J.G. Seasonal weather-related decision making for cattle production in the Northern Great Plains. Rangelands 2015, 37, 119–124. [Google Scholar] [CrossRef]
- Shrum, T.R.; Travis, W.R.; Williams, T.M.; Lih, E. Managing climate risks on the ranch with limited drought information. Clim. Risk Manag. 2018, 20, 11–26. [Google Scholar] [CrossRef]
- Kichler, C.; Fulton, J.; Raper, R.; McDonald, T.; Zech, W. Effects of transmission gear selection on tractor performance and fuel costs during deep tillage operations. Soil Tillage Res. 2011, 113, 105–111. [Google Scholar] [CrossRef] [Green Version]
- Kuwayama, Y.; Thompson, A.; Bernknopf, R.; Zaitchik, B.; Vail, P. Estimating the impact of drought on agriculture using the US Drought Monitor. Am. J. Agric. Econ. 2019, 101, 193–210. [Google Scholar] [CrossRef]
- Hao, Z.; Xia, Y.; Luo, L.; Singh, V.P.; Ouyang, W.; Hao, F. Toward a categorical drought prediction system based on US Drought Monitor (USDM) and climate forecast. J. Hydrol. 2017, 551, 300–305. [Google Scholar] [CrossRef]
- Derner, J.D.; Augustine, D.J. Adaptive management for drought on rangelands. Rangelands 2016, 38, 211–215. [Google Scholar] [CrossRef] [Green Version]
- Parton, W.; Hartman, M.; Peck, D.; Derner, J.D.; Smith, W.; Del Grosso, S.J.; Fuchs, B. Grass-Cast: Using grassland productivity forecast to link ecology and ecosystem management. In Proceedings of the 2020 ESA Annual Meeting, ESA Virtual Online Meeting, 3–6 August 2020. [Google Scholar]
- Smart, A.J.; Harmoney, K.; Scasta, J.D.; Stephenson, M.B.; Volesky, J.D.; Vermeire, L.T.; Mosley, J.C.; Sedivec, K.; Meehan, M.; Haigh, T.; et al. Critical decision dates for drought management in central and northern Great Plains rangelands. Rangel. Ecol. Manag. 2019, 78, 191–200. [Google Scholar] [CrossRef]
- Derner, J.D.; Raynor, E.J.; Reeves, J.L.; Augustine, D.J.; Milchunas, D.G. Climatic and management determinants of large herbivore production in semiarid grassland. Agric. Ecosyst. Environ. 2020, 290, 106761. [Google Scholar] [CrossRef]
- Pastick, N.J.; Wylie, B.K.; Rigge, M.B.; Dahal, D.; Boyte, S.P.; Jones, M.O.; Allred, B.W.; Parajuli, S.; Wu, Z. Rapid monitoring of the abundance and spread of exotic annual grasses in the western United States using remote sensing and machine learning. AGU Adv. 2021, 2, e2020AV000298. [Google Scholar] [CrossRef]
- Smith, J.T.; Allred, B.W.; Boyd, C.S.; Davies, K.W.; Jones, M.O.; Kleinhesselink, A.R.; Maestas, J.D.; Morford, S.L.; Naugle, D.E. The elevational ascent and spread of exotic annual grass dominance in the Great Basin, USA. Divers. Distrib. 2022, 28, 83–96. [Google Scholar] [CrossRef]
- Horrocks, R.D.; Valentine, J.F. Harvested forages; Academic Press: Cambridge, MA, USA, 1999. [Google Scholar]
- Nayigihugu, V.; Schleicher, A.; Koch, D.; Held, L.; Flake, J.; Hess, B. Beef cattle production, nutritional quality, and economics of windrowed forage vs. baled hay during winter. Agron. J. 2007, 99, 944–951. [Google Scholar] [CrossRef]
- Zhang, H.; Tang, Z.; Wang, B.; Meng, B.; Qin, Y.; Sun, Y.; Lv, Y.; Zhang, J.; Yi, S. A non-destructive method for rapid acquisition of grassland aboveground biomass for satellite ground verification using UAV RGB images. Glob. Ecol. Conserv. 2022, 33, e01999. [Google Scholar] [CrossRef]
- Zhao, Y.; Zhu, W.; Wei, P.; Fang, P.; Zhang, X.; Yan, N.; Liu, W.; Zhao, H.; Wu, Q. Classification of Zambian grasslands using random forest feature importance selection during the optimal phenological period. Ecol. Indic. 2022, 135, 108529. [Google Scholar] [CrossRef]
- Fernández-Habas, J.; Cañada, M.C.; Moreno, A.M.G.; Leal-Murillo, J.R.; González-Dugo, M.P.; Oar, B.A.; Gómez-Giráldez, P.J.; Fernández-Rebollo, P. Estimating pasture quality of Mediterranean grasslands using hyperspectral narrow bands from field spectroscopy by random forest and PLS regressions. Comput. Electron. Agric. 2022, 192, 106614. [Google Scholar] [CrossRef]
- Kearney, S.P.; Porensky, L.M.; Augustine, D.J.; Gaffney, R.; Derner, J.D. Monitoring standing herbaceous biomass and thresholds in semiarid rangelands from harmonized Landsat 8 and Sentinel-2 imagery to support within-season adaptive management. Remote Sens. Environ. 2022, 271, 112907. [Google Scholar] [CrossRef]
- İleri, O.; Koç, A. Monitoring the available forage using Sentinel 2-derived NDVI data for sustainable rangeland management. J. Arid Environ. 2022, 200, 104727. [Google Scholar] [CrossRef]
- Li, X.; Yuan, W.; Dong, W. A machine learning method for predicting vegetation indices in China. Remote Sens. 2021, 13, 1147. [Google Scholar] [CrossRef]
- Pecina, M.V.; Bergamo, T.F.; Ward, R.; Joyce, C.; Sepp, K. A novel UAV-based approach for biomass prediction and grassland structure assessment in coastal meadows. Ecol. Indic. 2021, 122, 107227. [Google Scholar] [CrossRef]
- Chang, S.; Chen, H.; Wu, B.; Nasanbat, E.; Yan, N.; Davdai, B. A practical satellite-derived vegetation drought index for arid and semi-arid grassland drought monitoring. Remote Sens. 2021, 13, 414. [Google Scholar] [CrossRef]
- Bayaraa, B.; Hirano, A.; Purevtseren, M.; Vandansambuu, B.; Damdin, B.; Natsagdorj, E. Applicability of different vegetation indices for pasture biomass estimation in the North-Central region of Mongolia. Geocarto Int. 2021, 1–16. [Google Scholar] [CrossRef]
- Zheng, F.; Hu, Y.; Qibing, W.; Feng, Z. Changes and controls of aboveground net primary production in response to grassland policy in Inner Mongolian grasslands of China. Remote Sens. Appl. Soc. Environ. 2021, 22, 100526. [Google Scholar] [CrossRef]
- Chen, Y.; Guerschman, J.; Shendryk, Y.; Henry, D.; Harrison, M.T. Estimating pasture biomass using Sentinel-2 imagery and machine learning. Remote Sens. 2021, 13, 603. [Google Scholar] [CrossRef]
- Lang, M.; Mahyou, H.; Tychon, B. Estimation of rangeland production in the arid oriental region (Morocco) combining remote sensing vegetation and rainfall indices: Challenges and lessons learned. Remote Sens. 2021, 13, 2093. [Google Scholar] [CrossRef]
- Lin, X.; Chen, J.; Lou, P.; Yi, S.; Qin, Y.; You, H.; Han, X. Improving the estimation of alpine grassland fractional vegetation cover using optimized algorithms and multi-dimensional features. Plant Methods 2021, 17, 96. [Google Scholar] [CrossRef]
- Echeverría, A.; Urmeneta, A.; González-Audícana, M.; González, E.M. Monitoring rainfed alfalfa growth in semiarid agrosystems using Sentinel-2 imagery. Remote Sens. 2021, 13, 4719. [Google Scholar] [CrossRef]
- Amies, A.C.; Dymond, J.R.; Shepherd, J.D.; Pairman, D.; Hoogendoorn, C.; Sabetizade, M.; Belliss, S.E. National mapping of New Zealand pasture productivity using temporal Sentinel-2 data. Remote Sens. 2021, 13, 1481. [Google Scholar] [CrossRef]
- Li, H.; Zhang, F.; Zhu, J.; Guo, X.; Li, Y.; Lin, L.; Zhang, L.; Yang, Y.; Li, Y.; Cao, G.; et al. Precipitation rather than evapotranspiration determines the warm-season water supply in an alpine shrub and an alpine meadow. Agric. For. Meteorol. 2021, 300, 108318. [Google Scholar] [CrossRef]
- Zhou, W.; Li, H.; Xie, L.; Nie, X.; Wang, Z.; Du, Z.; Yue, T. Remote sensing inversion of grassland aboveground biomass based on high accuracy surface modeling. Ecol. Indic. 2021, 121, 107215. [Google Scholar] [CrossRef]
- Dube, T.; Shoko, C.; Gara, T.W. Remote sensing of aboveground grass biomass between protected and non-protected areas in savannah rangelands. Afr. J. Ecol. 2021, 59, 687–695. [Google Scholar] [CrossRef]
- Lyu, X.; Li, X.; Gong, J.; Li, S.; Dou, H.; Dang, D.; Xuan, X.; Wang, H. Remote-sensing inversion method for aboveground biomass of typical steppe in Inner Mongolia, China. Ecol. Indic. 2021, 120, 106883. [Google Scholar] [CrossRef]
- Xu, D.; Wang, C.; Chen, J.; Shen, M.; Shen, B.; Yan, R.; Li, Z.; Karnieli, A.; Chen, J.; Yan, Y.; et al. The superiority of the normalized difference phenology index (NDPI) for estimating grassland aboveground fresh biomass. Remote Sens. Environ. 2021, 264, 112578. [Google Scholar] [CrossRef]
- Tarumi, E.; Tsuiki, M.; Mori, A. Cool-season grass productivity estimation model evaluating the effects of global warming and climate adaptation strategies. Grassl. Sci. 2021, 67, 234–240. [Google Scholar] [CrossRef]
- Lyu, X.; Li, X.; Dang, D.; Dou, H.; Xuan, X.; Liu, S.; Li, M.; Gong, J. A new method for grassland degradation monitoring by vegetation species composition using hyperspectral remote sensing. Ecol. Indic. 2020, 114, 106310. [Google Scholar] [CrossRef]
- Schwieder, M.; Buddeberg, M.; Kowalski, K.; Pfoch, K.; Bartsch, J.; Bach, H.; Pickert, J.; Hostert, P. Estimating grassland parameters from Sentinel-2: A model comparison study. PFG- Photogramm. Remote Sens. Geoinf. Sci. 2020, 88, 379–390. [Google Scholar] [CrossRef]
- Barnetson, J.; Phinn, S.; Scarth, P. Estimating plant pasture biomass and quality from UAV imaging across Queensland’s rangelands. AgriEngineering 2020, 2, 523–543. [Google Scholar] [CrossRef]
- Gómara, I.; Bellocchi, G.; Martin, R.; Rodríguez-Fonseca, B.; Ruiz-Ramos, M. Influence of climate variability on the potential forage production of a mown permanent grassland in the French Massif Central. Agric. For. Meteorol. 2020, 280, 107768. [Google Scholar] [CrossRef]
- Clementini, C.; Pomente, A.; Latini, D.; Kanamaru, H.; Vuolo, M.R.; Heureux, A.; Fujisawa, M.; Schiavon, G.; Del Frate, F. Long-term grass biomass estimation of pastures from satellite data. Remote Sens. 2020, 12, 2160. [Google Scholar] [CrossRef]
- Soubry, I.; Guo, X. Monitoring and Modeling Rangeland Health with Remote Sensing; University of Saskatchewan: Saskatoon, SK, Canada, 2020. [Google Scholar]
- Brock Porth, C.; Porth, L.; Zhu, W.; Boyd, M.; Tan, K.S.; Liu, K. Remote sensing applications for insurance: A predictive model for pasture yield in the presence of systemic weather. N. Am. Actuar. J. 2020, 24, 333–354. [Google Scholar] [CrossRef]
- Karunaratne, S.; Thomson, A.; Morse-McNabb, E.; Wijesingha, J.; Stayches, D.; Copland, A.; Jacobs, J. The fusion of spectral and structural datasets derived from an airborne multispectral sensor for estimation of pasture dry matter yield at paddock scale with time. Remote Sens. 2020, 12, 2017. [Google Scholar] [CrossRef]
- Guerini Filho, M.; Kuplich, T.M.; Quadros, F.L.D. Estimating natural grassland biomass by vegetation indices using Sentinel 2 remote sensing data. Int. J. Remote Sens. 2020, 41, 2861–2876. [Google Scholar] [CrossRef]
- Wu, T.; Fu, H.; Feng, F.; Bai, H. A new approach to predict normalized difference vegetation index using time-delay neural network in the arid and semi-arid grassland. Int. J. Remote Sens. 2019, 40, 9050–9063. [Google Scholar] [CrossRef]
- De Leeuw, J.; Rizayeva, A.; Namazov, E.; Bayramov, E.; Marshall, M.T.; Etzold, J.; Neudert, R. Application of the MODIS MOD 17 net primary production product in grassland carrying capacity assessment. Int. J. Appl. Earth Obs. Geoinf. 2019, 78, 66–76. [Google Scholar] [CrossRef]
- Borra-Serrano, I.; De Swaef, T.; Muylle, H.; Nuyttens, D.; Vangeyte, J.; Mertens, K.; Saeys, W.; Somers, B.; Roldán-Ruiz, I.; Lootens, P. Canopy height measurements and non-destructive biomass estimation of Lolium perenne swards using UAV imagery. Grass Forage Sci. 2019, 74, 356–369. [Google Scholar]
- Buttler, A.; Mariotte, P.; Meisser, M.; Guillaume, T.; Signarbieux, C.; Vitra, A.; Preux, S.; Mercier, G.; Quezada, J.; Bragazza, L.; et al. Drought-induced decline of productivity in the dominant grassland species Lolium Perenne L. depends soil type prevailing climatic condition. Soil Biol. Biochem. 2019, 132, 47–57. [Google Scholar] [CrossRef]
- Vogeler, I.; Thomas, S.; van der Weerden, T. Effect of irrigation management on pasture yield and nitrogen losses. Agric. Water Manag. 2019, 216, 60–69. [Google Scholar] [CrossRef]
- Zeng, N.; Ren, X.; He, H.; Zhang, L.; Zhao, D.; Ge, R.; Li, P.; Niu, Z. Estimating grassland aboveground biomass on the Tibetan Plateau using a random forest algorithm. Ecol. Indic. 2019, 102, 479–487. [Google Scholar] [CrossRef]
- Liu, H.; Dahlgren, R.A.; Larsen, R.E.; Devine, S.M.; Roche, L.M.; O’Geen, A.T.; Wong, A.J.; Covello, S.; Jin, Y. Estimating rangeland forage production using remote sensing data from a small unmanned aerial system (sUAS) and planetscope satellite. Remote Sens. 2019, 11, 595. [Google Scholar] [CrossRef] [Green Version]
- Ancin-Murguzur, F.J.; Taff, G.; Davids, C.; Tømmervik, H.; Mølmann, J.; Jørgensen, M. Yield estimates by a two-step approach using hyperspectral methods in grasslands at high latitudes. Remote Sens. 2019, 11, 400. [Google Scholar] [CrossRef] [Green Version]
- Yu, J.; Vandeveer, M.; Volesky, J.D.; Harmoney, K. Estimating the basis risk of rainfall index insurance for pasture, rangeland, and forage. J. Agric. Resour. Econ. 2019, 44, 179–193. [Google Scholar]
- Askari, M.S.; McCarthy, T.; Magee, A.; Murphy, D.J. Evaluation of grass quality under different soil management scenarios using remote sensing techniques. Remote Sens. 2019, 11, 1835. [Google Scholar] [CrossRef] [Green Version]
- Obermeier, W.A.; Lehnert, L.W.; Pohl, M.; Gianonni, S.M.; Silva, B.; Seibert, R.; Laser, H.; Moser, G.; Müller, C.; Luterbacher, J.; et al. Grassland ecosystem services in a changing environment: The potential of hyperspectral monitoring. Remote Sens. Environ. 2019, 232, 111273. [Google Scholar] [CrossRef]
- Paltsyn, M.Y.; Gibbs, J.P.; Mountrakis, G. Integrating traditional ecological knowledge and remote sensing for monitoring rangeland dynamics in the Altai Mountain region. Environ. Manag. 2019, 64, 40–51. [Google Scholar] [CrossRef]
- Jansen, V.; Kolden, C.; Greaves, H.; Eitel, J. Lidar provides novel insights into the effect of pixel size and grazing intensity on measures of spatial heterogeneity in a native bunchgrass ecosystem. Remote Sens. Environ. 2019, 235, 111432. [Google Scholar] [CrossRef]
- Kong, B.; Yu, H.; Du, R.; Wang, Q. Quantitative estimation of biomass of alpine grasslands using hyperspectral remote sensing. Rangel. Ecol. Manag. 2019, 72, 336–346. [Google Scholar] [CrossRef]
- Xu, D.; Chen, B.; Shen, B.; Wang, X.; Yan, Y.; Xu, L.; Xin, X. The classification of grassland types based on object-based image analysis with multisource data. Rangel. Ecol. Manag. 2019, 72, 318–326. [Google Scholar] [CrossRef]
- John, R.; Chen, J.; Giannico, V.; Park, H.; Xiao, J.; Shirkey, G.; Ouyang, Z.; Shao, C.; Lafortezza, R.; Qi, J. Grassland canopy cover and aboveground biomass in Mongolia and Inner Mongolia: Spatiotemporal estimates and controlling factors. Remote Sens. Environ. 2018, 213, 34–48. [Google Scholar] [CrossRef]
- Shoko, C.; Mutanga, O.; Dube, T.; Slotow, R. Characterizing the spatio-temporal variations of C3 and C4 dominated grasslands aboveground biomass in the Drakensberg, South Africa. Int. J. Appl. Earth Obs. Geoinf. 2018, 68, 51–60. [Google Scholar] [CrossRef] [Green Version]
- Xia, J.; Ma, M.; Liang, T.; Wu, C.; Yang, Y.; Zhang, L.; Zhang, Y.; Yuan, W. Estimates of grassland biomass and turnover time on the Tibetan Plateau. Environ. Res. Lett. 2018, 13, 014020. [Google Scholar] [CrossRef]
- Anderson, K.E.; Glenn, N.F.; Spaete, L.P.; Shinneman, D.J.; Pilliod, D.S.; Arkle, R.S.; McIlroy, S.K.; Derryberry, D.R. Estimating vegetation biomass and cover across large plots in shrub and grass dominated drylands using terrestrial lidar and machine learning. Ecol. Indic. 2018, 84, 793–802. [Google Scholar] [CrossRef]
- Jones, M.O.; Allred, B.W.; Naugle, D.E.; Maestas, J.D.; Donnelly, P.; Metz, L.J.; Karl, J.; Smith, R.; Bestelmeyer, B.; Boyd, C.; et al. Innovation in rangeland monitoring: Annual, 30 m, plant functional type percent cover maps for US rangelands, 1984–2017. Ecosphere 2018, 9, e02430. [Google Scholar] [CrossRef]
- Yang, S.; Feng, Q.; Liang, T.; Liu, B.; Zhang, W.; Xie, H. Modeling grassland above-ground biomass based on artificial neural network and remote sensing in the Three-River Headwaters Region. Remote Sens. Environ. 2018, 204, 448–455. [Google Scholar] [CrossRef]
- Weber, D.; Schaepman-Strub, G.; Ecker, K. Predicting habitat quality of protected dry grasslands using Landsat NDVI phenology. Ecol. Indic. 2018, 91, 447–460. [Google Scholar] [CrossRef]
- Wachendorf, M.; Fricke, T.; Möckel, T. Remote sensing as a tool to assess botanical composition, structure, quantity and quality of temperate grasslands. Grass Forage Sci. 2018, 73, 1–14. [Google Scholar] [CrossRef]
- Zhang, H.; Fan, J.; Wang, J.; Cao, W.; Harris, W. Spatial and temporal variability of grassland yield and its response to climate change and anthropogenic activities on the Tibetan Plateau from 1988 to 2013. Ecol. Indic. 2018, 95, 141–151. [Google Scholar] [CrossRef]
- Peng, J.; Kim, M.; Kim, Y.; Jo, M.; Kim, B.; Sung, K.; Lv, S. Constructing Italian ryegrass yield prediction model based on climatic data by locations in South Korea. Grassl. Sci. 2017, 63, 184–195. [Google Scholar] [CrossRef]
- LI, Z.w.; XIN, X.p.; Huan, T.; Fan, Y.; CHEN, B.r.; ZHANG, B.h. Estimating grassland LAI using the random forests approach and Landsat imagery in the meadow steppe of Hulunber, China. J. Integr. Agric. 2017, 16, 286–297. [Google Scholar] [CrossRef]
- Paltsyn, M.Y.; Gibbs, J.P.; Iegorova, L.V.; Mountrakis, G. Estimation and prediction of grassland cover in western Mongolia using MODIS-derived vegetation indices. Rangel. Ecol. Manag. 2017, 70, 723–729. [Google Scholar] [CrossRef]
- Meng, B.; Ge, J.; Liang, T.; Yang, S.; Gao, J.; Feng, Q.; Cui, X.; Huang, X.; Xie, H. Evaluation of remote sensing inversion error for the above-ground biomass of alpine meadow grassland based on multi-source satellite data. Remote Sens. 2017, 9, 372. [Google Scholar] [CrossRef] [Green Version]
- Sandor, R.; Barcza, Z.; Acutis, M.; Doro, L.; Hidy, D.; Köchy, M.; Minet, J.; Lellei-Kovács, E.; Ma, S.; Perego, A.; et al. Multi-model simulation of soil temperature, soil water content and biomass in Euro-Mediterranean grasslands: Uncertainties and ensemble performance. Eur. J. Agron. 2017, 88, 22–40. [Google Scholar] [CrossRef] [Green Version]
- Stenzel, S.; Fassnacht, F.E.; Mack, B.; Schmidtlein, S. Identification of high nature value grassland with remote sensing and minimal field data. Ecol. Indic. 2017, 74, 28–38. [Google Scholar] [CrossRef]
- Kumar, L.; Mutanga, O. Remote sensing of above-ground biomass. Remote Sens. 2017, 9, 935. [Google Scholar] [CrossRef] [Green Version]
- Sen, C.; Ozturk, O. The relationship between soil moisture and temperature vegetation on Kirklareli city Luleburgaz district a natural pasture vegetation. Int. J. Env. Agric. Res. (IJOEAR) 2017, 3, 21–29. [Google Scholar]
- Chen, M.; Parton, W.J.; Del Grosso, S.J.; Hartman, M.D.; Day, K.A.; Tucker, C.J.; Derner, J.D.; Knapp, A.K.; Smith, W.K.; Ojima, D.S.; et al. The signature of sea surface temperature anomalies on the dynamics of semiarid grassland productivity. Ecosphere 2017, 8, e02069. [Google Scholar] [CrossRef] [Green Version]
- Magiera, A.; Feilhauer, H.; Waldhardt, R.; Wiesmair, M.; Otte, A. Modelling biomass of mountainous grasslands by including a species composition map. Ecol. Indic. 2017, 78, 8–18. [Google Scholar] [CrossRef]
- Ali, I.; Cawkwell, F.; Dwyer, E.; Green, S. Modeling managed grassland biomass estimation by using multitemporal remote sensing data–A machine learning approach. IEEE J. Sel. Top. Appl. Earth Obs. Remote Sens. 2016, 10, 3254–3264. [Google Scholar] [CrossRef]
- Serrano, J.; Shahidian, S.; da Silva, J.M. Calibration of GrassMaster II to estimate green and dry matter yield in Mediterranean pastures: Effect of pasture moisture content. Crop Pasture Sci. 2016, 67, 780–791. [Google Scholar] [CrossRef]
- Wylie, B.; Howard, D.; Dahal, D.; Gilmanov, T.; Ji, L.; Zhang, L.; Smith, K. Grassland and cropland net ecosystem production of the US Great Plains: Regression tree model development and comparative analysis. Remote Sens. 2016, 8, 944. [Google Scholar] [CrossRef] [Green Version]
- Li, F.; Zeng, Y.; Luo, J.; Ma, R.; Wu, B. Modeling grassland aboveground biomass using a pure vegetation index. Ecol. Indic. 2016, 62, 279–288. [Google Scholar] [CrossRef]
- Zhang, B.; Zhang, L.; Xie, D.; Yin, X.; Liu, C.; Liu, G. Application of synthetic NDVI time series blended from Landsat and MODIS data for grassland biomass estimation. Remote Sens. 2016, 8, 10. [Google Scholar] [CrossRef] [Green Version]
- Li, Q.; Xu, L.; Pan, X.; Zhang, L.; Li, C.; Yang, N.; Qi, J. Modeling phenological responses of Inner Mongolia grassland species to regional climate change. Environ. Res. Lett. 2016, 11, 015002. [Google Scholar] [CrossRef]
- Barrachina, M.; Cristóbal, J.; Tulla, A.F. Estimating above-ground biomass on mountain meadows and pastures through remote sensing. Int. J. Appl. Earth Obs. Geoinf. 2015, 38, 184–192. [Google Scholar] [CrossRef]
- Capolupo, A.; Kooistra, L.; Berendonk, C.; Boccia, L.; Suomalainen, J. Estimating plant traits of grasslands from UAV-acquired hyperspectral images: A comparison of statistical approaches. ISPRS Int. J. Geo-Inf. 2015, 4, 2792–2820. [Google Scholar] [CrossRef]
- Koech, O.; Kinuthia, R.; Karuku, G.; Mureithi, S.; Wanjogu, R. Water use efficiency of six rangeland grasses under varied soil moisture content levels in the arid Tana River County, Kenya. Afr. J. Environ. Sci. Technol. 2015, 9, 632–640. [Google Scholar] [CrossRef] [Green Version]
- Long, Y.; Li, Z.; Wei, L.; Hua-Kun, Z. Using remote sensing and GIS technologies to estimate grass yield and livestock carrying capacity of alpine grasslands in Golog Prefecture, China. Pedosphere 2010, 20, 342–351. [Google Scholar]
- Rouse, J.; Haas, R.H.; Schell, J.A.; Deering, D.W. Monitoring vegetation systems in the Great Plains with ERTS. NASA Spec. Publ. 1974, 351, 309. [Google Scholar]
- Huete, A.; Liu, H.; Batchily, K.; Van Leeuwen, W. A comparison of vegetation indices over a global set of TM images for EOS-MODIS. Remote Sens. Environ. 1997, 59, 440–451. [Google Scholar] [CrossRef]
- Huete, A.R. A soil-adjusted vegetation index (SAVI). Remote Sens. Environ. 1988, 25, 295–309. [Google Scholar] [CrossRef]
- Rondeaux, G.; Steven, M.; Baret, F. Optimization of soil-adjusted vegetation indices. Remote Sens. Environ. 1996, 55, 95–107. [Google Scholar] [CrossRef]
- Qi, J.; Chehbouni, A.; Huete, A.R.; Kerr, Y.H.; Sorooshian, S. A modified soil adjusted vegetation index. Remote Sens. Environ. 1994, 48, 119–126. [Google Scholar] [CrossRef]
- Gao, B.C. NDWI—A normalized difference water index for remote sensing of vegetation liquid water from space. Remote Sens. Environ. 1996, 58, 257–266. [Google Scholar] [CrossRef]
- Birth, G.S.; McVey, G.R. Measuring the color of growing turf with a reflectance spectrophotometer 1. Agron. J. 1968, 60, 640–643. [Google Scholar] [CrossRef]
- Boschetti, M.; Nutini, F.; Manfron, G.; Brivio, P.A.; Nelson, A. Comparative analysis of normalised difference spectral indices derived from MODIS for detecting surface water in flooded rice cropping systems. PLoS ONE 2014, 9, e88741. [Google Scholar] [CrossRef] [PubMed]
- Gitelson, A.A.; Kaufman, Y.J.; Merzlyak, M.N. Use of a green channel in remote sensing of global vegetation from EOS-MODIS. Remote Sens. Environ. 1996, 58, 289–298. [Google Scholar] [CrossRef]
- Kaufman, Y.J.; Tanre, D. Atmospherically resistant vegetation index (ARVI) for EOS-MODIS. IEEE Trans. Geosci. Remote Sens. 1992, 30, 261–270. [Google Scholar] [CrossRef]
- Hunt, E.R.; Cavigelli, M.; Daughtry, C.S.; Mcmurtrey, J.E.; Walthall, C.L. Evaluation of digital photography from model aircraft for remote sensing of crop biomass and nitrogen status. Precis. Agric. 2005, 6, 359–378. [Google Scholar] [CrossRef]
- Woebbecke, D.M.; Meyer, G.E.; Von Bargen, K.; Mortensen, D.A. Color indices for weed identification under various soil, residue, and lighting conditions. Trans. ASAE 1995, 38, 259–269. [Google Scholar] [CrossRef]
- Jiang, Z.; Huete, A.R.; Didan, K.; Miura, T. Development of a two-band enhanced vegetation index without a blue band. Remote Sens. Environ. 2008, 112, 3833–3845. [Google Scholar] [CrossRef]
- Tucker, C.J. Red and photographic infrared linear combinations for monitoring vegetation. Remote Sens. Environ. 1979, 8, 127–150. [Google Scholar] [CrossRef]


| Search Aspect | Search Item Strings |
|---|---|
| Grassland | grassland *, pasture *, steppe *, rangeland *, meadow * |
| Climate | precipitation, rainfall, evapotranspiration, humidity, solar radiation, temperature, soil temperature |
| Remote Sensing | remote sensing, satellite, drone *, UAV * |
| Vegetation indices | vegetation ind*, NDVI, GNDVI, EVI |
| Methodology | machine learning, artificial intelligence, regression |
| Yield | biomass, produc*, monitoring, harvest, cut, quantity, yield |
| Database | Downloaded | Excluded | Selected (%) |
|---|---|---|---|
| Google Scholar | 83 | 46 | 54 |
| Web of Science | 36 | 20 | 24 |
| Science Direct | 28 | 19 | 22 |
| Total | 147 | 85 | 100 |
| Satellite Platforms | Frequency |
|---|---|
| MODIS | 16 |
| Landsat 5, 7, & 8 | 15 |
| Sentinel 1 & 2 | 12 |
| UAV | 9 |
| PlanetScope | 5 |
| LIDAR | 2 |
| EOSDIS | 1 |
| NOAA/AVHRR | 1 |
| PROBA-V | 1 |
Disclaimer/Publisher’s Note: The statements, opinions and data contained in all publications are solely those of the individual author(s) and contributor(s) and not of MDPI and/or the editor(s). MDPI and/or the editor(s) disclaim responsibility for any injury to people or property resulting from any ideas, methods, instructions or products referred to in the content. |
© 2023 by the authors. Licensee MDPI, Basel, Switzerland. This article is an open access article distributed under the terms and conditions of the Creative Commons Attribution (CC BY) license (https://creativecommons.org/licenses/by/4.0/).
Share and Cite
Subhashree, S.N.; Igathinathane, C.; Akyuz, A.; Borhan, M.; Hendrickson, J.; Archer, D.; Liebig, M.; Toledo, D.; Sedivec, K.; Kronberg, S.; et al. Tools for Predicting Forage Growth in Rangelands and Economic Analyses—A Systematic Review. Agriculture 2023, 13, 455. https://doi.org/10.3390/agriculture13020455
Subhashree SN, Igathinathane C, Akyuz A, Borhan M, Hendrickson J, Archer D, Liebig M, Toledo D, Sedivec K, Kronberg S, et al. Tools for Predicting Forage Growth in Rangelands and Economic Analyses—A Systematic Review. Agriculture. 2023; 13(2):455. https://doi.org/10.3390/agriculture13020455
Chicago/Turabian StyleSubhashree, Srinivasagan N., C. Igathinathane, Adnan Akyuz, Md. Borhan, John Hendrickson, David Archer, Mark Liebig, David Toledo, Kevin Sedivec, Scott Kronberg, and et al. 2023. "Tools for Predicting Forage Growth in Rangelands and Economic Analyses—A Systematic Review" Agriculture 13, no. 2: 455. https://doi.org/10.3390/agriculture13020455