Abstract
In crop production, which is largely dependent on environmental conditions, various attempts at environmental or social changes have been highlighted, and many field experiments are needed for them. However, since field experiments in agricultural production are constrained by high labor and time consumption, alternative methods to respond to these constraints are required. In this study, to establish a new method for application to field experiments, we proposed the evaluation of the leaf area index (LAI) of all individual plants in an experimental sweetcorn field using an unmanned aerial vehicle (UAV). Small-scale field experiments were conducted over two years. In the first year, the nitrogen fertilizer level was changed, and the plant density and additional nitrogen fertilizer application time were changed in the next year. Three vegetation indices (VIs), namely, the normalized difference vegetation index (NDVI), enhanced vegetation index 2 (EVI2), and simple ratio (SR), were validated to quantify the LAI estimation using a UAV for individual plants. For the evaluation of the individual plants, we used a plant-based method, which created all of the plant buffers based on the points of existing plants and the plant distance. To confirm the impact of the method, we additionally demonstrated the relationship between the LAI and yield, the results of statical analyses, and the difference of the center and the border of the field. Among the three VIs, index SR was found the most promising in the estimation of the LAI of the individual sweetcorn plants, providing the strongest correlation of yield with SR. Because a lot of data were obtained using the plant-based method, the statical differences in the LAI and yield were more easily detected for the plant density and fertilizer treatments. Furthermore, interesting differences between the center and the border of the field were found. These results indicate the availability and impact of plant-based evaluations using UAVs in near future field experiments.
1. Introduction
Field crops, such as rice, maize, and soybean, play an important role in the production of subsistence for human life, making productivity a major concern. Recent environmental and social changes affect field crop production. However, environmental problems such as the overuse of agrochemicals and soil accumulation caused by modern agricultural production processes, show that changes to agricultural production should be made [1]. In this situation, we must accelerate the practice of many and various experiments in the field because new agricultural management practices based on the ideas of researchers and the knowledge of farmers should be validated.
Most agricultural field experiments have been designed to assess the impacts of simple treatments, such as fertilizers and cultivars, and crop growth and yield are observed for such research purposes. Several studies conducted multifactorial experiments in large fields [2,3,4]. However, field experiments need large amounts of both human and time resources. If a methodology that can greatly decrease these amounts of resources is developed, it could have a large impact on field experiments.
Remote sensing technology (RS) has been considered an effective tool to manage crops and assess agricultural circumstances because it can capture multitemporal information on a wide area of the field [5]. The initial remote sensing has been boosted through satellites [6]. Satellite remote sensing captures the imagery at a very high altitude outside the atmosphere, so it is expensive and difficult to obtain detailed information about the field with high resolution when researchers and farmers would like to know the condition of the field. Along with the gradual development of technology, UAVs (unmanned aerial vehicles, such as drones) that lower cost and can be flown at lower altitudes with high resolution are available and the UAV is advantageous for relatively smaller areas to detect detailed alteration compared to the other platform [7]. In recent times, unmanned aerial vehicles (UAVs) have gained popularity and are expected to be used in various research fields. In agriculture, UAVs have gained widespread use for seeding, fertilizer application, and monitoring plant growth [8,9,10]. In the attempt to utilize UAVs for agriculture, they are equipped with a camera to monitor the leaf area index (LAI) of cropping areas.
The LAI, defined as the total one-sided leaf area per unit of ground area, is a crucial factor in climatic, ecological, and agronomical studies [11,12]. It is essential to exactly estimate the LAI for accurate simulations of transpiration, dry matter, and biomass accumulation; therefore, it has a large influence on crop growth and yield [13,14]. Many cases directly sample leaves and measure the leaf area or indirectly measure LAI using a canopy analyzer [15], but several studies have tried to predict the LAI of crops such as cotton, soybean, rice, maize, and so on using vegetation indices (VIs) in broad area. Examples of VIs as followed: normalized difference vegetation index (NDVI) [16], enhanced vegetation index (EVI) [17], simple ratio (SR) [18], modified triangular vegetation index (MTVI) [19], normalized difference red-edge index (NDRE) [20], chlorophyll index red-edge (CIRE) [21], chlorophyll vegetation index (CVI) [22], green normalized difference vegetation index (GNDVI) [23], wide dynamic range vegetation index (WDRVI) [24], soil adjusted vegetation index (SAVI) [25], and different vegetation index (DVI) [26]. The LAI estimation using multitemporal information has been conducted only for a wide area, but UAVs should have the potential to analyze individual plants through low-altitude flight and high-resolution imagery data.
In this study, to establish a new method of applying field experiments, we demonstrate the evaluation of LAI of 1085 and 2024 plants in a sweetcorn experimental field using a UAV in 2018 and 2019, respectively. With reference to Hashimoto et al. [27], three VIs of NDVI, EVI2, and SR, which are defined as red (640–680 nm) and near-infrared (770–810 nm), were adopted to evaluate the LAI using a UAV in this study. NDVI, EVI2, and SR are representatively used in LAI evaluation showing the robustness, moderation, and sensitivity as LAI changes, respectively. These VIs were validated with the actual LAI without the uncritical acceptance of one VI, and the relationship between the LAI and the yield was also validated. In addition, this study discusses the effects on the results of the field experiment when all individual plant data can be used.
2. Materials and Methods
2.1. Experimental Site and Crop Cultivation
Our experimental site was located at Tohoku University in Sendai, Miyagi Prefecture, Japan, 38°15′17″ N, 140°49′41″ E, Figure 1). Sweetcorn cultivar, namely “Nmetomigi” was cultivated during two consecutive vegetation seasons in 2018 and 2019. The seeds were sown on 29 May 2018 and 30 May 2019. In 2018, two repeated experiments were conducted with three treatments, which were the different N fertilizer levels of 5, 15, and 20 g m−2 as the Control, N1, and N2, respectively. All treatments had 5 g m−2 as a basal fertilizer at sowing. To N1 and N2, 5 g m−2 and 5 g m−2 were added on June 19 and 5 and 10 g m−2 on 5 July, respectively. In 2019, two repeated experiments were conducted with six treatments, which multiplied three different planting densities by two additional nitrogen fertilizer dressing times; the planting densities were 4, 7, and 10 plants m−2 for the Control, PD1, and PD2 and 10 g m−2, respectively, and additional fertilizer was applied after 3 and 5 weeks of sowing (abbreviated as 3W and 5W, respectively). Each plot had four rows that spanned 0.7 m in both years. The plant spacings were 0.35 m in 2018 and 0.334, 0.19, and 0.135 m for the Control, PD1, and PD2, respectively, in 2019. During cultivation, the weed control was conducted manually every week, and pesticides were sprayed twice in early and mid-July to prevent pests. On August 20, the harvest and sampling were carried out. Twenty-four samples and forty-eight samples were collected in 2018 and 2019, respectively. After the sampling, the sweetcorn kernels were dried at 65 °C for two weeks and weighed as the yield. The information on the cultivation was illustrated in Figure 2.
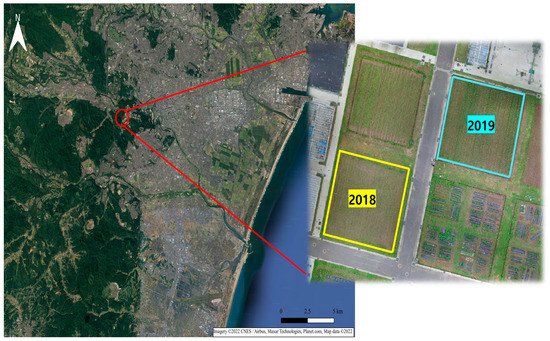
Figure 1.
Experimental site. Biggest imagery on left-side image was captured from Google Maps. The detailed image on the right side is an RGB image taken by an unmanned aerial vehicle (UAV). Both two-year experiments were carried out at Tohoku University, but the experiments were conducted on different fields to prevent damage by continuous cropping. The area sizes of the fields were 0.03 and 0.04 ha for 2018 and 2019, respectively.
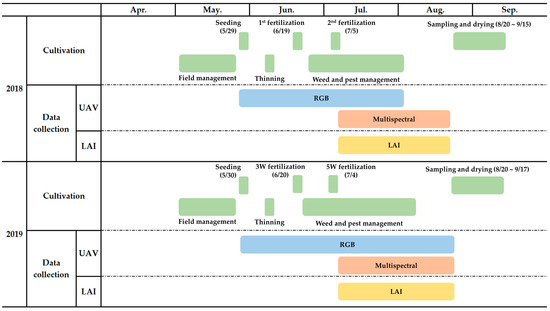
Figure 2.
The chart for the description of sweetcorn cultivation and data collection during two consecutive vegetation seasons of 2018 and 2019.
2.2. Collection of UAV Image Data and the Canopy Analyzer LAI Data
The RGB and multispectral image data collection using UAVs was carried out on 18, 21, 23, and 30 July and 13 August 2018; 26 July and 2, 5, 12, and 19 August in 2019. The data collection schedule was from the tasseling to harvesting stages. Tasseling is an important growth stage in maize breeding and seed production because the maize tassel is a typical sign indicating the transition from vegetative to reproductive growth and the most sensitive to temperatures [28,29,30]. The characteristics and configurations of aerial data acquisition by UAV were described in Table 1. The RGB images were taken by UAV, a “DJI Phantom3 advanced”, with RGB camera in both years. The aerial multispectral images were taken using the multispectral imaging sensor “Sequoia” equipped on the UAV “DJI Phantom3 advanced” in 2018 and on the UAV “DJI Mavic Pro” in 2019. Since measurements of passive reflectance sensors are influenced by time of day and solar elevation angle, it requires consideration of the angular variation in reflectance and ambient light fluctuations [31,32]. Therefore, the RGB and multispectral image data collection using UAVs measurements were made close to noon, between 10:00 a.m. and 2:00 p.m. on cloud-free and sunny days. UAV was flying at 15 m (2018) and 20 m (2019) altitude from ground level with 85% forward and side overlap rate. The aerial images were able to cover 0.03 and 0.04 ha for each year, and approximately 80 and 60 images were captured to cover sweetcorn field, respectively. The RGB images were taken from germination to recognize the location of each plant. The schedules for taking RGB images began from seeding and finished on end of July and August in 2018 and 2019, respectively. In particular, in 2019, the RGB images were collected longer time compared to the 2018 because of the confirmation for crop location minutely. Multispectral images that involved four spectral bands: green (G), red (R), red-edge (RE), and near-infrared (NIR) were taken from July to sampling day in both years. RGB and multispectral images were taken at intervals of one week. Directly before and after the flights, images of the MicaSense calibration panel were taken without casting shadow on the panels. The picture of the panel was taken at approximately chest level without shadowing the panel. The image processing software ‘Pix4D mapper’ (Pix4D, Lausanne, Switzerland) was used to create an orthomosaic image of RGB and multispectral images.

Table 1.
Characteristics and configuration of UAV utilization for data collection.
Many kinds of VIs have been represented to well correlate with the LAI in previous studies (e.g., [33,34,35]). In this study, the normalized difference vegetation index (NDVI) [36] and simple ratio (SR) [37], which were calculated as the near-infrared (NIR) divided by the red (R), were chosen as the VIs, because these indices are commonly and widely used in remote sensing applications. In addition, the enhanced vegetation index 2 (EVI2) [38] was calculated. The EVI2 is a form of EVI that does not demand the blue band to facilitate the use of data from sensors without that ability and a few studies have recently mentioned that the EVI2 is reasonable for estimating LAI [39,40]. These three indices were used to compare the plant-based LAI values. The three VIs are defined by the equations below.
The actual LAIs were measured using the canopy analyzer LAI-2200 (LI-COR, Lincoln, NE, USA) on the day of the UAV data measurement. In the measurement, the right and left sides of the targeted plant were measured once, and the average value was calculated. The canopy analyzer LAI-2200 sequence “AB.BA.B.B” (A—above canopy; B—below canopy) was adopted for collecting the LAI data, and the distance from the plant for each measurement step was one-eighth of the row spacing. The description of this section (Section 2.2) was simply instructed with the information on cultivation in Figure 2.
2.3. Production of Plant-Based Data
2.3.1. Generation of the Point Data for Each Plant
To generate the plant-based data, the locations of existing sweetcorn in the field were taken as the point data using QGIS version 3.4.3. For obtaining the locations accurately, RGB images were taken every week after the initial germination of the sweetcorn. When the germinated sweetcorn plants were found in the RGB picture, the picture was magnified to check the location and shape of the sweetcorn and the points were created on the top of the germinated sweetcorn (Figure 3A). Additional points for late-germinated objects were overwritten by comparing them with the previously taken RGB images (Figure 3B). As the plants grew, it was difficult to identify individual sweetcorn. Therefore, the points for the germinated sweetcorn were added to detect the same shape of the existing germinated crop by changing the color of the picture by dividing the blue channel by the red channel in the RGB images (Figure 3C). When all points are generated completely, coordinate data for sweetcorn locations were collected using the zonal statistics plugin in QGIS. The 1085 and 2024 sweetcorn were identified totally through the point generation process in 2018 and 2019, respectively.
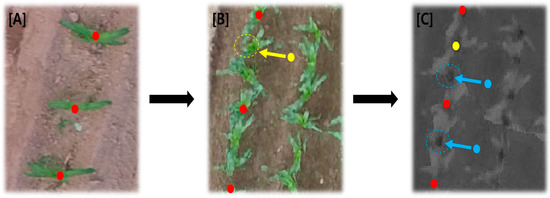
Figure 3.
Steps for placing the point data where the sweetcorn existed: (A) create the points (red) for the sweetcorn locations in the early germination; (B) add the points (yellow) for the late-germinated sweetcorn by comparing with the former RGB images; (C) adds the points (blue) for the late-germinated sweetcorn using the RGB values when it is difficult to identify in the RGB pictures.
2.3.2. Plant-Based Buffer Data
To create the plant-based buffer data, first, each plot was divided into rectangular buffers according to the planting distance. However, each rectangular buffer did not always contain the sweet corn point data in the center. Therefore, each center of the rectangular buffer was moved to the coordinates of the sweetcorn point data in Section 2.3.1. After calculating the difference between the center and each vertex coordinate value, the plant-based rectangular buffers that had a sweetcorn point in the center coordinate were created (Figure 4). For a comparative analysis with the plant-based rectangular buffer data, the circular buffers that also had a sweetcorn point in the center coordinate were generated at 1 and 3 m2 diameter size, and the VI values were extracted for each three buffers using zonal statistics plugin in QGIS.
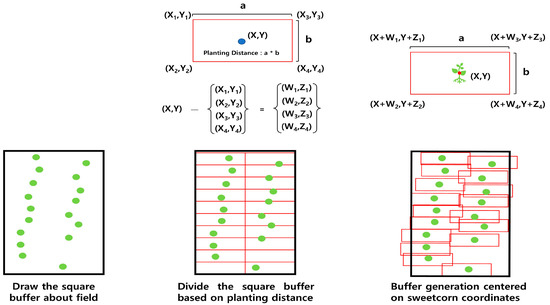
Figure 4.
Simple description for making plant−based buffer data: Before making the plant−based buffer, each buffer does not contain a plant, and the plants are arranged in disorder, regardless of the buffer. All buffers have a plant in the center after calculating the coordinates of each vortex based on the planting distance and generating the plant−based buffer.
2.4. Statistical Analysis
The regression analyses between the VI values and the yield data or the LAI using the canopy analyzer were conducted in Excel 2016. Kang et al. [41] tested the universal relationship between VIs and LAI using a global dataset of 1459 in situ quality-controlled a lot of crop LAIs, including maize, and collected Landsat satellite images and reported the best-fit regression. In this report, an exponential form was proposed between LAI and NDVI, and a power function was proposed in the relationship with EVI2 and SR. Our analyses followed this proposal. For predicting LAI using VIs, the regression analyses were carried out across the treatments because the prediction should be applied regardless of the treatments in this study. To estimate the importance to get all individual plant data in the field, one plot located outside of experimental field was selected and a density plot about the SR value of each plant was represented. Since each experimental plot had four rows, the lines were classified as the border section (neighboring the other plot), the outskirt section (neighboring the outside of the field), and the central section including two inner rows. Thirty samples of the center in the sections were selected for the density plot. The effects of the nitrogen fertilizer and planting density on each data including the actual yield were analyzed using a linear mixed model (LMM). The effects of the fertilizer and the density were considered as fixed effects, and the plot was assumed as a random effect. For the yield analyses, the LAI was additionally considered as a fixed effect. The density plot and LMM were analyzed using R version 4.1.3 (R core team, 2022).
3. Results
3.1. Relationship between the LAI Using the Analyzer and the VI Values
The correlation between the VI values and the measured LAI in each year is represented in Figure 5 and Figure 6. The best-fit regression lines with the LAI were the NDVI with a 3 m2 buffer size (R2 = 0.6695) and the SR of the plant-based buffer (R2 = 0.8077) in 2018 and 2019, respectively. However, regarding the average of the determination coefficients (R2) in the VI values, the coefficients of the plant-based buffer were highest in both years (R2 = 0.6264 in 2018 and R2 = 0.7501 in 2019). Using the 3 m2 buffer size, the measurements located at the edge of the field often included weeds or bare soil surface, and using the 1 m2 buffer size, only the center of the maize was contained (picture not shown). In a comparison of the VI values, the coefficients with the NDVI were the highest, but the coefficients with the SR were almost the same as the NDVI in the plant-based buffer in 2018. In 2019, the coefficients with the SR were clearly the highest for all buffers. In addition, RMSE values between actual LAI and LAI predicted by SR were 0.669, 0.679, and 0.685 on plant-based, 3 m2, and 1 m2 in 2018, respectively, and 1.184, 1.194, and 1.213 on plant-based, 3 m2, and 1 m2 in 2019, respectively.
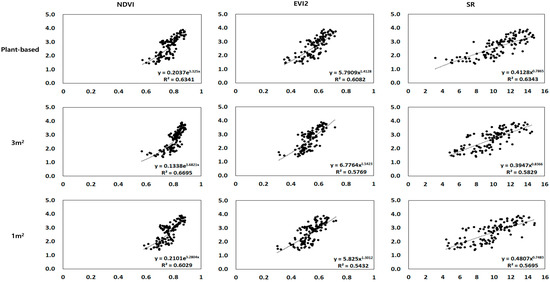
Figure 5.
Scatter plots and fitted linear regression lines for the leaf area index (LAI) using the canopy analyzer LAI-2200 against the Normalized Vegetation Index (NDVI), Enhanced Vegetation Index 2 (EVI2), and Simple Ratio (SR) for all UAV data collection dates in 2018 (x—VIs, y—measured LAI). The VIs were obtained for each plant-based, 3 m2, and 1 m2 buffer.
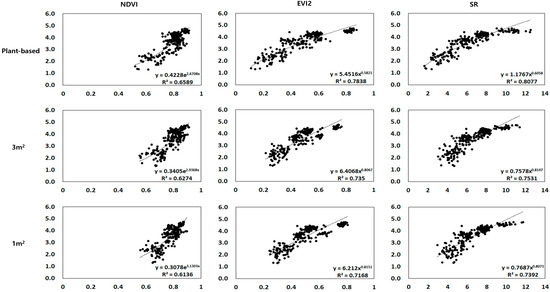
Figure 6.
Scatter plots and fitted linear regression lines of the leaf area index (LAI) using the canopy analyzer LAI-2200 against the Normalized Vegetation Index (NDVI), Enhanced Vegetation Index 2 (EVI2), and Simple Ratio (SR) for all UAV data collection dates in 2019 (x—VIs, y—measured LAI). The VIs were obtained for each plant-based, 3 m2, and 1 m2 buffer.
3.2. Relationship between the Yield and LAI (or VI)
We conducted regression analyses between the measured yield and the SR values of the plant-based buffer, which was the most promising in relation to the LAI (Figure 7). In this result, the determination coefficients were high (above 0.7) in both years. Interestingly, using the LAI predicted by the SR, based on the analyses in Figure 5 and Figure 6, the coefficients were higher than that when using the SR values (above 0.75).
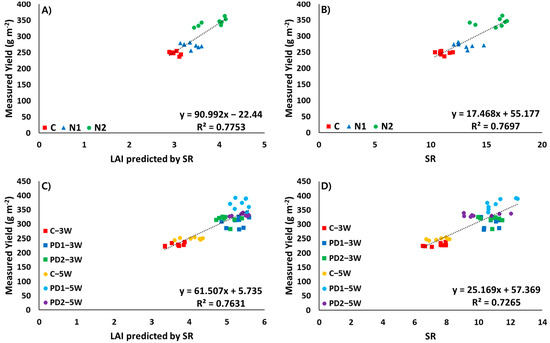
Figure 7.
Regression analysis between the measured yield and (A) LAI predicted by the SR in 2018; (B) SR value in 2018; (C) LAI predicted from the SR in 2019; (D) SR value in 2019.
3.3. Plant-Based Data Analysis of the Plots
In both 2018 and 2019, there were significant differences in the SR values in the comparative analysis by section, and, particularly, there was a strong significant difference in the comparison between the border section and the outskirt section, which are usually excluded from statistical analyses (Figure 8). In the usual field experiment, 551 samples and 1003 samples were ruled out in 2018 and 2019, respectively.
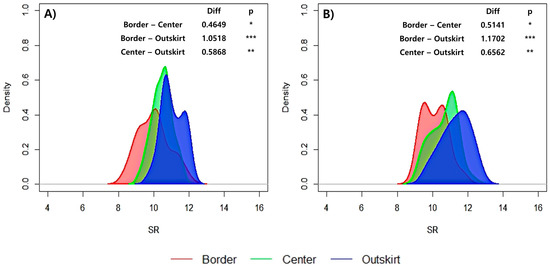
Figure 8.
Density plots for the border detection effect in (A) 2018 and (B) 2019. (*, **, and *** indicate statistical significance among the lines at α = 0.05, 0.01, and 0.001, respectively).
3.4. Statistical Analysis of the LAI and Yield
Table 2 and Table 3 show the results of the LMM for the LAI and measured yield in 2018 and 2019. In 2018, the result of the LAI predicted by the SR values was similar to that measured by the canopy analyzer, which the effect of N2 was significant. However, the results of the yield were different: only the effect of N2 was significant in canopy analyzer but, using the SR values, both nitrogen levels significantly heightened the yield and LAI had significant effect to the yield. In 2019, LAI was significantly higher with the higher planting density using the canopy analyzer and the SR. The effect of additional fertilization to LAI was found using the LAI predicted by the SR values but the effect was not significant using the canopy analyzer. The yield increased as the planting density increased, and the additional fertilization and the interaction between the PD and the additional fertilization had significant effects on the yield in both the measured LAI and SR.
Table 2.
Linear mixed model analysis of the LAI and the measured yield in 2018.
Table 3.
Linear mixed model analysis of the LAI and measured yield in 2019.
4. Discussion
Current agricultural field experiments often have many limitations when researching the effects on even a few treatments of some individual plants because of a shortage of human and time resources and various effects of environments. In order to cope with this situation, the use of RS by two platforms, satellites and UAV, was utilized in agriculture. Satellite images are highlighted for assessment of the field condition, but UAVs were able to distinguish between changes caused by abiotic or biotic stresses undetected from satellite images [42]. Based on this, UAVs remote sensing could be considered to have an ability to analyze individual plants. In this study, to propose a new method of applying field experiments, the collection of all individual plant data from small-scale sweetcorn field experiments using UAV remote sensing was carried out. The three VIs could predict the LAI of individual plants and, in particular, the SR well-predicted the LAI and the yield of sweetcorn at different plant densities and different timings of additional nitrogen fertilizer application.
Several studies were carried out to estimate the LAI through remote sensing by comparing the ground-based LAI. Various kinds of VIs, derived from the canopy reflectance in RGB and multispectral images, such as NDVI [16], EVI [17], and SR [18], were proposed. This study suggests that the most useful index could be the SR determined from a comparison of the three VIs because the determination coefficient was relatively high. This result agrees with the results in [43,44]. Hashimoto et al. [27] reported that simulated changes in NDVI, EVI2, and SR according to the LAI increased under various solar radiation conditions. As a result, the high sensitivity of the SR was pointed out. It was considered that the change in the SR was sensitive to the changes in the LAI in this study. Accordingly, the SR index could have potential in our proposed experimental design.
Three buffer types were compared in this paper: plant-based rectangle buffers and circular buffers 1 and 3 m2 in size. In the results, the plant-based buffer showed the highest significance and the lowest RMSE values with the measured LAI. As mentioned previously, the 3 m2 buffer size often contained weeds and bare soil surface, and in the 1 m2 buffer size, only the center of the maize was contained. According to the effect of bare soil for measuring the VIs, the soil effects on the VIs were divided into primary variations associated with the brightness of the bare soils, and secondary variations attributed to the color differences among the bare soils [45]. The plant-based buffer did not have such problems. However, generating plant-based data may not be as easy for all field experiments compared to the small-scale experiments for which we could generate. Future studies are needed for the easy detection of plants that exist in fields.
An enormous amount of individual plant-based data using the UAV may change upcoming agricultural field experiments. In this study, many of the LAI data for the individual plants predicted by the SR found effects of additional nitrogen fertilizer application time, which the much smaller size of the LAI dataset using the canopy analyzer could not find. Our proposed method could easily obtain many replications of the individual plants. The amount and the application time of nitrogen fertilizer affect the growth and yield of plants well. However, occasionally, the effects of nitrogen could not be found in field experiments. If individual plant data could be as easily obtained as in this study, the effects of various management practices might be found in field experiments. In addition, if experiments with multiple treatments on the field are designed, the researcher might be able to obtain data on individual plants and understand the complex impacts of the treatments. Using all of the individual plant data from the field, the border effect, which is defined as the phenomenon of crops at the edge of the field [46], may be analyzed in the field experiment as a forecast of Figure 8. The difference between the border section and the outskirt section in this study was found important in field experiments. The gradual spread of pest and insect damage in border sections indicated that side rows of each plot should serve as guard rows.
In conclusion, this study indicated that SR values in the plant-based buffer using a UAV were better to evaluate the LAI of individual plants in fields, and the LAI was related to the yield. Furthermore, in this method, the various effects of treatments could be detected since all of the individual plant data were taken. Our proposed method should contribute to the establishment of a new field experiment methodology.
Author Contributions
Conceptualization, K.H.; Methodology, N.H., Formal analysis, H.J.; Software, H.J., R.Y., Y.Y. and S.Y.; Investigation, H.J., R.Y., Y.Y. and S.Y.; Writing—original draft preparation, H.J.; Writing—review and editing, R.T. and N.H.; Supervision, K.H. All authors have read and agreed to the published version of the manuscript.
Funding
This work is partly supported by JICA-JST SATREPS JPMJSA 1909 and JSPS KAKENHI 21H02172.
Institutional Review Board Statement
Not applicable.
Informed Consent Statement
Not applicable.
Data Availability Statement
Not applicable.
Conflicts of Interest
The authors declare no conflict of interest.
Abbreviations
The following abbreviations are used in this manuscript.
| UAV | Unmanned Aerial Vehicle |
| LAI | Leaf Area Index |
| VIs | Vegetation Indices |
| NDVI | Normalized Difference Vegetation Index |
| EVI2 | Enhanced Vegetation Index 2 |
| SR | Simple Ratio |
| PD | Plant Density |
| 3W | 3 Weeks of Sowing |
| 5W | 5 Weeks of Sowing |
| NIR | Near-Infrared Spectral Band (770–810 nm) |
| RED | Red Spectral Band (640–680 nm) |
| LMM | Linear Mixed Model |
References
- Shirokov, Y.; Tikhnenko, V. Analysis of Environmental Problems of Crop Production and Ways to Solve Them. E3S Web Conf. 2021, 273, 01025. [Google Scholar] [CrossRef]
- Box, P.; Chuka, P.O.B. Effects of Organic Manure Application, Seeding Rate and Planting Methods on Teff Grain Yields and Biomass Production in, Marsabit Kenya. East Afr. Agric. For. 2022, 88, 190–199. [Google Scholar]
- Pyakurel, A.; Dahal, B.R.; Rijal, S. Effect of Molasses and Organic Fertilizer in Soil Fertility and Yield of Spinach in Khotang, Nepal. Int. J. Appl. Sci. Biotechnol. 2019, 7, 49–53. [Google Scholar] [CrossRef]
- Sher, A.; Hassan, F.U.; Ali, H.; Hussain, M.; Sattar, A. Enhancing Forage Quality through Appropriate Nitrogen Dose, Seed Rate and Harvest Stage, in Sorghum Cultivars Grown in Pakistan. Grassl. Sci. 2017, 63, 15–22. [Google Scholar] [CrossRef]
- Toscano, P.; Castrignanò, A.; Di Gennaro, S.F.; Vonella, A.V.; Ventrella, D.; Matese, A. A Precision Agriculture Approach for Durum Wheat Yield Assessment Using Remote Sensing Data and Yield Mapping. Agronomy 2019, 9, 437. [Google Scholar] [CrossRef]
- Lobell, D.B. The Use of Satellite Data for Crop Yield Gap Analysis. Field Crops Res. 2013, 143, 56–64. [Google Scholar] [CrossRef]
- Matese, A.; Toscano, P.; Di Gennaro, S.F.; Genesio, L.; Vaccari, F.P.; Primicerio, J.; Belli, C.; Zaldei, A.; Bianconi, R.; Gioli, B. Intercomparison of UAV, Aircraft and Satellite Remote Sensing Platforms for Precision Viticulture. Remote Sens. 2015, 7, 2971–2990. [Google Scholar] [CrossRef]
- Marzuki, O.F.; Teo, E.Y.L.; Rafie, A.S.M. The Mechanism of Drone Seeding Technology: A Review. Malays. For. 2021, 84, 349–358. [Google Scholar]
- Spoorthi, S.; Shadaksharappa, B.; Suraj, S.; Manasa, V.K. Freyr Drone: Pesticide/ Fertilizers Spraying Drone. In Proceedings of the 2017 2nd International Conference on Computing and Communications Technologies (ICCCT), Chennai, India, 23–24 February 2017; pp. 252–255. [Google Scholar]
- Bendig, J.; Willkomm, M.; Tilly, N.; Gnyp, M.L.; Bennertz, S.; Qiang, C.; Miao, Y.; Lenz-Wiedemann, V.I.S.; Bareth, G. Very high resolution crop surface models (CSMs) from UAV-based stereo images for rice growth monitoring in Northeast China. Int. Arch. Photogramm. Remote Sens. Spat. Inf. Sci. 2013, 40, 45–50. [Google Scholar] [CrossRef]
- Fattori Junior, I.M.; dos Santos Vianna, M.; Marin, F.R. Assimilating Leaf Area Index Data into a Sugarcane Process-Based Crop Model for Improving Yield Estimation. Eur. J. Agron. 2022, 136, 126501. [Google Scholar] [CrossRef]
- Szabó, A.; Mousavi, S.M.N.; Bojtor, C.; Ragán, P.; Nagy, J.; Vad, A.; Illés, Á. Analysis of Nutrient-Specific Response of Maize Hybrids in Relation to Leaf Area Index (LAI) and Remote Sensing. Plants 2022, 11, 1197. [Google Scholar] [CrossRef]
- Mendoza, C.; Ramírez, C.; Martínez, A.; Ojeda, W.; Ruelas, J.; Ascencio, R.; López, A.; Núñez, F. Leaf Area and Its Impact in Yield and Quality of Greenhouse Tomato (Solanum lycopersicum L.). Postgrad. Coll. Mex. Texcoco 2022, 54, 57–69. [Google Scholar] [CrossRef]
- Dwyer, L.M.; Stewart, D.W. Effect of Leaf Age and Position on Net Photosynthetic Rates in Maize (Zea mays L.). Agric. For. Meteorol. 1986, 37, 29–46. [Google Scholar] [CrossRef]
- Fang, H.; Ye, Y.; Liu, W.; Wei, S.; Ma, L. Continuous Estimation of Canopy Leaf Area Index (LAI) and Clumping Index over Broadleaf Crop Fields: An Investigation of the PASTIS-57 Instrument and Smartphone Applications. Agric. For. Meteorol. 2018, 253–254, 48–61. [Google Scholar] [CrossRef]
- Goswami, S.; Gamon, J.; Vargas, S.; Tweedie, C. Relationships of NDVI, Biomass, and Leaf Area Index (LAI) for six key plant species in Barrow, Alaska. PeerJ. 2015, 3, e911v–e913v. [Google Scholar]
- Son, N.T.; Chen, C.F.; Chen, C.R.; Chang, L.Y.; Duc, H.N.; Nguyen, L.D. Prediction of Rice Crop Yield Using MODIS EVI− LAI Data in the Mekong Delta, Vietnam. Int. J. Remote Sens. 2013, 34, 7275–7292. [Google Scholar] [CrossRef]
- Brown, L.; Chen, J.M.; Leblanc, S.G.; Cihlar, J. A Shortwave Infrared Modification to the Simple Ratio for LAI Retrieval in Boreal Forests: An Image and Model Analysis. Remote Sens. Environ. 2000, 71, 16–25. [Google Scholar] [CrossRef]
- Yao, X.; Wang, N.; Liu, Y.; Cheng, T.; Tian, Y.; Chen, Q.; Zhu, Y. Estimation of Wheat LAI at Middle to High Levels Using Unmanned Aerial Vehicle Narrowband Multispectral Imagery. Remote Sens. 2017, 9, 1304. [Google Scholar] [CrossRef]
- Tavakoli, H.; Mohtasebi, S.S.; Alimardani, R.; Gebbers, R. Evaluation of Different Sensing Approaches Concerning to Nondestructive Estimation of Leaf Area Index (LAI) for Winter Wheat. Int. J. Smart Sens. Intell. Syst. 2014, 7, 337–359. [Google Scholar] [CrossRef]
- Lee, H.-S.; Lee, K.-S. Effect of Red-Edge Band to Estimate Leaf Area Index in Close Canopy Forest. Korean J. Remote Sens. 2017, 33, 571–585. [Google Scholar]
- Moon, H.-G.; Choi, T.-Y.; Kang, D.-I.; Cha, J.-G. Study on the Estimation of Leaf Area Index (LAI) of Using UAV Vegetation Index and Tree Height Data. J. Korean Assoc. Geogr. Inf. Stud. 2018, 21, 158–174. [Google Scholar]
- Liu, S.; Zeng, W.; Wu, L.; Lei, G.; Chen, H.; Gaiser, T.; Srivastava, A.K. Simulating the Leaf Area Index of Rice from Multispectral Images. Remote Sens. 2021, 13, 3663. [Google Scholar] [CrossRef]
- Gong, Y.; Yang, K.; Lin, Z.; Fang, S.; Wu, X.; Zhu, R.; Peng, Y. Remote Estimation of Leaf Area Index (LAI) with Unmanned Aerial Vehicle (UAV) Imaging for Different Rice Cultivars throughout the Entire Growing Season. Plant Methods 2021, 17, 88. [Google Scholar] [CrossRef] [PubMed]
- Qi, H.; Zhu, B.; Wu, Z.; Liang, Y.; Li, J.; Wang, L.; Chen, T.; Lan, Y.; Zhang, L. Estimation of Peanut Leaf Area Index from Unmanned Aerial Vehicle Multispectral Images. Sensors 2020, 20, 6732. [Google Scholar] [CrossRef]
- Zhou, X.; Zheng, H.B.; Xu, X.Q.; He, J.Y.; Ge, X.K.; Yao, X.; Cheng, T.; Zhu, Y.; Cao, W.X.; Tian, Y.C. Predicting Grain Yield in Rice Using Multi-Temporal Vegetation Indices from UAV-Based Multispectral and Digital Imagery. ISPRS J. Photogramm. Remote Sens. 2017, 130, 246–255. [Google Scholar] [CrossRef]
- Hashimoto, N.; Saito, Y.; Maki, M.; Homma, K. Simulation of Reflectance and Vegetation Indices for Unmanned Aerial Vehicle (UAV) Monitoring of Paddy Fields. Remote Sens. 2019, 11, 2119. [Google Scholar] [CrossRef]
- Lu, H.; Cao, Z.; Xiao, Y.; Fang, Z.; Zhu, Y.; Xian, K. Fine-Grained Maize Tassel Trait Characterization with Multi-View Representations. Comput. Electron. Agric. 2015, 118, 143–158. [Google Scholar] [CrossRef]
- Kumar, A.; Taparia, M.; Rajalakshmi, P.; Guo, W.; Balaji Naik, B.; Marathi, B.; Desai, U.B. UAV Based Remote Sensing for Tassel Detection and Growth Stage Estimation of Maize Crop Using Multispectral Images. In Proceedings of the IGARSS 2020-2020 IEEE International Geoscience and Remote Sensing Symposium, Waikoloa, HI, USA, 26 September–2 October 2020; pp. 1588–1591. [Google Scholar]
- Zan, X.; Zhang, X.; Xing, Z.; Liu, W.; Zhang, X.; Su, W.; Liu, Z.; Zhao, Y.; Li, S. Automatic Detection of Maize Tassels from UAV Images by Combining Random Forest Classifier and VGG16. Remote Sens. 2020, 12, 3049. [Google Scholar] [CrossRef]
- de Souza, R.; Buchhart, C.; Heil, K.; Plass, J.; Padilla, F.M.; Schmidhalter, U. Effect of Time of Day and Sky Conditions on Different Vegetation Indices Calculated from Active and Passive Sensors and Images Taken from Uav. Remote Sens. 2021, 13, 1691. [Google Scholar] [CrossRef]
- Erdle, K.; Mistele, B.; Schmidhalter, U. Comparison of Active and Passive Spectral Sensors in Discriminating Biomass Parameters and Nitrogen Status in Wheat Cultivars. Field Crops Res. 2011, 124, 74–84. [Google Scholar] [CrossRef]
- Ali, M.; Montzka, C.; Stadler, A.; Menz, G.; Thonfeld, F.; Vereecken, H. Estimation and Validation of RapidEye-Based Time-Series of Leaf Area Index for Winter Wheat in the Rur Catchment (Germany). Remote Sens. 2015, 7, 2808–2831. [Google Scholar] [CrossRef]
- Campos-Taberner, M.; García-Haro, F.J.; Camps-Valls, G.; Grau-Muedra, G.; Nutini, F.; Crema, A.; Boschetti, M. Multitemporal and Multiresolution Leaf Area Index Retrieval for Operational Local Rice Crop Monitoring. Remote Sens. Environ. 2016, 187, 102–118. [Google Scholar] [CrossRef]
- Ogawa, S.; Makino, I.; Fukuo, A.; Saito, G. Seasonal Profiles of NDVI for Paddy Fields and Their Leaf Area Index Estimates. J. Remote Sens. Soc. Jpn. 2000, 20, 17–26. [Google Scholar]
- Na, S.-I.; Hong, S.Y.; Kim, Y.-H.; Lee, K.-D.; Jang, S.-Y. Estimating Leaf Area Index of Paddy Rice from RapidEye Imagery to Assess Evapotranspiration in Korean Paddy Fields. Korean J. Soil Sci. Fertil. 2013, 46, 245–252. [Google Scholar] [CrossRef]
- Fukuda, S.; Koba, K.; Okamura, M.; Watanabe, Y.; Hosoi, J.; Nakagomi, K.; Maeda, H.; Kondo, M.; Sugiura, D. Novel Technique for Non-Destructive LAI Estimation by Continuous Measurement of NIR and PAR in Rice Canopy. Field Crops Res. 2021, 263, 108070. [Google Scholar] [CrossRef]
- Jiang, Z.; Huete, A.R.; Didan, K.; Miura, T. Development of a Two-Band Enhanced Vegetation Index without a Blue Band. Remote Sens. Environ. 2008, 112, 3833–3845. [Google Scholar] [CrossRef]
- Liu, J.; Pattey, E.; Jégo, G. Assessment of Vegetation Indices for Regional Crop Green LAI Estimation from Landsat Images over Multiple Growing Seasons. Remote Sens. Environ. 2012, 123, 347–358. [Google Scholar] [CrossRef]
- Rocha, A.V.; Shaver, G.R. Advantages of a Two Band EVI Calculated from Solar and Photosynthetically Active Radiation Fluxes. Agric. For. Meteorol. 2009, 149, 1560–1563. [Google Scholar] [CrossRef]
- Kang, Y.; Özdoğan, M.; Zipper, S.C.; Román, M.O.; Walker, J.; Hong, S.Y.; Marshall, M.; Magliulo, V.; Moreno, J.; Alonso, L.; et al. How Universal Is the Relationship between Remotely Sensed Vegetation Indices and Crop Leaf Area Index? A Global Assessment. Remote Sens. 2016, 8, 597. [Google Scholar] [CrossRef]
- Messina, G.; Peña, J.M.; Vizzari, M.; Modica, G. A Comparison of UAV and Satellites Multispectral Imagery in Monitoring Onion Crop. An Application in the ‘Cipolla Rossa Di Tropea’ (Italy). Remote Sens. 2020, 12, 3424. [Google Scholar] [CrossRef]
- Peng, Y.; Gitelson, A.A. Application of Chlorophyll-Related Vegetation Indices for Remote Estimation of Maize Productivity. Agric. For. Meteorol. 2011, 151, 1267–1276. [Google Scholar] [CrossRef]
- Kross, A.; Znoj, E.; Callegari, D.; Kaur, G.; Sunohara, M.; van Vliet, L.; Rudy, H.; Lapen, D.; McNairn, H. Evaluation of an Artificial Neural Network Approach for Prediction of Corn and Soybean Yield. In Proceedings of the 14th International Conference on Precision Agriculture, Montreal, QC, Canada, 24–27 June 2018. [Google Scholar]
- Huete, A.R.; Tucker, C.J. Investigation of Soil Influences in AVHRR Red and Near- Infrared Vegetation Index Imagery. Int. J. Remote Sens. 2007, 12, 1223–1242. [Google Scholar] [CrossRef]
- Kanoe, S.; Kiyoshi, T. An Analysis of the Border Effect in the Rice Paddy Fields. Jpn. J. Crop Sci. 1983, 2, 168–176. [Google Scholar]


Disclaimer/Publisher’s Note: The statements, opinions and data contained in all publications are solely those of the individual author(s) and contributor(s) and not of MDPI and/or the editor(s). MDPI and/or the editor(s) disclaim responsibility for any injury to people or property resulting from any ideas, methods, instructions or products referred to in the content. |
© 2023 by the authors. Licensee MDPI, Basel, Switzerland. This article is an open access article distributed under the terms and conditions of the Creative Commons Attribution (CC BY) license (https://creativecommons.org/licenses/by/4.0/).