Article

Fertilizer Performance of a Digestate from Swine Wastewater as Synthetic Nitrogen Substitute in Maize Cultivation: Physiological Growth and Yield Responses

by
Eduardo L. Buligon
1,
Luiz A. M. Costa
1,
Jorge de Lucas, Jr.
2,
Francielly T. Santos
1,
Piebiep Goufo
3,* and
Monica S. S. M. Costa
1,*
1
Agricultural Engineering Graduate Program, Universidade Estadual do Oeste do Paraná, Street University 2069, Cep, Cascavel 85819-110, Brazil
2
Departamento de Engenharia Rural, Universidade Estadual Paulista “Júlio de Mesquita Filho”, Via de Acesso Prof. Paulo Donato Castellane s/n—Jaboticabal/SP—Cep, São Paulo 14884-900, Brazil
3
CITAB—Centro de Investigação e Tecnologias Agroambientais e Biológicas, Universidade de Trás-os-Montes e Alto Douro, Quinta de Prados, 5000–801 Vila Real, Portugal
*
Authors to whom correspondence should be addressed.
Agriculture 2023, 13(3), 565; https://doi.org/10.3390/agriculture13030565
Submission received: 8 December 2022 / Revised: 20 February 2023 / Accepted: 22 February 2023 / Published: 26 February 2023

Abstract

:
Nitrogen (N) is the primary nutrient required for plant growth. During the last few decades, there has been extensive use of synthetic N-containing fertilizers in agriculture, resulting in increased environmental pollution. In this study, the feasibility of replacing synthetic N with biofertilizer in maize cultivation was investigated. A liquid biofertilizer (digestate obtained from the anaerobic digestion of swine wastewater) was obtained and applied to large plots as a total (100%) or partial (50%) substitute for synthetic N fertilizer. Moreover, the most efficient fertilization mode, i.e., basal versus foliar application, was studied. Physiological growth indices, leaf nutritional status, and grain yield were assessed for each biofertilization treatment and compared with the conventional treatment with synthetic minerals. Compared with the conventional treatment, the total substitution of synthetic N by the biofertilizer (basal application) did not affect the growth parameters and grain yield of maize; the other treatments usually resulted in lower growth rates and yields, although not statistically significant (p ≥ 0.05). No difference was observed among the treatments for the contents of N, P, K, or Mg in the leaves. Generally, the highest means for Fe, Ca, Cu, Zn, and Mn contents in leaves were observed after in-row broadcast of synthetic fertilizers or basal application of the digestate as a total substitute for synthetic N, with a significant effect for Fe (p < 0.05). The mode of the biofertilizer application did not have any significant effect on either growth parameters or leaf nutrients. The data show that under the specific conditions of the study, the total substitution of mineral N with basal application of biofertilizer is the best strategy for minimizing the use of synthetic chemicals in maize cultivation without yield penalties.

1. Introduction

Brazil is nowadays a major player in international agricultural production and export [1,2]. However, Brazil is heavily dependent on the import of NPK (nitrogen, phosphorus, and potassium) fertilizers. It is estimated that 85% of the fertilizers used in Brazil are imported from the global market [1]. These data have prompted research on alternative local nutrient sources in agriculture, such as stabilized organic wastes, e.g., compost, vermicomposto, and biofertilizer. In 2020, manure production in Brazil was estimated at 61.8 million tons, of which 14.9 million tons was from poultry litter and 46.9 million tons from swine and cattle manure [3].
Before application to agricultural soils as a source of nutrients, organic waste needs to be stabilized, i.e., active biological decomposition processes need to be stopped to minimize disruption of the soil-plant-root interface as much as possible [4,5,6,7]. Stabilization can be achieved through several processes such as composting, vermicomposting, mechanical-biological treatments, or anaerobic digestion to produce bio-based products called “biofertilizers” [6,8,9,10,11]. Anaerobic digestion involves the degradation of organic matter in an oxygen-free environment to release a gas known as biogas and an organic effluent + residue called digestate [12,13].
According to Koszel and Lorencowicz [14], the main factors determining the use of digestates as biofertilizers are the physicochemical characteristics of the effluent and residue, the edapho-climatic conditions, and local regulations. Locoli et al. [15] found that digestates obtained from the anaerobic digestion of cattle manure, chicken litter, swine manure, and onion wastes had chemical and spectroscopic characteristics (e.g., C/N ratio, ammonium (NH4+) to nitrogen ratio (NH4+/N), and proportion of short-chain organic acids) similar to those of untreated wastes. Soils amended with the digestates in the study by Locoli et al. [15] emitted less CO2 than soils amended with manure, and the fertilizing effect of the digestates on lettuce growth was related to the content of NH4+ [15]. However, recent review papers have found that feedstock, processing technology, and process operating conditions strongly influence the characteristics of digestates, and that without comprehensive management strategies, digestates can contribute to nutrient pollution [6,13]. Thus, each locally produced digestate should be assessed on its own merit based on optimal parameters suitable for adequate microbial activity such as the C/N ratio (15–30), the psychrophilic temperature (<20 °C), the mesophilic temperature (35–37 °C), and the thermophilic temperature (55 °C) [13].
Using indicators such as N uptake, P recovery rate, soil microbial stimulation, or yield, the biofertilizing effect of various digestates on different plants in different climates and soils has been confirmed. Results from a trial in Belgium indicated that the liquid fraction of a digestate obtained from swine manure could substitute synthetic N fertilizers without maize yield losses [16]. Tsachidou et al. [17] reported that the partial substitution of chemical fertilizers with a raw digestate from bovine manure as the sole source of N reduced the concentration of NO3− in the soil without impacting biomass yield and N content in a pasture system. Zilio et al. [18] concluded that the maize grain yield obtained from plants grown in a soil that received a sewage sludge-based digestate is equivalent to the yield obtained from plants grown using urea. The abovementioned three examples show that a stable digestate can be used as a bio-based fertilizer to replace mineral N fertilizers without yield loss or without increasing the risk of environmental pollution. However, only a few large-scale studies have been conducted on the effects of digestates on crop growth. This highlights the need for more studies that contribute different variables to decision making on the use of biofertilizers in agriculture. Further studies in different locations are essential to gather the necessary information to formulate standardized international protocols for researchers and operators, to develop best management practices for farmers, and to promote digestate product commercialization as part of the organic waste circular economy paradigm.
The study reported in this paper aimed to contribute to the topic by testing different biofertilizer doses and application techniques. Specifically, the effects of a digestate from swine wastewater were evaluated on maize physiology, considering four application scenarios: (i) soil application with a total (100%) replacement of the amount of recommended mineral N; (ii) foliar application with a total (100%) replacement of the amount of recommended mineral N; (iii) soil application with a partial (50%) replacement of the amount of recommended mineral N; and (iv) foliar application with a partial (50%) replacement of the amount of recommended mineral N. The impact of the digestate on maize production was compared to that of the conventional fertilization practice using synthetic fertilizers. The applied treatments were evaluated over six months, with a focus on leaf morphology, physiological indices, dry matter (DM) content in maize, and grain yield.

2. Materials and Methods

2.1. Study Area

The field experiment was conducted at the Experimental Station of the Agricultural Engineering Department of the Western Paraná State University (UNIOESTE) in Cascavel municipality, PR, Brazil. Cascavel is located geographically between 24°57′21″ S and 53°27′19″ W. According to the Köppen–Geiger classification system, the predominant climate in Cascavel is Cfa. The Cfa climate is characterized by infrequent frosts, hot summers, and a trend of rainfall concentration in the summer [19]. The average annual temperature, atmospheric pressure, and rainfall at the experimental site were 20 °C, 936.34 hPa, and 1841 mm, respectively. Soil samples at the experimental site were collected from 0–20 cm depths. The samples were bulked, air dried, gently crushed, and sieved through a 2 mm sieve before analyses by Solanalise Central De Analises Ltd., an accredited laboratory in Cascavel. The clay-textured soil at the site was classified as Dystroferric Red Latosol (Oxisol), and its chemical characteristics are shown in Table 1.

2.2. Materials

2.2.1. Test Crop

The maize cultivar used in this study was the hybrid P3380HR. The preceding crop was soybean. Following soybean harvesting, atrazine 500 SC (Nortox, Arapongas, Minas Gerais, Brazil) was applied at 1.0 kg ha−1 to control the remaining crops and weeds before maize planting. Maize was mechanically broadcast-seeded in March 2021 at a density of 2.8 seeds per m2. After seedling emergence 5 d after sowing (DAS), plants were thinned to one plant per hole to homogenize the planting and avoid any influence of spacing and shading on nutrient absorption by individual plants. Harvesting occurred manually in August 2021. Insect control focused on the maize leafhopper, Dalbulus maidis, with three applications of the insecticide acephate 750 (Ameribrás, Cotia, São Paulo, Brazil) at 1.0 kg ha−1 and Galil 300 SC (Adama, Londrina, Paraná, Brazil) at 250 mL ha−1. No other standard agricultural practices, e.g., irrigation, were implemented.

2.2.2. Mineral Fertilizers

The mineral fertilizers used in this study were urea (46% N), potassium chloride (60% K2O), and single superphosphate (18% P2O5, 17.3% Ca, 3.3% Mg, and 5% S). Mineral fertilizers were obtained from a local vendor. The nutritional recommendations for maize were calculated based on the soil characteristics in Table 1, following the methodology proposed by the Paraná State Handbook for Fertilization and Liming [20]: 120 kg ha−1 of N, 110 kg ha−1 of P2O5, and 70 kg ha−1 of K2O.

2.2.3. Biofertilizer

The biofertilizer was produced by the Laboratory of Agroindustrial Waste Analysis of UNIOESTE using swine wastewater (1.78% of total solids). Anaerobic digestion of the swine wastewater was performed in a horizontal tubular benchtop reactor tank operated in a semi-continuous flow with a volume of 60 L, a hydraulic retention time of 30 d, and a mesophilic-controlled temperature of 35 ± 1 °C. The obtained liquid digestate was used as biofertilizer without any post-processing treatment. The biofertilizer was stored in closed plastic barrels at room temperature until further use.
The biofertilizer was sampled and analyzed to determine its physicochemical characteristics and calculate the amount to be applied to the field. All chemicals used for the analyses were obtained from Química Moderna (Barueri, São Paulo, Brazil). Total Kjeldahl N was determined by digesting the samples with sulfuric acid, followed by distillation and titration using 0.0025 mol of H2SO4 [21]. The concentrations of P and K were determined by digesting the samples in a nitric-perchloric acid solution (3:1) with an external heat source, followed by dilution and filtration. Phosphorus was detected by measuring the absorbance at a wavelength of 725 nm in a 700 Plus UV/Vis spectrophotometer (Femto Indústria e Comércio de Instrumentos, São Paulo, São Paulo, Brazil) using the ascorbic acid method. Potassium was quantified using a DM-62 flame photometer (Digimed, Campo Grande, Mato Grosso do Sul, Brazil) as described by Malavolta et al. [21]. The levels of micronutrients (Fe, Zn, Cu, and Mn) and secondary macronutrients (Mg and Ca) were determined by atomic absorption spectroscopy (Shimadzu AA6300, Tokyo, Japan) prior to the digestion of samples with a nitric-perchloric solution (3:1) [22]. The results of the analysis are presented in Table 2.

2.3. Experimental Design and Treatments

The experiment was conducted in a completely randomized block design with five treatments and four replications, totaling 20 plots spread across the field. Each of these plots was 3.2 m wide and 10 m long. The total area occupied by the experiment was 520 m2, 13 m wide and 40 m long. The treatments consisted of two doses of biofertilizer (100 and 50%) established based on the recommended rate of N for maize cultivation in Paraná State [20], two forms of application (basal application on the soil surface and foliar application on the whole plant), and one control treatment (synthetic urea, potassium chloride, and single superphosphate as mineral fertilizers). A detailed description of these treatments is provided in Table 3.
Based on the chemical characterization of the digestate and the composition of synthetic chemicals, a combination of biofertilizers and mineral fertilizers was prepared. All combinations were made ensuring no limiting nutrients and the same N content for all treatments but with 100 and 50% reduced synthetic N amounts for T1 and T2 as well as T3 and T4, respectively, as shown in Table 4.
The precise volume of biofertilizer for treatments T1–T4 was dispersed to the soil around the plants or on the leaves and all over the plants using watering cans. To satisfy crop nutrient requirements for treatments T1–T4, an adequate amount of mineral N-urea, P2O5, and K2O powder was mixed and manually broadcast evenly over the soil surface. In the case of treatments T3–T4, mineral fertilizers were watered into the soil with 61.44 L Plot−1 of tap water. As a reference treatment (T5), mineral fertilizers were mixed, manually broadcast evenly over the soil surface, and watered into the soil with 122.88 L Plot−1 of tap water, a volume equivalent to the volume of the digestate in treatments T1 and T2. The treatments were applied at two distinct phases of growth: at the beginning of the growing period to boost the development of plants, and during the period of high demand for nutrients and water for plants to enter reproductive growth. Specifically, 30% of fertilizer was applied at vegetative stage V1 (7 DAS), when plants had one visible leaf collar, and 70% at vegetative stage V10 (45 DAS), when plants began steady and rapid periods of growth and DM accumulation.

2.4. Parameter Measurements

2.4.1. Morphological and Physiological Parameters

Data on growth traits were collected at 20, 40, 60, 80, and 100 days after seedling emergence (DAE) at 20-day intervals to cover the main vegetative and reproductive stages of maize. During each sampling period, two plants were selected randomly, cut off at the base with a knife, and separated into leaves, stems, and ears, when present. Then, the number of leaves was counted. The width and length of all leaves were measured in centimeters using a ruler, averaged, and the leaf area was calculated and expressed using the formula proposed by Guimarães et al. [23] (Table 5). The leaves, stems, and ears were oven-dried separately at 105 °C until they reached a constant weight, recorded as DM. Total DM and the ear DM: Total DM ratios were calculated. Based on leaf area and DM data, physiological indices were estimated using the mathematical equations (Table 5) proposed by Benincasa [24].

2.4.2. Leaf Nutritional Status

Maize leaves were collected at silking stage R1 when female inflorescences were visible on 50–75% of the plants (80 DAE). The R1 stage is characterized by complete K uptake and rapid N and P uptake, making R1 the most critical stage in determining the yield potential [25,26]. The third leaf, counted from the base and below the first (upper) ear, was cut with a knife, and the midrib was removed and discarded. The remaining leaf portion was washed with distilled water and oven-dried at 50 °C until a constant weight was achieved. The nutrient composition of leaves was determined using the method proposed by Martinez et al. [27]. Briefly, leaf samples were powdered in a home mixer and sieved. N in 1 g of powdered sample was estimated using the micro-Kjeldahl method, whereas P and K were analyzed after digestion of the samples in a nitric-perchloric acid solution using a UV/Vis spectrophotometer and a flame photometer, respectively (as described in Section 2.2.3). Ca, Mg, Cu, Fe, Mn, and Zn were analyzed in the nitric-perchloric extract using an atomic absorption spectrophotometer. The nutrient content of the leaves was expressed on a dry-weight basis. The nutritional values obtained were compared with the reference values in mg kg−1 considered suitable for maize in the State of Paraná in Brazil [20], that is, N (27,000–35,000), P (1900–4000), K (17,000–35,000), Ca (2300–8000), Mg (1500–5000), Cu (6–20), Fe (30–250), Mn (20–200), and Zn (15–100).

2.4.3. Maize Grain Yield

All ears were harvested at the full-grain maturity stage (120 DAS), at approximately 25% moisture content; the ears were collected manually from the plants in each plot, excluding border rows. The ears were mechanically dehusked and threshed to collect grains using a maize sheller coupled to a tractor. The grains were oven-dried at 105 °C until a moisture content of 13% was attained, which is a safe level for storage and commercialization. The mean weight of the samples was recorded using a scale and was expressed in kg ha−1.

2.5. Statistical Analyses

All data were subjected to an analysis of variance using the statistical program Sisvar 5.6-Build 86 [28]. All variables satisfied the requirements of normal distribution and homoscedastic assumption of variance after examination using the Shapiro–Wilk test and Levene’s test, respectively. Therefore, the mean value (n = 4) was calculated without data transformation. Differences between means were evaluated using Tukey’s honest significant difference (LSD) test at the 5% probability level. The coefficient of variation (CV) was calculated as the ratio of the standard deviation to the mean to show the extent of variability concerning the mean for all treatments.

3. Results and Discussion

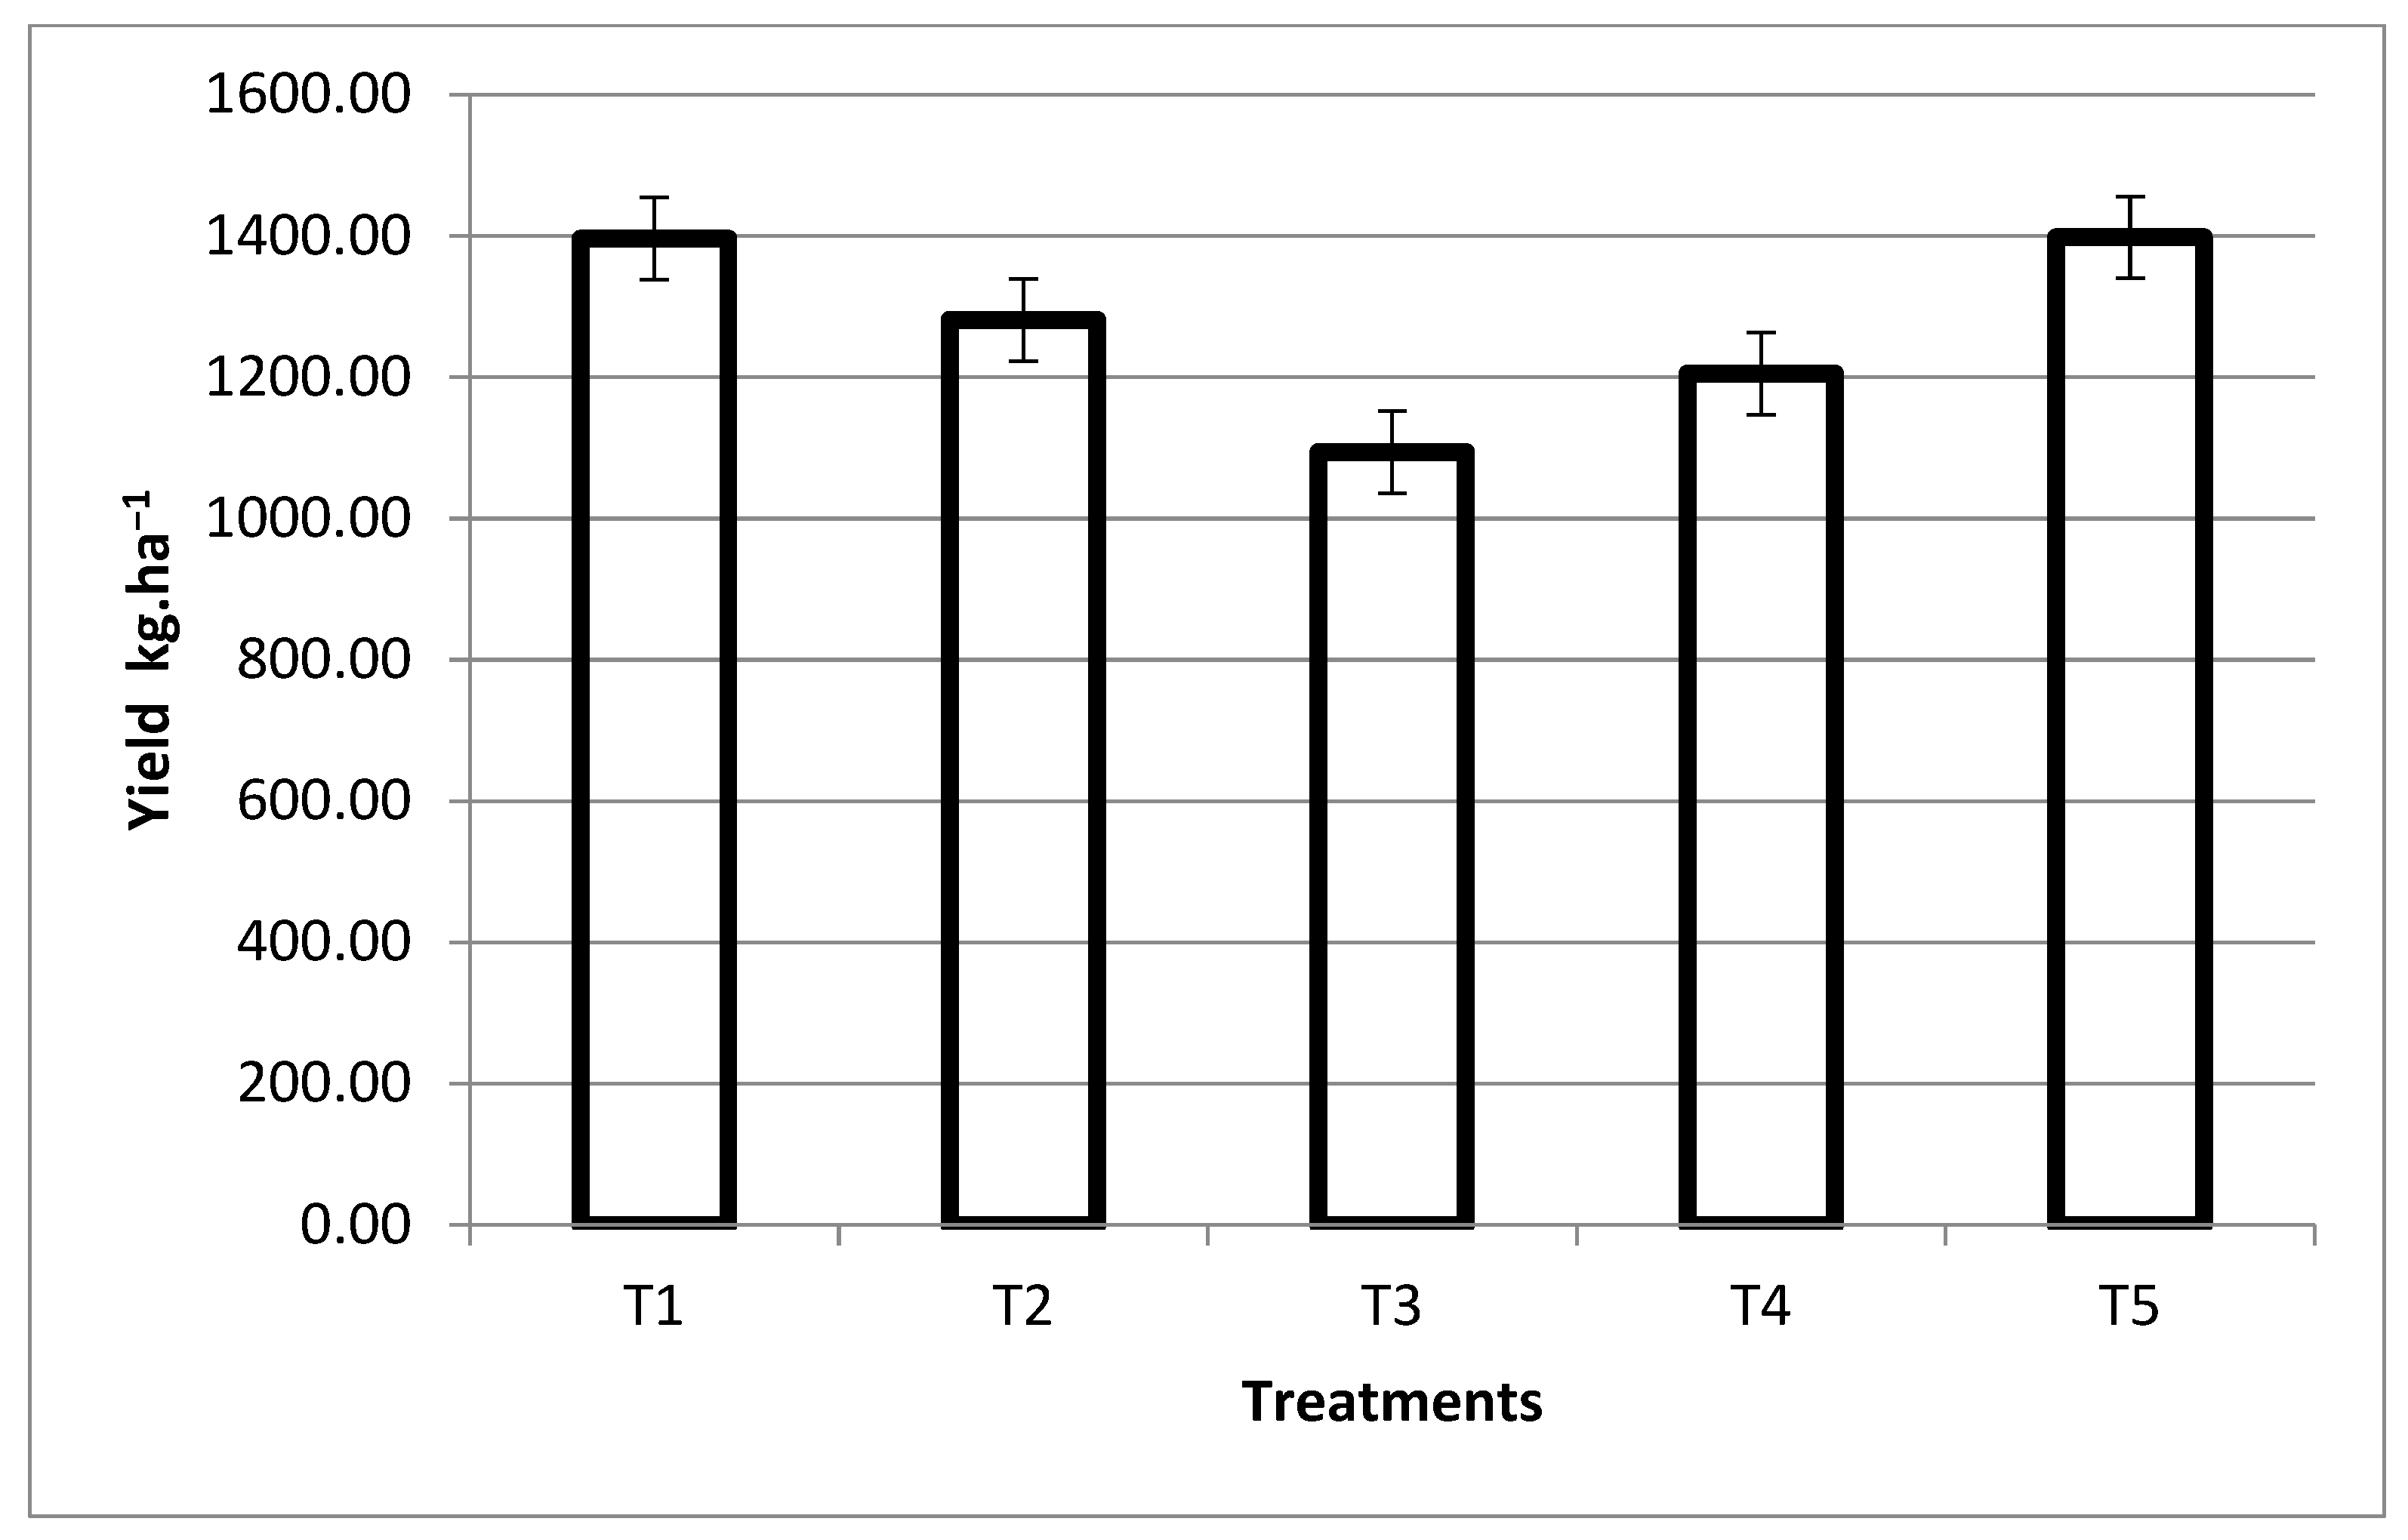
3.1. Effects of the Biofertilizer on Maize Grain Yield

In comparison with T5 (mineral fertilizers), maize grain yield was not affected (p < 0.05) by the use of biofertilizers, although T3 and T4 (partial substitution of chemical fertilizers by the digestate) tended to lead to lower yields (Figure 1). The average grain yield of all treatments was 1274.52 kg ha−1, which was well below the 5370 kg ha−1 average in Brazil in the experimental year [29]. The low maize yield in the testing field could be explained by the drought event in 2021, specifically acute in June, which coincided with the flowering and pollination stages of maize [25].
The data in Figure 1 expressly indicated the beneficial fertilizing properties of the biofertilizer. A major downside limiting the widespread adoption of biofertilizers by farmers is the long time it takes for organic matter to be oxidized into easily available nutrients [6,13]. However, bio-based fertilizers are known for their high variability in nutrients, and the starting material and processing conditions strongly influence the characteristics of the final product [4,12]. The yield data obtained in the present study could be explained by (i) a high level of NH4+ in the swine wastewater-based digestate and/or (ii) a fast and efficient conversion of organic N in the digestate into NH4+, an inorganic form of N easily absorbed by the plant root system. Although NH4+ levels were not determined in the present study, a reasonable correlation was established between vegetal growth and the level of NH4+ in a digestate obtained from cattle manure, poultry litter, and pig slurry [15]. Moreover, Costa et al. [4] observed that more than 60% of the total N in biofertilizers produced with beef cattle manure was NH4+. Results from trials in Argentina, Italy, and Belgium have also indicated that digestates applied at adequate dosages to the soil may substitute synthetic N fertilizers without crop yield losses [15,16,17,18]. In the former example, digestate application to soil produced a fast and short microbial stimulation [15]. In the latter examples, the digestates contributed to a short-term renewal of soil organic matter [16,17,18]. The results of the study presented in this paper further indicate that the N mineralization rate of some biofertilizers can be very fast, resulting in noticeable effects within months.

3.2. Effects of the Biofertilizer on the nutritional Value of Maize Leaves

There was a significant difference (p < 0.05) in the Fe content of maize leaves grown with biofertilizers and mineral fertilizers (Table 6). The lowest Fe content was observed in leaves from T3 at 217.66 mg kg−1, statistically different from the content in leaves from T1. Overall, treatments T1 and T5 resulted in the highest Fe contents of 540.68 and 326.55 mg kg−1, respectively. Although not significant (p > 0.05), higher Ca, Cu, Zn, and Mn contents were observed in leaves from T1 and T5 than in leaves from the other treatments. A lack of treatment effect on the contents of N, P, and K in maize leaves (Table 6) reinforces the grain yield results (Figure 1) and underlines the suitability of biofertilizers as partial or total substitutes for chemical fertilizers in the cultivation of maize. However, data from Figure 1 and Table 6 indicate better results with the total replacement of mineral fertilizers than with partial replacement. In a previous study [30], foliar application of a biofertilizer obtained from sewage sludge increased the contents of macro- and micronutrients in maize leaves; when the biofertilizer was applied directly to the soil, however, the contents of nutrients analyzed in both soil and leaves were not affected.
Leaf nutrient analysis is an effective tool for diagnosing nutrient deficiency or excess in plants and for visualizing the capacity of plants to absorb nutrients from different fertilizers [21,27]. The Ca, Zn, and Mn contents in the leaves were within the reference range for maize in Paraná State; the N, Cu, and Fe contents in the leaves were above the reference values, whereas the P, K, and Mg contents were much lower than the minimum values reported in the literature [20] (Table 6). Cu [31], Fe ([32], Mn [33], and Zn [34] are among the micronutrients that directly affect photosynthesis. The biofertilizer contained a significant amount of Cu and Fe (Table 2), whereas mineral fertilizers were devoid of these two nutrients. However, the soil Cu content was considered high (Table 1), and the Dystroferric Red Latosol used in the experiment was characterized by the presence of high levels of Fe and aluminum oxide [35]; these two observations probably explain, respectively, the high contents of Cu and Fe in leaves following plant uptake. The P content was approximately 20 times less than the reference value, indicating a deficiency [26]. The low P level was however inconsistent with that in the soil (Table 1) or the digestate (Table 2), and the possible reason for this is that more Cu and Fe ions in the leaves affected P absorption and utilization [36,37]. Moreover, the low soil moisture resulting from the drought that occurred during maize growth could have damaged the root structure and reduced water and nutrient absorption, including P [37]. The same explanation holds for the K and Mg contents.

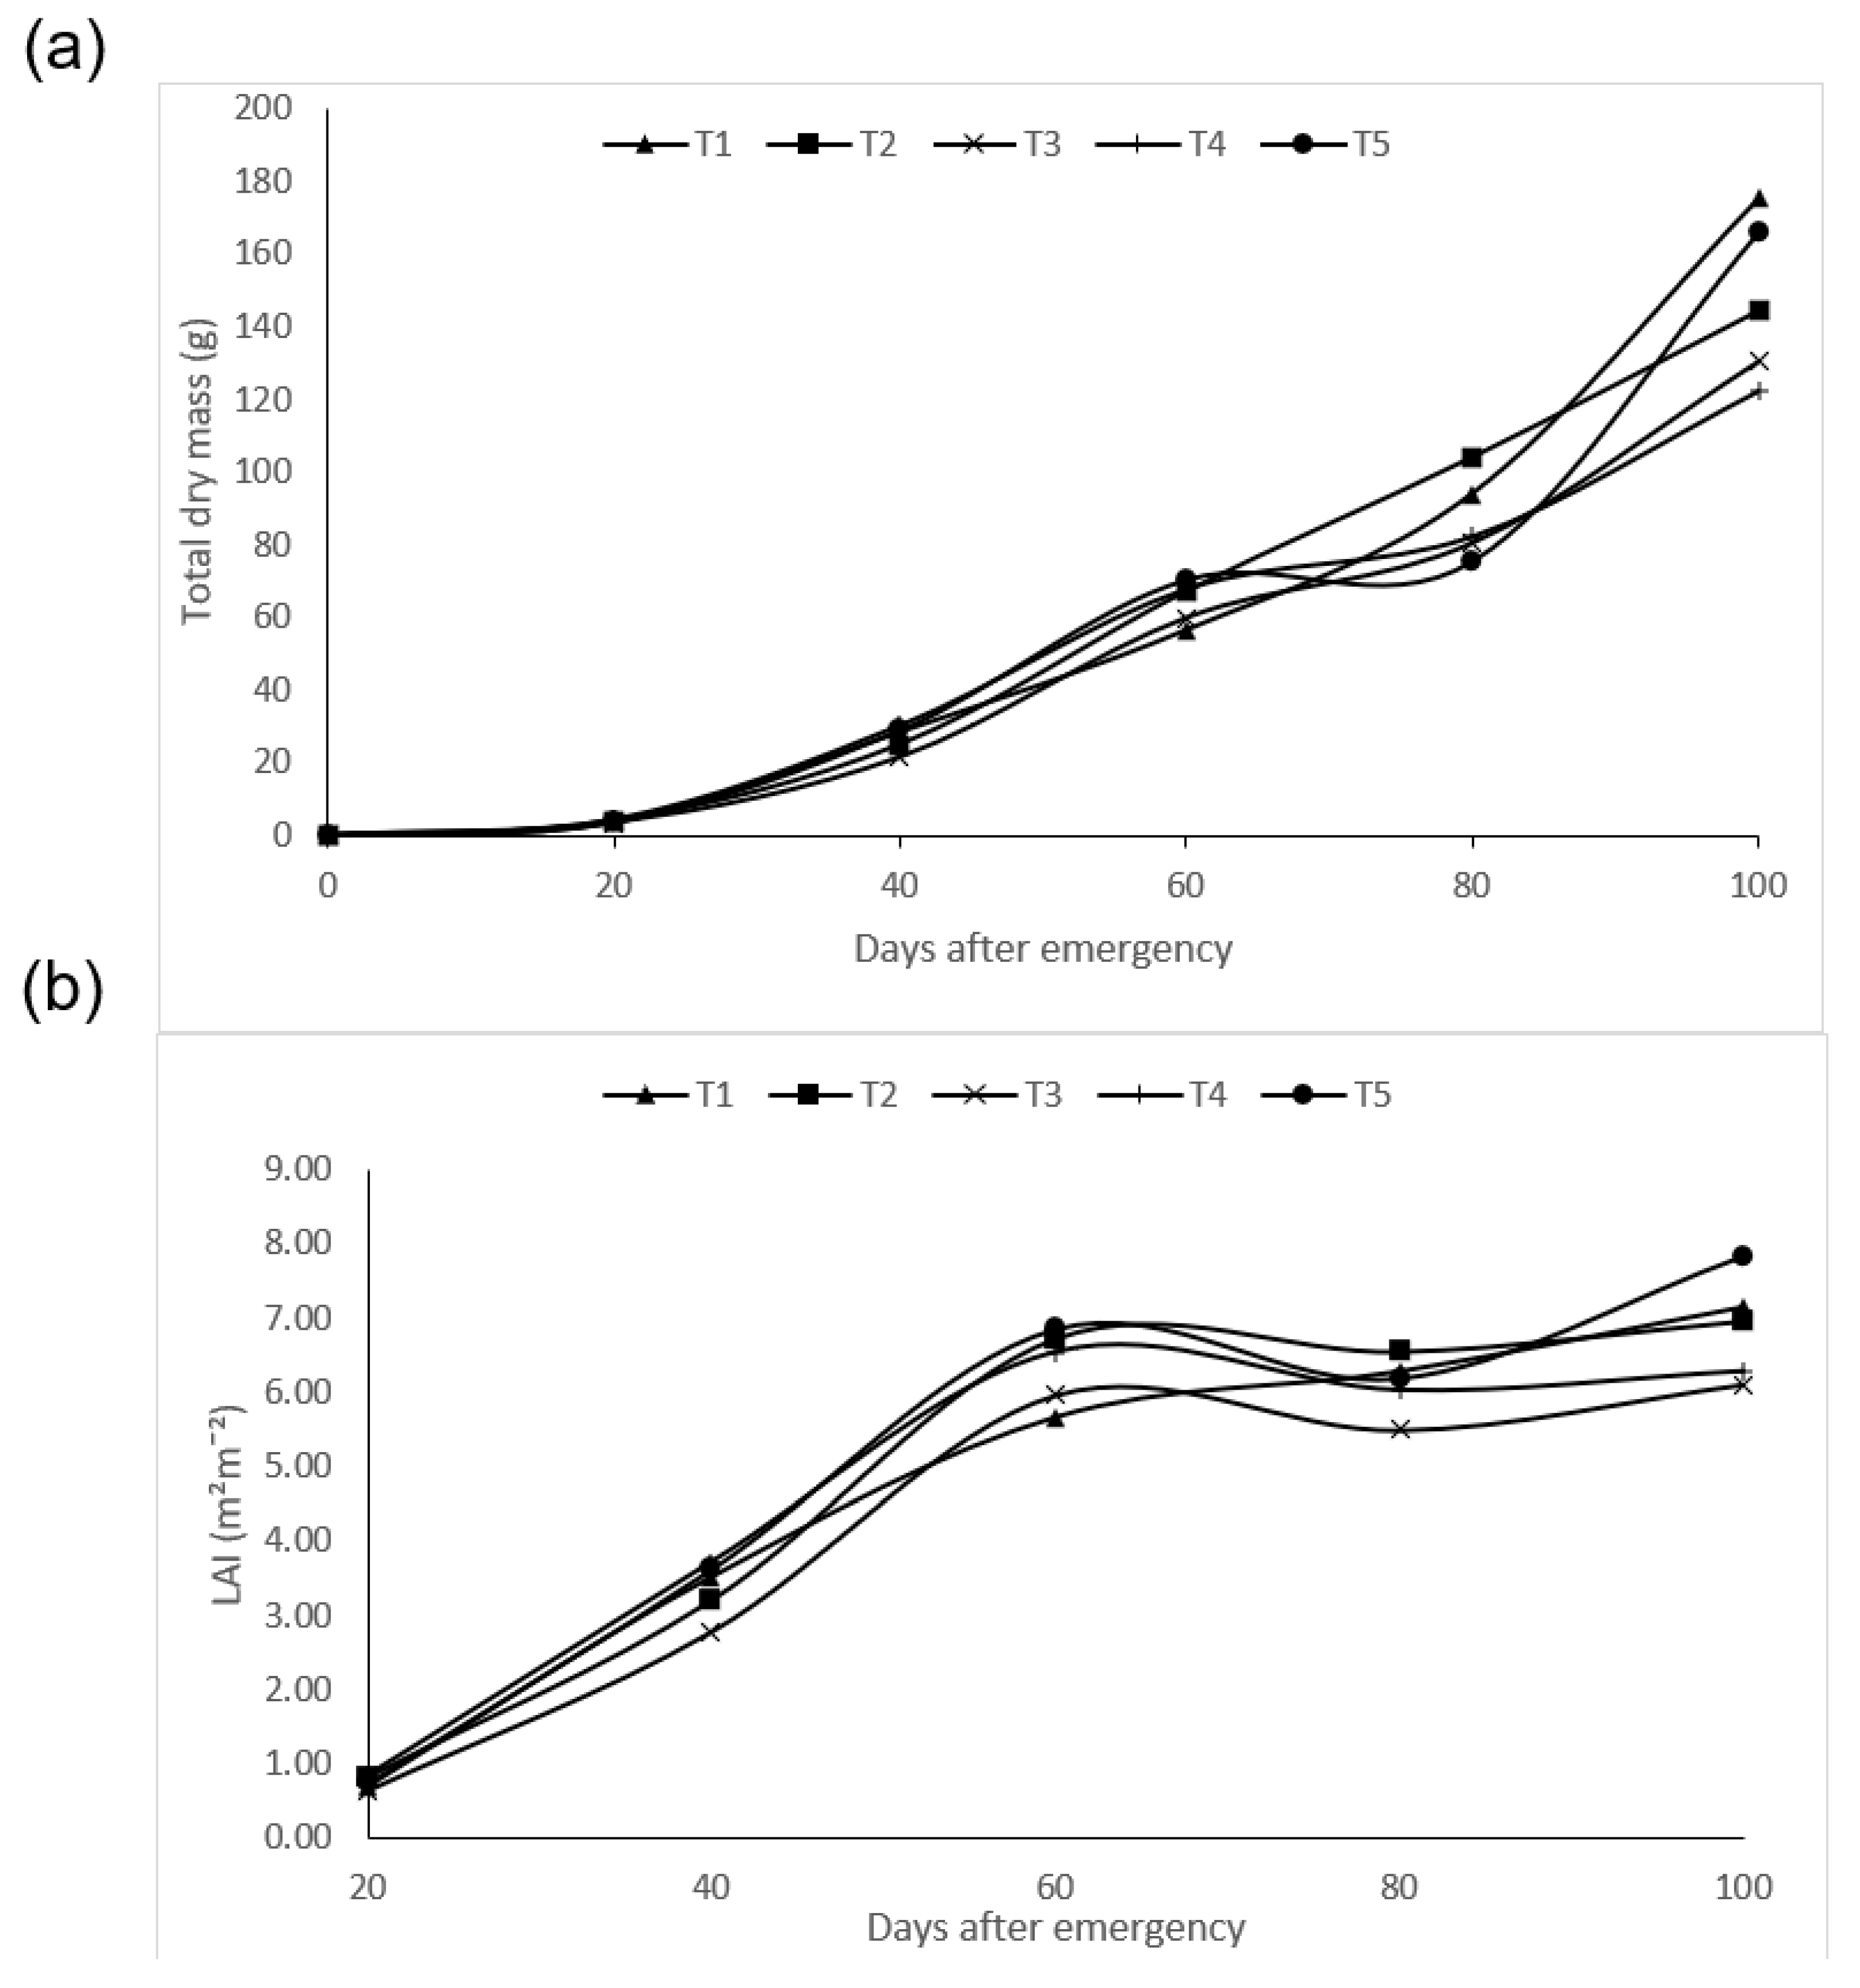
3.3. Effects of the Biofertilizer on the Growth Parameters of Maize

Data from samples collected at 100 DAE showed that the fertilization treatments influenced (p < 0.05) both leaf and stem productivity, as shown in Table 7. Overall, the highest values of total leaf area (TLA), leaf DM, stem DM, and total DM were observed in T1 and T5. The treatments had no effect on the number of leaves (average of 14 leaves), ear DM (average of 29.24 g), or ear DM: total DM ratio (average of 0.20). The key benefits of biofertilizers are their ability to increase the soil concentration of mineralized or partially available macronutrients and micronutrients, make the soil biologically alive with the presence of a wide diversity of beneficial microorganisms, build soil organic matter, and boost the amounts of humic substances [12,18,38,39]. These attributes allow biofertilizers to improve soil health and restore normal fertility through positive effects on the physical, chemical, and biological qualities of the soil system, thereby stimulating plant growth [14,15,16,17,18,30]. The data in Figure 1 and Table 6 and Table 7 show that applying synthetic N to soil together with biofertilizers adversely affected the attributes of biofertilizers, as seen by the low performance of treatments T3 and T4, in which synthetic N was only partially replaced.
The fertilization treatments did not show statistical differences (p > 0.05) concerning phytometric parameters, except for a considerable decrease in relative growth rate (RGR) and absolute growth rate (AGR) 100 DAE in plants exposed to treatments T2, T3, and T4 compared to T5 (Table 8). The RGR represents the increase in DM of a plant or its organs relative to the existing DM when the observation period begins [24]. RGR is dependent on the leaf area ratio (LAR) and the net assimilation rate (NAR, the gross photosynthetic rate discounting respiration), and can also be expressed by the equation RGR = NAR × LAR [40,41]. RGR values decreased with sampling time (Table 8) because of an increase in the plant DM. The AGR represents the variation in DM with time, that is, the average growth rate over the observation period [24]. Maize growth behavior as a function of biomass accumulation was similar among the treatments up to 60 DAE, as shown by the variation in total DM (Figure 2a). At 100 DAE when the crop was close to physiological maturity, a treatment effect was observed, and the highest AGR values (p < 0.05) were calculated for T5 and T1, 4.53 and 4.05 g day−1, respectively (Table 8).
Variations in leaf area index (LAI) according to the fertilization treatments (Figure 2b) were very similar to variations in AGR and RGR, with a statistical effect (p < 0.05) observed at 80 DAE and the highest values calculated for treatments T5 and T1 at 100 DAE. The LAI was calculated as the ratio of leaf area per plant to the soil area occupied by the plant. Remarkably reasonable correlations were observed between LAI and total DM at all sampling stages with the following equations: y = −0.0030x2 + 0.8231x + 5.3175 ( = 0.9704 for T1), y = −0.0044x2 + 0.9918x + 3.8876 ( = 0.9715 for T2), y = −0.0047x2 + 0.9609x + 3.4542 ( = 0.9644 for T3), y = −0.0056x2 + 1.0759x + 2.8235 ( = 0.9808 for T4), and y = −0.0035x2 + 0.943x + 3.6523 ( = 0.9849 for T5).
RGR, AGR (Table 8), total DM (Figure 2a), and LAI (Figure 2b) results demonstrate that treatments T1 and T5 are highly comparable. The expectation was that, because of their high solubility, synthetic fertilizers in T5 will promote higher growth rates and yields than biofertilizers in T1, T2, T3, and T4, especially under water deficit conditions, i.e., at 100 DAE. Rainfall levels recorded during the sampling period were 45, 67, 95, 270, and 0 mm at 20, 40, 60, 80, and 100 DAE, respectively, for a total of 477 mm of accumulated precipitation (data not shown). Soil application of biofertilizers with a total replacement of the amount of recommended synthetic N (treatment T1) might have been beneficial to plants in coping with drought stress between 80 and 100 DAE when there was no precipitation. The beneficial microorganisms in the biofertilizer competitively colonizing the roots might have produced a more robust root system, which allowed the plant to seek water and nutrients in deeper soil layers [42].

4. Conclusions

In this study, physiological growth and leaf nutrient parameters were measured at five different periods during the vegetative and reproductive stages of maize plants fertilized with biofertilizers (digestate from swine wastewater) or synthetic fertilizers. The experiment was conducted during the off-season maize crop, which is characterized by intermittent drought events. This is novel because previous studies have been conducted during the main growing season under favorable environmental conditions. Moreover, there are few previous studies on the effect of biofertilizers on phytometric parameters of crops. The results indicate that the biofertilizer applied at adequate dosages to the soil around the plants may totally (100%) substitute synthetic N fertilizers without crop yield losses. Partial replacement (50%) of synthetic N with the biofertilizer tended to yield data inferior to those obtained with synthetic fertilizers. The mode of application of the biofertilizer (basal versus foliar) did not have any significant effect on either growth parameters or leaf nutrients. In future studies, more doses of biofertilizers, maize varieties, and timing of applications should be evaluated before reaching a final conclusion. Organic fertilizers often act as a long-term carbon sink and a slow-release pool for nutrients. Thus, multi-year experiments are needed in order to gain a deeper understanding of the action of the swine wastewater-based digestate used in the present study.

Author Contributions

Conceptualization, J.d.L.J. and M.S.S.M.C.; methodology, E.L.B., L.A.M.C., J.d.L.J., F.T.S., P.G. and M.S.S.M.C.; software, M.S.S.M.C.; validation, L.A.M.C., P.G. and M.S.S.M.C.; formal analysis, E.L.B. and F.T.S.; investigation, E.L.B., J.d.L.J. and F.T.S.; resources, L.A.M.C. and M.S.S.M.C.; data curation, P.G.; writing—original draft preparation, E.L.B.; writing—review and editing, E.L.B., L.A.M.C., J.d.L.J., F.T.S., P.G. and M.S.S.M.C.; supervision, M.S.S.M.C. and P.G.; project administration, M.S.S.M.C.; funding acquisition, M.S.S.M.C. All authors have read and agreed to the published version of the manuscript.

Funding

This research was funded by the Coordination for the Improvement of Higher Education Personnel (CAPES) who provided the scholarship to the first author, and the the Fundação para a Ciência e a Tecnologia (FCT grant number UIDB/04033/2020).

Institutional Review Board Statement

Not applicable.

Informed Consent Statement

Not applicable.

Data Availability Statement

The data that support the findings of this study are available within the article.

Acknowledgments

The authors are grateful to the Coordination for the Improvement of Higher Education Personnel (CAPES) and to the National Council for Scientific and Technological Development (CNPq).

Conflicts of Interest

The authors declare no conflict of interest. The funders had no role in the design of the study; in the collection, analyses, or interpretation of data; in the writing of the manuscript; or in the decision to publish the results.

References

  1. Aragão, A.; Contini, E.O. Agriculture in Brazil and in the World: A Synthesis of the 2000–2020 Period, 1st ed.; SIRE/EMBRAPA: Brasília, Brazil, 2021; pp. 1–68. Available online: https://www.embrapa.br/documents/10180/62618376/O+AGRO+NO+BRASIL+E+NO+MUNDO.pdf/41e20155-5cd9-f4ad-7119-945e147396cb (accessed on 8 December 2022).
  2. Asencios, Y.J.O. The Importance of hydrogen for Brazil: A source of clean energy and a path to the production of nitrogen fertilizers. SciELO Prepr. 2022, 4408. [Google Scholar] [CrossRef]
  3. Fioroni, B. Deposits and Bioinputs Minimize the Lack of Foreign Fertilizer; FAEP: Curitiba, Brazil, 2022; Volume 1558, pp. 18–27. Available online: https://www.sistemafaep.org.br/wp-content/uploads/2022/03/BI_1558_web.pdf (accessed on 8 December 2022).
  4. Costa, M.S.S.M.; Lorin, H.E.F.; Costa, L.A.M.; Cestanaro, T.; Pereira, D.C.; Bernardi, F.H. Performance of four stabilization bioprocesses of beef cattle feedlot manure. J. Environ. Manag. 2016, 181, 443–448. [Google Scholar] [CrossRef] [PubMed]
  5. Santos, F.T.; Costa, M.S.S.M.; Costa, L.A.M.; Trindade, H.; Tonial, L.M.S.; Lorin, H.E.F.; Goufo, P. Spectroscopic and physicochemical characterization of poultry waste-based composts and charcoal–compost mixtures for the prediction of dry matter yield of giant of Italy parsley. Agronomy 2021, 12, 256. [Google Scholar] [CrossRef]
  6. Lamolinara, B.; Pérez- Martínez, A.; Guardado-Yordi, E.; Fiallos, C.G.; Diéguez- Santana, K.; Ruiz-Mercado, G.J. Anaerobic digestate management, environmental impacts, and techno-economic challenges. Waste Manag. 2022, 140, 14–30. [Google Scholar] [CrossRef] [PubMed]
  7. Santos, C.; Goufo, P.; Fonseca, J.; Pereira, J.; Ferreira, L.; Coutinho, J.; Trindade, H. Effect of lignocellulosic and phenolic compounds on ammonia, nitric oxide and greenhouse gas emissions during composting. J. Clean. Prod. 2018, 171, 548–556. [Google Scholar] [CrossRef]
  8. Santos, F.T.; Goufo, P.; Santos, C.; Botelho, D.; Fonseca, J.; Queirós, A.; Costa, M.S.S.M.; Trindade, H. Comparison of five agro-industrial waste–based composts as growing media for lettuce: Effect on yield, phenolic compounds and vitamin C. Food Chem. 2016, 209, 293–301. [Google Scholar] [CrossRef]
  9. Novotny, E.H.; Balieiro, F.C.; Auccaise, R.; Benites, V.M.; Coutinho, H.L.C. Spectroscopic investigation on the effects of biochar and soluble phosphorus on grass clipping vermicomposting. Agriculture 2022, 12, 1011. [Google Scholar] [CrossRef]
  10. Santos, C.; Monte, J.; Vilaça, N.; Fonseca, J.; Trindade, H.; Cortez, I.; Goufo, P. Evaluation of the potential of agro-industrial waste-based composts to control Botrytis gray mold and soilborne fungal diseases in lettuce. Processes 2021, 9, 2231. [Google Scholar] [CrossRef]
  11. Santos, F.T.; Trindade, H.; Costa, M.S.S.M.; Costa, L.A.M.; Goufo, P. Effects of composts made from broiler chicken residues and blended with biochar on the minerals and phenolic compounds in parsley (Petroselinum crispum Mill.). Agriculture 2021, 11, 1168. [Google Scholar] [CrossRef]
  12. Tambone, F.; Scaglia, B.; D’imporzano, G.; Schievano, A.; Orzi, V.; Salati, S.; Adani, F. Assessing amendment and fertilizing properties of digestates from anaerobic digestion through a comparative study with digested sludge and compost. Chemosphere 2010, 81, 577–583. [Google Scholar] [CrossRef]
  13. Samoraj, M.; Mironiuk, M.; Izydorczyk, G.; Witek-Krowiak, A.; Szopa, D.; Moustakas, K.; Chojnacka, K. The challenges and perspectives for anaerobic digestion of animal waste and fertilizer application of the digestate. Chemosphere 2022, 295, 133799. [Google Scholar] [CrossRef]
  14. Koszel, M.; Lorencowicz, E. Agricultural use of biogas digestate as a replacement fertilizer. Agric. Sci. Proc. 2015, 7, 119–124. [Google Scholar] [CrossRef] [Green Version]
  15. Locoli, G.A.; Zabaloy, M.C.; Pasdevicelli, G.; Gómez, M.A. Use of biogas digestates obtained by anaerobic digestion and co-digestion as fertilizers: Characterization, soil biological activity and growth dynamic of Lactuca sativa L. Sci. Total Environ. 2019, 647, 11–19. [Google Scholar] [CrossRef]
  16. Sigurnjak, I.; Vaneeckhaute, H.; Michels, E.; Ryckaert, B.; Ghkiere, G.; Tack, F.M.G.; Meers, E. Fertilizer performance of liquid fraction of digestate as synthetic nitrogen substitute in silage maize cultivation for three consecutive years. Sci. Total Environ. 2017, 599–600, 1885–1894. [Google Scholar] [CrossRef] [PubMed]
  17. Tsachidou, B.; Scheuren, M.; Gennen, J.; Debbaut, V.; Toussaint, B.; Hissler, C.; George, I.; Delfosse, P. Biogas residues in substitution for chemical fertilizers: A comparative study on a grassland in the Walloon Region. Sci. Total Environ. 2019, 166, 212–225. [Google Scholar] [CrossRef]
  18. Zilio, M.; Pigoli, A.; Rizzi, B.; Herrera, A.; Tambone, F.; Geromel, G.; Meers, E.; Schoumans, O.; Giordano, A.; Adani, F. Using highly stabilized digestate and digestate-derived ammonium sulphate to replace synthetic fertilizers: The effects on soil, environment, and crop production. Sci. Total Environ. 2022, 815, 152919. [Google Scholar] [CrossRef] [PubMed]
  19. Nitsche, P.R.; Caramori, P.H.; Ricce, W.S.; Pinto, L.F.D. Climate Atlas of the State of Paraná, 1st ed.; IAPAR: Londrina, Brazil, 2019; pp. 1–210. Available online: https://www.idrparana.pr.gov.br/system/files/publico/agrometeorologia/atlas-climatico/atlas-climatico-do-parana-2019.pdf (accessed on 8 December 2022).
  20. Pavinato, P.S.; Pauletti, V.; Motta, A.C.V.; Adônis, M. Fertilization and Liming Manual for the State of Paraná in Brazil, 2nd ed.; SBCS/NEPAR: Curitiba, Brazil, 2017; pp. 1–482. Available online: https://issuu.com/editoracubo/docs/issuu-nepar-calagem (accessed on 8 December 2022).
  21. Malavolta, E.; Vitti, G.C.; Oliveira, S.A. Evaluation of the Nutritional Status of Plants: Principles and Applications, 2nd ed.; POTAFOS: Piracicaba, Brazil, 1997; pp. 1–319. Available online: https://repositorio.usp.br/item/001070906 (accessed on 8 December 2022).
  22. Silva, F.C. Manual of Chemical Analysis of Soils, Plants and Fertilizers, 2nd ed.; EMBRAPA/IT: Brasília, Brazil, 2009; pp. 1–319. Available online: https://www.infoteca.cnptia.embrapa.br/handle/doc/330496 (accessed on 8 December 2022).
  23. Guimarães, D.P.; Sans, L.M.A.; Moraes, A.V.C. Estimativa da Área Foliar de Cultivares de Milho. In Proceedings of the XXIV Congresso Nacional de Milho e Sorgo, Florianópolis, Brazil, 1–5 September 2002; Available online: https://ainfo.cnptia.embrapa.br/digital/bitstream/item/34888/1/Estimativa-area.pdf (accessed on 8 December 2022).
  24. Benincasa, M.M.P. Plant Growth Analysis, Basic Notions, 1st ed.; FUNEP: Jaboticabal, Brazil, 1988; pp. 1–42. Available online: https://www.bdpa.cnptia.embrapa.br/consulta/busca?b=ad&id=418424&biblioteca=vazio&busca=autoria:"M"&qFacets=autoria:"M"&sort=&paginacao=t&paginaAtual=3 (accessed on 8 December 2022).
  25. Weismann, M. Fases de desenvolvimento da cultura do milho. In Technology and Production: Off-season Corn and Winter Crops, 2008th ed.; Roscoe, R., Lourenção, A.L.F., Grigolli, J.F.J., Melotto, A.M., Pitol, C., Miranda, R.A.S., Eds.; Fundação MS: Maracaju, Brazil, 2008; pp. 4–7. Available online: https://www.fundacaoms.org.br/tipo_da_publicacao/conteudo-safrinha/ (accessed on 8 December 2022).
  26. Bull, L.T.; Cantarella, H. Maize Cultivation: Factors Affecting Productivity, 1st ed.; POTAFOS: Piracicaba, Brazil, 1993; pp. 63–145. Available online: https://megaleitores.com.br/livro/estante/11993301-cultura-do-milho-fatores-que-afetam-a-produtividade-leonardo-theodoro-bull-e-heitor-cantarella/59797/4433/50300 (accessed on 8 December 2022).
  27. Martinez, H.E.P.; Carvalho, J.G.; Souza, R.B. Diagnose foliar. In Recommendations for the Use of Correctives and Fertilizers in Minas Gerais, 5th ed.; Ribeiro, A.C., Guimarães, P.T.G., Alvarez, V.V.H., Eds.; CFSEMG/UFV: Viçosa, Brazil, 1999; pp. 143–168. Available online: https://www.sbcs.org.br/loja/index.php?route=product/product&product_id=133 (accessed on 8 December 2022).
  28. Ferreira, D.F. SISVAR: A computer analysis system to fixed effects split plot type designs. Rev. Bras. De Biom. 2019, 37, 529–535. [Google Scholar] [CrossRef] [Green Version]
  29. CONAB. Boletin da Safa de Grãos 2018/19, 9° Levantamento Junho 2019. In Observatório Agrícola Acompanhamento da Safra Brasileira Grãos, 1st ed.; Santos, C.M.R., Ruas, J.F., Salvador, M.A., Amazonas, L., Guth, T.L.F., Nogueira, B.P., Júnior, S.R.G.S., Soares, F.M.S., Campos, P.M., Eds.; CONAB: Brasília, Brazil, 2019; Volume 6, pp. 1–113. Available online: https://www.conab.gov.br/info-agro/safras/graos/boletim-da-safra-de-graos?start=4 (accessed on 8 December 2022).
  30. Tejada, M.; Rodríguez-Morgado, B.; Gómez, I.; Franco-Andreua, L.; Benítezc, C.; Parrado, J. Use of biofertilizers obtained from sewage sludges on maize yield. Eur. J. Agron. 2016, 78, 3–19. [Google Scholar] [CrossRef]
  31. Schulten, A.; Krämer, U. Interactions between copper homeostasis and metabolism in plants. Prog. Bot. 2017, 79, 111–146. [Google Scholar] [CrossRef]
  32. Gao, F.; Robe, K.; Gaymard, F.; Izquierdo, E.; Dubos, C. The transcriptional control of iron homeostasis in plants: A tale of bHLH transcription factors? Front. Plant Sci. 2019, 10, 6. [Google Scholar] [CrossRef] [Green Version]
  33. Fischer, W.W.; Hemp, J.; Johnson, J.E. Manganese and the evolution of Photosynthesis. Orig. Life Evol. Biosph. 2015, 45, 351–357. [Google Scholar] [CrossRef] [PubMed]
  34. Hafeez, B.; Khanif, Y.M.; Saleem, M. Role of zinc in plant nutrition—A review. Am. J. Exp. Agric. 2013, 3, 374–391. [Google Scholar] [CrossRef]
  35. Santos, H.G.; Jacomine, P.K.T.; Anjos, L.H.C.; Oliveira, V.A.; Lumbreras, J.F.; Coelho, M.R.; Almeida, J.A.; Araujo Filho, J.C.; Oliveira, J.B.; Cunha, T.J.F. Brazilian System of Soil Classification, 5th ed.; EMBRAPA: Brasília, Brazil, 2018; pp. 1–356. Available online: https://www.embrapa.br/busca-de-publicacoes/-/publicacao/1094003/sistema-brasileiro-de-classificacao-de-solos (accessed on 8 December 2022).
  36. Ambrosini, V.G.; Rosa, D.J.; Basso, A.; Borghezan, M.; Pescador, R.; Miotto, A.; Melo, G.W.B.; Soares, C.R.F.S.; Comin, J.J.; Brunetto, G. Liming as an ameliorator of copper toxicity in black oat (Avena strigosa Schreb.). J. Plant Nutr. 2017, 40, 404–416. [Google Scholar] [CrossRef]
  37. Casarin, V. Dinâmica de nutrientes no sistema solo-planta visando BPUFs. In Proceedings of the IX Regional Symposium of the International Plant Nutrition Institute, Paragominas, Brazil, 30–31 August 2016; Available online: https://www.npct.com.br/npctweb/npct.nsf/article/BRS-3424/$File/Palestra%20Valter%20Casarin.pdf (accessed on 8 December 2022).
  38. Tejada, M.; Rodríguez-Morgado, B.; Gómez, I.; Parrado, J. Degradation of chlorpyrifos using different biostimulants/biofertilizers: Effects on soil biochemical properties and microbial community. Appl. Soil Ecol. 2014, 84, 158–165. [Google Scholar] [CrossRef]
  39. Nascimento, R.C. O uso do biofertilizante em solos agrícolas do cerrado da região do Alto Paranaíba (MG). Bol. Goiano Geogr. 2010, 30, 55–56. [Google Scholar] [CrossRef] [Green Version]
  40. Lima, J.F.; Peixoto, C.P.; Ledo, C.A.S. Physiological indexes and initial growth of papaya plants (Carica papaya L.) under greenhouse conditions. Ciênc. Agrotec. 2007, 31, 1358–1363. [Google Scholar] [CrossRef] [Green Version]
  41. Urchei, M.A.; Rodrigues, J.D.; Stone, L.F. Growth analysis of two bean cultivars under irrigation in no tillage and the conventional tillage. Pesqui. Agropecuária Bras. 2000, 35, 497–506. [Google Scholar] [CrossRef] [Green Version]
  42. Najafi, S.; Nazari Nasi, H.; Tuncturk, R.; Tuncturk, M.; Sayyed, R.Z.; Amirnia, R. Biofertilizer application enhances drought stress tolerance and alters the antioxidant enzymes in medicinal pumpkin (Cucurbita pepo convar. pepo var. Styriaca). Horticulturae 2021, 7, 588. [Google Scholar] [CrossRef]
Figure 1. Effect of fertilization treatments on maize grain yield. T1 = basal application of the digestate from swine wastewater as total substitute (100%) for synthetic N; T2 = foliar application of the digestate as total substitute (100%) for synthetic N; T3 = basal application of the digestate as partial substitute (50%) for synthetic N; T4 = foliar application of the digestate as partial substitute (50%) for synthetic N; T5 = in-row broadcast of mineral fertilizers. The treatments are fully described in Table 3. Mean bars with no letter or same letters are not statistically different (Tukey’s HSD, p < 0.05, n = 4). Error bars indicate standard deviations.
Agriculture 13 00565 g001
Figure 2. Variations in total dry matter DM (a) and leaf area index LAI (b) with maize growth development under different fertilization treatments. T1 = basal application of the digestate from swine wastewater as total substitute (100%) for synthetic N; T2 = foliar application of the digestate as total substitute (100%) for synthetic N; T3 = basal application of the digestate as partial substitute (50%) for synthetic N; T4 = foliar application of the digestate as partial substitute (50%) for synthetic N; T5 = in-row broadcast of mineral fertilizer. The treatments are fully described in Table 3. Statistically, differences are not shown.
Agriculture 13 00565 g002
Table 1. Main chemical characteristics of the soil in the experimental area before fertilization. Contents were classified as low, medium, or high based on the ranges specified in the Paraná State Handbook for Fertilization and Liming [20].
NutrientUnitContentClassification
Ca2+cmolc dm−34.59High
Mg2+cmolc dm−31.61High
PO43−mg dm−36.38Medium
K+cmolc dm−30.36High
Al+3cmolc dm−30.31Low
H + Alcmolc dm−39.01High
Sum of basescmolc dm−36.56High
Cation exchange capacity at pH 7.0cmolc dm−315.57High
Cation exchange capacity efectivecmolc dm−36.87High
Carbong dm³25.75High
Organic matterg dm³44.29High
Aluminum saturation%4.51Low
Base saturation%42.13Low
Bmg dm³0.24Low
Smg dm³4.59Low
Fe+2mg dm³27.40Medium
Mn+2mg dm³43.40High
Cu+2mg dm³5.20High
Zn+2mg dm³1.80Medium
pH (CaCl2)NA4.60NA
NA = not available or not applicable.
Table 2. Main chemical characteristics of the liquid biofertilizer (digestate of swine wastewater) tested in the study.
NutrientNP2O5K2OCaMgCuFeMnZn
Unitg L−1mg L−1
Content2.50 ± 0.110.45 ± 0.150.15 ± 0.077.42 ± 5.80.08 ± 0.083.92 ± 0.027.45 ± 0.111.36 ± 0.082.08 ± 0.01
Table 3. Description of the five fertilization treatments used in the experiment.
Treatments Application ModeDescription
T1BasalDose of biofertilizer corresponding to 100% of the amount of recommended mineral N + P and K supplementation with synthetic fertilizers
T2FoliarDose of biofertilizer corresponding to 100% of the amount of recommended mineral N + P and K supplementation with synthetic fertilizers
T3BasalDose of biofertilizer corresponding to 50% of the amount of recommended mineral N + N, P, and K supplementation with synthetic fertilizers
T4FoliarDosage of biofertilizer corresponding to 50% of the amount of recommended mineral N + N, P, and K supplementation with synthetic fertilizers
T5In-row broadcastingMineral fertilization as recommended for the maize crop in the Paraná State of Brazil
Table 4. Nutrient composition and application rates (L Plot−1) for the different fertilization treatments.
TreatmentsBiofertilizer (L)Nutrient Composition of the Biofertilizer (g)Synthetic Nutrients Applied Directly to Soil (g)
NP2O5K2ONP2O5K2O
T1122.88307.2056.3019.000225.30160.20
T2122.88307.2056.3019.000225.30160.20
T361.44153.6028.109.50153.60253.50169.70
T461.44153.6028.109.50153.60253.50169.70
T50000307.20281.60179.20
Table 5. Morphological and physiological parameters assessed in this study pertaining to maize growth and the respective equations used for their determination as described in Guimarães et al. [23] and in Benicasa [24].
Physiological IndicesEquationDescription of Abbreviations
Total dry matter (W)W = WL + WS + WEWL = leaf dry matter (g)
WS = stem dry matter (g)
WE = ear dry matter (g)
Total leaf area (TLA)TLA = 0.7458 × LW × LL LW = leaf width (cm)
LL = leaf length (cm)
Leaf area index (LAI)LAI = TLA/STLA = total leaf area (cm2)
S = soil surface area (cm2)
Absolute growth rate (AGR)AGR = (W2 − W1)/(t2 − t1) W = total dry matter (g)
t = time (d)
1,2 = two successive sampling periods
Relative growth rate (RGR)RGR = (lnW2 − lnW1)/(t2 − t1) Ln = Naperian logarithm
W = total dry matter (g)
t = time (d)
1,2 = two successive sampling periods
Leaf area relative growth rate (RGRLA)RGRLA = (lnTLA2 − lnTLA1)/(t2 − t1) Ln = Naperian logarithm
TLA = total leaf area
W = total dry matter (g)
t = time (d)
1,2 = two successive sampling periods
TLA = total leaf area
Net assimilation rate (NAR)NAR = [(W2 − W1)/(t2 − t1)] × [(lnTLA2 − lnTLA1)/(TLA2 − TLA1)]W = total dry matter (g)
t = time (d)
1,2 = two successive sampling periods
Leaf area ratio (LAR)LAR = (TLA/W)TLA = total leaf area
W = total dry matter (g)
Specific leaf area (SLA)SLA = (TLA/WE)TLA = total leaf area
W = total dry matter (g)
Table 6. Effect of fertilization treatments on the contents of nutrients in maize leaves at the R1 silking stage. T1 = basal application of the digestate from swine wastewater as total substitute (100%) for synthetic N; T2 = foliar application of the digestate as total substitute (100%) for synthetic N; T3 = basal application of the digestate as partial substitute (50%) for synthetic N; T4 = foliar application of the digestate as partial substitute (50%) for synthetic N; T5 = in-row broadcast of mineral fertilizer. The treatments are fully described in Table 3.
TreatmentsT1T2T3T4T5CV (%)Reference
N (g kg−1)40.6038.6042.0040.5037.8012.4027–35
P (g kg−1)0.110.080.090.080.0932.831.9–4.0
K (g kg−1)11.4012.108.4010.309.8018.8817–35
Ca (g kg−1)6.805.808.506.308.5050.532.3–8.0
Mg (g kg−1)0.0350.0290.0410.0340.03730.111.5–5.0
Cu (mg kg−1)140.9068.6169.3485.27172.0066.196–20
Zn (mg kg−1)67.5454.4354.7350.2571.2430.9915–100
Fe (mg kg−1)540.68 A313.03 AB217.66 B300.97 AB326.55 AB41.2330–250
Mn (mg kg−1)36.9431.3826.4429.3137.6156.0720–200
Mean within a row followed with no letter or same letters are not statistically different (Tukey’s HSD, p < 0.05, n = 4). CV = coefficient of variation.
Table 7. Effect of fertilization treatments on the leaf morphology and dry matter of maize at the R5 dent stage. T1 = basal application of the digestate from swine wastewater as total substitute (100%) for synthetic N; T2 = foliar application of the digestate as total substitute (100%) for synthetic N; T3 = basal application of the digestate as partial substitute (50%) for synthetic N; T4 = foliar application of the digestate as partial substitute (50%) for synthetic N; T5 = in-row broadcast of mineral fertilizer. The treatments are fully described in Table 3.
TreatmentsTotal Leaf
Area (cm²)
N° of LeavesLeaf DM
(g)
Stem DM
(g)
Ear DM
(g)
Total DM
(g)
Ear DM: Total DM
T15874 AB14 42.54 AB97.27 A35.47175.28 A0.21
T25709 AB14 39.11 AB76.22 AB29.08144.41 AB0.20
T35006 B14 34.69 AB72.71 AB23.00130.40 AB0.18
T45150 B14 34.09 B65.94 B22.39122.42 B0.18
T56424 A14 44.15 A86.63 AB35.25166.03 AB0.22
CV (%)13.437.2216.0522.736.6821.61NA
Mean within a column followed with no letter or same letters are not statistically different (Tukey’s HSD, p < 0.05, n = 4). CV = coefficient of variation. DM = dry matter. NA = not applicable.
Table 8. Effect of fertilization treatments on the phytometric parameters of maize. T1 = basal application of the digestate from swine wastewater as total substitute (100%) for synthetic N; T2 = foliar application of the digestate as total substitute (100%) for synthetic N; T3 = basal application of the digestate as partial substitute (50%) for synthetic N; T4 = foliar application of the digestate as partial substitute (50%) for synthetic N; T5 = in-row broadcast of mineral fertilizer. The treatments are fully described in Table 3. CV = coefficient of variation. DAE = days after emergency; AGR = absolute growth rate; RGR = relative growth rate; RGRLA = leaf area relative growth rate; NAR = net assimilation rate; LAR = leaf area ratio; SLA = specific leaf area.
TreatmentsDAE 1AGRRGRRGRLANARLARSLA
Unit(d)(g d−1)(g g−1d−1)(dm2dm−2 d−1)(g m−2 d−1)(m2 g−1)(m2 g−1)
T1401.250.100.088.751.600.02
601.400.030.024.071.010.01
801.880.030.003.870.860.01
1004.05 AB0.03 AB0.017.370.560.01
T2401.050.090.077.371.680.02
602.110.050.045.481.050.01
801.840.020.003.270.830.01
1002.02 B 0.02 B0.003.640.530.01
T3400.900.090.077.591.580.02
601.920.050.045.611.070.01
801.030.010.002.200.820.01
1002.50 B0.02 B0.015.320.560.01
T4401.300.100.078.051.630.02
601.880.040.034.701.010.01
800.720.010.001.300.810.01
1002.00 B0.02 B0.004.160.630.01
T5401.260.100.088.541.640.02
602.070.040.034.921.020.01
800.260.000.000.590.800.01
1004.53 A 0.04 A0.018.050.670.01
1 Differences between data values of two successive sampling periods were used for the calculations. Since no data was collected at 0 DAE, data for 20 DAE are not applicable to the study. Mean within a column followed with no letter or same letters are not statistically different (Tukey’s HSD, p < 0.05, n = 4).
Disclaimer/Publisher’s Note: The statements, opinions and data contained in all publications are solely those of the individual author(s) and contributor(s) and not of MDPI and/or the editor(s). MDPI and/or the editor(s) disclaim responsibility for any injury to people or property resulting from any ideas, methods, instructions or products referred to in the content.

