Article

Crop Coefficient Estimation and Effect of Abscisic Acid on Red Cabbage Plants (Brassica oleracea var. Capitata) under Water-Stress Conditions

by
Ebtessam A. Youssef
1,
Marwa M. Abdelbaset
1,
Osama M. Dewedar
1,
José Miguel Molina-Martínez
2 and
Ahmed F. El-Shafie
1,*
1
Water Relations and Field Irrigation Department, National Research Centre, Cairo 12622, Egypt
2
Food Engineering and Agricultural Equipment Department, Technical University of Cartagena, 30203 Cartagena, Spain
*
Author to whom correspondence should be addressed.
Agriculture 2023, 13(3), 610; https://doi.org/10.3390/agriculture13030610
Submission received: 31 January 2023 / Revised: 21 February 2023 / Accepted: 27 February 2023 / Published: 2 March 2023
(This article belongs to the Special Issue Agricultural Water Stress and Deficit Irrigation)

Abstract

:
Understanding the anticipated impact of climate change on agriculture, as well as water conservation, is critical to achieving food security. Therefore, during this critical time and due to reduced water resources and increased food demand, it is important to study the impact of water-stress conditions on crops. Two successive seasons were carried out through the 2021 and 2022 seasons to estimate the crop coefficient (Kc) and study the effect of abscisic acid on red cabbage plants (Brassica oleracea var. capitata) under water-stress conditions at a private farm in the Bilbeis region, Sharqia Governorate, Egypt. The aim was to estimate the crop coefficient (Kc) and effect of different concentrations of abscisic acid (ABA) (0, 25, 50, and 75 ppm) under various irrigation levels (100, 80, and 60% of field capacity “FC”) on the growth process and yield parameters of red cabbage plants. The results revealed that the average estimated crop coefficient (Kc) for red cabbage crops under standard conditions, 100% of FC, was 0.75, 1.07, 1.2 and 0.88 and 0.77, 1.2, 1.25 and 0.82 for Initial, Development, Mid, and End stages during the 2021 and 2022 growing seasons, respectively. Data collected during both seasons clearly showed that all treatments significantly increased both the plant’s growth process and yield parameters when compared to the control. However, abscisic acid (ABA, 75 ppm) application with irrigation requirements (80% of FC) was statistically the most effective treatment in this study. Hence, this means a water savings of 20% can be achieved without significantly compromising the yield.

1. Introduction

Climate change will have a negative impact on the agricultural sector and the elements of agricultural development, especially in developing countries. Crop production will be impacted by climate change, which will exert significant stress on their growth and development, and any change in climatic conditions is likely to threaten global food production and security [1,2]. The anticipated increase in temperature and the altered seasonal rainfall pattern will have a negative impact on some crops’ production. Understanding the predicted effects of climate change on the production of different crops is crucial for studying future global food and water security in order to put in place all possible measures to counter those effects [3,4,5].
Cabbage is a good source of vitamins A and C, fiber, and iron. It contains natural chemical compounds that may help prevent specific types of cancer and can boost the body’s resistance to disease. Red or purple cabbage’s color changes according to the pH of the soil because the plant contains an anthocyanin-related pigment (flavins). The leaves are colored from dark red to purple in varying degrees, as anthocyanins accumulate in different plant tissues and under the influence of different conditions [6]. During the 2019–2020 season, Egypt’s total cabbage production area was 44,474 fed (18,531 ha), which produced 533,700 tons and an average of 12 tons fed−1 (29 tons ha−1) of cabbage plants [7].
Drought, a form of abiotic stress that has become more prevalent in arid and semi-arid places such as Egypt, directly inhibits crop growth by reducing cell elongation, cell turgor, or cell volume due to the covering of xylem and phloem vessels, which prevents any translocations [8].
Therefore, it is very important, when facing future changes in water availability, to develop a sustainable water management plan. Abscisic acid (ABA) plays a very important role as a plant growth regulator and is adaptive to biotic and abiotic stresses. [9,10]. Abscisic acid plays a crucial role in the processes of plant resistance and adaptability to a variety of abiotic stress situations. Additionally, ABA plays an important role in many physiological processes, including seed formation, dormancy, germination, and reproduction. Moreover, ABA regulates reactions to environmental stresses, including heat, cold, salt, drought, and excessive levels of radiation [11].
For these reasons mentioned above, estimating the amount of irrigation is crucial for managing irrigation. In addition, irrigation management includes regulating irrigation frequency and duration to maximize plant stress reduction and assure irrigation efficacy [12]. Therefore, it is vital to understand the relationship between field capacity (FC) and root zone depletion, where root zone depletion (Dr) represents the water shortage relative to field capacity (FC), and reflects soil moisture content [13].
On the other hand, to estimate crop evapotranspiration (ETc) and the ideal crop water requirement, it is important to use the actual crop coefficient (Kc). This coefficient results from the relationship between crop evapotranspiration (ETc) and reference evapotranspiration (ETo) [14,15]. Moreover, climate change will affect evapotranspiration rates and may even lead to drought, thereby impacting soil moisture, crop water use, and the crop coefficient [1].
Therefore, this study aimed to estimate the crop coefficient (Kc) and the effect of different concentrations of abscisic acid (ABA) (0, 25, 50, and 75 ppm) under various irrigation levels (100, 80, and 60% of field capacity “FC”) on the growth process and yield parameters of red cabbage plants in sandy loam soil conditions.

2. Material and Methods

2.1. The Experimental Site and Crop

Two successive seasons carried out through the 2021 and 2022 seasons to estimate the crop coefficient and investigate the abscisic acid effect on red cabbage plants (Brassica oleracea L. var. capitata “Primero”) under water stress. The goal of this study was enhanced red cabbage plant growth process and yield parameters by using different concentrations of abscisic acid (ABA) of 25, 50, and 75 ppm as well as the control (0 ppm) under different levels of irrigation (100, 80, and 60% of field capacity “FC”) in sandy loam soil conditions at a private farm in the Bilbeis region, Sharqia Governorate, Egypt (latitude 30°22′04.9″ N, longitude 31°37′38.2″ E, and mean altitude 21 m above sea level), Figure 1. The main physical properties analyses were determined in the site and in the laboratory at the beginning of the trial and are reported in Table 1.

2.2. Irrigation System and Experimental Description

An automatic drip irrigation system was set up according to the treatments, and hydraulically tested prior to use in the pilot site. The system consisted of a pump, pressure gauges, a filter, an injection unit, center control unit, solenoid valves, soil moisture sensors, and a measurement unit. The emitters were built-in with an average discharge of 4.0 L h−1 at 1.0 bar pressure and a 0.3 m emitter spacing, and 0.7 m lateral spacing. Scheduled irrigation was applied using soil moisture sensors connected to a solenoid valve and center control unit, to automatically irrigate at 45% depletion of field capacity (FC) and stop irrigation when the soil moisture content reached 100, 80, and 60% of the field capacity, under a drip irrigation system. The sensors were installed at depths from 0 cm to 15 cm and from 15 cm to 30 cm.

2.3. Moisture Deficit and Depletion % of Irrigation

To estimate the moisture content depletion root zone (between 0.2 and 0.4 m from planting to harvest at different growth stages) at the end of the day is used to obtain the daily root zone water balance by the following equation [13,16]:
D r i = D r i 1 ( P i R o i   ) I i C R i + E T c i + D P i  
where: Dri: the root zone depletion per day i (mm), Dri−1: the moisture content in the root zone at the previous day (mm), Pi: the precipitation on day i (mm), Roi: the surface soil runoff on day i (mm), Ii: the irrigation depth per day i which infiltrates the soil (mm), CRi: the capillary rise from the groundwater table per day i (mm), ETci: the crop evapotranspiration per day i (mm), and DPi: the lost water of the root zone on day i (mm). Moisture deficit is the amount of water (mm) below field capacity before irrigation.

2.4. Estimation of the Crop Coefficient (Kc) for Red Cabbage

The crop coefficient (Kc) under standard conditions and soil water-stress conditions was calculated according to [13]: Equations (2)–(10). The average meteorological parameters needed for crop evapotranspiration (ETc) calculation were recorded using a computer model and applying the Penman–Monteith equation, and to estimate the crop coefficient (Kc) values.
I R g = ( E T c R ) K r   E i
E T c = E T o × K c
K c = E T c E T o
K c = K C b + K e
E T c   a d j = ( K s   K C b + K e )   E T o
From Equation (5):
E T c   a d j = K C     K s × E T o
where:
K C   a d j u s t   = K c   K s
Then:
        K C   a d j u s t   = E T c   a d j E T o
K s = K C   a d j u s t   K C  
where: IRg = gross irrigation requirements, mm day−1, ETC = crop evapotranspiration, mm day−1. R = water received by plant from sources other than irrigation, mm (for example, rainfall), Kr = ground cover reduction factor, correction factor for limited wetting according to the 80% red cabbage canopy coverage, Kr = 0.90 [17], Ei = irrigation efficiency, %, ETo = reference evapotranspiration mm day−1, Kc = calculated crop coefficient under standard conditions, Kcb = basal crop coefficient, Ke = soil water evaporation coefficient, ETC adjust = crop evapotranspiration under soil water-stress conditions, and KS = water stress coefficient, for soil water-limiting conditions, Ks < 1. Where there is no soil water stress, Ks = 1.
The coefficient (Ks) will vary under the irrigation treatments of 60 and 80% of the field capacity.
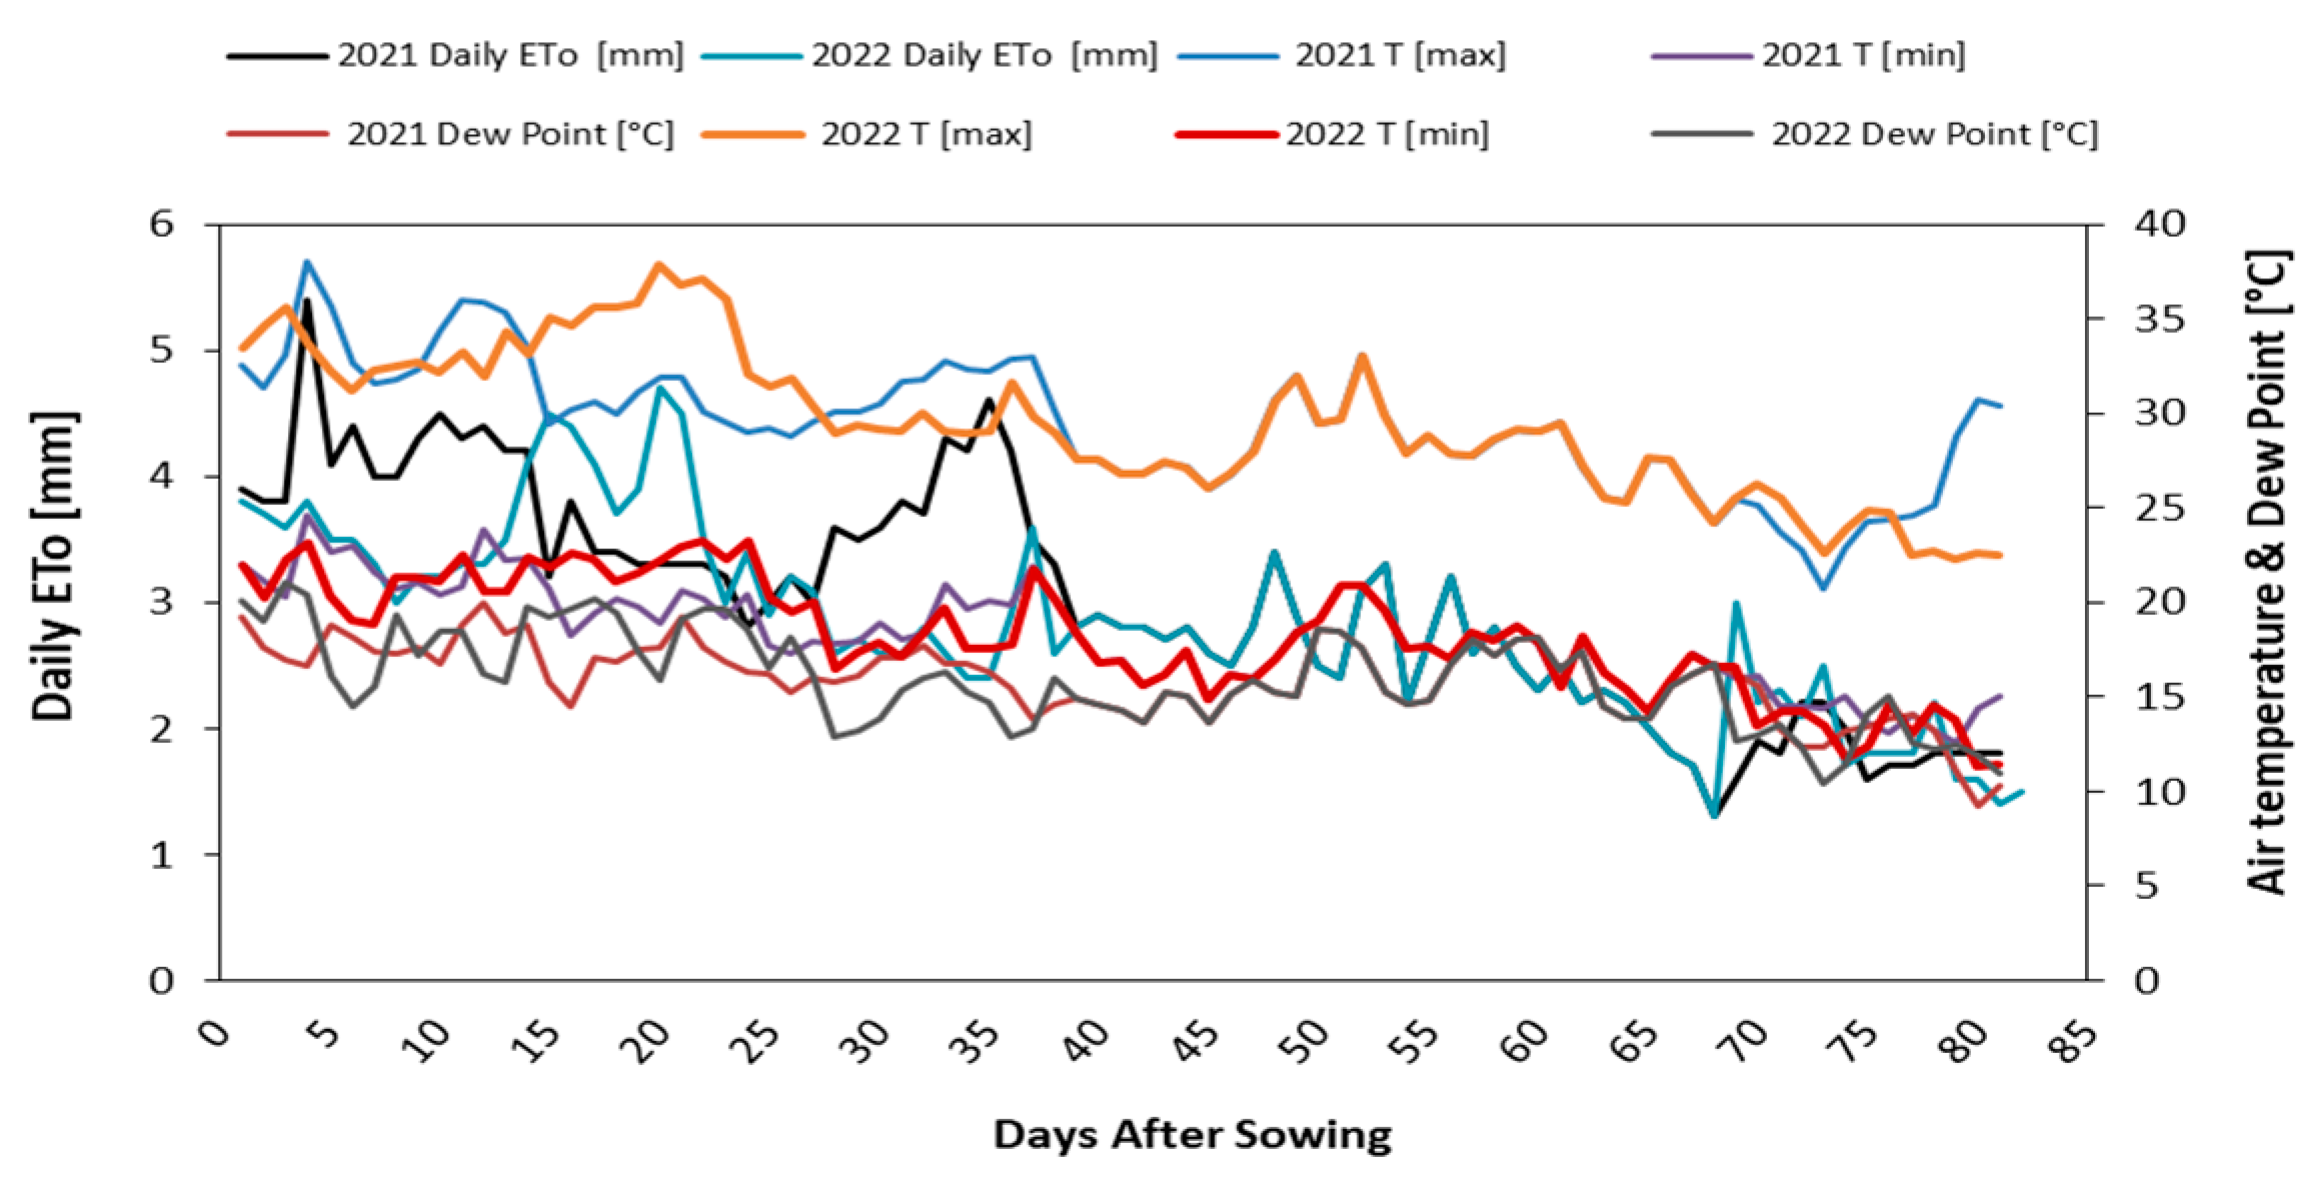
A gross irrigation requirement was converted from m3/ha/day to mm/ha/day [18]. The daily meteorological data and reference evapotranspiration for the experimental site of Bilbeis region over the two seasons are shown in Figure 2.

2.5. Experimental Design and Layout

The experimental layout was a split-plot system in a complete randomized block design that included 12 treatments with five replicates. The main plot (first factor) comprised three irrigation levels (100, 80, and 60% of FC) and the sub-plot (second factor) was an abscisic acid application (control, 25, 50, and 75 ppm). Additionally, the experimental unit area was 52.5 m2. It contained three drip lines 25 m in length and 0.7 m in width. Healthy seedlings with uniform size (35 days from seed sowing) of red cabbage (Brassica oleracea L. var. capitata (Primero) were selected from a commercial nursery and transplanted on the 10th of September in both seasons. Then, they were transplanted on both sides of the drip line at a distance of 0.3 m. Irrigation treatments (100, 80, and 60% of field capacity) were applied after planting. These treatments reflect conditions labeled severe water stress, moderate, and optimum level of water supply, respectively. The plants in every treatment were sprayed with abscisic acid and applied at 20 and 40 days from planting. In addition, the tested irrigation levels based on different rates of irrigation water, i.e., 2285, 1855, and 1518 m3 ha−1 in the 2021 season and 2219, 1801, and 1485 m3 ha−1 in the 2022 season.

2.6. Crop Characteristics

2.6.1. Vegetative Growth Characteristics

Red cabbage heads were harvested when they reached horticultural maturity on the first of December (about 82 days after transplanting), and the samples were taken randomly in both seasons on the first of December to record the vegetative growth characteristics: plant height (cm), head diameter (cm), head volume (cm3 by water displacement), plant fresh weight (g), head fresh weight (g), root fresh weight (g), number of green leaves per plant, number of red leaves per plant, and number of total leaves per plant.

2.6.2. Leaf Total Chlorophyll

Leaves were collected from the mid-section of plant to reduce age effects and the leaf total chlorophyll was recorded in fresh leaves per each plant using a portable chlorophyll meter SPAD 502, according to [19].

2.6.3. Leaf TSS Content

Total soluble solids percentage (TSS) was determined using a hand refractometer from the leaves of the plant mid-section.

2.6.4. Leaf Cell Sap Osmotic Pressure (atm)

Leaves’ cell sap concentration and osmotic pressure (atm) were determined according to [20] from the leaves of the plant mid-section.

2.7. Total Yield of Red Cabbage

At harvest time of red cabbage, the total weight of plants in each treatment was recorded by harvesting red cabbage as Kg per 1 m2 calculated, and then the total yield as ton ha1 was calculated.

2.8. Statistical Analysis

The experimental design was a split-plot system in a complete randomized block design with five replicates. The data obtained were statistically analyzed using the analysis of variance method; the values of least significant differences (L.S.D. at 5% level) were calculated to compare the means of the different treatments, as reported by [21]. Additionally, the differences between means were differentiated by using Duncan’s range test [22].

3. Results and Discussion

3.1. Moisture Deficit and Depletion % of Irrigation

The estimation of irrigation amount is an important factor for irrigation management. Moreover, irrigation management is about controlling the amount and time to control the rate and intervals of irrigation to be effective, without stressing the plants [12].
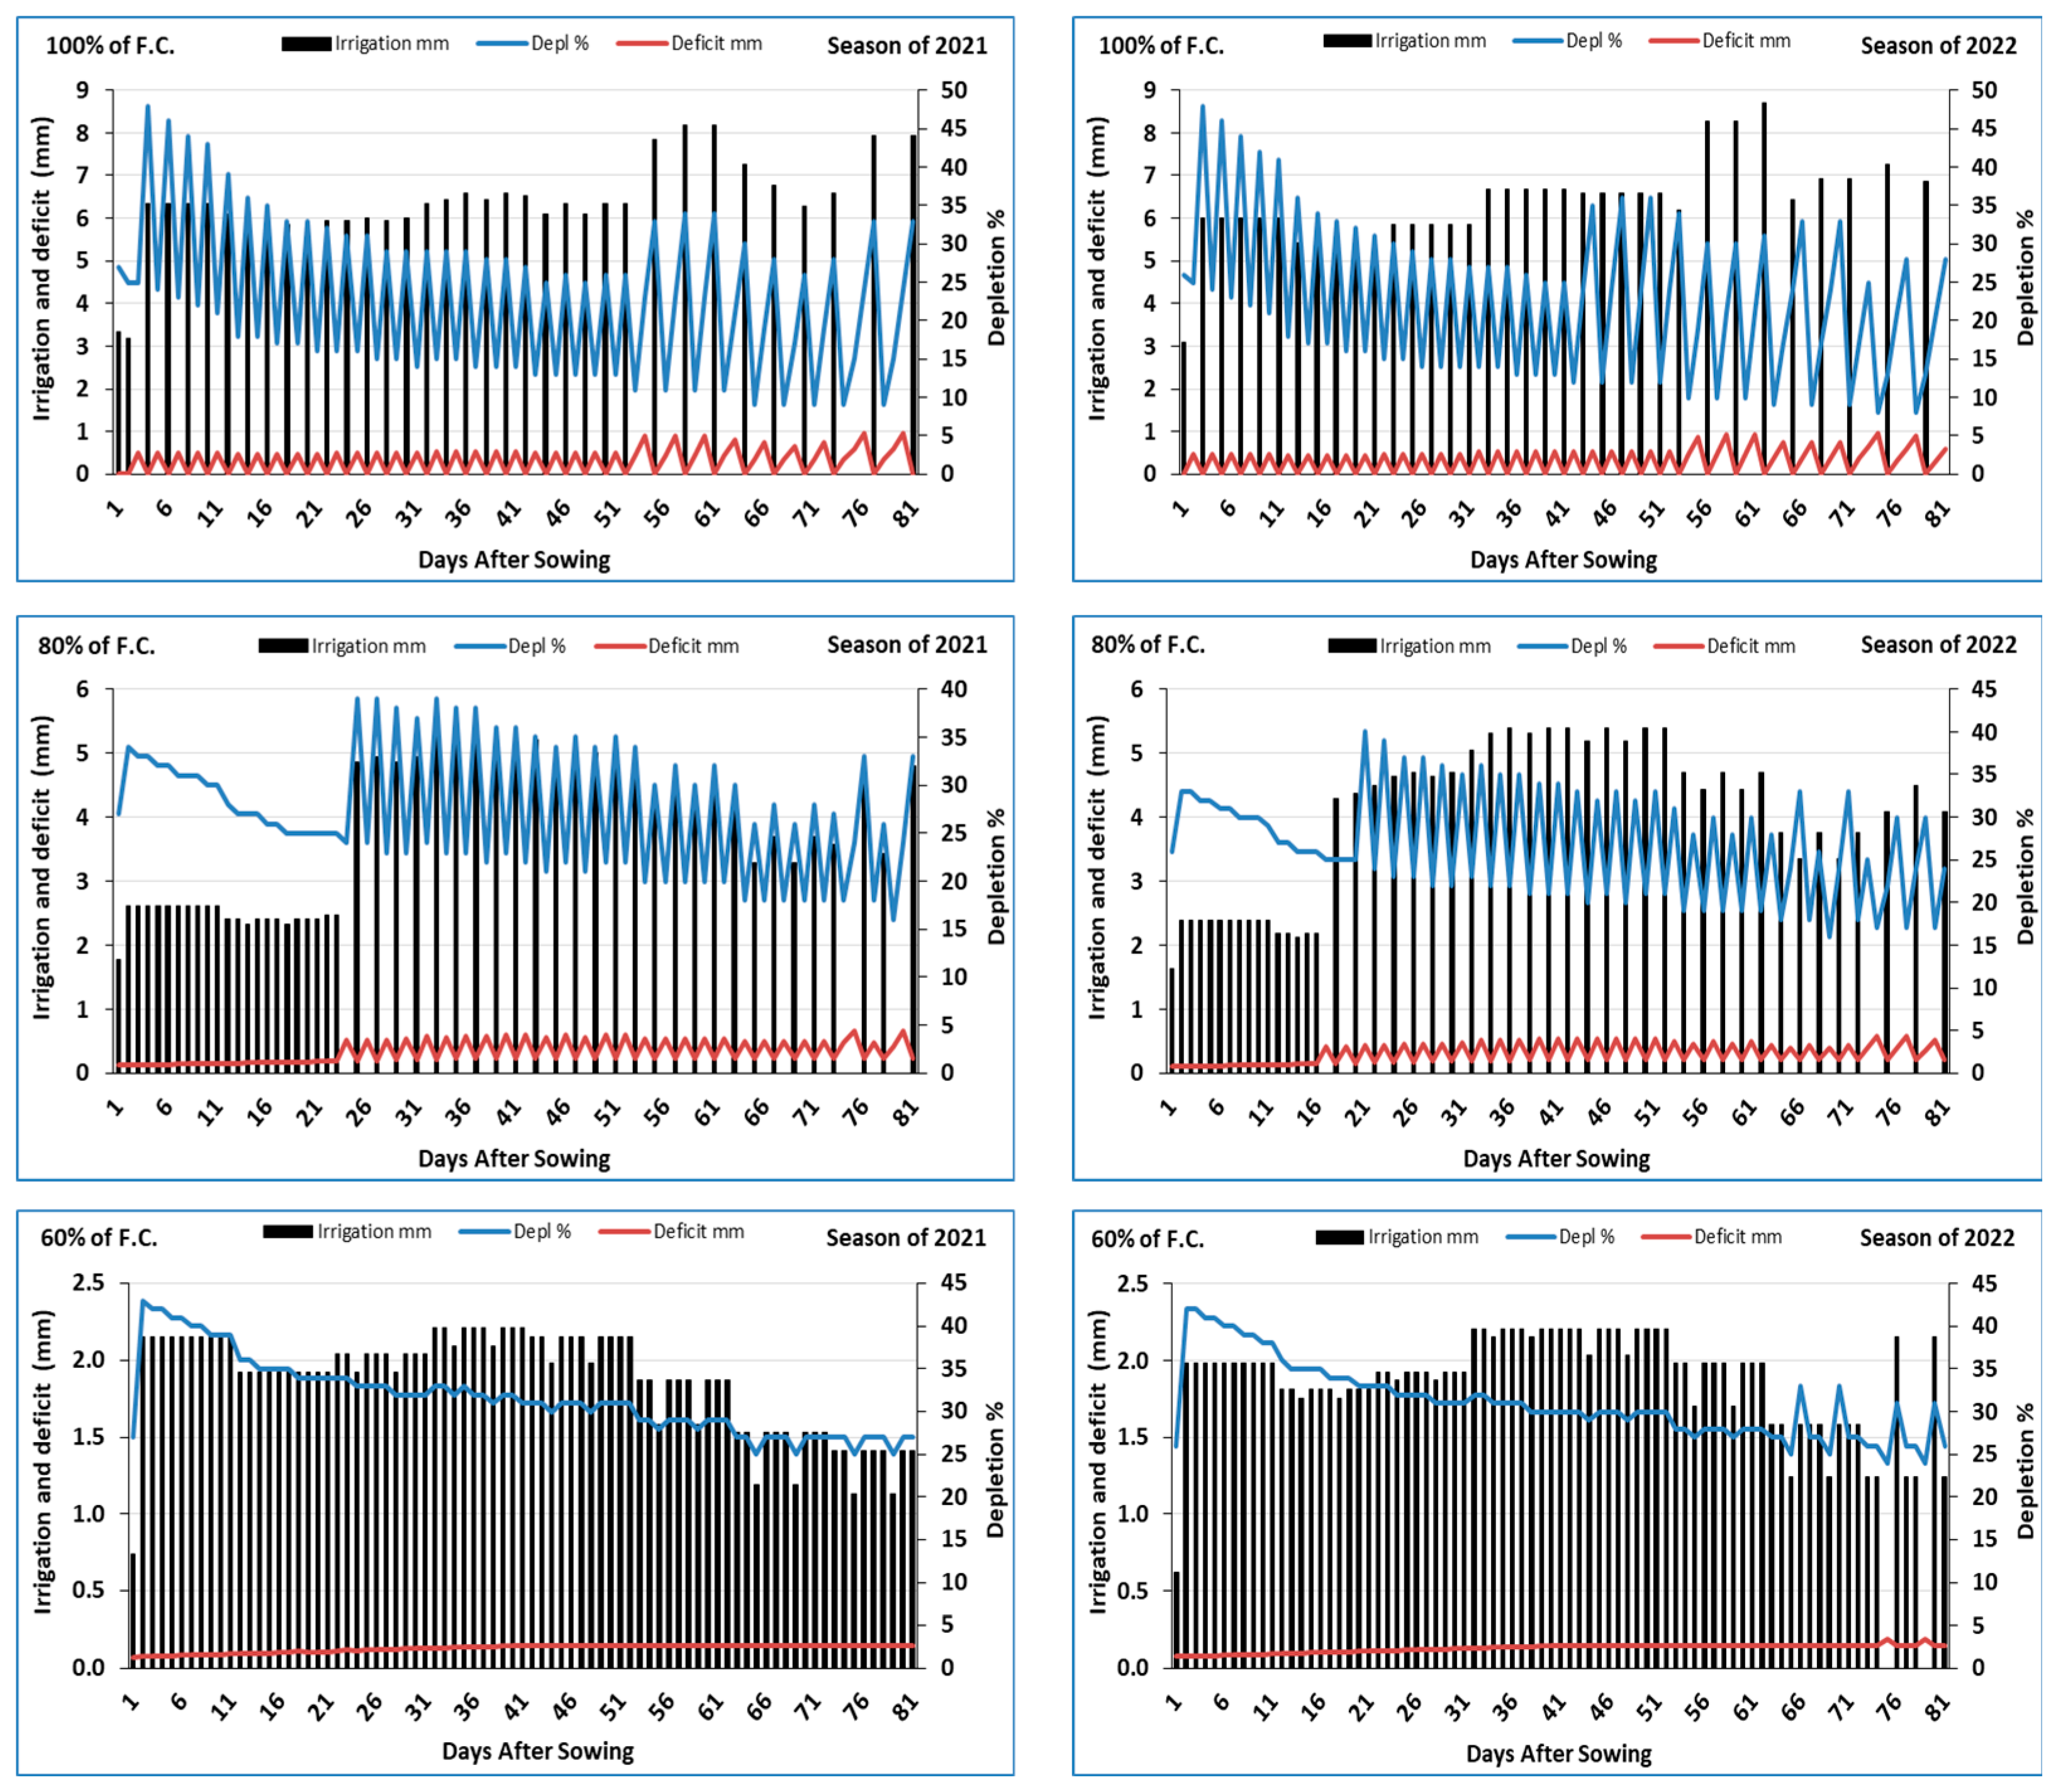
Figure 3 shows the depletion %, moisture deficit, and irrigation (mm) under irrigation rates (100, 80, and 60% of field capacity “FC”) for the 2021 and 2022 seasons. The total irrigation amounts for red cabbage were 2285, 1855, and 1518 m3 ha−1 and 2219, 1801, and 1485 m3 ha−1 under 100, 80, and 60% of FC for the 2021 and 2022 seasons, respectively. On the other hand, the deficit rates (mm) increased with high depletion %; in contrast, the number of irrigation intervals decreased with the very close values between them, for 60% of FC, compared with 80 and 100% of FC for the 2021 and 2022 growing seasons.
However, there were moderate deficit rates (mm) with moderate depletion (%) for 80% of FC compared with 60% of FC. It was observed that the irrigation intervals were very close, with increasing depletion (%) and deficit rates (mm) in the red cabbage initial stage. This is due to the increase in evaporation from the soil surface as a result of the low density of vegetation cover with an increase in evapotranspiration during the initial stage of plant growth [23,24].

3.2. Estimation of the Crop Coefficient (Kc) for Red Cabbage

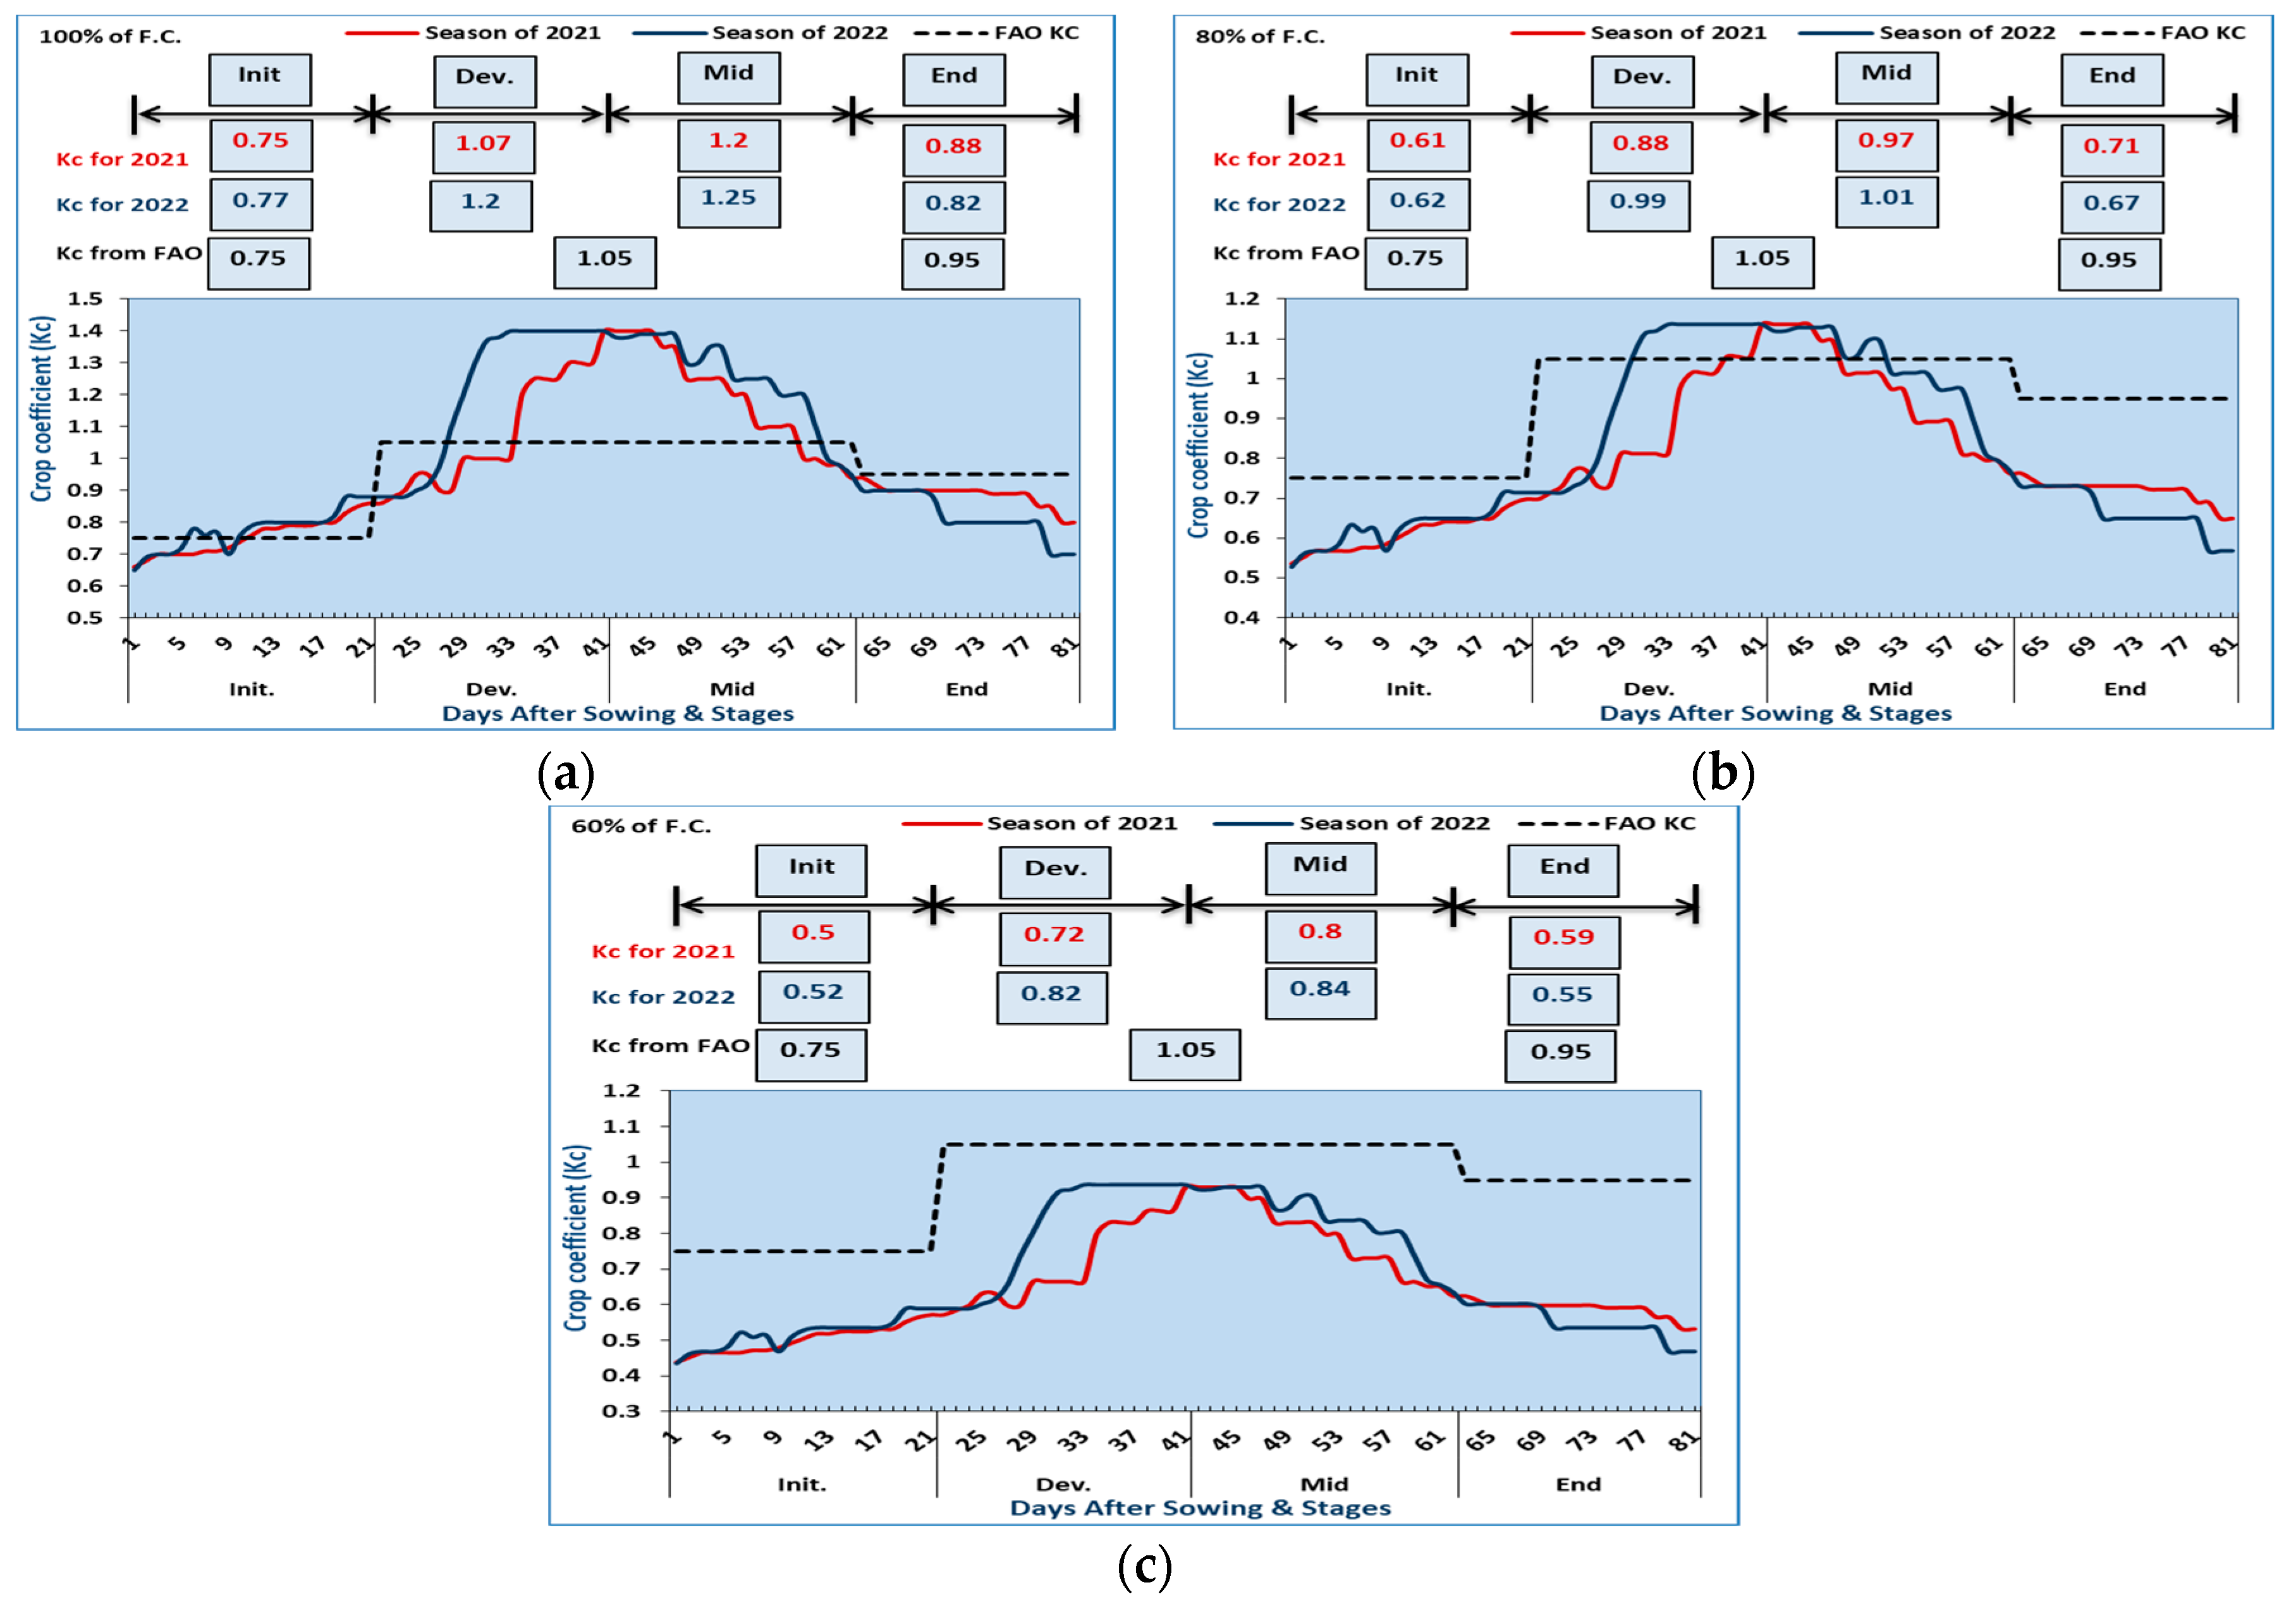
During this study, the crop coefficient was estimated using the ratio between the adjusted or actual crop evapotranspiration (ETc adjust) and potential (ETo) from the equation of Penman–Monteith [13]. Figure 4 shows the crop coefficient (Kc) estimation for red cabbage crops in the Bilbeis region and the current experiment conditions with irrigation at 100, 80, and 60% of (FC). It is clear that the average crop coefficient (Kc) for red cabbage crops was 0.75, 1.07, 1.2, and 0.88 and 0.77, 1.2, 1.25, and 0.82 under standard conditions, 100% of FC for Initial, Development, Mid, and End stages during the 2021 and 2022 growing seasons, respectively.
Management is well done when actual standard conditions generally prevail. Then, the reference evapotranspiration is calculated under standard conditions. Otherwise, when conditions in the field differ from the standard conditions, a lack of soil water may reduce crop evapotranspiration and soil water uptake. Then, the reference evapotranspiration is recalculated and, in turn, the crop coefficient (Kc) differs [13,14,15,25]. This is demonstrated in Figure 4; the estimation of the red cabbage crop coefficient differed depending on irrigation amount (60 and 80% FC). According to Figure 4, the average crop coefficient (Kc) for red cabbage crops was 0.61, 0.88, 0.97, and 0.71 and 0.62, 0.99, 1.01, and 0.67 under standard conditions, 80% of FC for Initial, Development, Mid, and End stages during the 2021 and 2022 growing seasons, respectively. The average crop coefficient (Kc) for red cabbage crops was 0.5, 0.72, 0.8, and 0.59 and (0.52, 0.82, 0.84, and 0.55 under non-standard conditions, 60% of FC for Initial, Development, Mid, and End stages during the 2021 and 2022 growing seasons, respectively.
The crop coefficient depends on the variation in time and growth stage, as well as the change in the weather conditions and in soil moisture by evaporation, always expressed as a function of the crop coefficient. The results indicated that the optimal values of crop coefficient (Kc) were achieved at 100% FC, followed by 80% FC, when compared with the results reported in FAO Paper 56. The red cabbage crop coefficient was 0.7, 1.05, and 0.95 for Initial, Mid, and End stages [13].
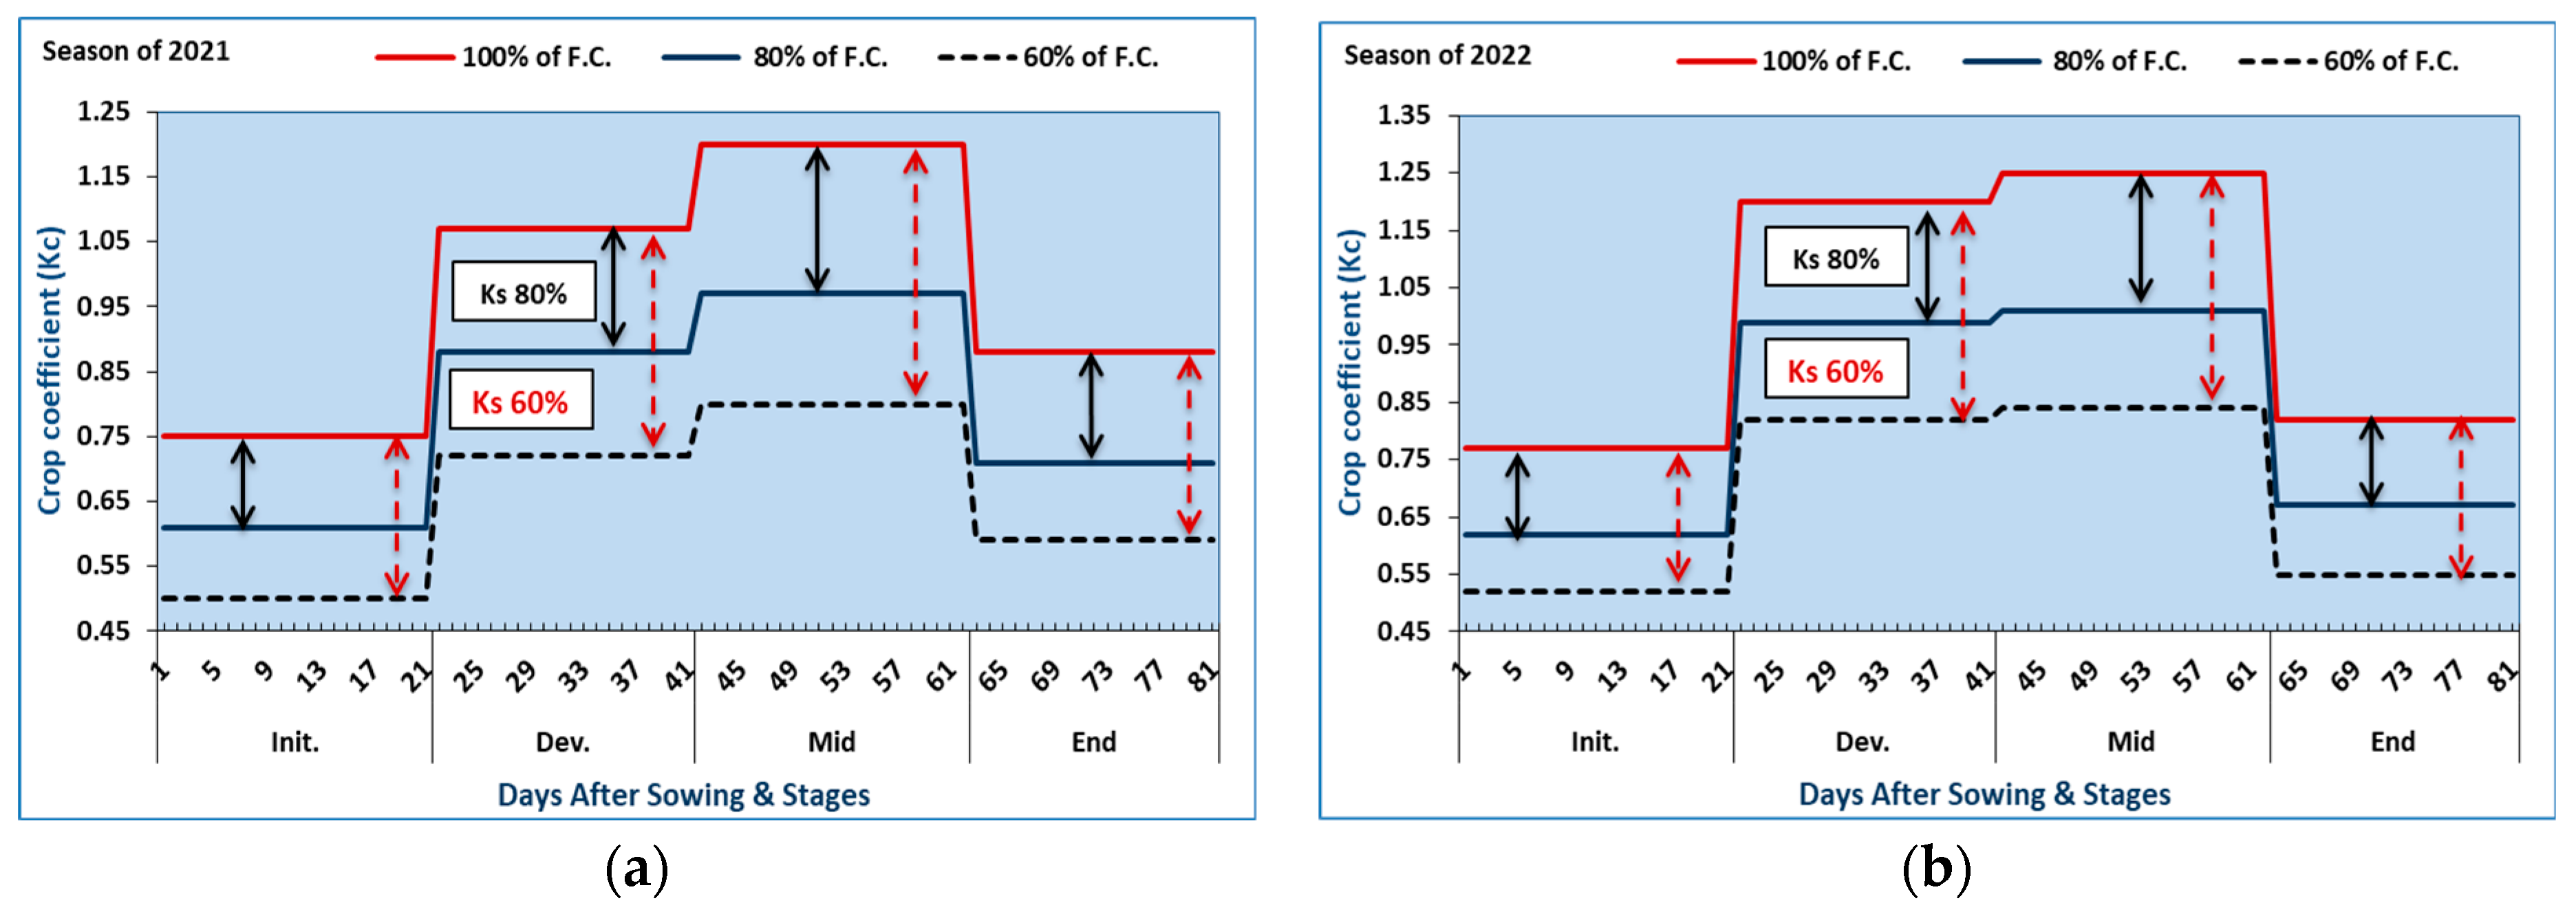
The different methods available, focusing on the FAO 56 framework, commonly used for estimation of the actual crop coefficient (Kc), have shown that the estimation of Kc is affected by changes in soil water stress [26]. Therefore, to adjust the crop coefficient under water stress, the water stress coefficient (Ks) is used [27]. The water stress coefficient (Ks), which is the relationship between the Kc of non-standard conditions and standard conditions, was calculated from Equation (10) [13]. Figure 5 shows the average calculated Ks under water-stress conditions for red cabbage crops was 0.81 and 0.67 for 80 and 60% of FC, respectively, for all growth stages and both growing seasons.
Climate change may have an impact on estimates of crop evapotranspiration (ETc). Obtaining the actual values of the Kc coefficient considering the new scenarios can fill the current gap on this topic at this time. For this reason, studies of yield coefficient (Kc) estimation are needed for new cultivars, different growing seasons, and different regions under different conditions [28].

3.3. Crop Characteristics

The data presented in Table 2 showed a great positive effect of abscisic acid concentrations under different rates of field capacity and their interaction with some growth parameters of red cabbage plants in both seasons.
As for the water stress factor, the highest significant value for plant height was 50.97 cm with 100% of FC compared to 60% of FC, which recorded 36.07 cm in the first season. Additionally, the head diameter and head volume took the same direction to plant height; this was true in both seasons. For the abscisic acid concentration factor, the highest significant value for plant height was 46.32 cm with the control compared to abscisic acid (75 ppm), for which the record was 41.29 cm in the first season. On the other hand, the head diameter and head volume took the contrary direction to plant height. They achieved the highest significant values with abscisic acid (75 ppm), while the lowest values were under the control treatment. For interaction, the highest significant value for plant height was 52.73 cm with 100% of FC, combined with abscisic acid (0 ppm) in the first season. On the other hand, the head diameter and head volume achieved the highest significant values with 100% of FC combined with abscisic acid (75 ppm).
Generally, the crop parameters were increased by increasing the % of FC, which may be due to increased soil moisture availability, moderate evaporation from the soil surface, and N, P, and K values [29,30]. Results regarding conserving water supply levels were in agreement with those mentioned by [31,32]. On the other hand, particularly at moderate and high-water potentials, plants treated with abscisic acid showed higher relative water content than untreated plants. These effects are due to decreased transpiration, which influences stomata control and may increase water flux into roots [33]. The results are congruent with those obtained by [11,34].
Table 3 shows the significant statistical impact of abscisic acid concentrations at different rates of field capacity and their interaction on some yield parameter indicators (plant, head, and root fresh weight) of red cabbage plants in both seasons.
As for the field capacity factor, the highest significant value for plant fresh weight was 572.69 g with 100% of FC, compared to 60% of FC, which recorded 283.18 g in the first season. Additionally, the head fresh weight and root fresh weight took the same direction to plant fresh weight; this was true in both seasons. For the abscisic acid concentration factor, the highest significant value for plant fresh weight was 476.08 g with abscisic acid (75 ppm) compared to the control, which recorded 391.14 g in the first season. Additionally, head fresh weight took the same direction to plant fresh weight in both seasons, while the root fresh weight took the contrary direction to plant fresh weight. Under interaction, the highest significant value for plant fresh weight was 626.98 g with 100% of FC combined with abscisic acid (75 ppm) in the first season. In addition, head fresh weight took the same direction as plant fresh weight in both seasons. On the other hand, the root fresh weight took the contrary direction to plant fresh weight.
The results of the current study showed that water supply levels had a significant effect on yield characteristics; the present investigation agrees with [35,36,37]. The increase in crop yield is due to the facilitation of plant water uptake under moderate water levels without exposure to water stress [30,38]. Additionally, this might be due to the effect of water on some metabolic processes in the plant cell, and the availability of N, K, and P uptake in the plant root zone as well as enhanced photosynthetic processes and carbohydrate production [39,40,41].
Treatments with abscisic acid had higher yield parameter indicators than untreated plants, especially under moderate and high-water contents. Such effects are due to reduced transpiration via its effects on stomatal regulation and are possible by increasing water flux into roots [33].
The existing data in Table 4 clearly show the statistical impact of abscisic acid concentrations under different rates of field capacity and their interaction on some growth parameters of red cabbage plants in both seasons.
As for the water stress factor, the highest significant value for the total number of leaves per plant was 24.01 with 100% of FC compared to 60% of FC, which recorded 19.21 in the first season. Additionally, the numbers of green and red leaves took the same direction as the total number of leaves; this was true in both seasons. For abscisic acid concentration, the highest significant value for the total number of leaves per plant was 22.82 with the control compared to abscisic acid (75 ppm), which recorded 20.84 in the first season. Additionally, the numbers of green and red leaves took the same direction as the total number of leaves; this was true in both seasons. For interaction, the highest significant value for the total number of leaves per plant was 24.75 with 100% of FC combined with (0 ppm) of abscisic acid in the first season. In addition, the numbers of green and red leaves showed a nearly similar trend as the total number of leaves per plant in both seasons. Overall, the results of water stress are consistent with those reported by [9,10,42,43]. The effect of abscisic acid is that it enhances the drought tolerance of coffee seedlings by delaying the onset of wilting point [11]. These results are in agreement with those obtained by [34,43].
Table 5 illustrates the impact of abscisic acid concentrations under different rates of field capacity and their interaction on total chlorophyll, leaf cell sap TSS, and leaf cell sap osmotic pressure parameters of red cabbage plants in both seasons.
During the first season, the highest significant value for total chlorophyll was 89.29 with 100% of FC compared to 60% of FC, which recorded 66.59. For the abscisic acid concentration factor, the highest significant value for total chlorophyll was 82.63 with the control compared to abscisic acid (75 ppm), which recorded 72.36 in the first season. For interaction, the highest significant value for total chlorophyll was 98.15 with 100% of FC combined with abscisic acid (0 ppm) in the first season; this was true in both seasons.
On the other hand, leaf cell sap TSS and leaf cell sap osmotic pressure parameters took a contrary direction to total chlorophyll in both seasons, which was true with water stress factor and abscisic acid concentrations as well as the interaction between them. In this respect, the results of water stress are in agreement with those obtained by other researchers [30,44].
The results show that abscisic acid has a positive effect on plants, as it protects them from drought damage by causing stomata closure to reduce water loss via transpiration and increase hydraulic conduction of water movement from roots to leaves [44,45]. The results are in agreement with those obtained by [46,47].
Generally, the use of abscisic acid (ABA) led to reduced stomatal conductance and decreased both transpiration and net photosynthetic rate [48]. This decrease in photosynthetic rate is related to the accumulation of carbohydrates. In addition, the respiration rate did not increase with higher carbohydrate levels in the presence of ABA [49].

3.4. Total Yield of Red Cabbage

Figure 6a,b showed the effect of abscisic acid concentrations under different rates of field capacity on the fresh yield per hectare of red cabbage. Overall, the highest values were 27 and 29.7 ton ha−1 under 100% of FC and abscisic acid (75 ppm) for the two growing seasons, respectively. The yield under ABA (75 ppm) was higher than that of ABA (0 ppm) by 18.5% and 24% for the first and second seasons, respectively, under 100% of FC. The same pattern can be seen for 80 and 60% of FC. Irrigation with 80% FC and 75 ppm abscisic acid had the same effect on red cabbage yield as irrigation with 100% FC and 0 ppm abscisic acid for the two growing seasons; this means water savings of 20% can be achieved without significantly compromising the yield [50].

4. Conclusions

Climate change may have an impact on estimates of crop evapotranspiration (ETc). Obtaining the actual values of the Kc coefficient considering the new scenarios can fill the current gap on this topic at this time. In this study, the crop coefficient was estimated at different irrigation levels (100, 80, and 60% of field capacity, “FC”), utilizing the ratio between the adjusted or actual crop evapotranspiration (ETc adjust) and potential (ETo) from the equation of Penman–Monteith. The results showed that the optimal values of crop coefficient (Kc) were achieved at 100% of FC, followed by 80% of FC. Using different concentrations of abscisic acid improved vegetative growth and yield at different irrigation rates of field capacity (FC) for the two growing seasons. The highest vegetative growth and yield were obtained with abscisic acid (75 ppm) and 100% of FC, followed by abscisic acid (75 ppm) and 80% of FC in both seasons. On the other hand, the use of abscisic acid (ABA) led to reduced stomatal conductance and decreased both transpiration and net photosynthetic rate. This decrease in photosynthetic rate is related to the accumulation of carbohydrates. In addition, the respiration rate did not increase with higher carbohydrate levels in the presence of ABA. Therefore, abscisic acid has a positive effect on plants, as it protects them from drought damage by causing stomata closure to reduce water loss via transpiration and increase hydraulic conduction of water movement from roots to leaves.
Overall, the use of abscisic acid (75 ppm) with 80% of (FC) results in cost-effective vegetative growth and yield of red cabbage plants. Therefore, it could be the key and most effective way to further reduce water use and increase crop productivity.

Author Contributions

E.A.Y., M.M.A., O.M.D., J.M.M.-M. and A.F.E.-S. contributed to the conception of the study; E.A.Y., M.M.A., O.M.D. and A.F.E.-S. performed the experiments; E.A.Y., M.M.A., O.M.D. and A.F.E.-S. contributed significantly to analysis and manuscript preparation; E.A.Y., M.M.A., O.M.D. and A.F.E.-S. performed the data analyses and wrote the manuscript; E.A.Y., M.M.A., O.M.D. and A.F.E.-S. helped perform the analysis with constructive discussions; J.M.M.-M.: supervision. All authors have read and agreed to the published version of the manuscript.

Funding

This research was funded by the Science, Technology & Innovation Funding Authority in Egypt, (STDF), Egyptian–Spanish Joint Technological Co-operation Program, International Cooperation Grants, Call 3, Grant number (42523), through the project “An Innovative Technology for Improving Irrigation Water Use in the Mediterranean Region Using Geotextile Material”.

Acknowledgments

The authors are grateful to the Science, Technology & Innovation Funding Authority (STDF) and its staff members for their support to carry out this work. Thanks are also extended to National Research Centre (NRC), Cairo, Egypt.

Conflicts of Interest

The authors declare no conflict of interest.

References

  1. IPCC (Intergovernmental Panel on Climate Change). Impacts, adaptation and vulnerability. Part A: Global and sectoral aspects. In Contribution of Working Group II to the Fifth Assessment Report of the Intergovernmental Panel on Climate Change; Barros, V.R., Field, C.B., Dokken, D.J., Mastrandrea, M.D., Mach, K.J., Bilir, T.E., White, L.L., Eds.; Cambridge University Press: Cambridge, UK; New York, NY, USA, 2014; p. 688. [Google Scholar]
  2. Dewedar, O.; Plauborg, F.; El-Shafie, A.; Marwa, A. Response of potato biomass and tuber yield under future climate change scenarios in Egypt. J. Water Land Dev. 2021, 49, 139–150. [Google Scholar]
  3. Kumar, M. Impact of climate change on crop yield and role of model for achieving food security. Environ. Monit. Assess. 2016, 188, 465. [Google Scholar] [CrossRef] [PubMed]
  4. Mall, R.K.; Gupta, A.; Sonkar, G. Effect of climate change on agricultural crops. In Current Developments in Biotechnology and Bioengineering; Elsevier: Amsterdam, The Netherlands, 2017; pp. 23–46. [Google Scholar] [CrossRef]
  5. Lipovac, A.; Mandić, M.V.; Vuković, A.; Stričević, R.; Ćosić, M. Assessment of AquaCrop Model on Potato Water Requirements in Climate Change Conditions. In Proceedings of the 10th Eastern European Young Water Professionals Conference IWA YWP, Zagreb, Croatia, 7–12 May 2018; pp. 70–77. [Google Scholar]
  6. Hegazi, A.M.; El-Shraiy, A.M. Stimulation of photosynthetic pigments, anthocyanin, antioxidant enzymes in salt stressed red cabbage plants by ascorbic acid and potassium silicate. Middle East J. Agric. 2017, 6, 553–568. [Google Scholar]
  7. Ministry of Agriculture and Land Reclamation (MALR) Arab Republic of Egypt. Sustainable Agricultural Development Strategy Towards 2030; The Food and Agriculture Organization (FAO): Cairo, Egypt, 2020. [Google Scholar]
  8. Taha, N.M.; Noura, M.; Shaimaa, S.H.; Elrahman, F.A.; Hashem, F.A. Improving yield and quality of garlic (Allium sativum L.) under water stress conditions. Middle East J. Agric. 2019, 8, 330–346. [Google Scholar]
  9. Leng, P.; Yuan, B.; Guo, Y. The role of abscisic acid in fruit ripening and responses to abiotic stress. J. Exp. Bot. 2014, 65, 4577–4588. [Google Scholar] [CrossRef]
  10. Cohen, A.C.; Bottini, R.; Pontin, M.; Berli, F.J.; Moreno, D.; Boccanlandro, H.; Travaglia, C.N.; Piccoli, P.N. Azospirillum brasilense ameliorates the response of Arabidopsis thaliana to drought mainly via enhancement of ABA levels. Physiol. Plant. 2015, 153, 79–90. [Google Scholar] [CrossRef]
  11. Ngoc-Thang, V.U.; Jong-Man, P.; Il-Soep, K.; Anh-Tuan, T.; Dong-Cheol, J. Effect of abscisic acid on growth and physiology of arabica coffee seedlings under water deficit condition. Sains Malays 2020, 49, 1499–1508. [Google Scholar]
  12. Marwa, M.A.; El-Shafie, A.F.; Dewedar, O.M.; Molina-Martinez, J.M.; Ragab, R. Predicting the water requirement, soil moisture distribution, yield, water productivity of peas and impact of climate change using saltmed model. Plant Arch. 2020, 20, 3673–3689. [Google Scholar]
  13. Allen, R.G.; Luis, S.P.; Dirk, R.; Martin, S. Crop Evapotranspiration—Guidelines for Computing Crop Water Requirements; FAO Irrigation and Drainage Paper 56; FAO: Rome, Italy, 1998; Volume 300, p. D05109. [Google Scholar]
  14. Pereira, L.S.; Paredes, P.; López-Urrea, R.; Hunsaker, D.J.; Mota, M.; Shad, Z.M. Standard single and basal crop coefficients for vegetable crops, an update of FAO56 crop water requirements approach. Agric. Water Manag. 2021, 243, 106196. [Google Scholar] [CrossRef]
  15. Pereira, L.S.; Paredes, P.; Hunsaker, D.J.; López-Urrea, R.; Shad, Z.M. Standard single and basal crop coefficients for field crops. Updates and advances to the FAO56 crop water requirements method. Agric. Water Manag. 2021, 243, 106466. [Google Scholar] [CrossRef]
  16. Valiantzas, J.D. Simplified forms for the standardized FAO-56 Penman–Monteith reference evapotranspiration using limited weather data. J. Hydrol. 2013, 505, 13–23. [Google Scholar] [CrossRef]
  17. Smith, M. CROPWAT A Computer Program for Irrigation Plans and Management and ETo Calculation Using Penman-Montieth Method; FAO Irrigation and Drainage: Rome, Italy, 1992; Volume 46, pp. 112–140. [Google Scholar]
  18. Savva, A.P.; Frenken, K. Irrigation Manual, Planning, Development Monitoring and Evaluation of Irrigated Agriculture with Farmer Participation; Food and Agriculture Organization of the United Nations (FAO) Sub-Regional Office for East and Southern Africa (SAFR): Harare, Zimbabwe, 2002; Volume IV, Available online: https://www.fao.org/docrep/pdf/010/ai596e/ai596e.pdf (accessed on 10 January 2023).
  19. Yadava, U.L. Rapid non-destructive methods to determine chlorophyll in intact leaves. Hortic. Sci. 1986, 21, 1449–1450. [Google Scholar]
  20. Gusev, N.A. Some Methods of Studying the Water Regime of Plants; Publishing House of the USSR Academy of Sciences: Leningrad, Russia, 1960; Volume 61. (In Russian) [Google Scholar]
  21. Snedecor, G.W.; Cochran, W.G. Statistical Methods, 8th ed.; Iowa State University Press: Ames, IA, USA, 1989; p. 1191. [Google Scholar]
  22. Duncan, D.B. Multiple range and multiple “F” test. Biometrics 1955, 11, 1–42. [Google Scholar] [CrossRef]
  23. Youssef, E.A.; Marwa, M.A.; El-Shafie, A.F.; Hussein, M.M. Study the applications of water deficiency levels and ascorbic acid foliar on growth parameters and yield of summer squash plant (Cucurbita pepo L.). Agric. Eng. Int. CIGR J. 2017, 147–158. [Google Scholar]
  24. Hozayn, M.; Ali, H.M.; Marwa, M.A.; El-Shafie, A.F. Influence of magnetic water on french basil (Ocimum basilicum L. Var Grandvert) plant grown under water Stress conditions. Plant Arch. 2020, 20, 3636–3648. [Google Scholar]
  25. Rallo, G.; Paço, T.A.; Paredes, P.; Puig-Sirera, À.; Massai, R.; Provenzano, G.; Pereira, L.S. Updated single and dual crop coefficients for tree and vine fruit crops. Agric. Water Manag. 2021, 250, 106645. [Google Scholar] [CrossRef]
  26. Minhas, P.S.; Ramos, T.B.; Ben-Gal, A.; Pereira, L.S. Coping with salinity in irrigated agriculture: Crop evapotranspiration and water management issues. Agric. Water Manag. 2020, 227, 105832. [Google Scholar] [CrossRef]
  27. Pereira, L.S.; Paredes, P.; López-Urrea, D.J.; Jovanovic, N. Updates and advances to the FAO56 crop water requirements method. Agric. Water Manag. 2021, 24, 106697. [Google Scholar] [CrossRef]
  28. Herrera-Puebla, J.; Meneses-Peralta, J.; Duarte-Díaz, C.; González-Robaina, F.; Hervís-Granda, G. Determination of Crop Coefficients for Estimating Evapotranspiration in a Paddy Field in Cuba. Rev. Cienc. Técnicas Agropecu. 2020, 29, 5–20. [Google Scholar]
  29. Vijay, K.; Singh, V.B.; Priyanka, S.; Shalini, K. Effect of various mulches on soil moisture content, soil properties, growth and yield of Kinnow under rainfed condition. Int. J. Agric. Sci. 2014, 10, 225–229. [Google Scholar]
  30. Falivene, S.; Giddings, J.; Hardy, S.; Sanderson, G. Managing citrus orchards with less water. N. S. W. DPI Primefact 2006, 427, 1–12. [Google Scholar]
  31. Youssef, E.A. Increasing Drought Tolerance of Gladiolus Plants through Application of Some Growth Regulators. Master’s Thesis, Faculty Agriculture Zagazig University, Zagazig, Egypt, 2007; p. 130. [Google Scholar]
  32. Mahmoud, T.A.; Youssef, E.A. Water deficiency and mulching effects on Valencia orange trees. Ann. Agric. Sci. Moshtohor J. 2017, 55, 113–128. [Google Scholar]
  33. Agarwal, S.; Sairam, R.K.; Srivatava, G.C.; Tyagi, A.; Meena, R.C. Role of ABA, salicylic acid, calcium and hydrogen peroxide on antioxidant enzymes induction in wheat seedlings. Plant Sci. 2005, 169, 559–570. [Google Scholar] [CrossRef]
  34. Anbarasi, G.; Bhagavathi, G.; Vignesh, R.; Srinivasan, M.; Somasundaram, S.T. Effect of exogenous abscisic acid on growth and biochemical changes in the halophyte Suaeda maritima. J. Microbiol. Biotechnol. Food Sci. 2015, 4, 442–447. [Google Scholar]
  35. Mahmoud, T.A.; Youssef, E.A. Effect of partial root-zone drying drip irrigation system on Valencia orange trees. Ann. Agric. Sci. Moshtohor J. 2017, 55, 101–112. [Google Scholar]
  36. Mahmoud, T.A.; Youssef, E.A.; El-harouny, S.B.; Abo Eid, A.M. Effect of magnetized water and different levels of water supply on growth and yield of navel orange trees. J. Hortic. Sci. Ornam. Plants 2018, 10, 118–128. [Google Scholar]
  37. Youssef, E.A.; Hozayen, A.M.A. Study the effect of chitosan on some growth and yield parameters in wheat grown under water stress condition. Plant Arch. 2019, 19, 684–694. [Google Scholar]
  38. Koshita, Y.; Takahara, T. Effect of water stress on flower-bud formation and plant hormone content of satsuma mandarin (Citrus unshiu Marc). Sci. Hortic. 2004, 99, 301–307. [Google Scholar] [CrossRef]
  39. Ghosh, S.G.; Asanuma, K.; Kusutani, A.; Toyota, M. Effect of moisture stress at different growth stages on the amount of total nonstructural carbohydrate, nitrate reeducates activity and yield of potato. Jpn. J. Trop. Agric. 2000, 44, 158–166. [Google Scholar]
  40. Ahmed, M.E.M.; Abd El-Kader, N.I. The influence of magnetic water and water regimes on soil salinity, growth, yield and tubers quality of potato plants. Middle East J. Agric. Res. 2016, 5, 132–143. [Google Scholar]
  41. Youssef, E.A.; Ahmed, M.A.; Nadia, M.B.; Magda, A.F.S.; Karima, M.G. Alleviation of drought effect on sunflower (Helianthus annus L.) c.v. sakha-53 cultivar by foliar spraying with antioxidant. Middle East J. Agric. 2015, 4, 794–801. [Google Scholar]
  42. Mahmoud, T.A.; Youssef, E.A.; El-harouny, S.B.; Abo Eid, M.A.M. Study of the effect of salinity stress and magnetized water irrigation on growth of Washington navel orange seedlings budded on sour orange rootstock. Plant Arch. 2019, 19, 711–720. [Google Scholar]
  43. Youssef, E.A.; Hozayen, A.M.A. The effect of drought stress condition combined with Kaolin spraying application on growth and yield parameters of Maize (Zea mays). Plant Arch. 2019, 19, 674–683. [Google Scholar]
  44. Li, J.; Wang, X.Q.; Watson, M.B.; Assmann, S.M. Regulation of abscisic acid-induced stomatal closure and anion channels by guard cell AAPK kinase. Science 2000, 287, 300–303. [Google Scholar] [CrossRef] [Green Version]
  45. Mahmoud, T.A.; Youssef, E.A.; El-harouny, S.B.; Abo Eid, M.A.M. Effect of irrigation with magnetic water on nitrogen fertilization efficiency of navel orange trees. Plant Arch. 2019, 19, 966–975. [Google Scholar]
  46. Vu, N.T.; Kang, H.M.; Kim, Y.S.; Choi, K.Y.; Kim, I.S. Growth, physiology and abiotic stress response to abscisic acid in tomato seedlings. Hortic. Environ. Biotechnol. 2015, 56, 294–304. [Google Scholar] [CrossRef]
  47. Youssef, E.A.; Taha, S.S. Effect of moisture stress and magnetized water on growth parameters and yield characteristics of onion plants. Int. J. Pharm Technol. Res. 2016, 9, 104–111. [Google Scholar]
  48. Chen, Z.; Wang, Z.; Yang, Y.; Li, M.; Xu, B. Abscisic acid and brassinolide combined application synergistically enhances drought tolerance and photosynthesis of tall fescue under water stress. Sci. Hortic. 2018, 228, 1–9. [Google Scholar] [CrossRef]
  49. McLAREN, J.S.; Smith, H. The effect of abscisic acid on growth, photosynthetic rate and carbohydrate metabolism in Lemna minor L. New Phytol. 1976, 76, 11–20. [Google Scholar] [CrossRef]
  50. Dewedar, O.M.; Plauborg, F.; Marwa, M.A.; El-Shafie, A.F.; Ragab, R. Improving water saving, yield, and water productivity of bean under deficit drip irrigation: Field and modelling study using the SALTMED model. Irrig. Drain. 2021, 70, 224–242. [Google Scholar] [CrossRef]
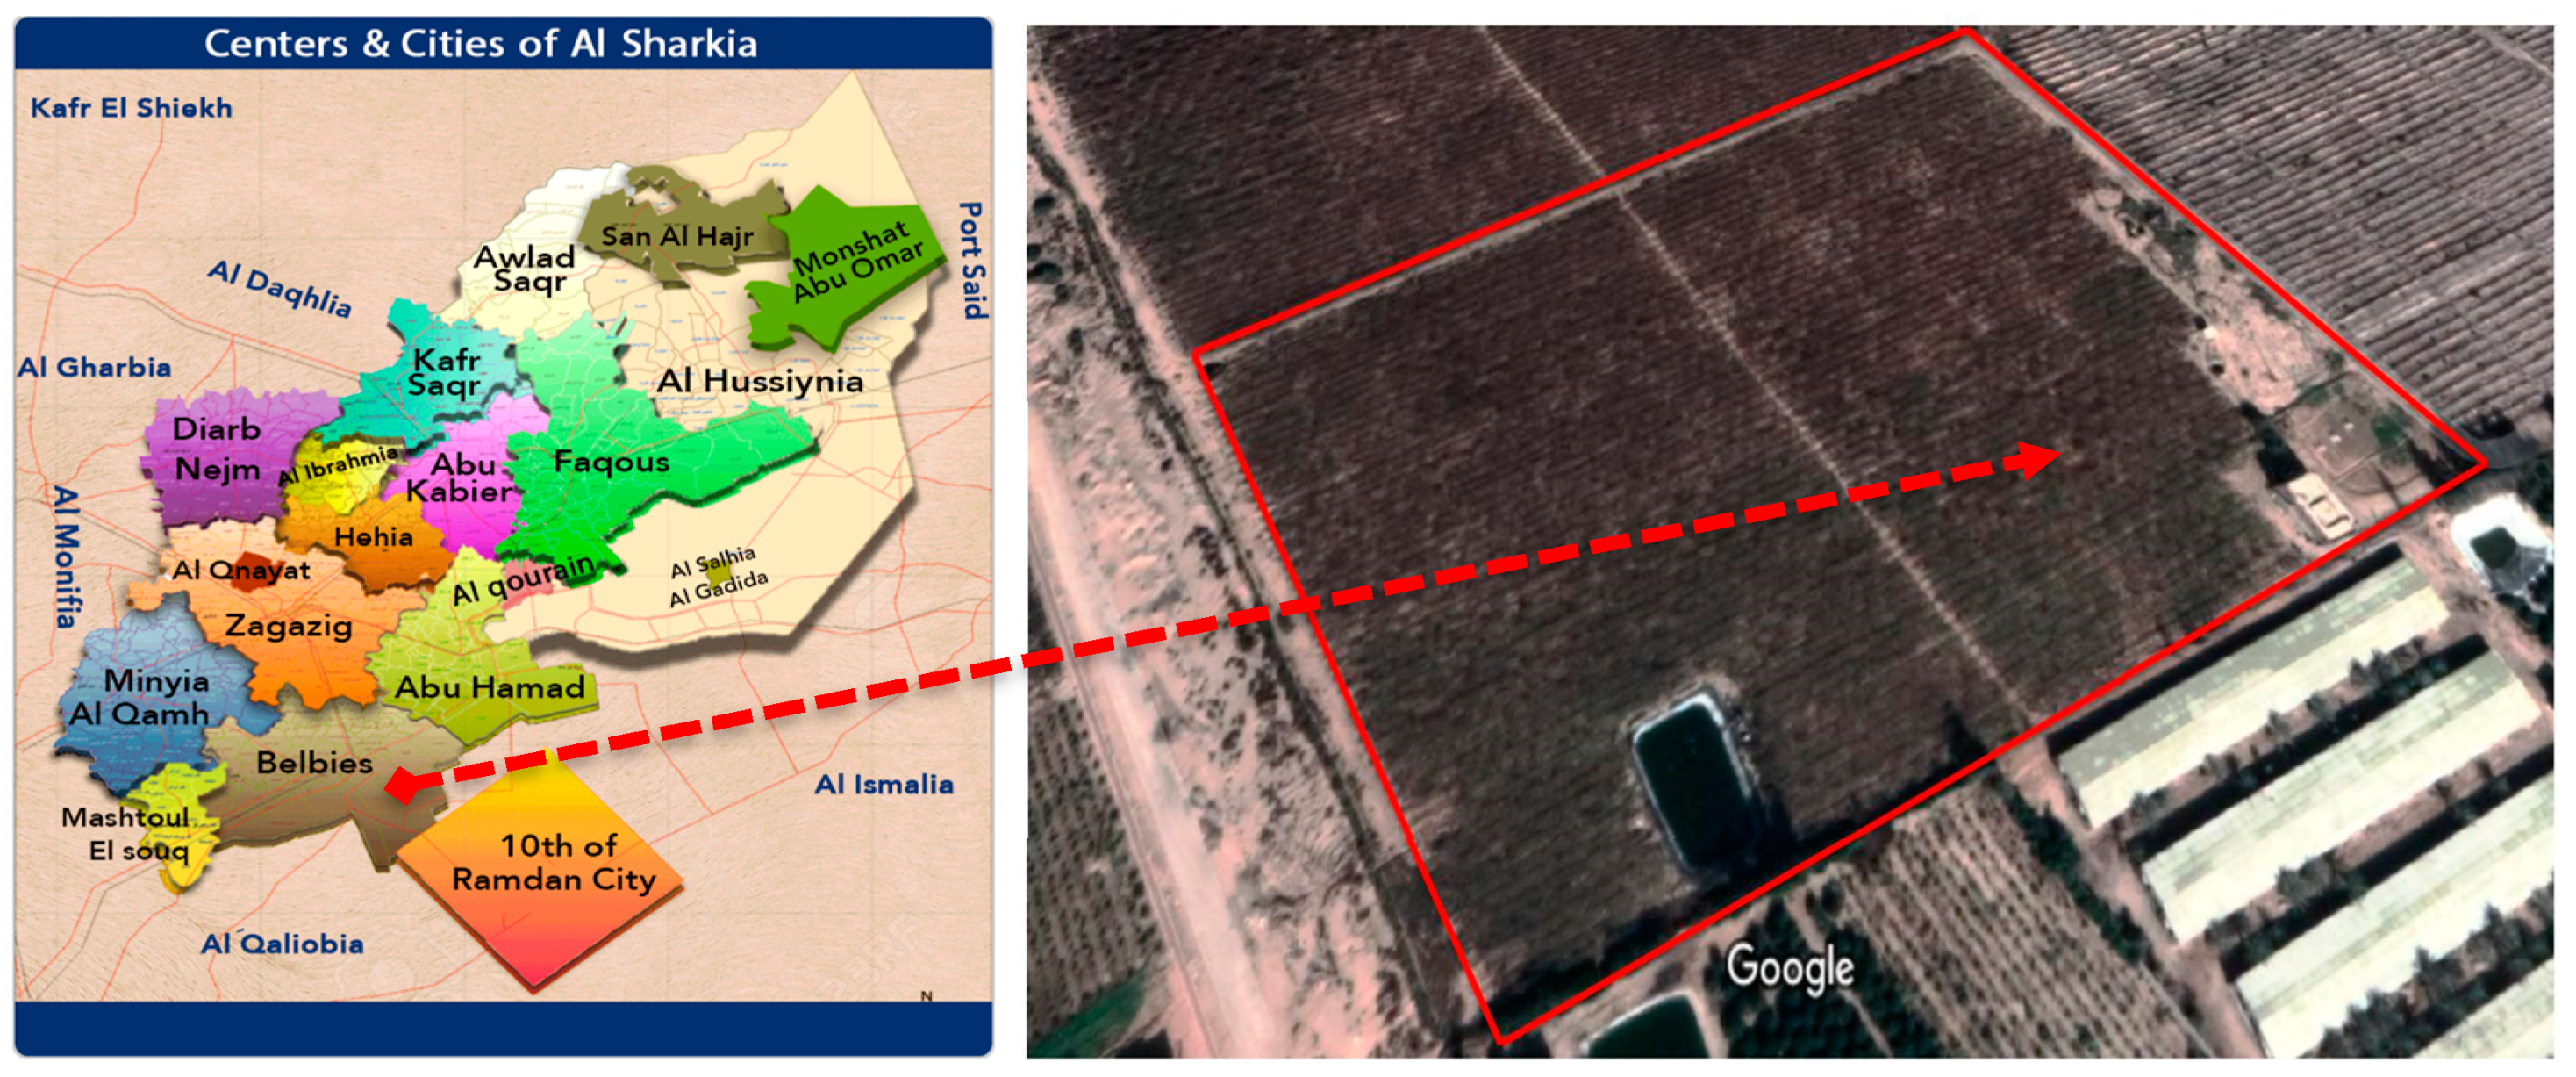
Figure 1. The experimental site, Bilbeis city, Sharqia Governorate, Egypt; Source: Sharqia Governorate Site and Google Maps.
Agriculture 13 00610 g001
Figure 2. Daily air temperature (T min and max) and reference evapotranspiration (ETo) at the experimental site during the two growing seasons (2021 and 2022).
Agriculture 13 00610 g002
Figure 3. The depletion (%), deficit (mm), and irrigation (mm) under 100, 80, and 60% of field capacity (FC) for the 2021 and 2022 growing seasons.
Agriculture 13 00610 g003
Figure 4. (ac). Crop coefficient (Kc) estimation for red cabbage crop at 100, 80, and 60% of (FC) for the 2021 and 2022 growing seasons.
Agriculture 13 00610 g004
Figure 5. (a,b). Relations between the Kc under non-standard and standard conditions, water stress coefficient (Ks) for red cabbage crops at 100, 80, and 60% of (FC) for the 2021 and 2022 growing seasons.
Agriculture 13 00610 g005
Figure 6. (a,b) Effect of water stress and abscisic acid on the yield of red cabbage for the 2021 and 2022 growing seasons.
Agriculture 13 00610 g006
Table 1. Some physical properties of the soil for Bilbeis experimental site.
Depth
(cm)
Particle Size Distribution
(%)
Moisture Content
(%)
Coarse SandFine SandSiltClaySaturation Point (S.P.)FCAWPWP
0–3043.219.52413.328.614.37.157.15
30–6044.118.524.213.228.614.57.47.1
FC: Field Capacity, PWP: Permanent Wilting Point, AW: Available Water.
Table 2. Effect of water stress and abscisic acid on plant height, head diameter, and head volume of red cabbage plants (2021–2022 seasons).
TreatmentsPlant Height (cm)Head Diameter (cm)Head Volume (cm3)
First
Season
Second
Season
First
Season
Second
Season
First
Season
Second
Season
Field Capacity
100% of FC50.97A47.20A31.18A34.18A354.92A385.45A
80% of FC44.20B41.18B27.93B31.02B315.77B335.71B
60% of FC36.07C33.62C24.89C27.15C283.97C297.81C
LSD at 5%0.224 0.439 0.194 0.910 2.312 2.846
Abscisic Acid
ABA 00 ppm46.32A43.19A26.83D29.44D300.70D326.94D
ABA 25 ppm44.47B41.30B27.61C30.29C313.35C333.44C
ABA 50 ppm42.90C39.74C28.34B31.25B325.85B343.71B
ABA 75 ppm41.29D38.44D29.23A32.14A332.96A354.52A
LSD at 5%0.372 0.373 0.217 0.177 3.281 1.996
Interaction
100% of FC × ABA 00 ppm52.73a48.96a30.21d32.98d329.51d372.79d
100% of FC × ABA 25 ppm51.60b47.40b30.87c33.72c349.33c378.02c
100% of FC × ABA 50 ppm50.53c46.51c31.51b34.55b367.50b391.54b
100% of FC × ABA 75 ppm49.01d45.95d32.16a35.45a373.32a399.43a
80% of FC × ABA 00 ppm46.26e44.38e26.35h30.00h304.17h320.63h
80% of FC × ABA 25 ppm45.34f42.23f27.50g30.66g310.27g328.52g
80% of FC × ABA 50 ppm43.61g40.04g28.37f31.22f321.31f339.02f
80% of FC × ABA 75 ppm41.58h38.05h29.49e32.20e327.32e354.67e
60% of FC × ABA 00 ppm39.97i36.22i23.93l25.33l268.42l287.40l
60% of FC × ABA 25 ppm36.47j34.26j24.45k26.50k280.44k293.79k
60% of FC × ABA 50 ppm34.56k32.67k25.16j27.98j288.75j300.57j
60% of FC × ABA 75 ppm33.29l31.32l26.03i28.78i298.25i309.46i
LSD at 5%0.593 0.641 0.358 0.279 5.283 3.580
FC = field capacity, ABA = abscisic acid. Mean followed by the same letter\s within each column are not significantly different from each other at 0.5% level.
Table 3. Effect of water stress and abscisic acid on plant fresh weight, head fresh weight, and root fresh weight of red cabbage plants (2021–2022 seasons).
TreatmentsPlant Fresh Weight (g)Head Fresh Weight (g)Root Fresh Weight (g)
First
Season
Second
Season
First
Season
Second
Season
First
Season
Second
Season
Field Capacity
100% of FC572.69A622.13A507.97A542.12A29.71A34.05A
80% of FC443.32B467.09B390.15B403.71B25.81B26.54B
60% of FC283.18C352.82C244.79C306.08C18.66C21.03C
LSD at 5%12.081 12.566 11.644 12.207 0.680 0.587
Abscisic Acid
ABA 00 ppm391.14D437.23D333.83D367.37D26.87A30.10A
ABA 25 ppm416.54C462.95C361.69C396.92C25.94B28.55B
ABA 50 ppm448.49B494.23B398.54B432.46B24.07C26.25C
ABA 75 ppm476.08A528.31A429.83A472.45A22.04D23.93D
LSD at 5%9.951 6.521 10.136 6.358 0.515 0.525
Interaction
100% of FC × ABA 00 ppm535.06d558.58d465.44d471.40d30.96a37.99a
100% of FC × ABA 25 ppm545.91c595.01c479.53c512.31c30.11b35.50b
100% of FC × ABA 50 ppm582.83b640.41b520.86b562.69b29.04c32.67c
100% of FC × ABA 75 ppm626.98a694.50a566.04a622.06a28.73d30.04d
80% of FC × ABA 00 ppm385.98h441.34h326.42h371.25h28.39e28.78e
80% of FC × ABA 25 ppm419.94g457.37g363.13g391.61g27.54f27.71f
80% of FC. × ABA 50 ppm467.85f467.62f416.98f406.27f25.08g25.55g
80% of FC × ABA 75 ppm499.50e502.06e454.07e445.72e22.24h24.13h
60% of FC × ABA 00 ppm252.37l311.78l209.61l259.46l21.27i23.55i
60% of FC × ABA 25 ppm283.78k336.48k242.41k286.85k20.16j22.45j
60% of FC × ABA 50 ppm294.79j374.65j257.78j328.42j18.09k20.52k
60% of FC × ABA 75 ppm301.77i388.36i269.36i349.57i15.13l17.61l
LSD at 5%17.205 12.912 17.341 12.536 0.907 0.894
FC = field capacity, ABA = abscisic acid. Mean followed by the same letter\s within each column are not significantly different from each other at 0.5% level.
Table 4. Effect of water stress and abscisic acid on numbers of green leaves, numbers of red leaves, and total numbers of leaves per plant of red cabbage (2021–2022 seasons).
TreatmentsNo. of Green Leaves Per PlantNo. of Red Leaves Per PlantNo. of Total Leaves Per Plant
First
Season
Second
Season
First
Season
Second
Season
First
Season
Second
Season
Field Capacity
100% of FC6.69A10.45A17.32A20.46A24.01A30.91A
80% of FC6.19B9.33B15.99B17.36B22.18B26.70B
60% of FC5.53C8.42C13.67C15.17C19.21C23.59C
LSD at 5%0.026 0.045 0.149 0.194 0.162 0.156
Abscisic Acid
ABA 00 ppm6.37A9.75A16.45A18.59A22.82A28.34A
ABA 25 ppm6.23B9.50B15.81B18.00B22.04B27.50B
ABA 50 ppm6.07C9.25C15.42C17.42C21.49C26.67C
ABA 75 ppm5.88D9.11D14.96D16.65D20.84D25.76D
LSD at 5%0.515 0.062 0.119 0.170 0.157 0.166
Interaction
100% of FC × ABA 00 ppm6.94a10.81A17.80a21.82a24.75a32.62a
100% of FC × ABA 25 ppm6.78b10.48B17.41b20.93b24.20b31.41b
100% of FC × ABA 50 ppm6.59c10.33C17.16c20.07c23.75c30.40c
100% of FC × ABA 75 ppm6.44d10.19D16.91d19.04d23.34d29.23d
80% of FC × ABA 00 ppm6.34e9.66E16.60e18.25e22.94e27.90e
80% of FC × ABA 25 ppm6.22f9.51F16.15f17.60f22.38f27.10f
80% of FC × ABA 50 ppm6.15g9.14G15.76g17.11g21.91g26.25g
80% of FC × ABA 75 ppm6.05h9.03H15.43h16.49h21.49h25.52h
60% of FC × ABA 00 ppm5.83i8.78I14.93i15.72i20.76i24.50i
60% of FC × ABA 25 ppm5.69j8.51J13.87j15.47j19.55j23.98j
60% of FC × ABA 50 ppm5.47k8.28K13.35k15.08k18.82k23.37k
60% of FC × ABA 75 ppm5.16l8.10L12.54l14.42l17.70l22.52l
LSD at 5%0.081 0.099 0.208 0.291 0.264 0.276
FC = field capacity, ABA = abscisic acid. Mean followed by the same letter\s within each column are not significantly different from each other at 0.5% level.
Table 5. Effect of water stress and abscisic acid on total chlorophyll, leaf cell sap TSS, and leaf cell sap osmotic pressure of red cabbage plants (2021–2022 seasons).
TreatmentsTotal Chlorophyll SPADLeaf Cell Sap TSSLeaf Cell Sap Osmotic Pressure (atm)
First
Season
Second
Season
First
Season
Second
Season
First
Season
Second
Season
Field Capacity
100% of FC89.29A85.67A4.63C4.77C3.58C3.69C
80% of FC75.81B80.68B5.54B5.63B4.28B4.35B
60% of FC66.59C71.75C6.50A6.39A5.04A4.95A
LSD at 5%3.096 0.789 0.189 0.094 0.151 0.067
Abscisic Acid
ABA 00 ppm82.63A82.73A5.00D5.20D3.86D4.02D
ABA 25 ppm78.24B80.50B5.28C5.50C4.08C4.25C
ABA 50 ppm75.69C78.30C5.94B5.74B4.59B4.44B
ABA 75 ppm72.36D75.94D6.00A5.94A4.64A4.59A
LSD at 5%3.200 0.581 0.185 0.048 0.147 0.068
Interaction
100% of FC × ABA 00 ppm98.15a88.35A4.00g4.00k3.12g3.12k
100% of FC × ABA 25 ppm89.37b86.13B4.50f4.60j3.49f3.56j
100% of FC × ABA 50 ppm87.33c84.63C5.00e5.13i3.86e3.97i
100% of FC × ABA 75 ppm82.30d83.57D5.00e5.33h3.86e4.12h
80% of FC × ABA 00 ppm80.00e82.87E5.00e5.50g3.86e4.25g
80% of FC × ABA 25 ppm77.60f81.47F5.33d5.50g4.12d4.25g
80% of FC × ABA 50 ppm74.67g80.37G5.83c5.60f4.51c4.32f
80% of FC × ABA 75 ppm70.97h78.03H6.00b5.93e4.64b4.59e
60% of FC × ABA 00 ppm69.73i76.97I6.00b6.10d4.64b4.72d
60% of FC × ABA 25 ppm67.77j73.90J6.00b6.40c4.64b4.96c
60% of FC × ABA 50 ppm65.07k69.90K7.00a6.50b5.45a5.04b
60% of FC × ABA 75 ppm63.80l66.23L7.00a6.57a5.45a5.09a
LSD at 5%5.327 1.029 0.309 0.143 0.247 0.116
FC = field capacity, ABA = abscisic acid. Mean followed by the same letter\s within each column are not significantly different from each other at 0.5% level.
Disclaimer/Publisher’s Note: The statements, opinions and data contained in all publications are solely those of the individual author(s) and contributor(s) and not of MDPI and/or the editor(s). MDPI and/or the editor(s) disclaim responsibility for any injury to people or property resulting from any ideas, methods, instructions or products referred to in the content.