Article

Dissecting Physiological and Agronomic Diversity in Safflower Populations Using Proximal Phenotyping

1
Agriculture Victoria, Grains Innovation Park, 110 Natimuk Rd., Horsham, VIC 3400, Australia
2
School of Applied Systems Biology, La Trobe University, Bundoora, VIC 3083, Australia
3
Centre for Agricultural Innovation, University of Melbourne, Parkville, VIC 3010, Australia
4
GO Resources Pty Ltd., 15 Sutherland Street, Brunswick, VIC 3056, Australia
5
Agriculture Victoria, AgriBio, Centre for AgriBioscience, 5 Ring Road, Bundoora, VIC 3083, Australia
*
Author to whom correspondence should be addressed.
Agriculture 2023, 13(3), 620; https://doi.org/10.3390/agriculture13030620
Submission received: 14 February 2023 / Revised: 25 February 2023 / Accepted: 1 March 2023 / Published: 4 March 2023

Abstract

:
Safflower (Carthamus tinctorius L.) is a highly adaptable but underutilized oilseed crop capable of growing in marginal environments, with crucial agronomical, commercial, and industrial uses. Considerable research is still needed to develop commercially relevant varieties, requiring effective, high-throughput digital phenotyping to identify key selection traits. In this study, field trials comprising a globally diverse collection of 350 safflower genotypes were conducted during 2017–2019. Crop traits assessed included phenology, grain yield, and oil quality, as well as unmanned aerial vehicle (UAV) multispectral data for estimating vegetation indices. Phenotypic traits and crop performance were highly dependent on environmental conditions, especially rainfall. High-performing genotypes had intermediate growth and phenology, with spineless genotypes performing similarly to spiked genotypes. Phenology parameters were significantly correlated to height, with significantly weak interaction with yield traits. The genotypes produced total oil content values ranging from 20.6–41.07%, oleic acid values ranging 7.57–74.5%, and linoleic acid values ranging from 17.0–83.1%. Multispectral data were used to model crop height, NDVI and EVI changes, and crop yield. NDVI data identified the start of flowering and dissected genotypes according to flowering class, growth pattern, and yield estimation. Overall, UAV-multispectral derived data are applicable to phenotyping key agronomical traits in large collections suitable for safflower breeding programs.

1. Introduction

Safflower (Carthamus tinctorius L.) is a highly versatile but underutilized and poorly studied oilseed crop [1]. A member of the Asteraceae family, safflower has traditionally been cultivated in marginal regions due to its stress-tolerant nature [2,3,4]. Safflower is a multipurpose crop, able to be used as a food, a source of carthamin dye, in traditional medicine, in stock feed, and as a plant-based oil source [1,2,3]. Safflower not only has traditional and industrial uses but has crucial agronomic benefits. Forming deep root systems, safflower is able to access and raise reserves of water and nutrients deep in the soil that other crops can hardly reach, as well as penetrate compacted and sodic soils, improving soil structure [5]. In Australia, safflower has historically been grown opportunistically or as a primer crop to more economically profitable crops, helping to resolve soil texture issues, dewater land and break pest cycles [5,6,7]. Therefore, the development of modern, economically relevant safflower varieties would allow for further uptake of this underutilized crop [7,8].
Recently, with a resurgence in the demand for renewable plant-based oils, interest has turned to safflower due to its high-quality oil yields (32–40% per gram meal) and genotypic variation in fatty acid composition, particularly polyunsaturated linoleic, monounsaturated oleic, and saturated stearic acids [9,10,11,12]. Oils with varying concentrations of these acids are used in a range of applications such as cosmetics [13,14], pharmaceuticals [3,15], food/cooking [16], and textiles [13], as well as the production of biofuels [17,18] and lubricants [19]. Due to increases in demand, recent breeding efforts have focused on the expanding industrial markets via targeted maximizing of oil yield and quality through the selection of superior genotypes with high oleic or linoleic acid contents [9,20,21].
While the research on safflower is limited compared to more widely cultivated crops, climate change has prompted further research into understanding diverse crop species, including safflower. Previous field research efforts have mainly focused on the identification of yield parameters and genotypes to overcome abiotic stress environments, such as salinity [22,23,24] and drought [9,25,26,27], or the effects of soil nutrition on the growth and yield [28,29,30,31]. Other key research topics have included oil content, quality, and yield, due to the increased demand for plant-based oils [11,20,32,33]. Although research has been conducted to further understand the diversity of agronomically relevant traits, and their interrelationships, available for breeding efforts in safflower [34,35,36,37], limited research has been conducted on large globally diverse reference populations [38,39,40,41]. Large-scale research has instead focused mainly on characterizing genetic diversity, trait heritability and the assessment of genetic relationships among different genotypes [21,38,42,43,44,45], but further research is needed to fully support these studies, which will rely on improved phenotypic data.
Rigorous phenotyping is critical to understanding plant behavior under varying environments and identifying novel traits for crop breeding. High-throughput phenotyping, using advanced sensors and analysis algorithms, has driven significant advances in crop breeding, especially when coupled with genomic breeding advances [46]. Various cameras, sensors, and deployment mechanisms have been developed to measure and utilise spectral reflectance at specific spectral regions, including RGB, multispectral, hyperspectral, and thermal imaging [47,48]. In recent years, advances in high-throughput digital imaging platforms suitable for field environments have seen the rise of non-destructive data capture methods for plant traits, reducing the need for manual phenotyping efforts and increasing the range of data captured. Previous phenotyping efforts in safflower have relied on traditional phenotyping methods for phenological and agronomical traits [21,34,35,36,39]. Meanwhile, only limited research has been conducted in safflower using high-throughput digital phenotyping methods [49,50], half of which have been glasshouse-based studies [51,52].
Here, we describe the screening of a genotypically diverse collection of 350 safflower genotypes [44] for morphological, phenotypical, and agronomically relevant traits, including oil quality analysis, over three crop seasons. We highlight the use of UAV-based imagery and analysis pipelines to elucidate new datasets for the selection of key crop breeding traits. Our results show a significant range of phenological diversity present within the collection screened and highlight desirable traits for future safflower improvement programs.

2. Materials and Methods

2.1. Plant Material and Field Experiments

A total of 350 safflower genotypes from the Agriculture Victoria Safflower collection were grown across three years of field trials (Supplementary tables). These genotypes represent the maximum genetic diversity of the reference population. These genotypes have previously been phenotyped in glasshouse-based abiotic stress experiments [51,52] to identify field trait genomic heritability [44,45].
Field trials were conducted for three consecutive years 2017 (36°44′11.75″ S; 142°7′8.64″ E), 2018 (36°44′11.75″ S; 142°7′5.04″ E) and 2019 (36°44′11.15″ S; 142°6′57.86″ E) at the Plant Breeding Centre, Horsham, Victoria, Australia, under natural rainfed conditions. Horsham is located in a temperate Mediterranean climate receiving an average of 370 mm rainfall annually, on gray cracking clay vertisol soils. During 2017, average pre-sowing rainfall was recorded and during the growing season, with a warmer than average in November (Figure 1, Table 1). During 2018 there was less than average pre-sowing rainfall, but significant rain around flowering in December, with slightly warmer temperatures. 2019 again had lower than average pre-sowing rainfall, but significant rain around sowing, with slightly cooler temperatures.
The three trials were planted in late June in a complete randomized block design. For each plot, the seed sowing rate was 45 plants/m2 in five rows 15 cm apart, sown at 4 cm depth, in plots totaling 5 m × 1 m. Standard agronomic practices for herbicide, fungicide, and insecticide applications were followed during the season, with 75 kg/ha urea pre-drilled before sowing and mono-ammonium phosphate (MAP) applied during sowing.

2.2. Agronomic Data Acquisition

Phenological and agronomical data were recorded throughout the growing seasons. Days to flowering start (DTFS) was observed as the days after sowing when 50% of the plants in the plot opened their first flower. Flowering period (FP) was the number of days from DTFS to days to flowering end (DTFE); 90% of the plants in the plot finished flowering. Days to maturity (DTM) was observed as the date 90% of plants in the plot reaching physiological maturity. Plant height was recorded after flowering, as the average height of plants from ground level to maximum upright canopy level, standing plants up if lodging occurred. After machine harvest in early February of the subsequent year, total plot grain yield was measured in grams. Weather data were collected using an MEA Junior weather station (MEA Pty Ltd., Adelaide, Australia).

2.3. Aerial Data Acquisition

This study employed a specialized multispectral data gathering system designed for plant phenotyping research at the SmartSense iHub of Agriculture Victoria, as previously described in Banerjee, et al. [53]. The system is composed of a RedEdge-M multispectral camera (MicaSense, Seattle, WA, USA) connected to a DJI Matrice 100 quadcopter drone. The multispectral sensor records the location data, such as latitude, longitude, and altitude, and saves it in the camera’s tags using a built-in GPS module. Additionally, the multispectral camera also records changes in the levels of incident irradiance through a downwelling light sensor. We used a radiometric calibration panel with known radiometric coefficients for each multispectral band. Radiometric calibration measurements were taken with the multispectral sensor prior to each flight for image correction.
Careful planning of the drone’s flight path is crucial for obtaining accurate data using UAVs in high-throughput crop phenotyping. The flight trajectory was planned to use the software Ground Station Pro (DJI, Shenzhen, China) and the multispectral sensor configured to take images with an overlap of 80% and a height of 30 m to achieve a ground sampling distance (GSD) of 2 cm. The UAV-multispectral data were collected on different days after sowing (DAS) to track the spectral characteristics of the safflower genotypes throughout their growth cycle.

2.4. Aerial Data Processing

The UAV multispectral images collected were processed using Pix4D Mapper software (www.Pix4D.com, URL accessed on 10 February 2023). The software employs a method known as structure from motion (SfM) which is well-suited for handling UAV data to generate reflectance orthomosaic, digital surface model (DSM), and digital terrain model (DTM) layers. The composite layers were then exported as individual files with a resolution of 2 cm GSD. The MicaSense RedEdge multispectral camera captures reflectance in blue (475 nm), green (560 nm), red (668 nm), red edge (717 nm), and near-infrared (840 nm) bands. These surface reflectance values were used to calculate vegetation indices (VIs), the normalized difference vegetation index (NDVI), and the enhanced vegetation index (EVI). These VIs help to separate the spectral properties of the vegetation from factors that can interfere with the measurements, such as the reflectance of the soil background, particularly during the early stages of the growth cycle. The Gaussian process regression (GPR) model was applied to for grain yield estimation from UAV-multispectral data.

2.5. Grain Quality Analysis

Total seed protein and total oil content were determined using near-infrared reflectance (NIR) spectroscopy (Foss XDS Rapid Content Analyser, FOSS Pacific Pty Ltd., Hilleroed, Denmark) [54]. Protein content was calibrated using the Dumas nitrogen combustion method (TruMac, Leco Corporation, St Joseph, MI, USA), while calibration for oil content was facilitated by the Soxhlet extraction method (Soxtec 2050, FOSS Pacific Pty Ltd., Denmark). The fatty acid profile (determination of oleic, linoleic, palmitic, and steric acids) was obtained using NIR spectroscopy (Foss XDS Rapid Content Analyser) [54]. The fatty acid composition was calibrated using reference data obtained from gas chromatography (Agilent GC 7890B, Agilent Technologies, Santa Clara, CA, USA). Briefly, safflower samples were ground using IKA M 20 Universal mill. The oil in ground samples (0.1 g) was extracted with petroleum ether (1.5 mL) at 40 °C for 30 min. The mixture was centrifuged at 1000 g for 5 min and the petroleum benzene solution was decanted and dried at 40 °C under nitrogen stream. The extracted oil was dissolved in toluene (1 mL) and transesterification was performed with 10% sodium methoxide (0.5 mL) for 30 min and subsequently neutralized with 20% citric acid (1.5 mL). The mixture was centrifuged at 2500 g for 5 min. The top organic layer was pipetted into 2 mL vials for gas chromatography. Example chromatographs for high linoleic, intermediate oleic, and high oleic genotypes are shown in Figure 2, which shows labelled peaks for palmitic (16:0), stearic (18:0), oleic (18:1), and linoleic (18:2) acids. Genotypes were classified into three oil classifications based on fatty acid profile: high linoleic (>65% of profile linoleic acid), high oleic (>55% of profile oleic acid), and intermediate oleic (those which fall between the other two classes). Classifications were modified from Dajue and Mündel [1], with ranges extended slightly to account for temperature variability during seed maturation [10] and differing times from maturity to harvest [11] experienced by differing genotypes and across growing seasons.

2.6. Statistical Analysis

Correlation analysis was performed based on Pearson’s correlation coefficient and T-tests to assess the relationship between phenological and agronomical traits and the slope and y-intercept for plotting NDVI decays for each genotype, across all three years.

3. Results

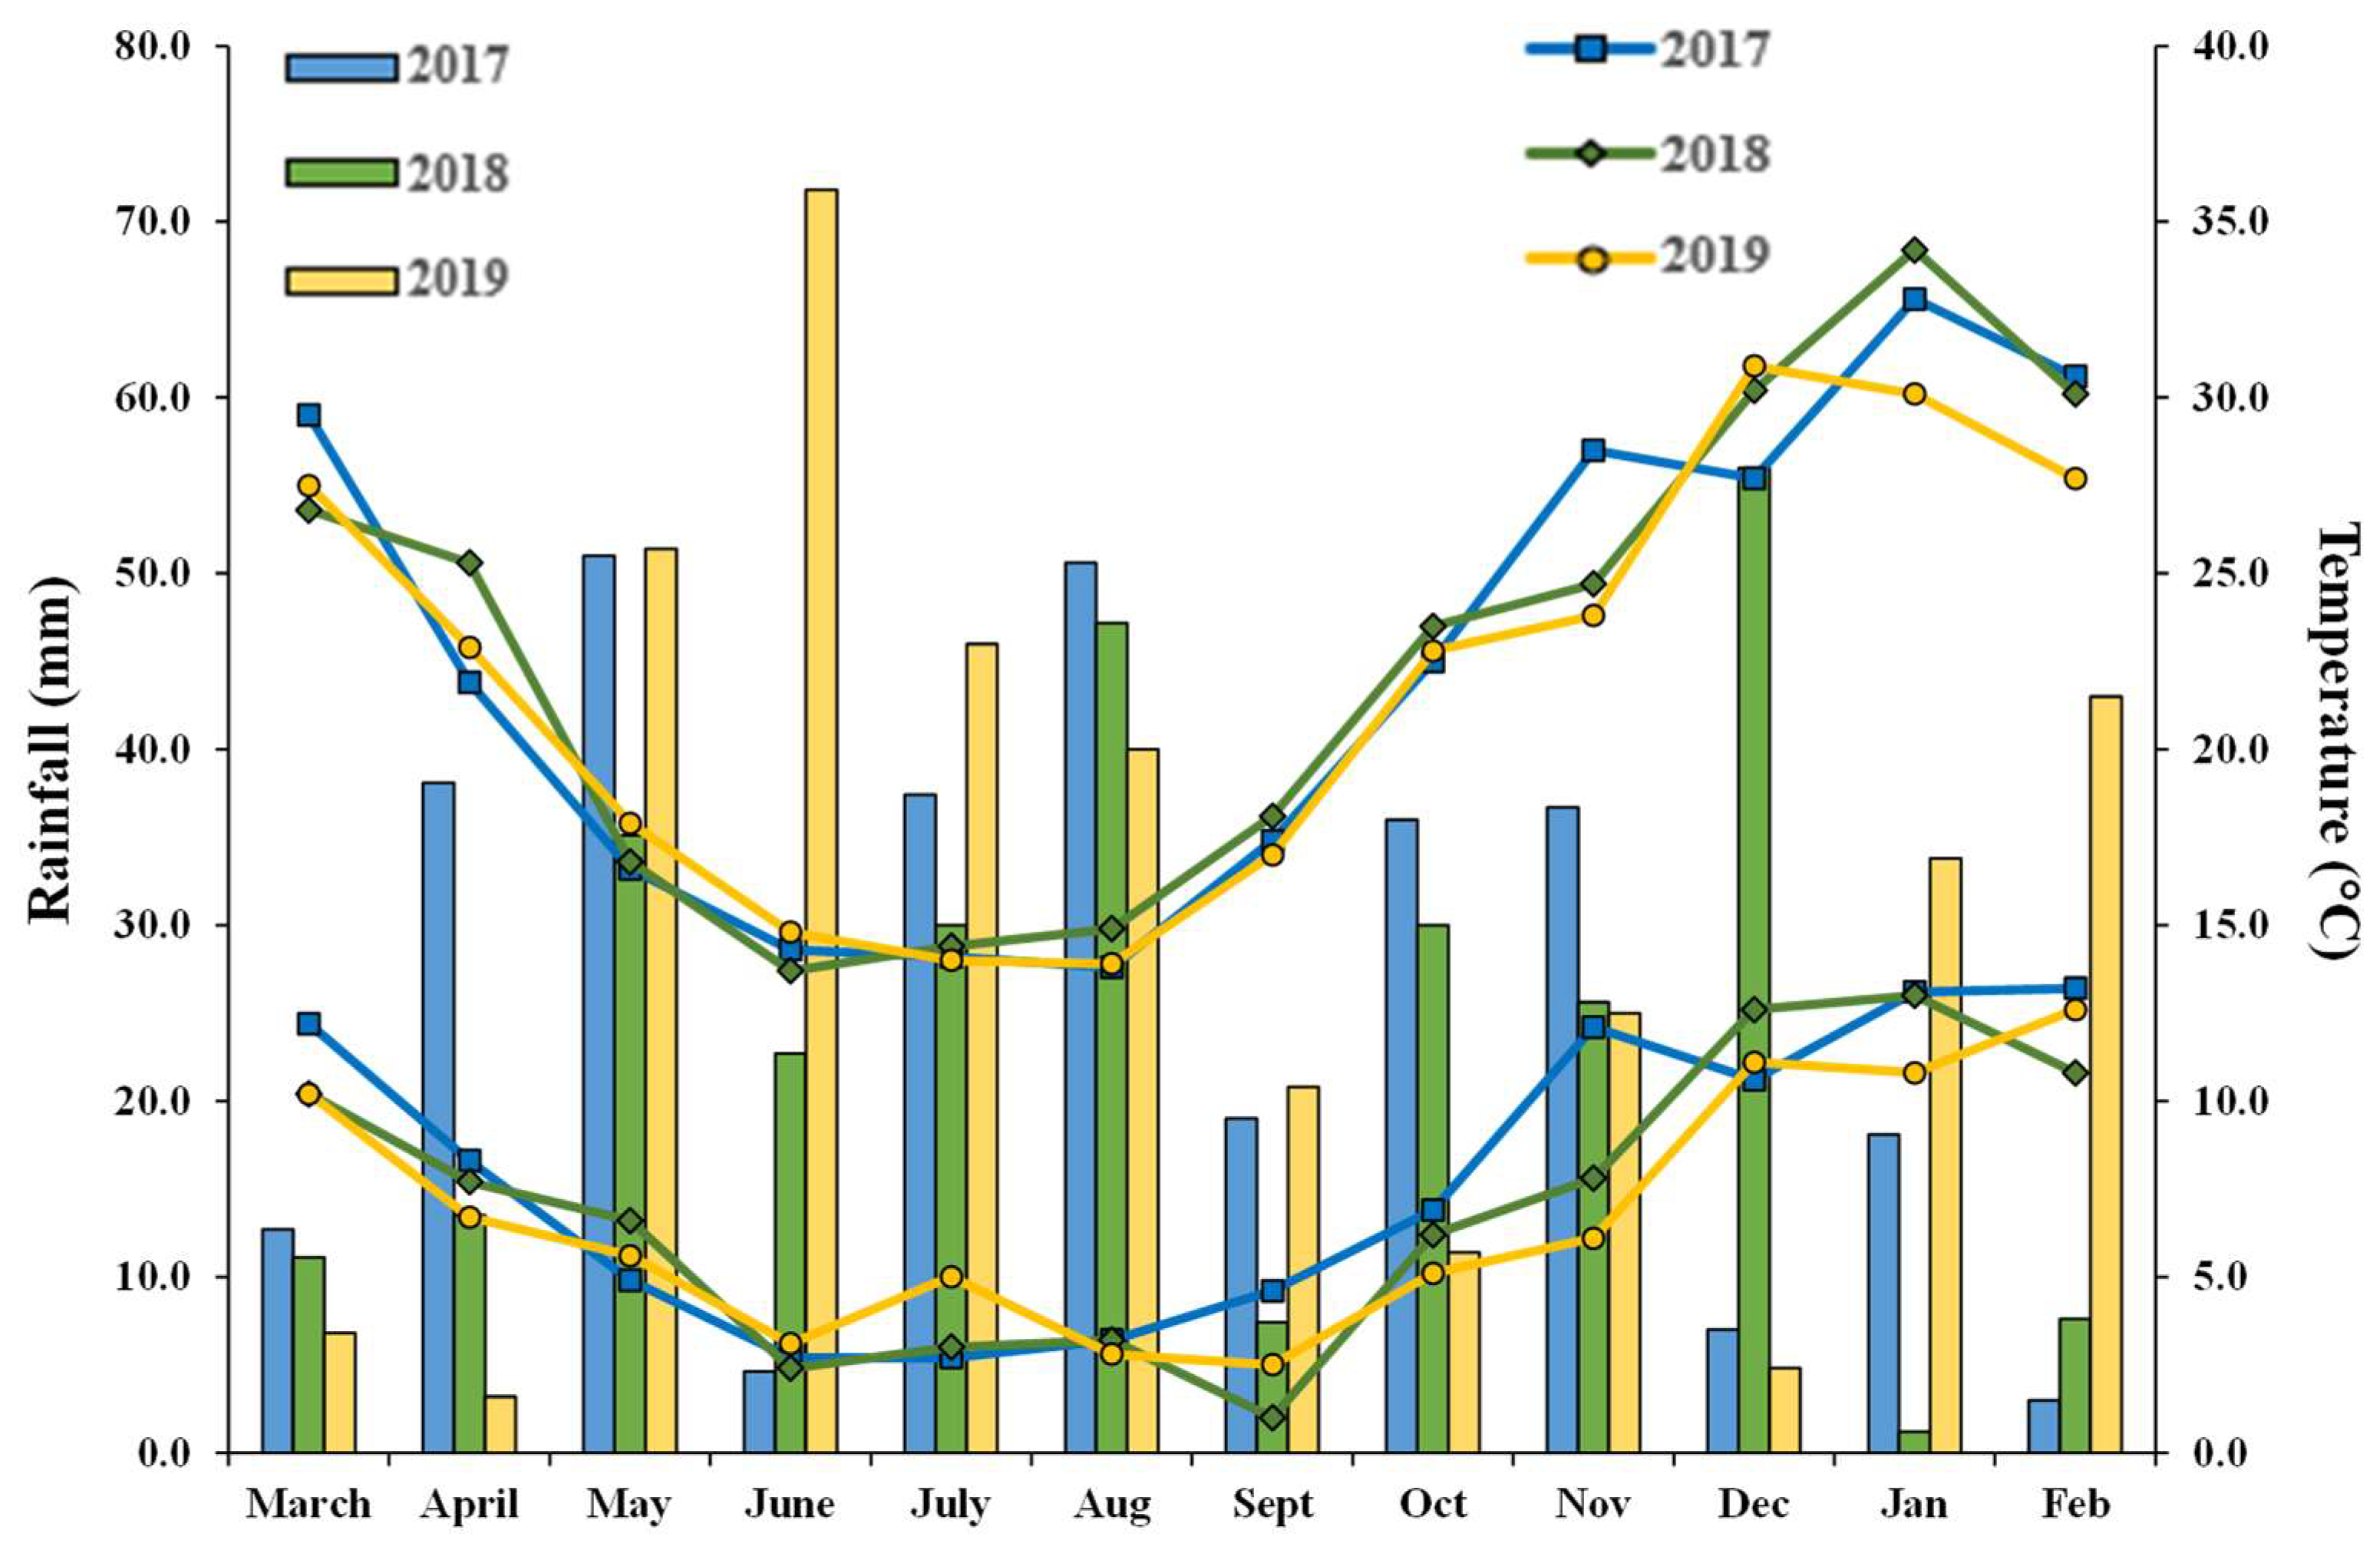
3.1. Weather Variations

Different weather conditions prevailed during the three growing seasons, resulting in varying plant responses between 2017, 2018, and 2019 (Figure 1). Pre-sowing rainfall was highest in 2017, with long periods of rainfall just prior to sowing (Table 1), with rainfall throughout most of the flowering and grain filling stages. Meanwhile, 2018 had low pre-sowing rainfall, low spring rainfall during stem elongation, above average rain during flowering, and little rainfall during grain filling and maturity stages. In the growing year 2019, similar low pre-sowing rainfall was observed with high rainfall during the germination and maturity stages. Overall, the annual rainfall during the growing season was similar between years. Minimum, daily average, and maximum temperatures were also similar between the years (Table 1), although 2017 had more cold mornings and 2019 was slightly cooler during the latter months (Figure 1).

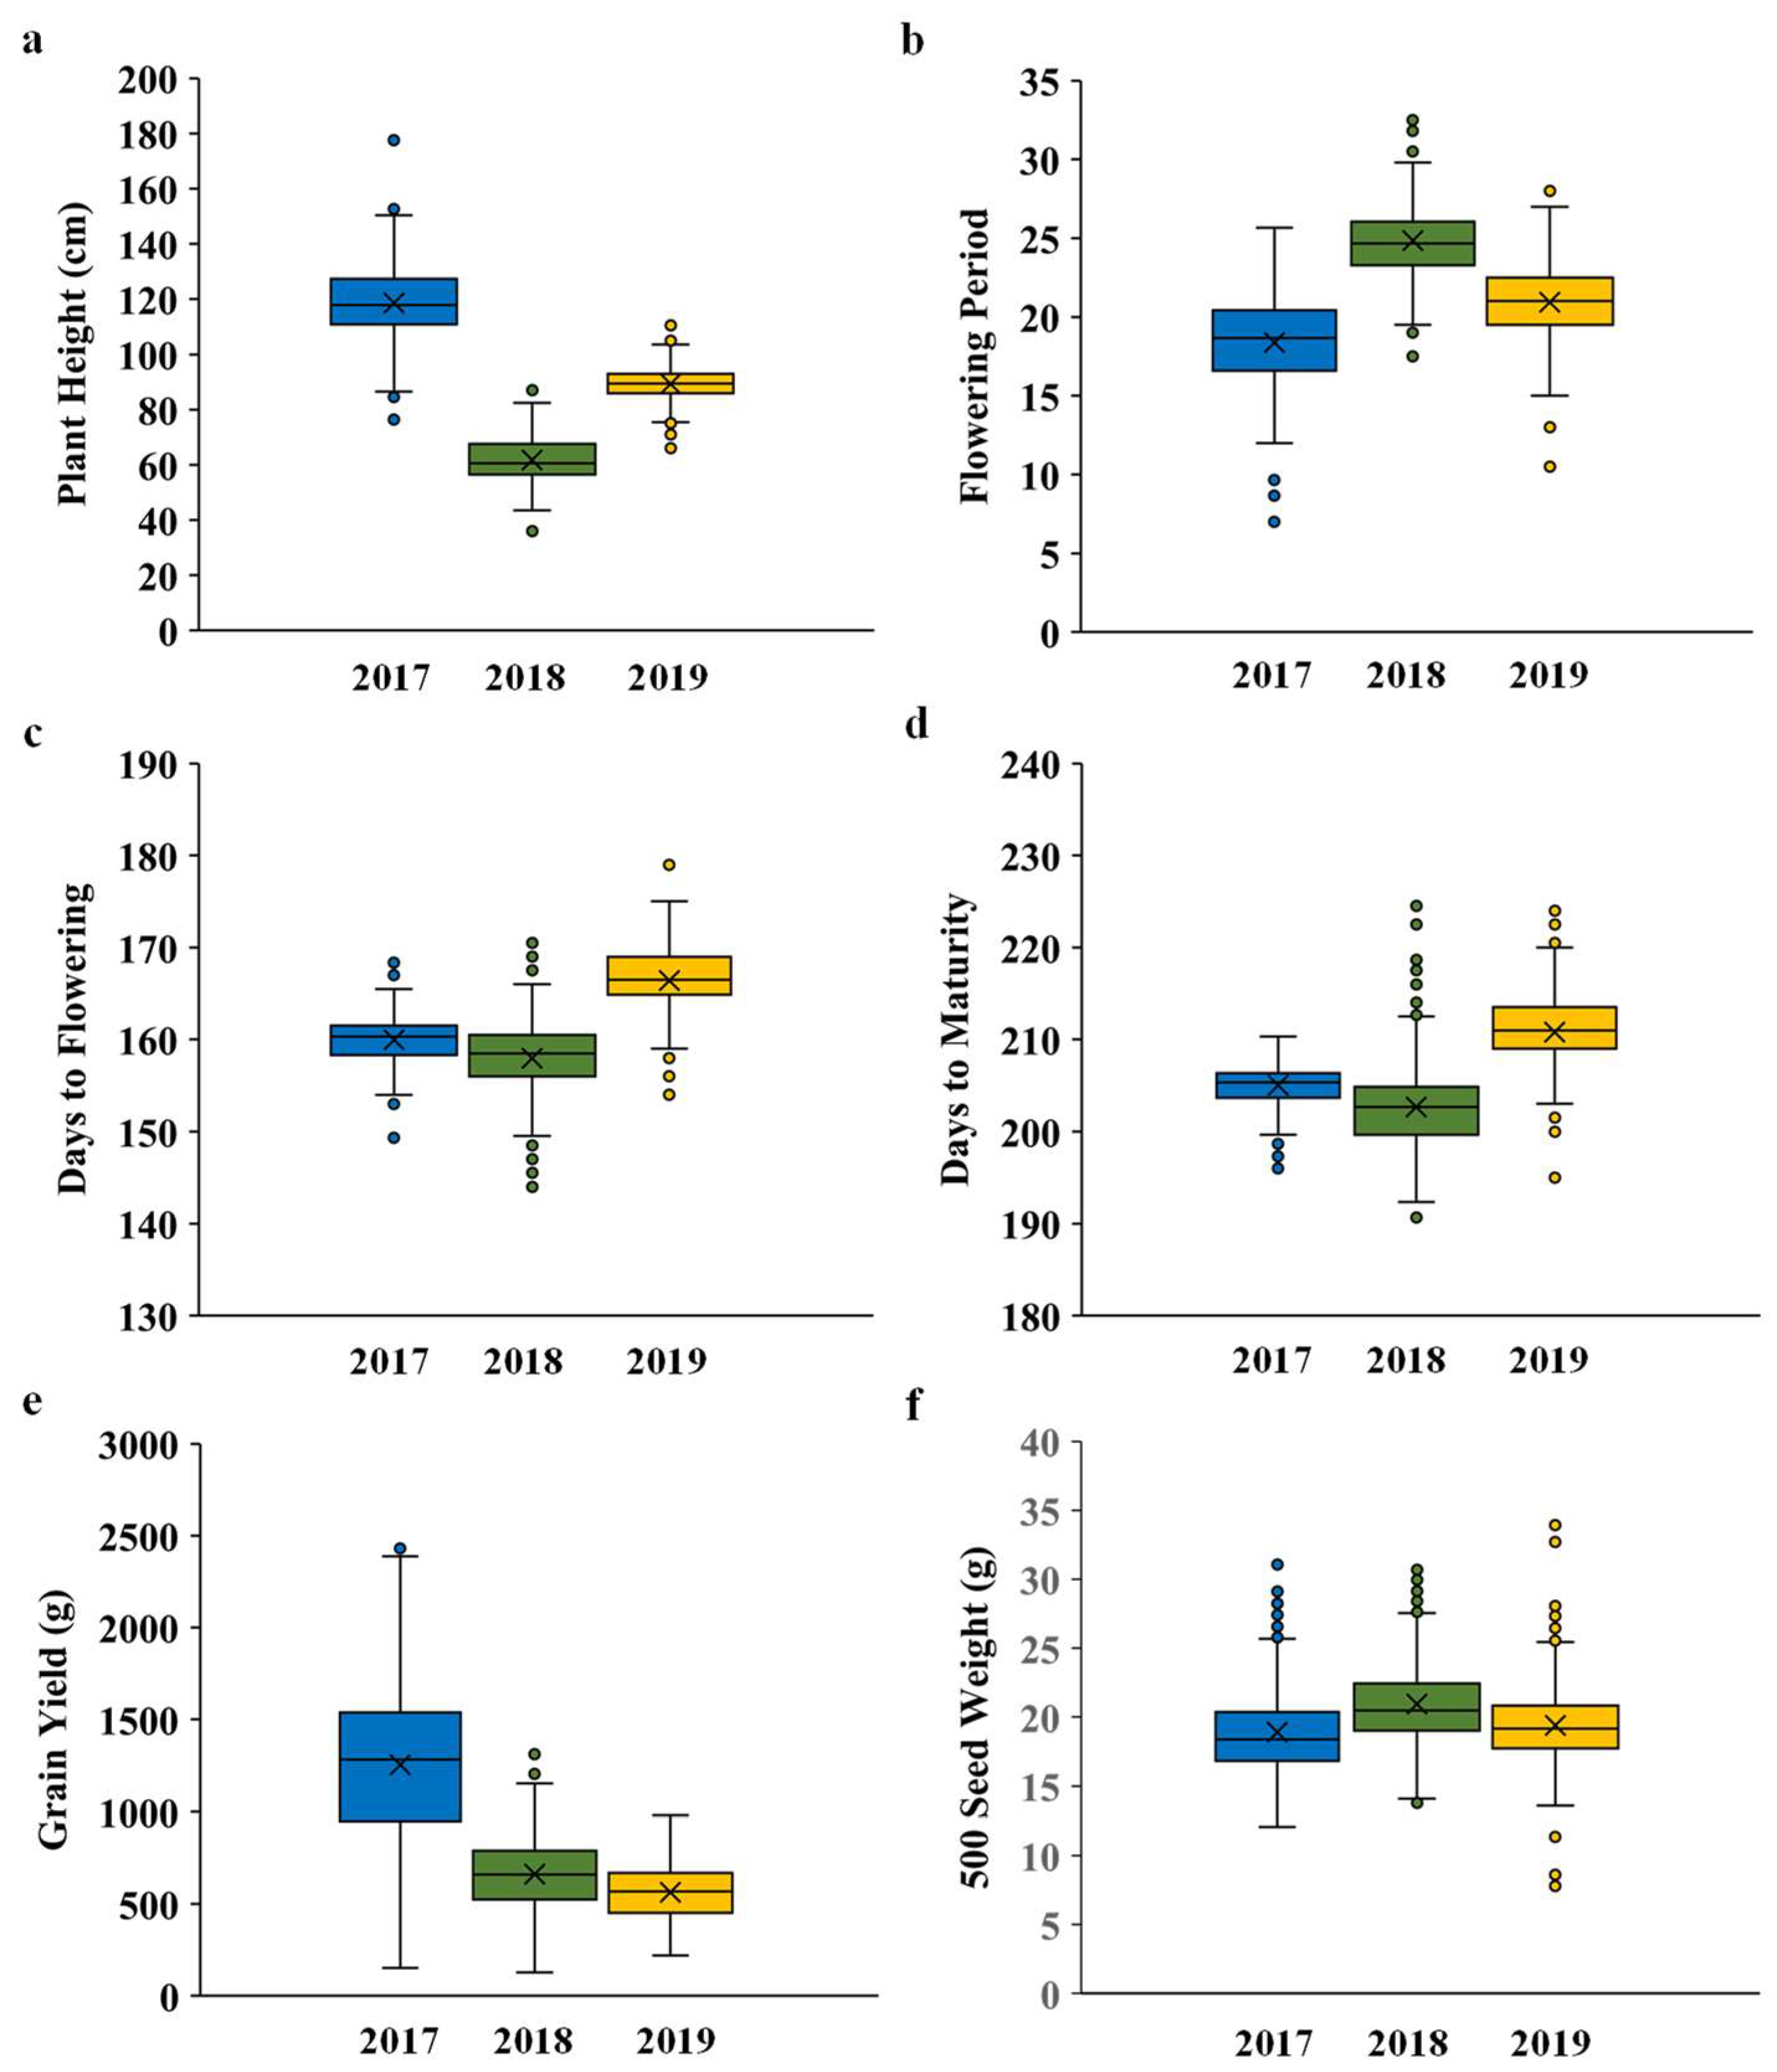
3.2. Plant Growth and Phenology

Plant height varied between the seasons from 76.5–177.5 cm in 2017, 36.0–87.0 cm in 2018, and 66.0–110.5 cm in 2019 (Figure 3a). Similarly, DTFS and DTM varied across the seasons, although showing similar trends, with DTF varying between 149–168 DAS in 2017, 144–171 DAS in 2018, and 154–179 DAS in 2019 (Figure 3c); DTM varying between 196–210 DAS in 2017, 191–225 DAS in 2018, and 195–224 DAS in 2019 (Figure 3d); and FP varying between 7–26 days in 2017, 18–33 days in 2018, and 11–28 days in 2019 (Figure 3d). Plants grown in 2017 were taller and produced significantly higher yields, although the initial flowering and maturity periods were decreased (Figure 3). Meanwhile, 2018 plants were considerably shorter and their genotypes flowered for longer but produced significantly lower yields. Plants in 2019 were shorter than in 2017, but taller than in 2018, started flowering and matured later, and produced significantly lower yields (Figure 3). Grain yield per plot also changed between the seasons, varying from 151.75–2430.43 g in 2017, 127.41–1312.66 g in 2018, and 219.11–980.19 g in 2019 (Figure 3e). Although, the 500 seed weight differed little between the seasons, with weights ranging from 12.08–31.07 g in 2017, 13.78–30.70 g in 2018, and 7.8–33.93 g in 2019 (Figure 3f).
Despite the variations in physical grain weight between the years, some key phenological and agronomical trends could be elucidated for high-yielding genotypes. The top 20 high-yielding genotypes for each year were selected, with some overlap in the top 20 genotypes between the years (AVS-SAFF-142, AVS-SAFF-162, AVS-SAFF-230, AVS-SAFF-265, AVS-SAFF-269, AVS-SAFF-335, and AVS-SAFF-365: Table 2), although all 54 genotypes listed appeared in the top 80 yielding lines in all three years (Supplementary tables). High-performing safflower genotypes in this collection tended to start flowering in the second to third weeks of the approximately four-week initial flowering window, finishing flowering in the third to fourth weeks of the approximately four-week final flowering window, which gave them a roughly median flowering period. Similarly, high-yielding genotypes matured mid–late during the season (Table 2). Interestingly, particularly in 2017 and 2018, these high-performing lines were often the taller genotypes, with little preference given to spined capitula over spineless capitula.

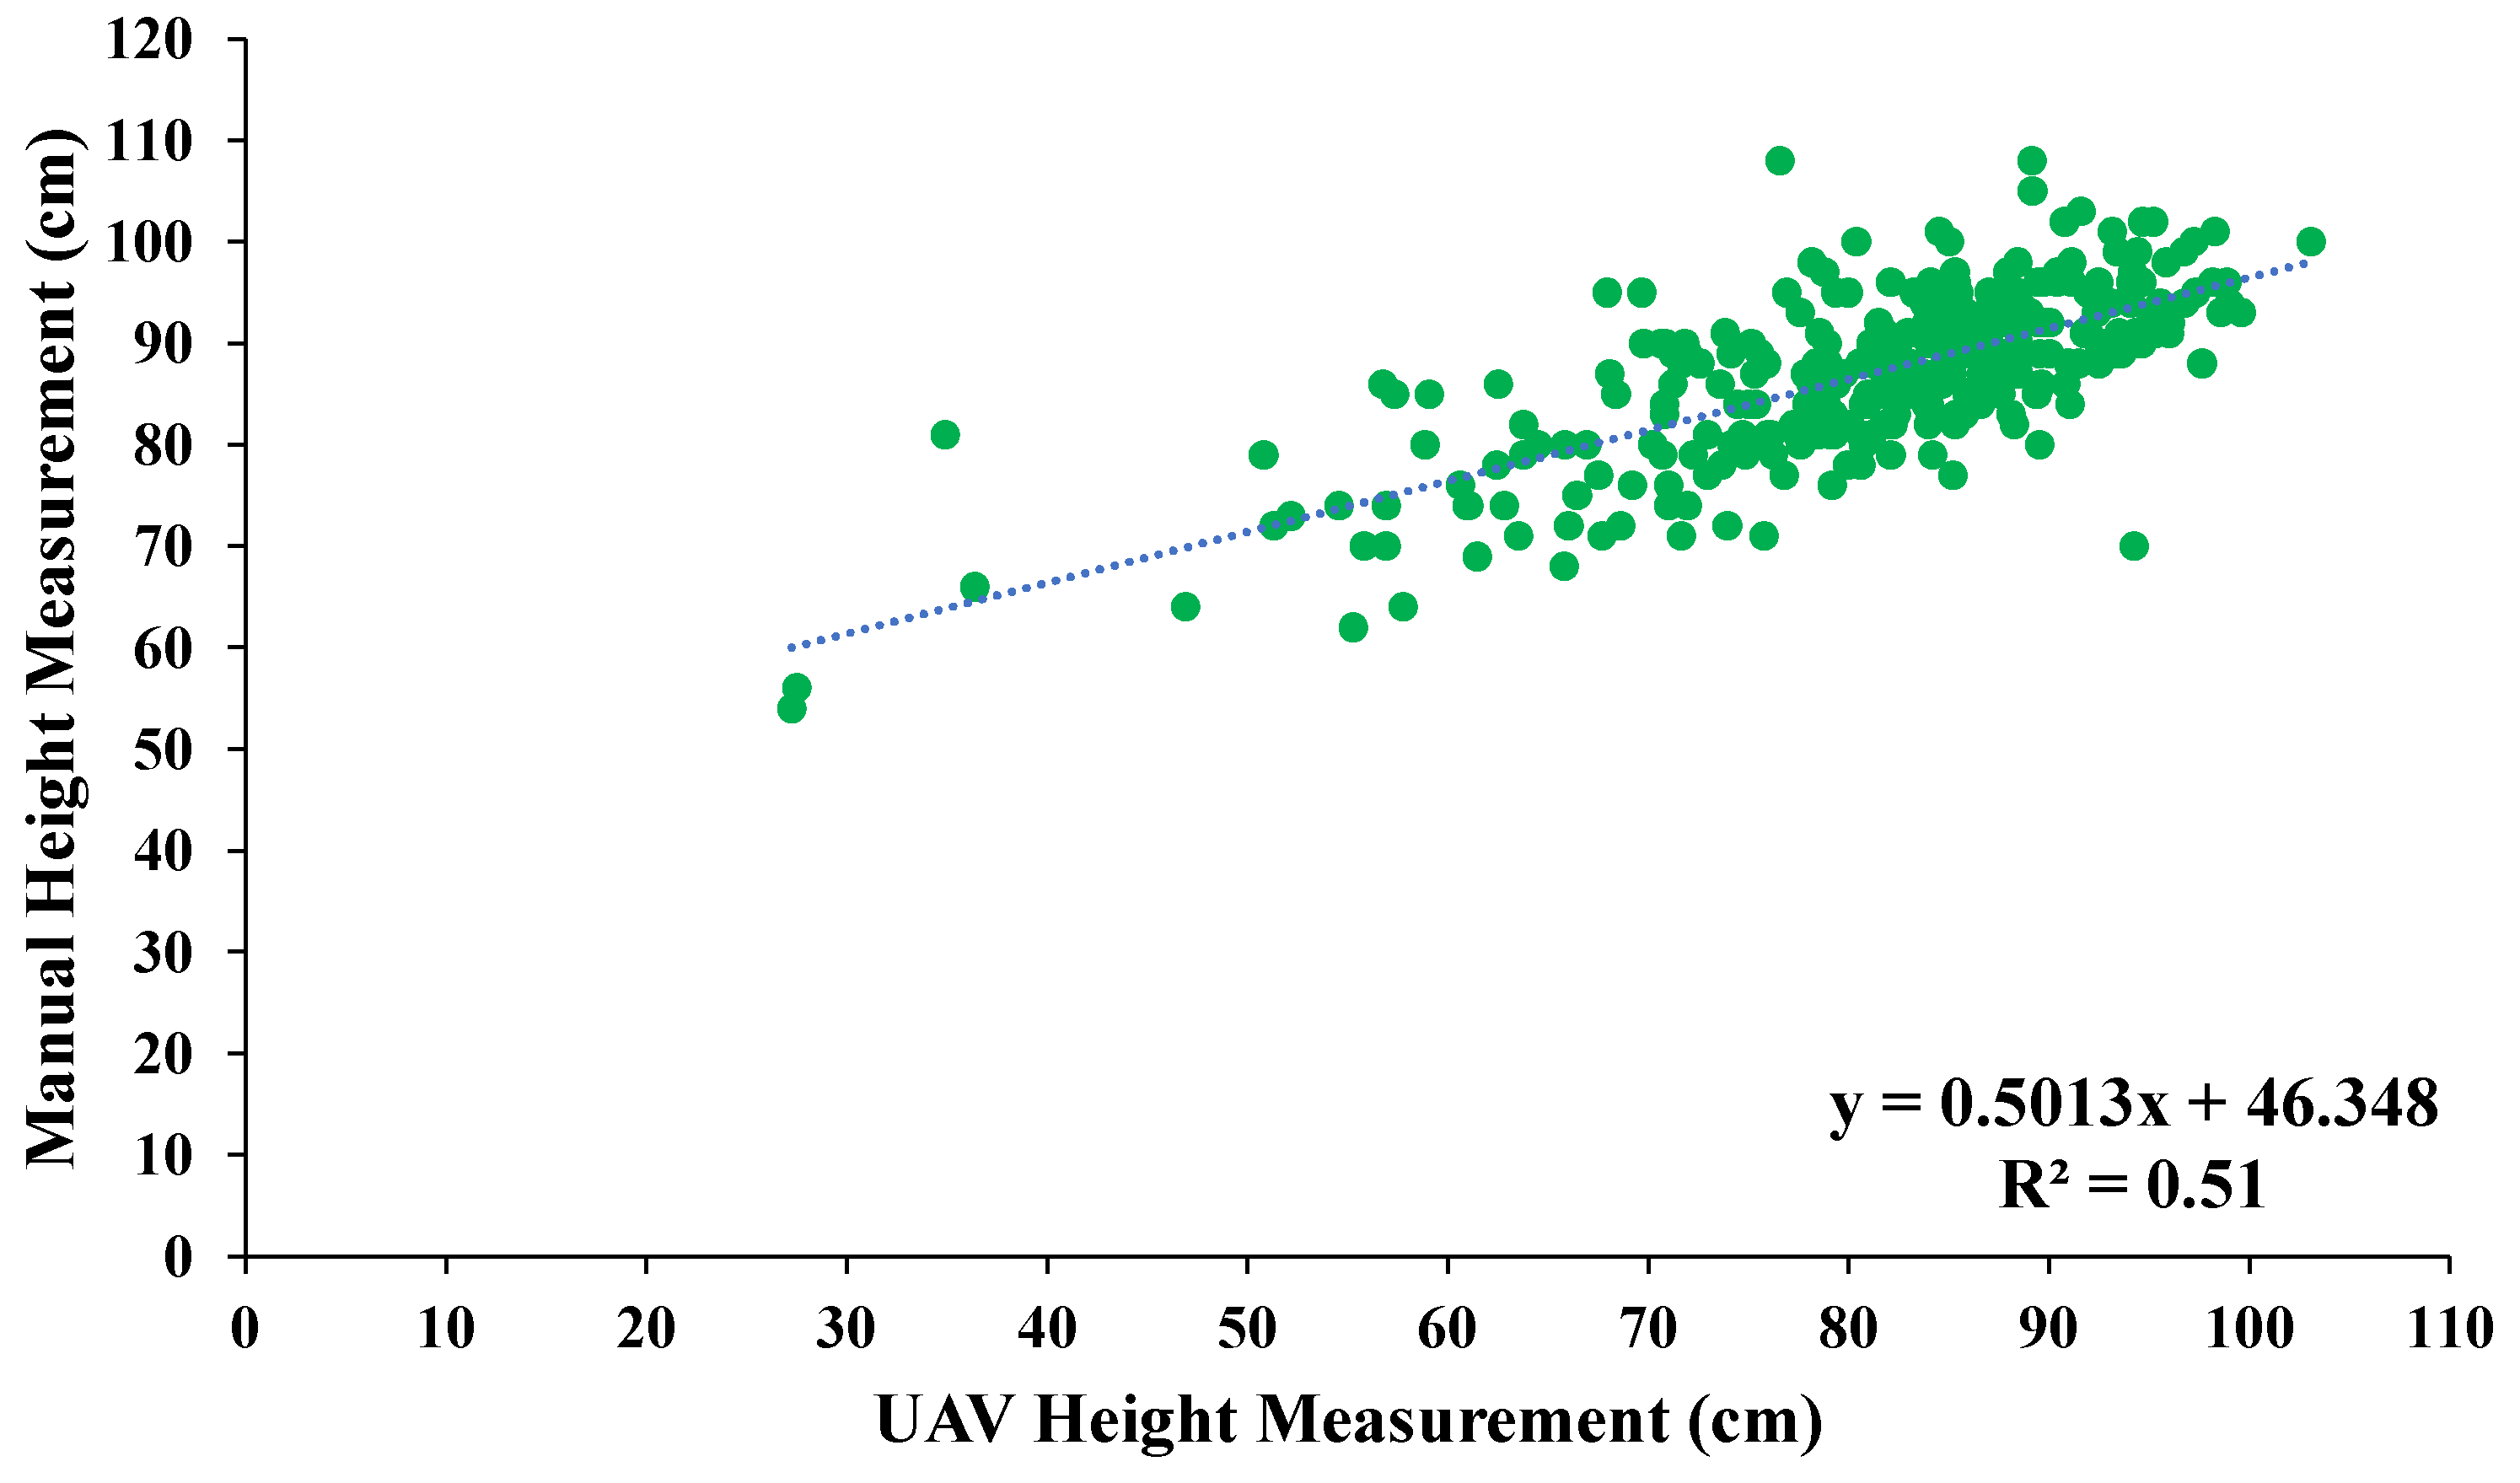
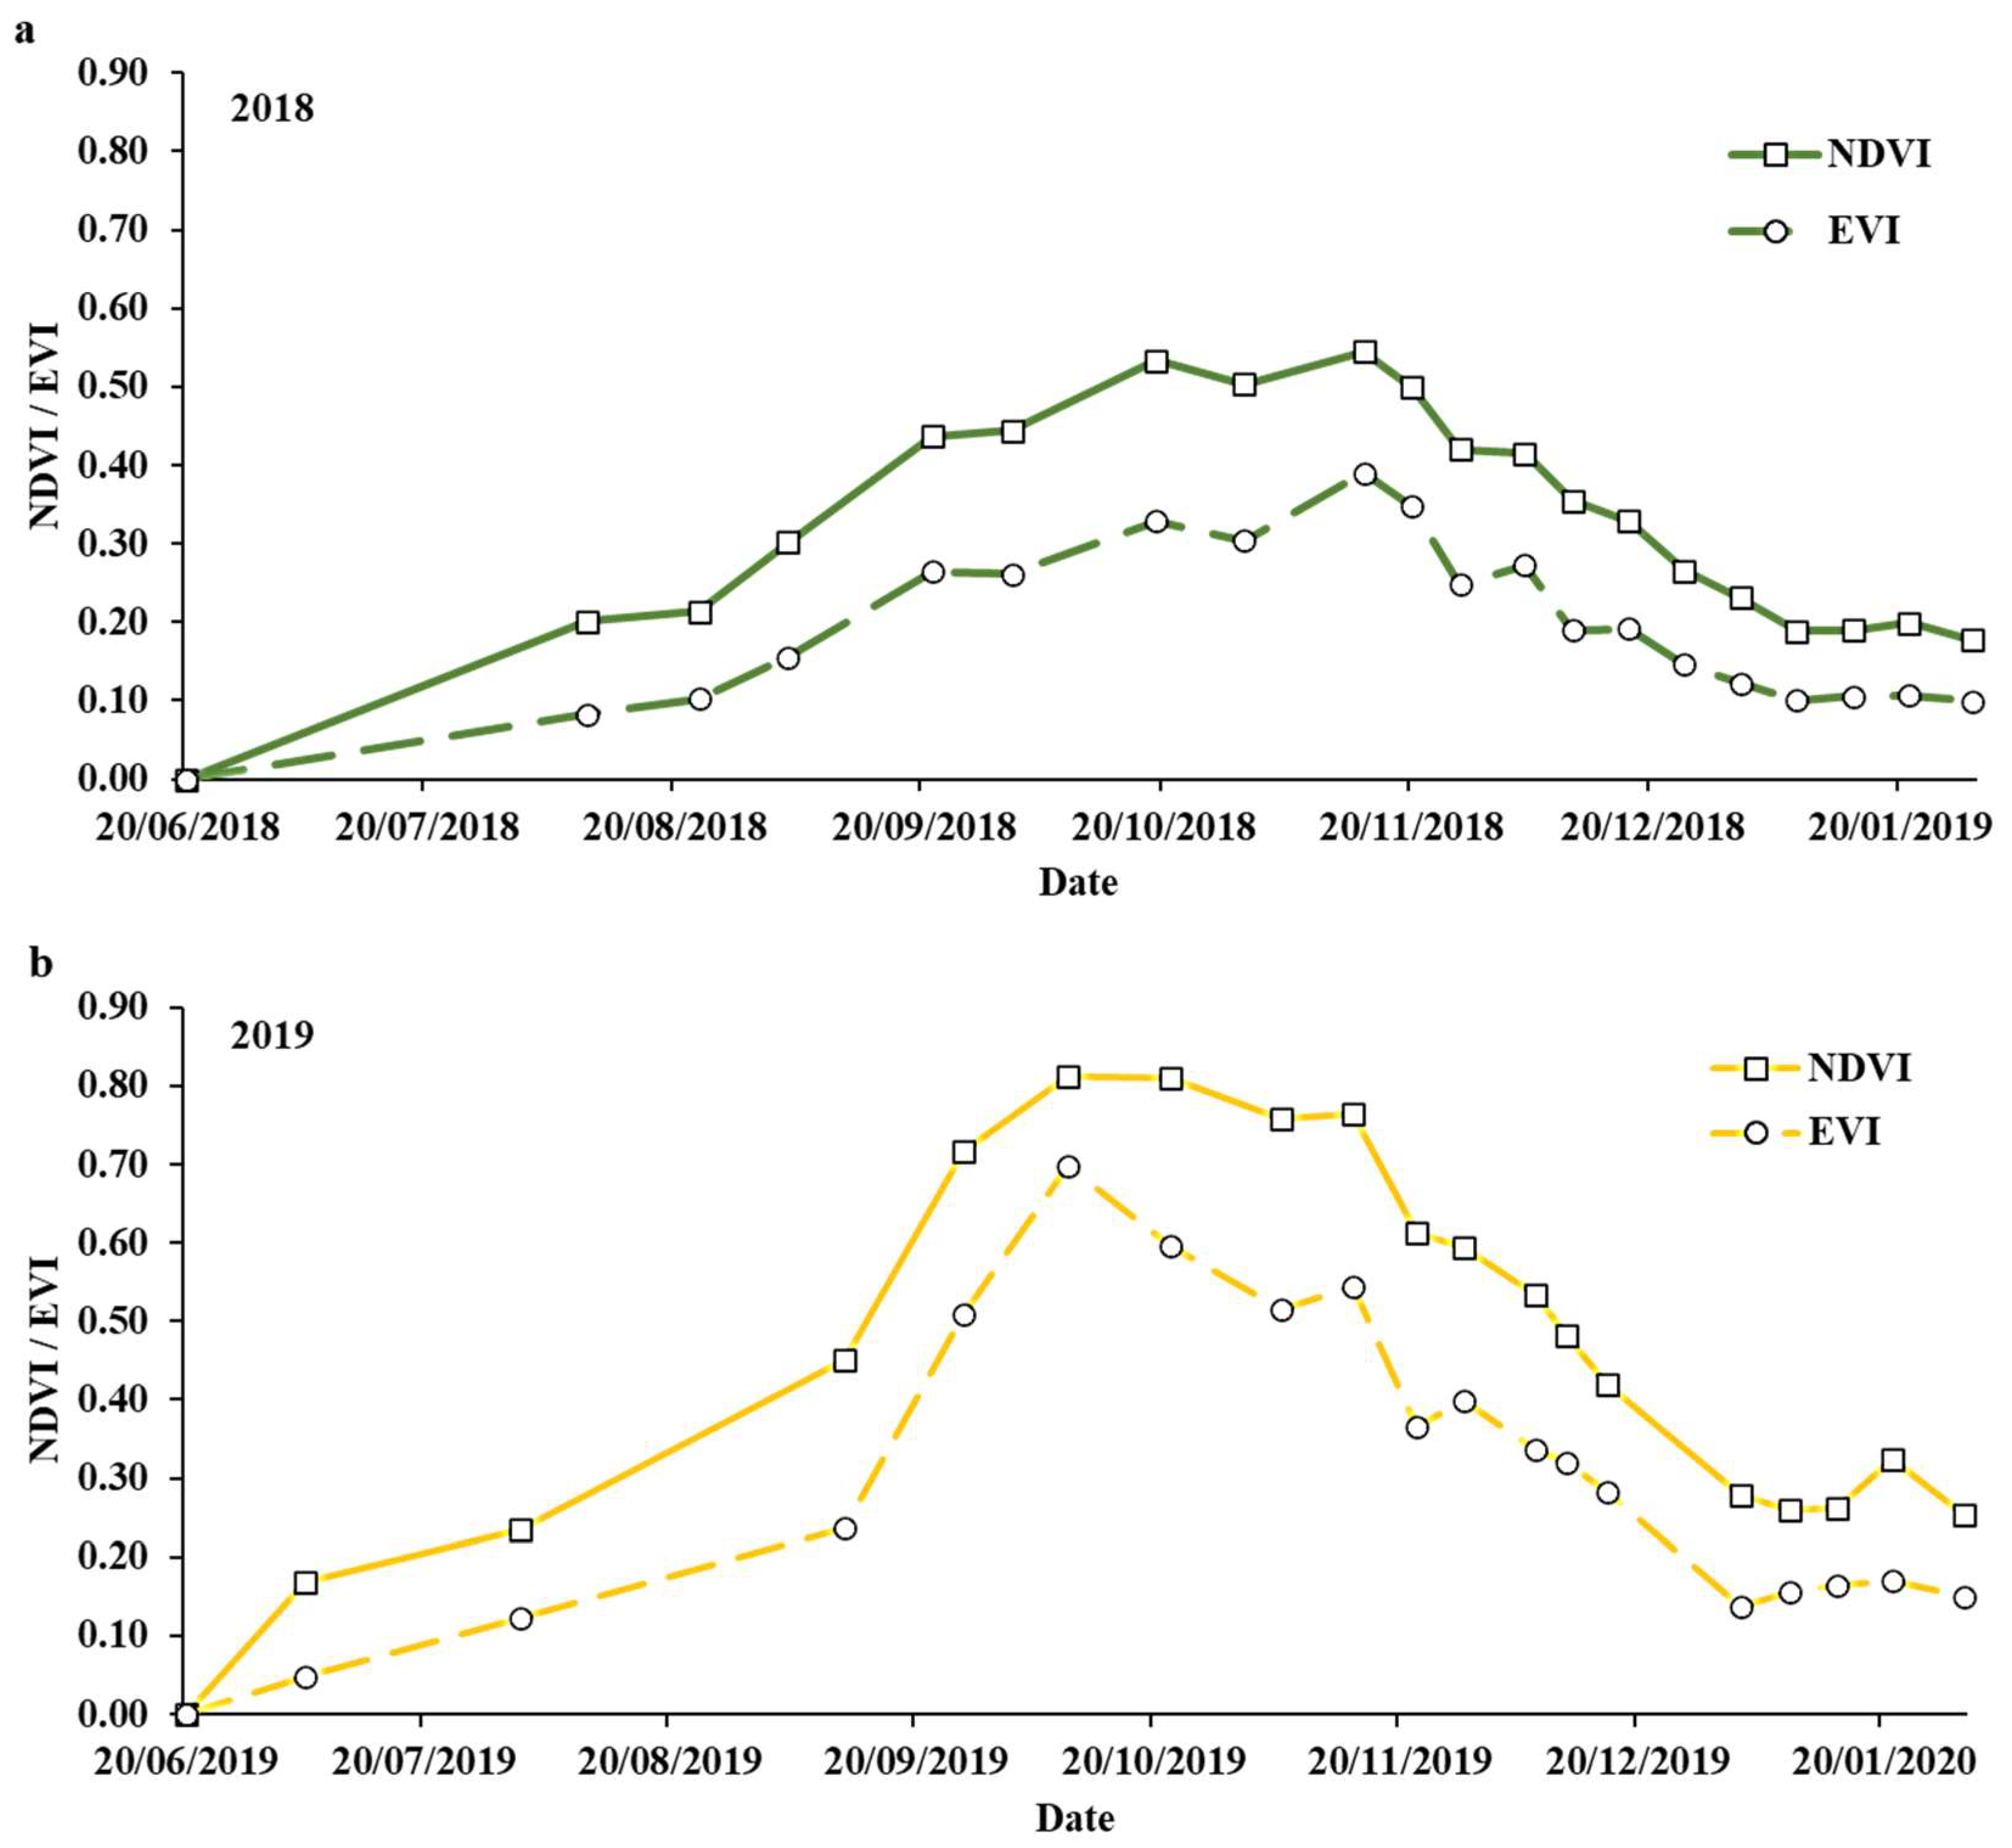
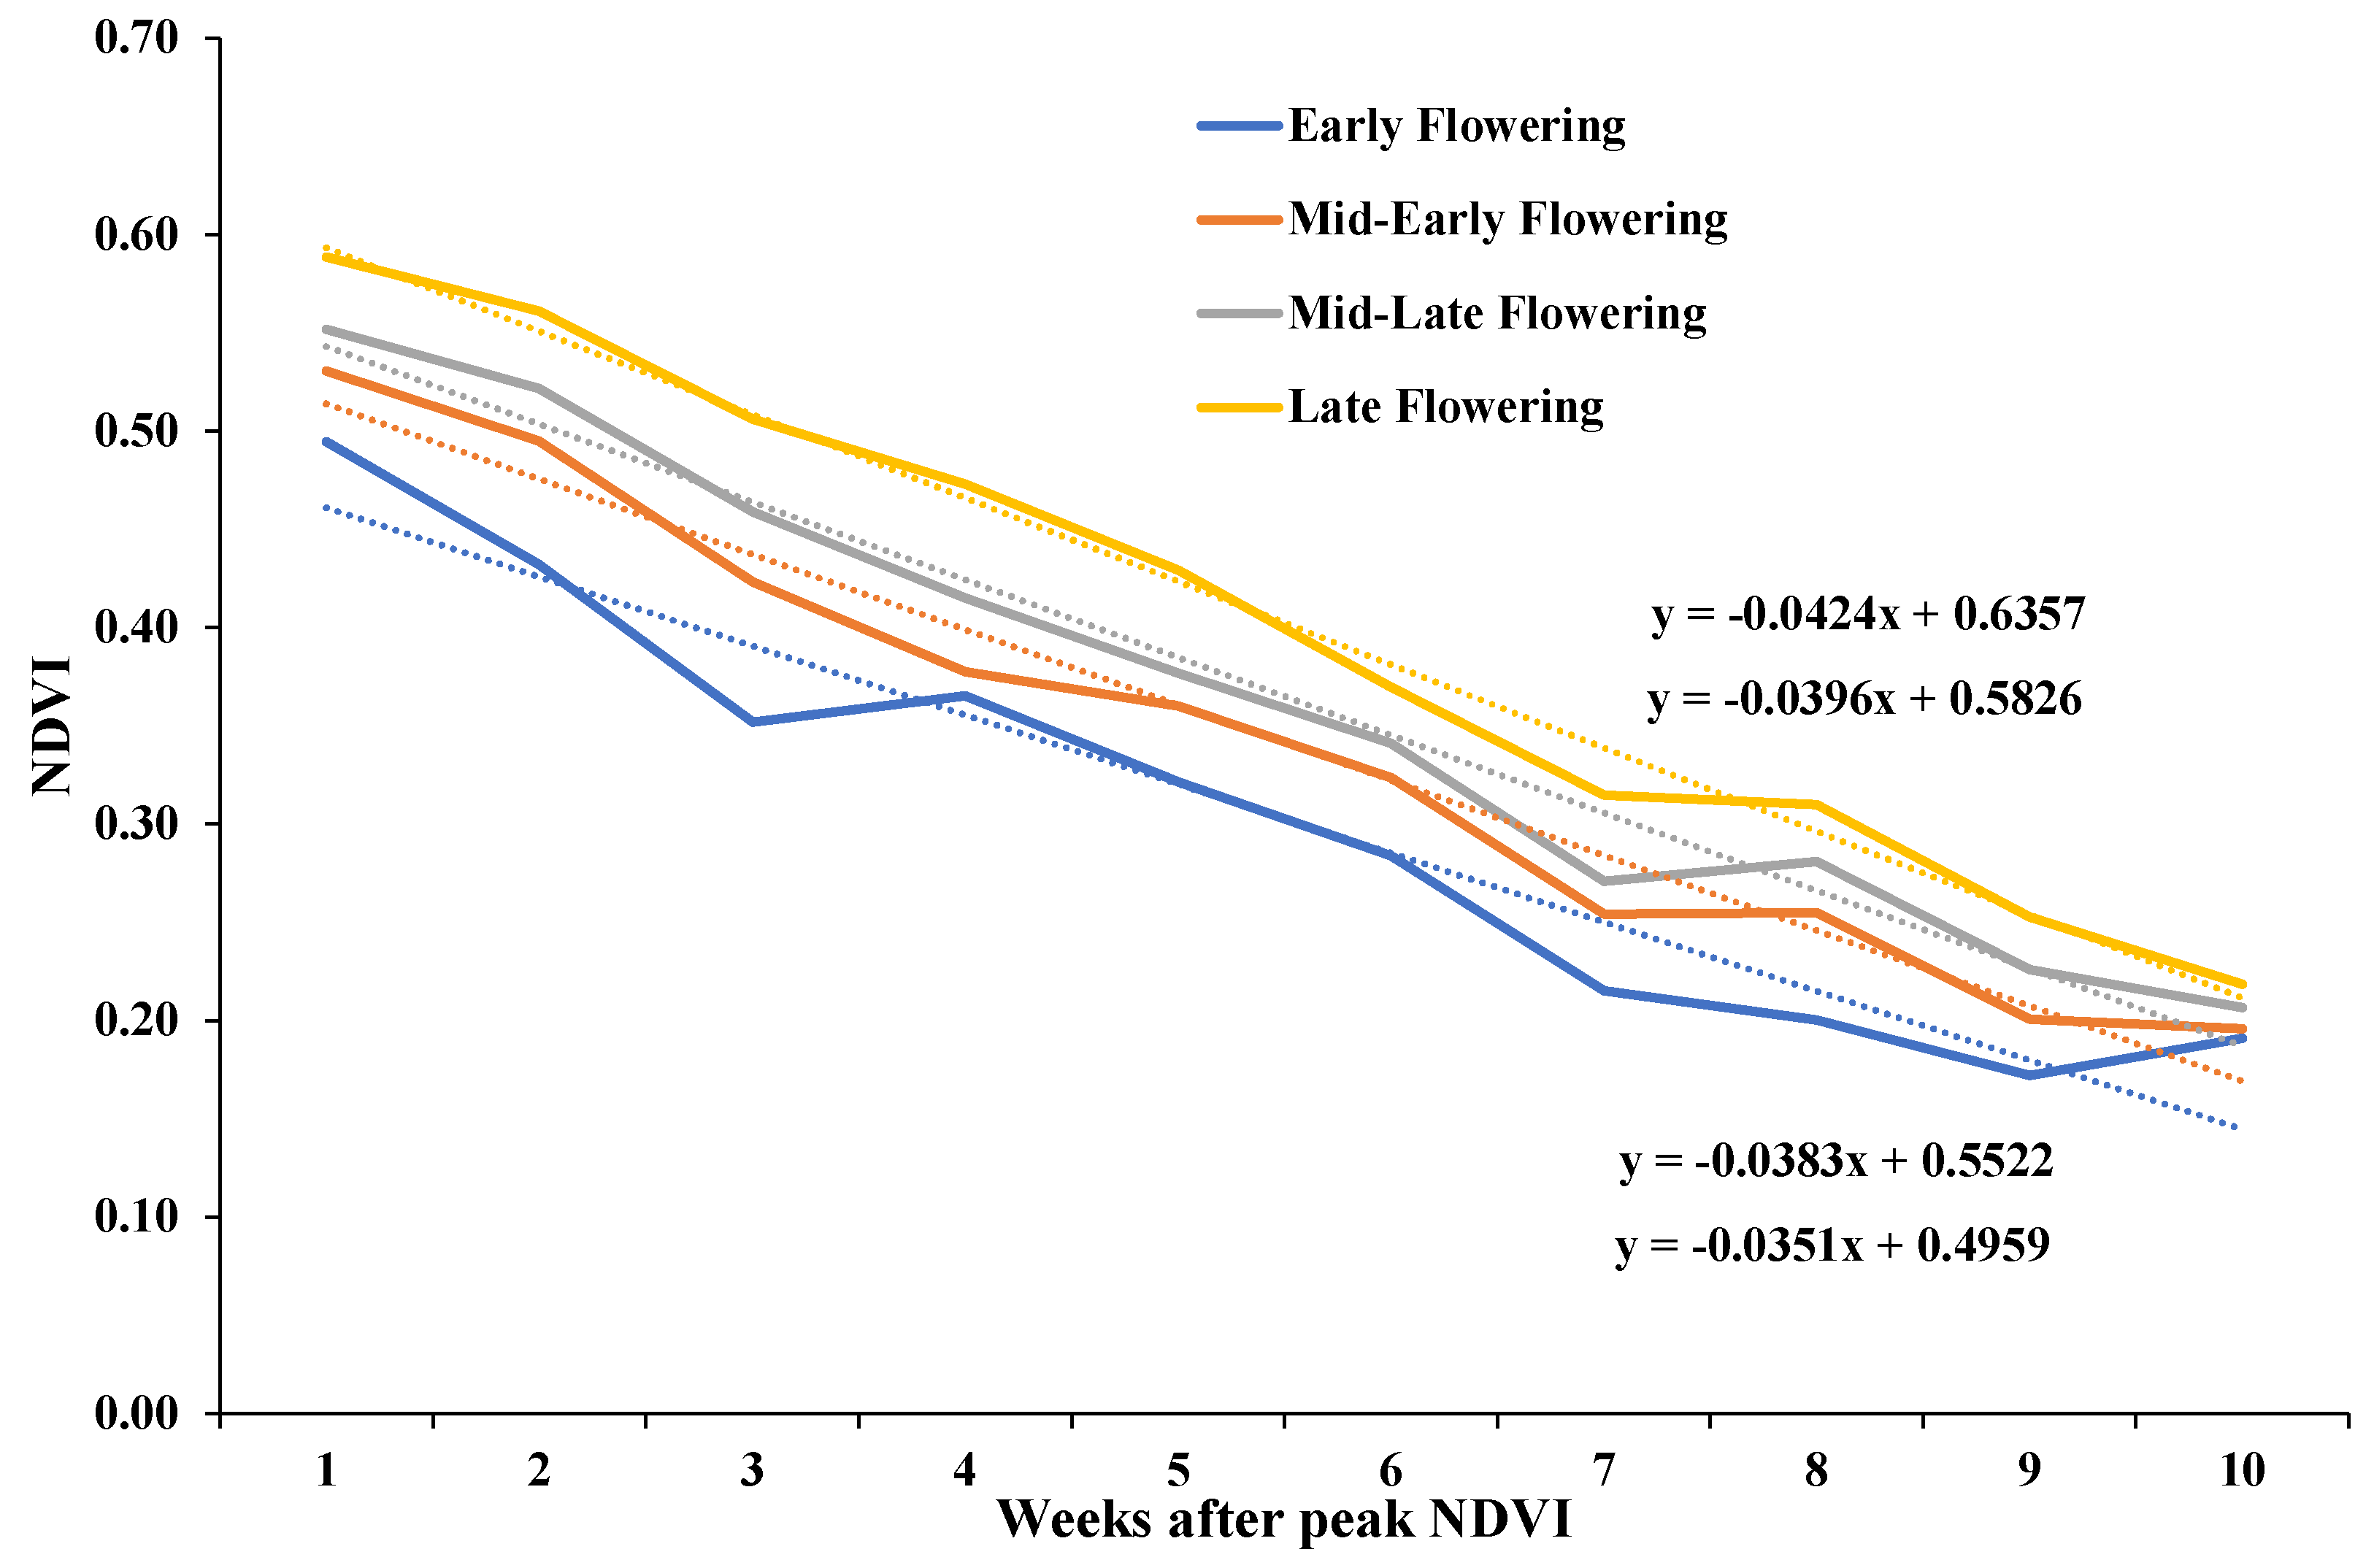
3.3. Aerially Derived Traits

The plant height of safflower genotypes varied between 31 and 105 cm in 2018 and 54 to 108 cm in 2019 with a normal distribution. The average plant heights were 61.8 cm and 88.6 cm in 2018 and 2019, respectively (Figure 3a). A correlation-based assessment was conducted to evaluate the performance of the SfM-derived CHM in relation to manual plot height measurements (Figure 4). The assessment revealed a statistically linear relationship between CHM and ground truth plant height with a coefficient of determination (R2) of 0.51 and therefore a moderately strong positive correlation. To minimise differences caused by plant growth, the manual measurements were carried out on the same days as the aerial imagery. Unlike the highest points measured during ground-based surveys, the CHM represents the complete relief of the crop surface at the time of measurement; therefore, the average CHM was found to be about 27 cm lower than the manual canopy height.
Figure 5 illustrates the average NDVI and EVI curves for all genotypes across 2018 and 2019. Both curves peaked higher and earlier in 2019 (Figure 5b), although the peak and subsequent decay occurred in a similar timeframe across both years. NDVI peaked in mid-November, just before the first genotypes began flowering, then it decayed in a significantly strong linear pattern until full plant maturity (Figure 5 and Figure 6). Based on manual phenology, these patterns in NDVI decay from the saturation peak were used to separate differences in flowering time between genotypes. Generally, genotypes which flowered early (Figure 6; blue) had the lowest peak NDVI, therefore the y-intercept and slope of decay, with late flowering genotypes preserving their higher peak NDVI values for longer (Figure 6; yellow), as illustrated by the higher slope of decay and y-intercept. Mid–early flowering (orange) and mid–late flowering genotypes (grey) also showed distinct separation between the values for early and late genotypes.
To understand the relationship between traits, correlation analysis was performed on the aggregate data from all three seasons and across all genotypes. Highly significant strongly positive correlations were seen between flowering and maturity traits, including DTFS and DTFE (r = 0.843 ***), DTFS and DTM (r = 0.839 ***), and DTFE and DTM (r = 0.830 ***; Table 3). Although FP had strong significant interactions with the above traits, these were not as strongly negative correlations and were mainly between DTFS and FP (r = −0.558 ***). Height showed significantly high positive correlations to flowering and maturity traits, DTFS (r = 0.800 ***) and DTM (r = 0.736 ***). Meanwhile, yield only had some significant correlations with other traits; they were negative to moderately weak correlations, such as those with DTFS (r = −0.197 ***) and FP (r = 0.290 ***). Interestingly, highly significant correlations were observed between all phenological and agronomical traits and the NDVI slope, although these were all only moderately weak negative correlations, such those correlations with DTFS (r = −0.310 ***), DFTE (r = −0.311 ***), height (r = −0.358 ***), and yield (r = −0.318 ***; Table 3). Similarly, NDVI y-int had strongly significant correlations with almost all other traits, although these correlations were only moderately weak, DTFS (r = 0.308 ***), DTFE (r = 0.357 ***), and yield (r = 0.356 ***).
A yield prediction algorithm was used to model plot yield based on UAV data, which gave a strong correlation (R2 = 0.63) between harvested grain yield and predicted grain yield (Figure 7).

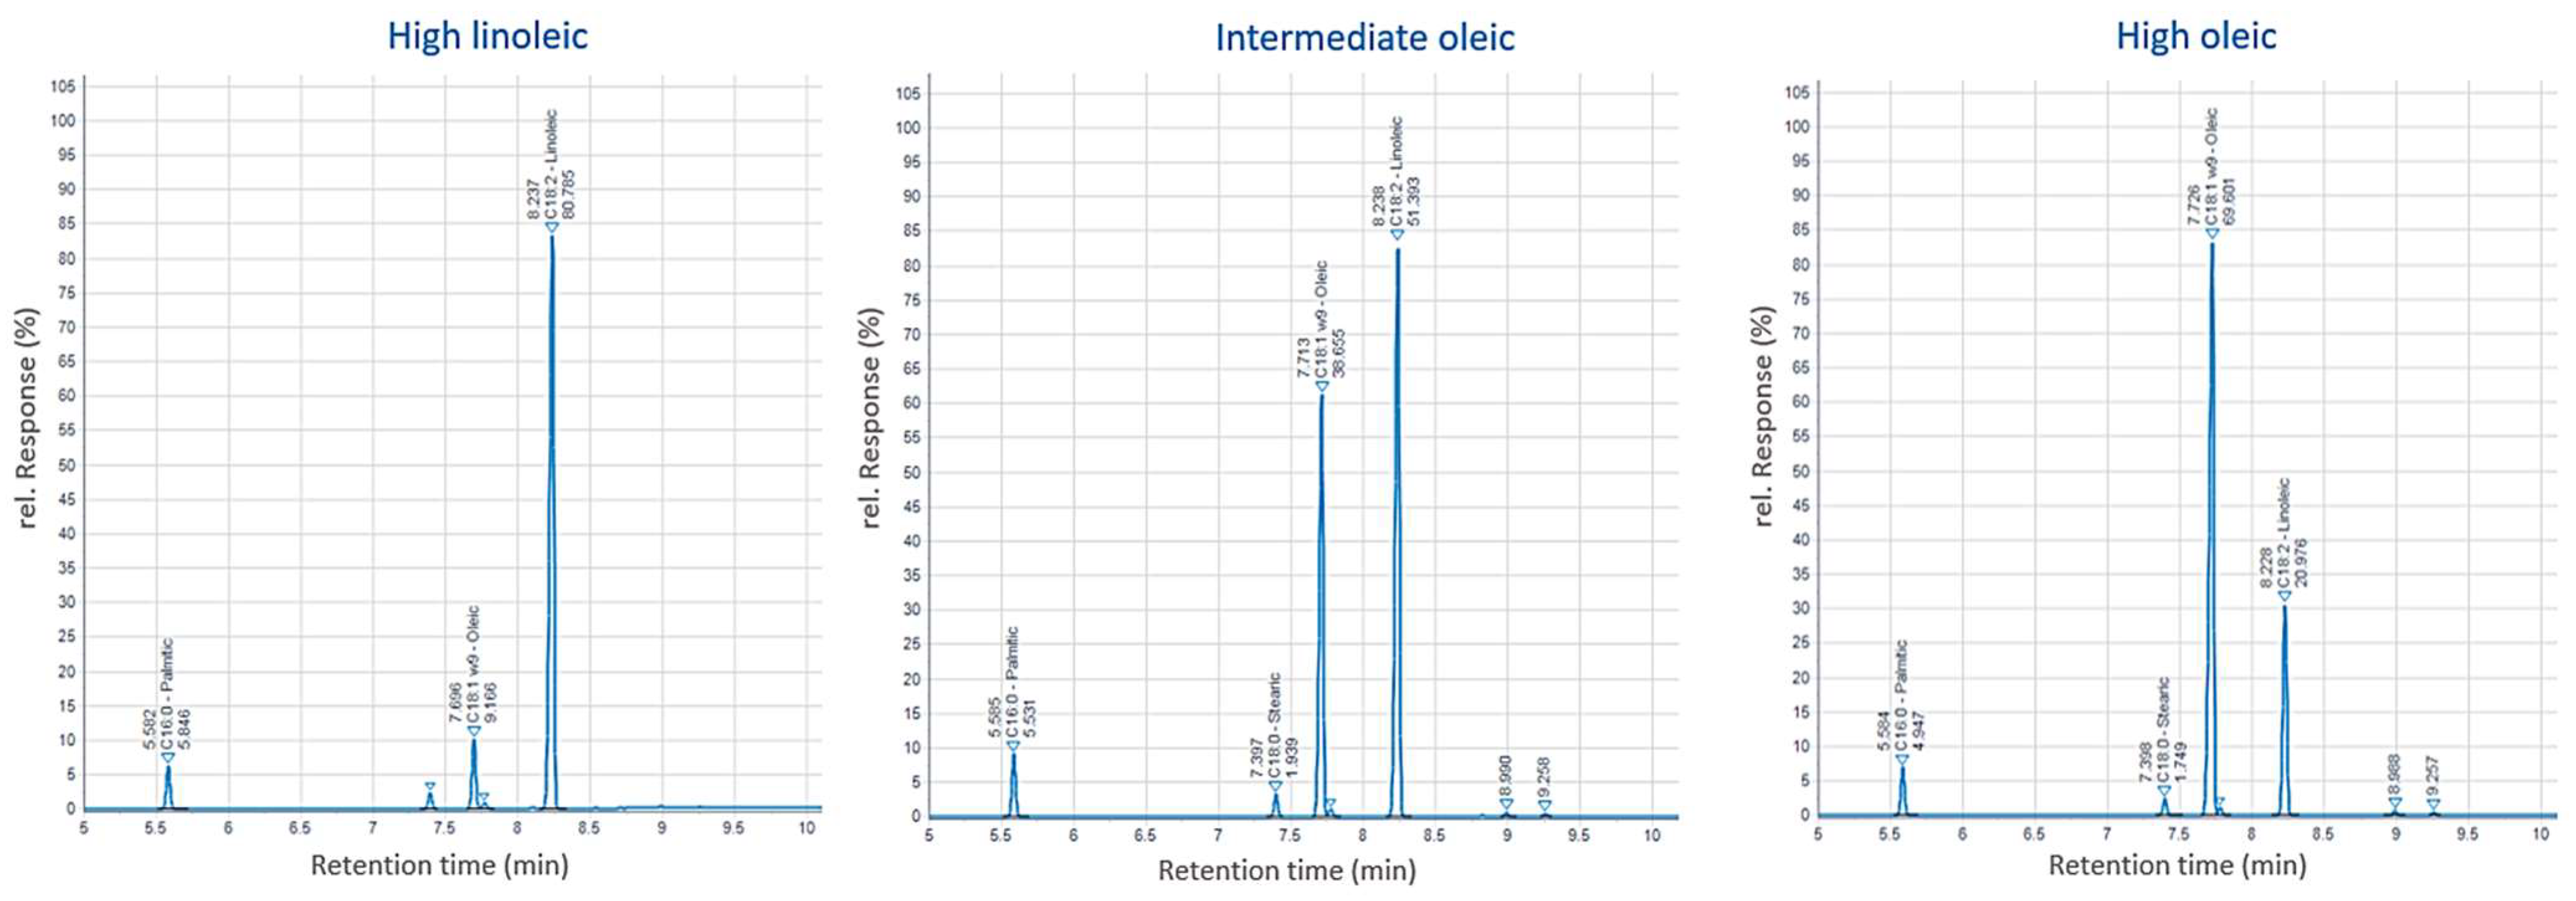
3.4. Oil Quality Traits

As the primary commercial use for safflower is oil production, understanding the variability in oil content and quality traits across the population was important. Oil classification classes were relatively stable across the three seasons for most genotypes in the growing season (Supplementary tables). Most of the genotypes in the collection presented in this article were high linoleic genotypes, with only six definitive high oleic genotypes (Table 4). Oil content varied across years, with the largest values seen in 2017, while the lowest oil content percentages were seen for certain genotypes in 2019. High oleic genotypes across all seasons produced the highest oil contents (Table 4). High linoleic genotypes typically had lower overall oil contents. Stearic and palmitic acid percentages varied little between the years or genotypes (Supplementary tables).

4. Discussion

4.1. Seasonal Effects

The plasticity of phenology traits in safflower, as a response to varying growing environments, has previously been illustrated, particularly for plant biomass and structure [25,32,37,43,55,56]. Differences in rainfall patterns and temperature had significant impacts on safflower development and yield. In 2017, higher summer pre-sowing rainfall was recorded along with a wet, warm spring, although rainfall dramatically reduced during the summer, which resulted in larger, taller plants, able to produce more branches and flowers, and therefore higher overall yields. Lower pre-sowing rainfall in 2018 and 2019 failed to replace soil moisture lost to the previous cover crop, which significantly hindered safflower development and therefore yield. This trend echoes the findings by Bhattarai, et al. [57] who illustrated that safflower more efficiently utilizes pre-sowing rainfall compared to in-season irrigation, suggesting adequate moisture at depth is more necessary for safflower yield than rainfall. The deep taproot formed by safflower, which can give drought tolerance to the crop [1], may, therefore, only be of benefit when deep water reserves are available towards the end of the season. Instead the lack of shallower roots may hinder yield development as plants seem to lack the ability to capture late season rainfall [58]. This also suggests that previous crop rotations can have significant impacts on the growth and yield of subsequent safflower crops, as demonstrated by Krupinsky, et al. [59], Tanaka, et al. [60], and Bassil, et al. [61] for safflower yield and N uptake. Slightly cooler temperatures in 2019 during flowering resulted in delays in flowering and maturity, matching with previous observations that safflower has degree day thresholds, which need to be met for reproductive development progression [32,62]. Although Arshad, et al. [55] demonstrated that simulated drought stress also influenced flowering and maturity phenology by shortening durations, suggesting that water availability as well as temperature and daylength impact safflower phenology. Yield in any crop, including safflower, is highly complex, depending on interrelations between genetics, the environment, and architecture. Despite the highly variable yields between the three seasons presented here, the 500 seed weight differed little between the years. This matches with previous research, which similarly concluded yield differences in safflower were more likely dependent on plant vigour and size, i.e., the number of branches and number of capitula and therefore the total number of seeds per plant [21,32,35,36,37,39,63] than seed size, unless under severe stress environments [22,55,64]. Seasonal effects therefore strongly influence safflower growth and yield, and consequently multi-year, multi-environment trials need to be factored into breeding or selection programs. Further, long-term studies on the effects of crop rotation, climatic variability, and fertilizer regimes, such as those conducted on cereals [65,66], would significantly contribute to improve safflower breeding and agronomical practices.

4.2. High-Performing Genotypes

Generally, the high-performing genotypes for the environment described in this article had similar characteristics and phenology, although a few genotypes showed differing strategies. Significant strong correlations were seen between phenology traits, with genotypes that initiated flowering earlier, finished flowering earlier, and therefore matured earlier, although only weak significant correlations were seen with yield. Therefore, while yield is a complex trait, phenology and height significantly impact final harvest values, matching previous findings [36,37,40,41,67]. Many of the top-performing genotypes across the three seasons were intermediate genotypes, with them starting flowering in the middle of the four-week initial flowering window seen in this collection, although they tended to finish flowering and then maturity mid–late in the final flowering and maturity windows. It has previously been speculated that early to intermediate safflower varieties would be better suited to southern Australian cropping systems [62,68]. Earlier varieties are better adapted to drier environments and more beneficial in seasons with reduced deep soil water reserves or rainfall, with them being able to finish flowering and assimilate remobilization before drought stress occurs late in the season. In wetter seasons, later varieties that can extract soil moisture and translocate and assimilate for longer may be preferable to increase available yield and oil content [28,32,69]. Interestingly, several early (i.e., AVS-SAFF-163, AVS-SAFF-218, and AVS-SAFF-265) and late (i.e., AVS-SAFF-157, AVS-SAFF-238, AVS-SAFF-350, and AVS-SAFF-365) genotypes also produced high yields in this study, especially in 2019. The lack of strongly consistent top-performing genotypes across all three seasons illustrates the lack of safflower varieties adapted to Southern Australian farming systems and changing growing conditions between seasons. Although, further research around the seven genotypes (AVS-SAFF-142, AVS-SAFF-162, AVS-SAFF-230, AVS-SAFF-265, AVS-SAFF-269, AVS-SAFF-335, AVS-SAFF-365, and AVS-SAFF-365) which performed well across two seasons may benefit future Australian safflower breeding efforts, as they are likely to have more traits suitable for these environments. The diversity of phenotypic strategies in response to different growing seasons shown in this collection demonstrates the genetic variability available in safflower populations for yield-contributing traits. The result from our experiments also suggests intermediate genotypes may be more economically profitable in the long term, with them able to maintain reasonable yields across the spectrum of dry to wet seasons, rather than genotypes specifically suited to drier or wetter environments.
Interestingly, capitulum morphology had little impact on plant development and yield, with the spineless genotypes in this collection performing well across all years, mimicking the findings of Kumar, et al. [38]. This is despite spiny genotypes being more prevalent in the collection, representative of their domination in production in most areas due to the relatively poor grain performance of many past spineless genotypes [70,71]. The release of higher yielding and disease-resistant spineless varieties may improve uptake by farmers. While sacrificing some resistance to large animal predators, the spineless safflower would be more “user-friendly” in terms of disease surveillance and harvesting, especially when rectifying blockages [72].
Plant height has significant direct and indirect links to crop biomass, flowering, and yield [35]. Environmental conditions, rainfall, genetics, and planting density all impact final plant height [22,25,29,30,41,67,73,74,75], as plant height was considerably lower in 2018 and 2019 due to lower rainfall and temperatures. Previous researchers have described that the ideal safflower ideotype, for moderate to arid growing regions, was short, early flowering and spiny, as, in their studies, height had a negative correlation with yield [40,56]. Other research has clearly demonstrated strongly positive correlations between the two traits, as taller plants often had increased stem branching, therefore more capitula and thus higher yields [9,32,36,37,41,73]. Increased branching would increase the photosynthetic capacity of the plants [63], although greater stem biomass seems to have no impact on stem assimilate storage or remobilization in safflower [69]. On the other hand, Moghaddam, et al. [56] found principal component analysis split genotypes into those with a negative correlation between yield and height and those with a positive correlation. This echoes the results in this study, where the highest yielding genotypes tended to be intermediate to tall genotypes, for each year, but when considering all genotypes over the three seasons, only a very weak negative correlation was observed. Plant height and stability under different environments may, therefore, only be a direct economically relevant trait for only some genotypes and/or environments [28]. Height may instead have more impact on yield through the correlations with flowering and maturity traits. Highly significant strongly positive correlations were observed between DTFS, DTFE, and DTM, with a highly significant moderately negative correlation with FP. Therefore, earlier flowering and maturing genotypes tended to be shorter but had longer flowering periods. This matches previous data, demonstrating the same relationship between flowering and height, although these studies found stronger correlations between yield and flowering [35,40,41,56]. Height and flowering are, therefore, traits of interest for future breeding efforts.
The highest performing genotypes in this study were all linoleic genotypes, with the few oleic genotypes in the collection yielding relatively low. While the oil ranges in this collection, 7.57–74.5% oleic acid and 17.0–83.1% linoleic acid, were quite diverse, they do not encompass the extremes seen in other collections [10]. Despise this, the range suggests all major genes controlling fatty acid content [11] are present in the collections, which should not limit this collection’s use for breeding super high (>85%) oleic or linoleic genotypes. Although interestingly, the seven oleic genotypes in this collection tended to produce consistently higher oil content than linoleic genotypes, with them being comparable to the highest total oil content levels seen in other studies [9,25,34]. As expected, total oil content and percentage linoleic vs. oleic changed depending on the growing season, especially rainfall [11,32]. Factors such as temperature during seed maturation [10] and the duration from maturity to harvest [11] would have also accounted for some variability between the genotypes and growing seasons.

4.3. UAV-Derived Traits

High-throughput phenotyping allows for the rapid and accurate measurement of many plant traits, which can be used to identify genetic variations, correlations between different traits and ultimately select genotypes of interest in breeding programs. Previously, high-throughput phenotyping has only been deployed in limited field circumstances to study safflower, such as using image analysis pipelines to analyse aerially-derived RGB images and estimate safflower establishment rates and density [49]. Two of the simpler traits to remotely capture data using multispectral sensors are NDVI and EVI, which estimate crop green biomass. As the plants grew slowly during the rosette stages, NDVI and EVI stayed low until stem elongation, and branching increased overall plot biomass and therefore greenness. Despite flowering being delayed in 2019, both NDVI and EVI increased quicker and reached higher NDVI and EVI values, which was consistent with plants in 2019 being larger, although some late-season weeds may also have contributed to this. Peak NDVI for individual genotypes tended to occur around mid-November, although more genotypes tended to peak around 14th November in 2018 compared to 20th November in 2019, which matches with the delay in flowering also seen in 2019. As NDVI shows moderate significant correlations with flowering and earliness of flowering is known to impact yield, we investigated if peak NDVI values and NDVI decay could be used to identify early and late flowering genotypes. Early flowering genotypes tended to have lower peak (y–intercept) NDVI values with a lower decay slope. These earlier plants, therefore, likely would have finished vegetative growth and branching earlier, often producing less biomass/greenness before initiating flowering. The lower initial biomass also explains the lower decay/slope, as all genotypes had close to the same NDVI at field trial harvest. Late flowering genotypes continued accumulating biomass for an extra few weeks, resulting in higher peak NDVI values and therefore biomass. As the peak NDVI value was higher and the decay started later, the rate of decay was sharper. Peak NDVI values (NDVI y-intercept) had significantly positive moderate correlations with DTFS, DTFE, DTM, and height, as well as seed yield. These correlations match our other observations about the relationships between flowering, biomass, height, and yield. NDVI has otherwise only previously been used to differentiate fertilizer treatments in safflower [50], suggesting further research potential in the use of Vis to monitor and predict important crop traits.
Multispectral UAV data have previously been successfully used to estimate crop yield throughout the growing season [76,77,78]. Harvested yield data and UAV-derived indices were used to develop a model for crop prediction with a correlation of R2 = 0.63. This suggests that the approach of compiling VIs and structural data to predict future safflower yields has potential use by researchers and farmers alike.
The utilization of high-throughput imaging platforms will continue to unlock research potential in difficult or time-consuming conditions to capture safflower traits. While we have demonstrated the usefulness of NDVI to identify the start of flowering in safflower, other traits of agronomical and economic relevance may also be captured using sensor-based systems. Early vigour [79], crop volume and coverage [53], and lodging [80] are traits of interest in safflower production, which have already been successfully adapted to sensor-based approaches. As the number of flowers/capitula highly influenced seed yield, yield modelling would be significantly improved via modelling flower numbers. Similar approaches using VIs and flower classification deep learning methods have successfully classified flower types in wildflowers [81], phenotyped flowers and their effects on yield in canola [82,83], as well as identifying the location of safflower flowers for automated petal harvest [84].

5. Conclusions

In this study, we examined the diversity of phenotypic and agronomic responses of 350 safflower genotypes grown over three seasons. Phenotypic traits and overall crop performance strongly varied with environmental conditions, especially temperature, pre-sowing rainfall, and in-season rainfall. The results showed high-performing genotypes tended to be intermediate for most structural and phenological traits, allowing them to access and relocate more resources than early genotypes while still finishing their lifecycle before late-season drought stress impacted yields. Although, the ideal ideotype varies between seasons and growing environments. Interestingly, spineless genotypes performed similarly to spiky genotypes, suggesting future breeding efforts for more producer-suitable crops may include spinless genotypes without yield sacrifices. Furthermore, we demonstrated the use of UAV-derived spectral image data to determine plant height, biomass changes, the start of flowering, and yield estimation. Additional research is needed to further the use of UAV-derived data and machine learning processes in the high-throughput phenotyping of safflower.

Supplementary Materials

The following supporting information can be downloaded at: https://www.mdpi.com/article/10.3390/agriculture13030620/s1. Supplementary tables: Safflower genotypes grown in three field trials, with seed yield and quality traits.

Author Contributions

Investigation, methodology, data curation, and writing—original manuscript draft, E.T.-K.; formal analysis, methodology, and writing—review and editing, B.B., E.T.-K., J.P. and P.M.; investigation, supervision, and resources, S.K.; project administration, funding acquisition, and writing—review and editing, S.K., D.H., G.S. and M.H. All authors have read and agreed to the published version of the manuscript.

Funding

This work was supported by the Australian Government Cooperative Research Centre Project CRC-P54024, Agriculture Victoria Research, Agriculture Victoria Services Pty Ltd. and GO Resources Pty Ltd.

Institutional Review Board Statement

Not applicable.

Informed Consent Statement

Not applicable.

Data Availability Statement

Data are available from the authors upon request.

Acknowledgments

We thank all of the technical staff for their help in sowing, harvesting, and taking observations in the field experiments.

Conflicts of Interest

The authors declare no conflict of interest.

References

  1. Dajue, L.; Mündel, H.-H. Safflower. Carthamus tinctorius L.; Institute of Plant Genetics and Crop Plant Research, Gatersleben/International Plant Genetic Resources Institute: Rome, Italy, 1996; Volume 7. [Google Scholar]
  2. Emongor, V. Safflower (Carthamus tinctorius L.) the underutilized and neglected crop: A review. Asian J. Plant Sci. 2010, 9, 299–306. [Google Scholar] [CrossRef] [Green Version]
  3. Singh, V.; Nimbkar, N. Safflower. In Breeding Oilseed Crops for Sustainable Production; Gupta, S.K., Ed.; Elsevier: Amsterdam, The Netherlands, 2016; pp. 149–167. [Google Scholar]
  4. Hussain, M.I.; Lyra, D.-A.; Farooq, M.; Nikoloudakis, N.; Khalid, N. Salt and drought stresses in safflower: A review. Agron. Sustain. Dev. 2016, 36, 4. [Google Scholar] [CrossRef] [Green Version]
  5. Nuttall, J.G.; Davies, S.L.; Armstrong, R.A.; Peoples, M.B. Testing the primer-plant concept: Wheat yields can be increased on alkaline sodic soils when an effective primer phase is used. Aust. J. Agric. Res. 2008, 59, 331–338. [Google Scholar] [CrossRef]
  6. Knights, S.; Wachsmann, N.; Norton, R. Safflower (Carthamus tinctorius L.) production and research in southern Australia. In Proceedings of the 5th International Safflower Conference, Williston, North Dakota, Sidney, MT, USA, 23–27 July 2001; pp. 213–217. [Google Scholar]
  7. Jochinke, D.; Wachsmann, N.; Potter, T.; Norton, R. Growing safflower in Australia: Part 1—History, experiences and current constraints on production. In Proceedings of the 7th International Safflower Conference, Wagga Wagga, Australia, 3–6 November 2008. [Google Scholar]
  8. Wachsmann, N.; Knights, S.; Norton, R. The potential role of safflower (Carthamus tinctorius L.) in Australia’s southern farming systems. In Proceedings of the 10th Australian Agronomy Conference, Hobart, Tasmania, 28 January–1 February 2001. [Google Scholar]
  9. La Bella, S.; Tuttolomondo, T.; Lazzeri, L.; Matteo, R.; Leto, C.; Licata, M. An agronomic evaluation of new Safflower (Carthamus tinctorius L.) germplasm for seed and oil yields under Mediterranean climate conditions. Agronomy 2019, 9, 468. [Google Scholar] [CrossRef] [Green Version]
  10. Fernández-Martinez, J.; del Rio, M.; de Haro, A. Survey of safflower (Carthamus tinctorius L.) germplasm for variants in fatty acid composition and other seed characters. Euphytica 1993, 69, 115–122. [Google Scholar] [CrossRef]
  11. Gecgel, U.; Demirci, M.; Esendal, E.; Tasan, M. Fatty acid composition of the oil from developing seeds of different varieties of Safflower (Carthamus tinctorius L.). J. Am. Oil Chem. Soc. 2006, 84, 47–54. [Google Scholar] [CrossRef]
  12. Tultabaev, M.; Chomanov, U.; Tultabaeva, T.; Shoman, A.; Dodaev, K.; Azimov, U.; Zhumanova, U. Identifying patterns in the fatty-acid composition of safflower depending on agroclimatic conditions. East.-Eur. J. Enterp. Technol. 2022, 2, 116. [Google Scholar] [CrossRef]
  13. Wouters, J.; Grzywacz, C.M.; Claro, A. Markers for identification of faded Safflower (Carthamus tinctorius L.) colorants by HPLC-PDA-MS—Ancient fibres, pigments, paints and cosmetics derived from antique recipes. Stud. Conserv. 2010, 55, 186–203. [Google Scholar] [CrossRef]
  14. Zemour, K.; Labdelli, A.; Adda, A.; Dellal, A.; Talou, T.; Merah, O. Phenol content and antioxidant and antiaging activity of safflower seed oil (Carthamus Tinctorius L.). Cosmetics 2019, 6, 55. [Google Scholar] [CrossRef] [Green Version]
  15. Asgarpanah, J.; Kazemivash, N. Phytochemistry, pharmacology and medicinal properties of Carthamus tinctorius L. Chin. J. Integr. Med. 2013, 19, 153–159. [Google Scholar] [CrossRef]
  16. Carvalho, I.S.; Miranda, I.; Pereira, H. Evaluation of oil composition of some crops suitable for human nutrition. Ind. Crop Prod. 2006, 24, 75–78. [Google Scholar] [CrossRef]
  17. de Oliveira, C.V.K.; Santos, R.F.; Siqueira, J.A.C.; Bariccatti, R.A.; Lenz, N.B.G.; Cruz, G.S.; Tokura, L.K.; Klajn, F.F. Chemical characterization of oil and biodiesel from four safflower genotypes. Ind. Crop Prod. 2018, 123, 192–196. [Google Scholar] [CrossRef]
  18. Meka, P.K.; Tripathi, V.; Singh, R.P. Synthesis of biodiesel fuel from Safflower oil using various reaction parameters. J. Oleo Sci. 2007, 56, 9–12. [Google Scholar] [CrossRef] [PubMed] [Green Version]
  19. Khemchandani, B.; Jaiswal, A.; Sayanna, E.; Forsyth, M. Mixture of safflower oil and synthetic ester as a base stock for biodegradable lubricants. Lubr. Sci. 2014, 26, 67–80. [Google Scholar] [CrossRef]
  20. Anjani, K.; Yadav, P. High yielding-high oleic non-genetically modified Indian safflower cultivars. Ind. Crop Prod. 2017, 104, 7–12. [Google Scholar] [CrossRef]
  21. Dhruw, P.; Chandrakar, P.; Shrivastava, R. Assessment of genetic variability, heritability and genetic advance for seed yield and its contributing traits in elite germplasm accessions of safflower (Carthamus tinctorius L.). J. Pharma Innov. 2022, 11, 311–313. [Google Scholar]
  22. Feizi, M.; Hajabbasi, M.A.; Mostafazadeh-Fard, B. Saline irrigation water management strategies for better yield of safflower (Carthamus tinctorius L.) in an arid region. Aust. J. Crop Sci. 2010, 4, 408–414. [Google Scholar]
  23. Javed, S.; Bukhari, S.A.; Ashraf, M.Y.; Mahmood, S.; Iftikhar, T. Effects of salinity on growth, biochemical parameters and fatty acid composition in Safflower (Carthamus tinctorius L.). Pak. J. Bot. 2014, 46, 1153–1158. [Google Scholar]
  24. Yeilaghi, H.; Arzani, A.; Ghaderian, M. Evaluating the contribution of ionic and agronomic components toward salinity tolerance in safflower. Agron. J. 2015, 107, 2205–2212. [Google Scholar] [CrossRef]
  25. Beyyavas, V.; Haliloglu, H.; Copur, O.; Yilmaz, A. Determination of seed yield and yield components of some safflower (Carthamus tinctorius L.) cultivars, lines and populations under the semi-arid conditions. Afr. J. Biotechnol. 2011, 10, 527–534. [Google Scholar] [CrossRef]
  26. Bijanzadeh, E.; Moosavi, S.M.; Bahadori, F. Quantifying water stress of safflower (Carthamus tinctorius L.) cultivars by crop water stress index under different irrigation regimes. Heliyon 2022, 8, e09010. [Google Scholar] [CrossRef] [PubMed]
  27. Bortolheiro, F.P.A.P.; Silva, M.A. Physiological response and productivity of safflower lines under water deficit and rehydration. An. Acad. Bras. Cienc. 2017, 89, 3051–3066. [Google Scholar] [CrossRef] [Green Version]
  28. Koutroubas, S.D.; Damalas, C.A.; Fotiadis, S. Safflower assimilate remobilization, yield, and oil content in response to nitrogen availability, sowing time, and genotype. Field Crop. Res. 2021, 274, 108313. [Google Scholar] [CrossRef]
  29. Shahrokhnia, M.H.; Sepaskhah, A.R. Physiologic and agronomic traits in safflower under various irrigation strategies, planting methods and nitrogen fertilization. Ind. Crop Prod. 2017, 95, 126–139. [Google Scholar] [CrossRef]
  30. Stavropoulos, P.; Roussis, I.; Kakabouki, I.; Mavroeidis, A.; Zotos, A.; Triantafyllidis, V.; Kosma, C.; Beslemes, D.; Tigka, E.; Papadopoulos, G. Influence of urea fertilization with and without inhibitors on growth and yield of safflower (Carthamus tinctorius L.) under different tillage practices. Bull. Univ. Agric. Sci. 2022, 79, 90–94. [Google Scholar]
  31. Yolci, M.S.; Tunçtürk, R. The effect of inorganic fertilizer and biofertilizer applications on some quality and biochemical properties of safflower (Carthamus tinctorius L.). YYU J. Agric. Sci. 2022, 32, 740–753. [Google Scholar] [CrossRef]
  32. Chehade, L.A.; Angelini, L.G.; Tavarini, S. Genotype and seasonal variation affect yield and oil quality of safflower (Carthamus tinctorius L.) under Mediterranean conditions. Agronomy 2022, 12, 122. [Google Scholar] [CrossRef]
  33. Yeilaghi, H.; Arzani, A.; Ghaderian, M.; Fotovat, R.; Feizi, M.; Pourdad, S.S. Effect of salinity on seed oil content and fatty acid composition of safflower (Carthamus tinctorius L.) genotypes. Food Chem. 2012, 130, 618–625. [Google Scholar] [CrossRef]
  34. Arslan, B.; Culpan, E. Identification of suitable safflower genotypes for the development of new cultivars with high seed yield, oil content and oil quality. Azarian J. Agric. 2018, 5, 133–141. [Google Scholar]
  35. Bidgoli, A.M.; Akbari, G.A.; Mirhadi, M.J.; Zand, E.; Soufizadeh, S. Path analysis of the relationships between seed yield and some morphological and phenological traits in safflower (Carthamus tinctorius L.). Euphytica 2006, 148, 261–268. [Google Scholar] [CrossRef]
  36. El Bey, N.; Kurt, O. Correlation and path coefficient analysis for seed yield and yield contributing components, phenological and some morphological traits in Safflower (Carthamus tinctorius L.). Int. J. Phytol. Res. 2023, 3, 1–6. [Google Scholar]
  37. Malve, A.S.; Rathod, A.H.; Shinde, S.L.; Zate, D.K. Correlation analysis between seed yield and yield contributing traits over the locations in genotypes of safflower (Carthamus tinctorius L.). J. Pharma Innov. 2022, 11, 3407–3412. [Google Scholar]
  38. Kumar, S.; Ambreen, H.; Variath, M.T.; Rao, A.R.; Agarwal, M.; Kumar, A.; Goel, S.; Jagannath, A. Utilization of molecular, phenotypic, and geographical diversity to develop compact composite core collection in the oilseed crop, Safflower (Carthamus tinctorius L.) through maximization strategy. Front. Plant Sci. 2016, 7, 1554. [Google Scholar] [CrossRef] [Green Version]
  39. Omidi, A.H.; Khazaei, H.; Hongbo, S. Variation for some important agronomic traits in 100 spring Safflower (Carthamus tinctorius L.) genotypes. Am.-Eurasian J. Agric. Environ. Sci. 2009, 5, 791–795. [Google Scholar]
  40. Nabloussi, A.; El Fechtali, M.; Lyagoubi, S.; Knights, S.; Potter, T. Agronomic and technological evaluation of a world safflower collection in Moroccan conditions. In Proceedings of the 7th International Safflower Conference, Wagga Wagga, Australia, 3–6 November 2008. [Google Scholar]
  41. Pavithra, K.; Patil, R.S.; Harijan, Y.; Nishanth, G. Correlation and path analysis studies in safflower (Carthamus tinctorius L.) germplasm. Res. J. Agric. Sci. 2016, 7, 428–432. [Google Scholar]
  42. Devi, Y.L.; Shrivastava, R.; Parihar, R. Inheritance pattern of important qualitative traits in safflower (Carthamus tinctorious L.). Int. J. Plant Soil Sci. 2022, 34, 1154–1165. [Google Scholar] [CrossRef]
  43. Kose, A.; Onder, O.; Bilir, O.; Kosar, F. Application of multivariate statistical analysis for breeding strategies of sping Safflower (Carthamus tinctorius L.). Turk. J. Field Crops 2018, 23, 12–19. [Google Scholar] [CrossRef]
  44. Zhao, H.; Li, Y.; Petkowski, J.; Kant, S.; Hayden, M.J.; Daetwyler, H.D. Genomic prediction and genomic heritability of grain yield and its related traits in a safflower genebank collection. Plant Genome 2021, 14, e20064. [Google Scholar] [CrossRef]
  45. Zhao, H.; Savin, K.W.; Li, Y.; Breen, E.J.; Maharjan, P.; Tibbits, J.F.; Kant, S.; Hayden, M.J.; Daetwyler, H.D. Genome-wide association studies dissect the G × E interaction for agronomic traits in a worldwide collection of safflowers (Carthamus tinctorius L.). Mol. Breed. 2022, 42, 24. [Google Scholar] [CrossRef]
  46. Al-Tamimi, N.; Langan, P.; Bernád, V.; Walsh, J.; Mangina, E.; Negrão, S. Capturing crop adaptation to abiotic stress using image-based technologies. Open Biol. 2022, 12, 210353. [Google Scholar] [CrossRef]
  47. Li, L.; Zhang, Q.; Huang, D. A review of imaging techniques for plant phenotyping. Sensors 2014, 14, 20078–20111. [Google Scholar] [CrossRef] [PubMed]
  48. Homolova, L.; Malenovský, Z.; Clevers, J.G.; García-Santos, G.; Schaepman, M.E. Review of optical-based remote sensing for plant trait mapping. Ecol. Complex. 2013, 15, 1–16. [Google Scholar] [CrossRef] [Green Version]
  49. Koh, J.C.O.; Hayden, M.; Daetwyler, H.; Kant, S. Estimation of crop plant density at early mixed growth stages using UAV imagery. Plant Methods 2019, 15, 64. [Google Scholar] [CrossRef] [Green Version]
  50. Papadopoulos, G.; Mavroeidis, A.; Roussis, I.; Kakabouki, I.; Stavropoulos, P.; Bilalis, D. Evaluation of tillage & fertilization in Carthamus tinctorius L. using remote sensing. Smart Agric. Technol. 2023, 4, 100158. [Google Scholar] [CrossRef]
  51. Joshi, S.; Thoday-Kennedy, E.; Daetwyler, H.D.; Hayden, M.; Spangenberg, G.; Kant, S. High-throughput phenotyping to dissect genotypic differences in safflower for drought tolerance. PLoS ONE 2021, 16, e0254908. [Google Scholar] [CrossRef] [PubMed]
  52. Thoday-Kennedy, E.; Joshi, S.; Daetwyler, H.D.; Hayden, M.; Hudson, D.; Spangenberg, G.; Kant, S. Digital phenotyping to delineate salinity response in safflower genotypes. Front. Plant Sci. 2021, 12, 662498. [Google Scholar] [CrossRef] [PubMed]
  53. Banerjee, B.P.; Spangenberg, G.; Kant, S. Fusion of spectral and structural information from aerial images for improved biomass estimation. Remote Sens. 2020, 12, 3164. [Google Scholar] [CrossRef]
  54. Rudolphi, S.; Becker, H.C.; Schierholt, A.; von Witzke-Ehbrecht, S. Improved estimation of oil, linoleic and oleic acid and seed hull fractions in Safflower by NIRS. J. Am. Oil Chem. Soc. 2012, 89, 363–369. [Google Scholar] [CrossRef] [Green Version]
  55. Arshad, A.; Qamar, H.; Siti-Sundari, R.; Zhang, Y.; Zubair, M.; Raza, M.A.; Habib-ur-Rehman, M.; Zhang, L. Phenotypic plasticity of spineless safflower (Carthamus tinctorius L.) cultivars in response to exogenous application of salicylic acid under rainfed climate conditions. Pak. J. Agric. Res. 2020, 33, 729–743. [Google Scholar] [CrossRef]
  56. Moghaddam, M.J.; Torbaghan, M.E.; Mirzaee, A. Analysis of genotype × environment interaction for seed yield in spineless safflower (Carthamus tinctorius L.) genotypes. Crop Breed. J. 2014, 4, 47–56. [Google Scholar] [CrossRef]
  57. Bhattarai, B.; Singh, S.; Angadi, S.V.; Begna, S.; Saini, R.; Auld, D. Spring safflower water use patterns in response to preseason and in-season irrigation applications. Agric. Water Manag. 2020, 228, 105876. [Google Scholar] [CrossRef]
  58. Merrill, S.; Tanaka, D.; Krupinsky, J.; Ries, R. Safflower root growth and water use in comparison with other crops. In Proceedings of the 5th International Safflower Conference, Williston, North Dakota, Sidney, MT, USA, 23–27 July 2001; Safflower: A multipurpose species with unexploited potential and world adaptability. pp. 227–231. [Google Scholar]
  59. Krupinsky, J.; Tanaka, D.; Merrill, S.; Liebig, M.; Hanson, J. Crop sequence effects of 10 crops in the northern Great Plains. Agric. Syst. 2006, 88, 227–254. [Google Scholar] [CrossRef]
  60. Tanaka, D.; Krupinsky, J.; Merrill, S.; Ries, R. Safflower production as influenced by previous crops. In Proceedings of the 5th International Safflower Conference, Williston, North Dakota, Sidney, MT, USA, 23–27 July 2001; pp. 259–262. [Google Scholar]
  61. Bassil, E.; Kaffka, S.; Hutmacher, R. Response of safflower (Carthamus tinctorius L.) to residual soil N following cotton (Gossypium spp.) in rotation in the San Joaquin Valley of California. J. Agric. Sci. 2002, 138, 395–402. [Google Scholar] [CrossRef]
  62. Wachsmann, N.; Knights, S.; Norton, R. Phenotypic variation of a selection of safflower (Carthamus tinctorius L.) lines and their potential in southern Australia. In Proceedings of the 5th International Safflower Conference, Williston, North Dakota, Sidney, MT, USA, 23–27 July 2001; Safflower: A multipurpose species with unexploited potential and world adaptability. 2001; pp. 263–267. [Google Scholar]
  63. Sadighfard, S.; Eslam, B.P.; Amirnia, R.; Zanghani, E. Evaluation of photosynthetic roles of different canopy strata and capitulum on seed yield and its components of spring Safflower (Carthamus tinctorius L.). Tirkish JAF Sci. Technol. 2022, 10, 1382–1389. [Google Scholar] [CrossRef]
  64. Esendal, A.; Istanbulluoglu, B.; Arslan, B.; Paşa, C. Effect of water stress on growth components of winter safflower (Carthamus tinctorius L.). In Proceedings of the 7th International safflower conference, Wagga Wagga, Australia, 3–6 November 2008; pp. 1–3. [Google Scholar]
  65. Berzsenyi, Z.; Győrffy, B.; Lap, D. Effect of crop rotation and fertilisation on maize and wheat yields and yield stability in a long-term experiment. Eur. J. Agron. 2000, 13, 225–244. [Google Scholar] [CrossRef]
  66. Armstrong, R.; Perris, R.; Munn, M.; Dunsford, K.; Robertson, F.; Hollaway, G.; O’Leary, G. Effects of long-term rotation and tillage practice on grain yield and protein of wheat and soil fertility on a Vertosol in a medium-rainfall temperate environment. Crop Pasture Sci. 2019, 70, 1–15. [Google Scholar] [CrossRef]
  67. Çamaş, N.; Çirak, C.; Esendal, E. Seed yield, oil content and fatty acids composition of safflower (Carthamus tinctorius L.) grown in northern Turkey conditions. J. Fac. Agric. OMU 2007, 22, 98–104. [Google Scholar] [CrossRef]
  68. Wachsmann, N.; Jochinke, D.; Potter, T.; Norton, R. Growing safflower in Australia: Part 2—Agronomic research and suggestions to increase yields and production. In Proceedings of the 7th International Safflower Conference, Wagga Wagga, Australia, 3–6 November 2008. [Google Scholar]
  69. Koutroubas, S.D.; Papakosta, D.K.; Doitsinis, A. Cultivar and seasonal effects on the contribution of pre-anthesis assimilates to safflower yield. Field Crop. Res. 2004, 90, 263–274. [Google Scholar] [CrossRef]
  70. Singh, S.; Nimbkar, N. Safflower (Carthamus tinctorius L.). In Genetic Resources, Chromosome Engineering, and Crop Improvement: Oil Crops; Singh, R.J., Ed.; CRC Press: New York, NY, USA, 2007; Volume 4, pp. 168–194. [Google Scholar]
  71. Saxena, M.; Singh, J.; Deshpande, S.; Choudhari, R. Two decades of safflower in Madhya Pradesh from 1984–2004. In Proceedings of the 7th International Safflower Conference, Wagga Wagga, Australia, 3–6 November 2008. [Google Scholar]
  72. Knights, S. Raising the Bar with Better Safflower Agronomy; Knights, S., Wachsmann, N., McCaffery, D., Cribb, M., Potter, T., Eds.; Grains Research & Development Corporation: Canberra, Australia, 2010. [Google Scholar]
  73. Tunçtürk, M.; Çiftçi, V. Relationships among traits using correlation and path coefficient analysis in safflower (Carthamus tinctorius L.) sown different fertilization levels and row spacing. Asian J. Plant Sci. 2004, 3, 683–686. [Google Scholar] [CrossRef]
  74. Malve, A.; Rathod, A.; Shinde, S.; Ghuge, S. Stability analysis in genotypes of safflower (Carthamus tinctorius L.). J. Pharma Innov. 2022, 11, 2246–2250. [Google Scholar]
  75. Thalji, T. Effect of planting date on yield performance and some agronomical traits in safflower (Carthamus Tincotorius L.) under rainfed and irrigation conditions in Jordan. Adv. Environ. Biol. 2015, 9, 367–370. [Google Scholar]
  76. Hassan, M.A.; Yang, M.; Rasheed, A.; Yang, G.; Reynolds, M.; Xia, X.; Xiao, Y.; He, Z. A rapid monitoring of NDVI across the wheat growth cycle for grain yield prediction using a multi-spectral UAV platform. Plant Sci. 2019, 282, 95–103. [Google Scholar] [CrossRef] [PubMed]
  77. Wan, L.; Cen, H.; Zhu, J.; Zhang, J.; Zhu, Y.; Sun, D.; Du, X.; Zhai, L.; Weng, H.; Li, Y. Grain yield prediction of rice using multi-temporal UAV-based RGB and multispectral images and model transfer—A case study of small farmlands in the South of China. Agric. For. Meterol. 2020, 291, 108096. [Google Scholar] [CrossRef]
  78. Zhao, H.; Pandey, B.R.; Khansefid, M.; Khahrood, H.V.; Sudheesh, S.; Joshi, S.; Kant, S.; Kaur, S.; Rosewarne, G.M. Combining NDVI and bacterial blight score to predict grain yield in field pea. Front. Plant Sci. 2022, 13, 923381. [Google Scholar] [CrossRef]
  79. Tefera, A.T.; Banerjee, B.P.; Pandey, B.R.; James, L.; Puri, R.R.; Cooray, O.; Marsh, J.; Richards, M.; Kant, S.; Fitzgerald, G.J.; et al. Estimating early season growth and biomass of field pea for selection of divergent ideotypes using proximal sensing. Field Crop. Res. 2022, 277, 108407. [Google Scholar] [CrossRef]
  80. Koh, J.C.O.; Spangenberg, G.; Kant, S. Automated machine learning for high-throughput image-based plant phenotyping. Remote Sens. 2021, 13, 858. [Google Scholar] [CrossRef]
  81. Gallmann, J.; Schüpbach, B.; Jacot, K.; Albrecht, M.; Winizki, J.; Kirchgessner, N.; Aasen, H. Flower mapping in grasslands with drones and deep learning. Front. Plant Sci. 2022, 12, e774965. [Google Scholar] [CrossRef]
  82. Wan, L.; Li, Y.; Cen, H.; Zhu, J.; Yin, W.; Wu, W.; Zhu, H.; Sun, D.; Zhou, W.; He, Y. Combining UAV-based vegetation indices and image classification to estimate flower number in oilseed rape. Remote Sens. 2018, 10, 1484. [Google Scholar] [CrossRef] [Green Version]
  83. Zhang, T.; Vail, S.; Duddu, H.S.; Parkin, I.A.; Guo, X.; Johnson, E.N.; Shirtliffe, S.J. Phenotyping flowering in Canola (Brassica napus L.) and estimating seed yield using an unmanned aerial vehicle-based imagery. Front. Plant Sci. 2021, 12, 686332. [Google Scholar] [CrossRef]
  84. Ichiura, S.; Yoshihiro, H.; Sato, K.; Onodera, R.; Katahira, M. Safflower production management ECOSYSTEM with AI harvester. In Proceedings of the 2020 ASABE Annual International Virtual Meeting, St. Joseph, MI, USA, 13–15 July 2020; p. 1. [Google Scholar]
Figure 1. Weather data at the Plant Breeding Centre, Horsham, field site during 2017–2019. Monthly rainfall (bars), average monthly minimum (lower lines), and maximum temperatures (upper lines) plotted for each year.
Agriculture 13 00620 g001
Figure 2. Chromatographs showing oil profiles for high linoleic, intermediate oleic and high oleic safflower genotypes. Chromatographs show gas chromatography peaks with retention times. Labels on significant peaks: palmitic acid, steric acid, oleic acid, and linoleic acid.
Agriculture 13 00620 g002
Figure 3. Average phenology of 350 safflower genotypes grown during 2017–2019. (a) Average height per plot (cm); (b) flowering period; (c) days to start of flowering; (d) days to physiological maturity; (e) grain yield per plot in grams and (f) 500 seed weight. Dots represent outlier values from the box and whisker plot analysis.
Agriculture 13 00620 g003
Figure 4. Crop height analysis between manually collected height measurements and UAV-derived height measurements for 2018 and 2019 combined data. Green dots represent individual genotypes in 2018 and 2019 seasons.
Agriculture 13 00620 g004
Figure 5. Average NDVI and EVI seasonal profiles for all 200 safflower genotypes from sowing until maturity for (a) 2018 and (b) 2019. NDVI profiles are a solid line; EVI profiles are a dashed lines.
Agriculture 13 00620 g005
Figure 6. Decay in average NDVI of all safflower genotypes from flowering to maturity. NDVI decay patterns separated by start of flowering classifications, blue-early flowering; orange-mid–early flowering; grey—mid–late flowering; yellow—late flowering, for all genotypes across all three years. Dotted lines illustrate linear trend lines with respective linear equations.
Agriculture 13 00620 g006
Figure 7. Crop yield prediction modelled using manual yield and digital predicated yield values for safflower genotypes based on yield data for three years.
Agriculture 13 00620 g007
Table 1. Summary of the temperature and rainfall patterns during the growing period. Temperatures experienced during the flowering period from first flowering observation to physiological maturity across each year. Rainfall of pre-sowing period (1st January to sowing) and growing period (sowing to harvest).
Temperature (°C)
MinimumAverageMaximum
2017
Mean11.821.229.7
Range0.2–22.110.0–32.418.8–44.4
2018
Mean 11.621.230.6
Range2.8–24.111.3–33.516.4–43.7
2019
Mean 10.020.129.7
Range1.8–23.011.3–32.416.3–46.7
Rainfall (mm)
Pre-SowingGrowth Period
2017144.5203.5
2018102.5198.4
2019113.2202.0
Table 2. Top yielding genotypes from each year with corresponding phenology. Heat map of phenological data compared to the rest of genotypes in each year. Red—earliest/lowest data points; dark green—latest/highest data points. DTFS, days to start of flowering from initial sowing date; DTFE, days to the end of flowering; DTM, days to physiological maturity; FP, flowering period from the start of flowering to the end of flowering; seed yield, yield per plot.
GenotypeDTFSDTFEDTMFPPlant Height (cm)Seed Yield (g)Capitulum Morphology
2017AVS-SAFF-615917920620136.672430.43Spined
AVS-SAFF-1116118220821123.932107.49Spineless
AVS-SAFF-5315717720420124.471987.62Spined
AVS-SAFF-11616218120819118.671952.60Spined
AVS-SAFF-11715818120722149.871980.21Spineless
AVS-SAFF-11816018020720131.471947.35Spined
AVS-SAFF-142 15717520518133.001967.18Spineless
AVS-SAFF-22915717620418135.402017.80Spined
AVS-SAFF-23215717520319146.332209.51Spineless
AVS-SAFF-26316218020718121.402144.79Spined
AVS-SAFF-265 15517520420123.531934.13Spineless
AVS-SAFF-269 16117820417111.732476.32Spined
AVS-SAFF-29916118020519138.332389.06Spineless
AVS-SAFF-31216117720616124.332012.51Spined
AVS-SAFF-32116018120821128.132028.79Spined
AVS-SAFF-32516118120620132.402055.95Spined
AVS-SAFF-335 16018020620118.202046.02Spined
AVS-SAFF-35716118220822135.671933.29Spined
AVS-SAFF-36415918020620128.001990.00Spined
AVS-SAFF-365 16818520817144.271979.89Spineless
2018AVS-SAFF-331561822012666.501048.57Spineless
AVS-SAFF-501581812002469.501151.53Spined
AVS-SAFF-731561822002665.001065.76Spined
AVS-SAFF-1181611852042467.001044.44Spined
AVS-SAFF-1291611852032475.501151.74Spineless
AVS-SAFF-1441651872092374.501100.34Spineless
AVS-SAFF-1501601842022472.501204.25Spineless
AVS-SAFF-1571621912233057.501078.83Spined
AVS-SAFF-162 1591832062465.501096.71Spined
AVS-SAFF-2181511801992956.501063.27Spined
AVS-SAFF-230 1591842012568.501038.84Spined
AVS-SAFF-2381661942152974.001062.23Spineless
AVS-SAFF-265 1581831982577.501041.90Spineless
AVS-SAFF-2951561811992557.501090.99Spined
AVS-SAFF-2961611852042482.501312.66Spineless
AVS-SAFF-2981601862032679.501073.10Spined
AVS-SAFF-335 1591852032662.001090.40Spined
AVS-SAFF-3501621942163371.001055.54Spined
AVS-SAFF-365 1711962152578.501145.36Spineless
AVS-SAFF-3681611862052681.501050.44Spined
Table 3. Correlation matrix between phenological traits for all genotypes across all three years. All traits except NDVI were collected manually. In the correlation matrix values are correlation coefficients (r); *** p < 0.001, ** p < 0.01, * p < 0.05; DTFS, days to flowering starting; DTFE, days to flowering ending; DTM, days to maturity and FP, flowering period.
DTFSDTFEDTMFPHeightYieldNDVI SlopeNDVI y–int
DTFS
DTFE0.843 ***
DTM0.839 ***0.830 ***
FP–0.558 ***–0.023–0.280 ***
Height0.800 ***0.617 ***0.736 ***–0.535 ***
Yield–0.197 ***–0.049–0.083 *0.290 ***–0.087 *
NDVI Slope–0.310 ***–0.311 ***–0.254 ***0.100 **–0.358 ***–0.318 ***
NDVI y–int0.308 ***0.357 ***0.263 ***–0.0260.281 ***0.356 ***–0.944 ***
Table 4. Summary of oil characteristics for 350 safflower genotypes grown during 2017–2019. Oil content (%) and percentage of oil composition containing oleic (%) and linoleic (%) acids. Based on oleic and linoleic ratios, genotypes were charactered into three groups: high linoleic, intermediate linoleic, and high oleic.
Seed Yield (g)Oil Characteristics
nOil Content (%)Oleic (%)Linoleic (%)
MeanRangeMeanRangeMeanRange
2017
High linoleic1271.7333130.4324.47–41.0712.887.57 – 21.7577.7368.20–83.10
Intermediate oleic886.201130.6924.10–37.1338.0526.33–51.7552.2239.65–64.20
High oleic1036.84837.4135.30–40.6767.0059.93–74.5024.1317.00–32.67
2018
High linoleic672.3333129.4423.10–37.6014.7111.00–23.3075.1667.40–78.85
Intermediate oleic526.881130.1324.15–34.1541.3030.00–54.8549.1535.55–60.85
High oleic457.71835.3834.60–36.5559.9856.65–70.2030.9420.60–34.20
2019
High linoleic564.9233127.220.60–30.7516.110.90–23.6073.064.60–78.65
Intermediate oleic564.131328.7723.05–33.7040.4126.75–54.2549.0735.50–60.80
High oleic435.73631.1429.65–33.5059.1955.60–64.8030.8425.25–34.55
Disclaimer/Publisher’s Note: The statements, opinions and data contained in all publications are solely those of the individual author(s) and contributor(s) and not of MDPI and/or the editor(s). MDPI and/or the editor(s) disclaim responsibility for any injury to people or property resulting from any ideas, methods, instructions or products referred to in the content.

