Article

Development and Evaluation of a Deep Learning Based System to Predict District-Level Maize Yields in Tanzania

1
Department of Computer Studies, Dar es Salaam Institute of Technology, Dar es Salaam P.O. Box 2958, Tanzania
2
Faculty of Engineering, University of Miyazaki, Miyazaki 889-2192, Japan
*
Author to whom correspondence should be addressed.
Agriculture 2023, 13(3), 627; https://doi.org/10.3390/agriculture13030627
Submission received: 14 September 2022 / Revised: 20 February 2023 / Accepted: 2 March 2023 / Published: 6 March 2023
(This article belongs to the Special Issue Digital Innovations in Agriculture)

Abstract

:
Prediction of crop yields is very helpful in ensuring food security, planning harvest management (storage, transport, and labor), and performing market planning. However, in Tanzania, where a majority of the population depends on crop farming as a primary economic activity, the digital tools for predicting crop yields are not yet available, especially at the grass-roots level. In this study, we developed and evaluated Maize Yield Prediction System (MYPS) that uses a short message service (SMS) and the Web to allow rural farmers (via SMS on mobile phones) and government officials (via Web browsers) to predict district-level end-of-season maize yields in Tanzania. The system uses LSTM (Long Short-Term Memory) deep learning models to forecast district-level season-end maize yields from remote sensing data (NDVI on the Terra MODIS satellite) and climate data [maximum temperature, minimum temperature, soil moisture, and precipitation (rainfall)]. The key findings reveal that our unimodal and bimodal deep learning models are very effective in predicting crop yields, achieving mean absolute percentage error (MAPE) scores of 3.656% and 6.648%, respectively, on test (unseen) data. This system will help rural farmers and the government in Tanzania make critical decisions to prevent hunger and plan better harvesting and marketing of crops.

1. Introduction

In Tanzania, majority of the work force are engaged in agricultural activities [1]. The majority of these Tanzanians are rural small-scale farmers who depend on crop farming as their primary source of income [2,3], with maize (corn) being the most cultivated food crop [4]. Because majority of Tanzanians economically depend on agriculture, prediction of crop yields is of great importance, as it can help the central government to ensure food security and prevent hunger (for example, by importing food from abroad when low yields are predicted), while the rural farmers, farmer cooperative union officers, and local governments can plan better harvest management (storage, transport, and labor) and marketing of crops. However, digital tools for predicting crop yields are not yet available, especially at the grass-roots level in Tanzania (e.g., at the district level among rural farmers, farmer cooperative union officers, and local governments), making it hard to plan food assurance, harvesting, and marketing of crops. To address this issue, digital tools to predict crop yields at the grass-roots level in Tanzania are needed.
Machine learning is known to be effective for regression and classification problems, and it has been used in several studies to predict crop yields. For instance, Chen et al. [5] used a convolutional neural network (CNN) deep learning model based on faster region to predict the strawberry yield in the United States by using high-resolution aerial orthoimages, Fernandez-Beltran et al. [6] used a 3D CNN model to predict the rice yield in Nepal using Sentinel-2 satellite images, and Danilevicz et al. [7] used a CNN model to predict the maize yield using multispectral images, Wang et al. [8] used DNN (Deep Neural Network) and other machine learning models such as SVM (Support Vector Machine), RF (Random Forest) and AdaBoost (Adaptive Boosting) to forecast winter wheat yield at county level by using climatic data, satellite images, and soil maps data) in the Conterminous United States (CONUS), and Wang et al. [9] proposed an algorithm based on decision tree which integrates topographical data and phenology characteristics of rice to map rice field patches in Chongqing, China. In addition, several studies have used RNN (recurrent neural network) models, including LSTM (Long Short-Term Memory) [10] and GRU (gated recurrent units) deep learning models to predict crop yields such as Alibabaei et al. [11] who proposed LSTM and GRU deep learning models to forecast potato and tomato yields using irrigation scheduling data and climatic data in Portugal, Haider et al. [12] who proposed an LSTM deep learning model to forecast wheat production in Pakistan using time-series wheat production data, Cho et al. [13] who proposed LSTM model which uses attention mechanism to forecast tomato yields in South Korea using time-series environmental variables, and Zhang et al. [14] who proposed an LSTM model to predict maize yields at county level in China using environmental data, optical data, fluorescence data, and thermal satellite image data. In contrast, several studies have used models that combine both CNNs and RNNs to predict crop yields by combining input data temporal features and spatial features such as Nevavuori et al. [15] who proposed CNN-LSTM and convolutional LSTM deep learning models to predict yields of oats, barley, and wheat in Finland by using weather and aerial drone images and Sun et al. [16] who proposed a deep CNN-LSTM model by using remote sensing and weather data.
Although the results from these studies reveal that deep learning is very effective for predicting crop yields, two issues make the deep learning models developed by these studies ineffective in Tanzania. First, most of these studies stop after developing the deep learning models and did not develop easy-to-use information systems, making them difficult to use for common people, such as rural farmers and farmer cooperative union officers in Tanzania. Second, although several studies [14,15,16] showed that using deep learning models to predict yields by combining remote sensing and climate data can lead to high accuracy in yield prediction, an information gap remains on the performance of deep learning models that use that data combination to predict crop yields at the grass-roots level, especially in developing African countries like Tanzania, which is heavily rain-dependent and has two unique crop seasons depending on which rainfall modality the district belongs to, namely districts with unimodal (one) rain season or districts with bimodal (two) rain seasons.
To address these issues, this study had three objectives. The first objective was to develop two deep learning models (unimodal deep learning model for unimodal districts and bimodal deep learning model for bimodal rainfall districts) that use Tanzania district time-series remote sensing data (NDVI (Normalized Difference Vegetation Index)) and climate data [maximum temperature, minimum temperature, soil moisture, and precipitation (rainfall)] to predict end-of-season district-level maize yields. The second objective was to develop Maize Yield Prediction System (MYPS) based on the developed deep learning models that uses the short message service (SMS) of mobile phones (a viable medium because 86% of Tanzanians have mobile cellular subscriptions [17]) and a Web system to allow rural farmers, farmer cooperative union officers, and government officers in Tanzania to predict end-of-season district-level maize yields. The third objective was to evaluate the performance of the developed deep learning models in predicting end-of-season district-level maize yields and hence filling the existing information gap. As far as we know, no previous work has attempted to predict district-level end-of-season maize yields in Tanzania by using deep learning and the combination of NDVI, maximum temperature, minimum temperature, soil moisture, and precipitation data.
Due to the current COVID-19 pandemic, it was not possible to travel to Tanzania and deliver MYPS to farmers for testing and collecting system improvement feedback. Due to this reason, the scope of this work was limited to just developing deep learning system prototype that allows users in Tanzania to predict district-level maize yields and evaluating its performance in predicting the correct yields. This study aimed to provide answers to the following research questions. First question, what deep learning model designs can accurately predict district-level maize yields in Tanzania? Second question, to what extent are the developed deep learning models accurate in predicting district-level maize yields in Tanzania? Third question, what design of the system can be used to automatically process and give response to queries in Swahili (the national language of Tanzania) for maize yield prediction via SMS and the Web?

2. Materials and Methods

2.1. Collection of Data

It is important to indicate that the first author (I.G.T.) is of Tanzanian nationality. Functional and non functional requirements as well as information needs from rural farmers and government officers in the ward of Kyimo, Rungwe district, Mbeya region, Tanzania, were collected before system development started. Mbeya region was selected as a case study area because it is one of the leading regions in cultivating maize in Tanzania. Structured questionnaire guide was prepared by the first author in Swahili language in order to collect data from rural farmers and farmer cooperative union officers. Prepared questionnaire guide consisted of questions for collecting respondents’ primary data such as personal information (e.g., age and gender), functional and non functional requirements, as well as information needs. Due to the COVID-19 pandemic, it was not possible to travel to Tanzania. Due to this reason, we asked one research assistant to conduct a survey in the households with 30 maize farmers and 5 farmer cooperative union officers in the ward of Kyimo, who were purposively selected. Functional and non functional requirements as well as information needs of government officers (ministry and district officers) were not collected, instead, we adopted user requirements we previously collected from government officers in our previous study [18]. We obtained research permits from the local government of Kyimo ward. The research assistant was given an allowance of 50 US dollars to facilitate his transportation. The research assistant conducted the survey for two weeks from 6 June 2022 to 20 June 2022. Afterwards, finishing the data collection activity in Tanzania, we analyzed the collected respondents’ information needs and user requirements by using statistical tools like cross-tabulation.

2.2. Requirements Analysis

The key information need from respondents was the prediction of end-of-season maize yield at the district level. User requirements (system features) collected from survey respondents include ability to access the system via text SMS (requested by farmers) and via a Web system (assumed for district and ministry officers based on requirements collected in our previous study [18]), system availability, system security and a very short response time.
We made several key design decisions in order to meet requirements of users. For example, to allow farmers and farmer cooperative union officers to predict maize yields via SMS, we designed a function for requesting yield prediction via SMS queries which are based on keyword and which restrict users to use a certain format to write SMS queries by typing first a keyword and then two single words which are separated by single spaces for representing the district and maize season for which they are requesting the yield. To meet the need to predict yields, we included LSTM-based deep learning models. The LSTM deep learning models were trained and tested with Tanzania district time-series data (NDVI, maximum temperature, minimum temperature, soil moisture, and precipitation) together with historical district maize yields to train the network to correctly predict end-of-season maize yields. The LSTM network was chosen because of its high ability to process sequential time-series data [19,20,21] and its high performance in predicting other crop yields [11,12,13,14].
We used UML (Unified Modeling Language) diagrams were used for analyzing the requirements from users. The use case diagram shown in Figure 1 shows functions of different users of the system. For instance, the role of the district officer is to prepare remote sensing and climate data for his/her district in a particular crop season in comma-separated values (CSV) format in Microsoft Excel and upload that data into the system’s SQL database, which can then be used to forecast the end-of-season maize yield by the deep learning models for that particular district and crop season, after which farmers, farmer cooperative union officers, ministry officers, and district officers themselves can request prediction of the end-of-season district maize yield and use the predicted yield results to make informed decisions on planning food assurance, harvest management, and maize marketing.
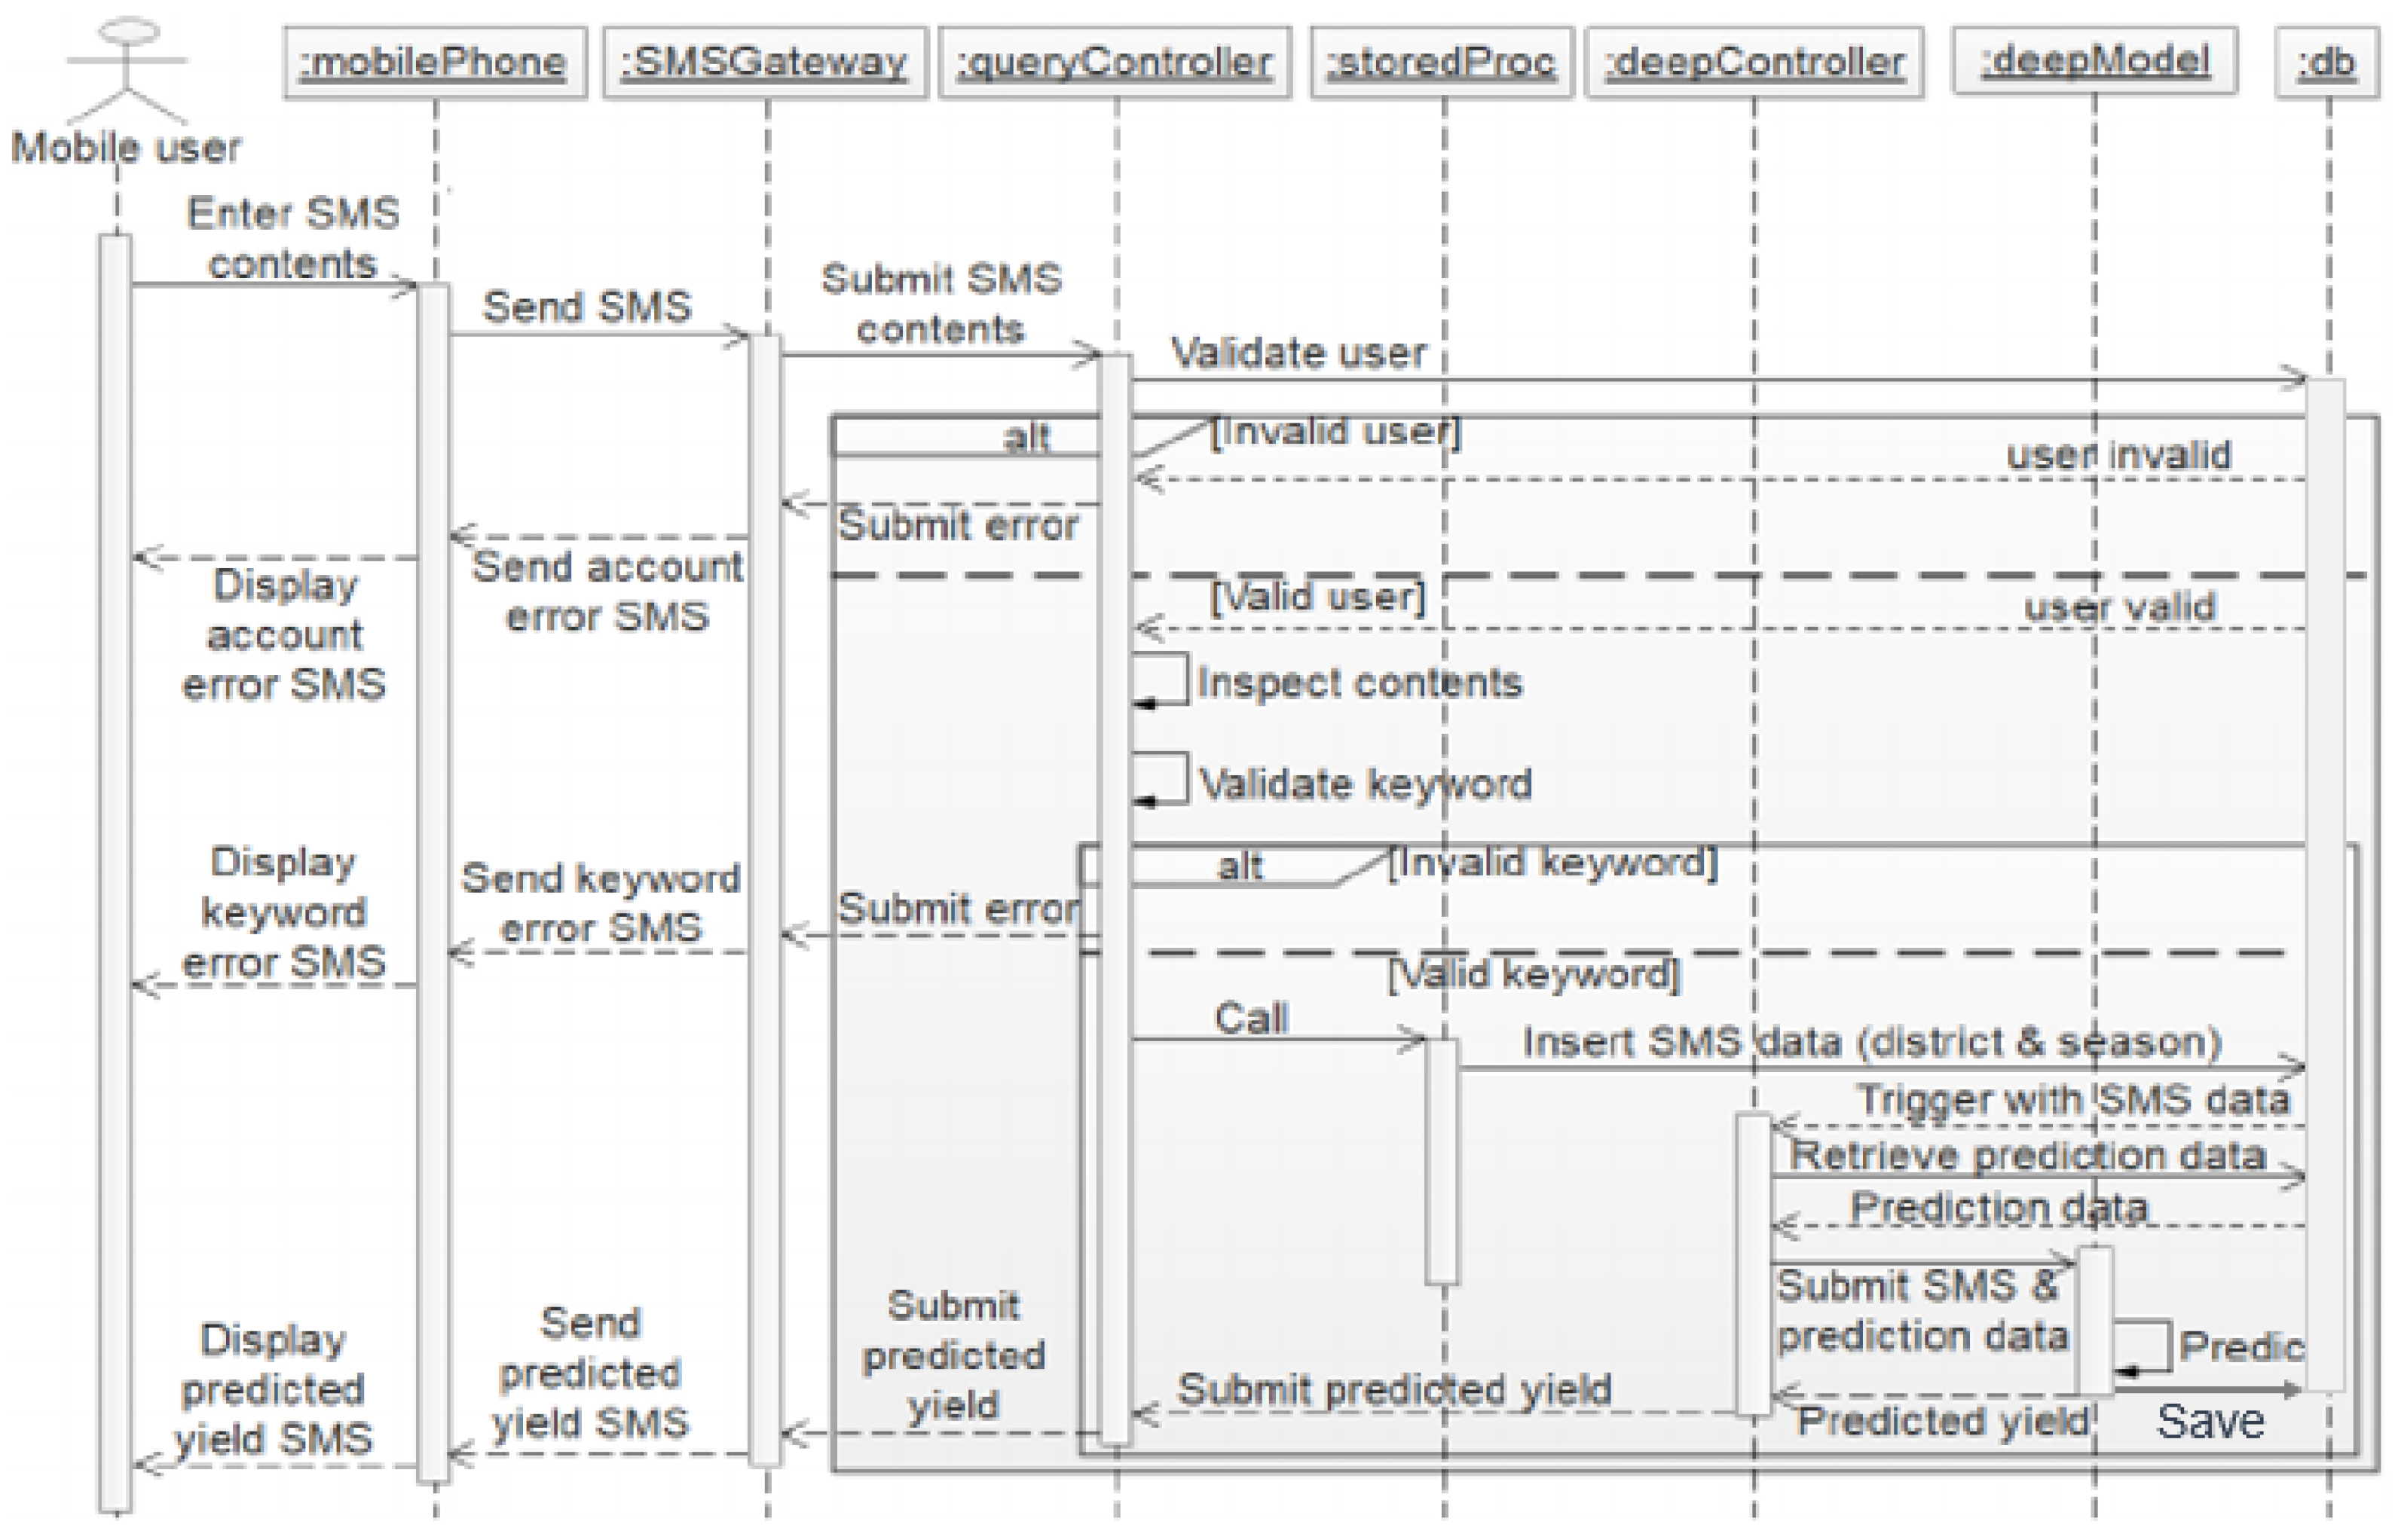
The sequence diagram in Figure 2 shows the steps of how a mobile user (farmer or cooperative union officer) uses SMS to request an end-of-season maize yield prediction from the system. First, the registered user must compose an SMS query with a keyword, district name, and crop season separated by single spaces and then send the SMS to the system’s phone number. After the SMS gateway receives the SMS from a registered user, extraction and inspection of the SMS content is done by a query controller. It is important to note that each SMS query has to start with the keyword which is the first word in the SMS in order to activate the different functions of the system. For instance, the keyword used when a farmer signs up to the system is different from the keyword used when the farmer requests a yield prediction. For instance, to request the end-of-season maize yield prediction for Liwale district and the 2021/2022 crop season, the mobile user would compose the following SMS: "TABIRIMAVUNO Liwale 20212022" and send the SMS to the system’s phone number. After extracting SMS content, comparison between the SMS keyword and stored keywords in the system is done by the query controller. If a match is found between the two keywords, then SQL stored procedure for that particular keyword is executed by the query controller to insert SMS data (district and crop season) into a database prediction requests table. Whenever it receives new values, the prediction requests table immediately activates a trigger to call the deep learning controller with SMS data as parameters. The deep learning controller retrieves the rain modality of the district in the SMS data from the database, as well as the prediction data [maximum temperature, minimum temperature, soil moisture, precipitation (rainfall), and NDVI] for the district and crop season in the SMS query. The deep learning controller then calls either the unimodal or bimodal pretrained deep learning model with prediction data as parameters to request a maize yield prediction. The already trained (pretrained) deep learning model predicts the maize yield based on the received parameters (prediction data). It is important to note that, the deep learning model is only trained once, and it does not need retraining every time a new prediction request is sent by users. If there is no match between the two keywords, a message of keyword error is retrieved from the SQL database. Finally, the predicted result is saved into the database (for future reference when prediction for the same district and crop season is requested) and an SMS is sent back to the user to provide the predicted maize yield or an error message.

2.3. Tanzania Districts and Crop Seasons

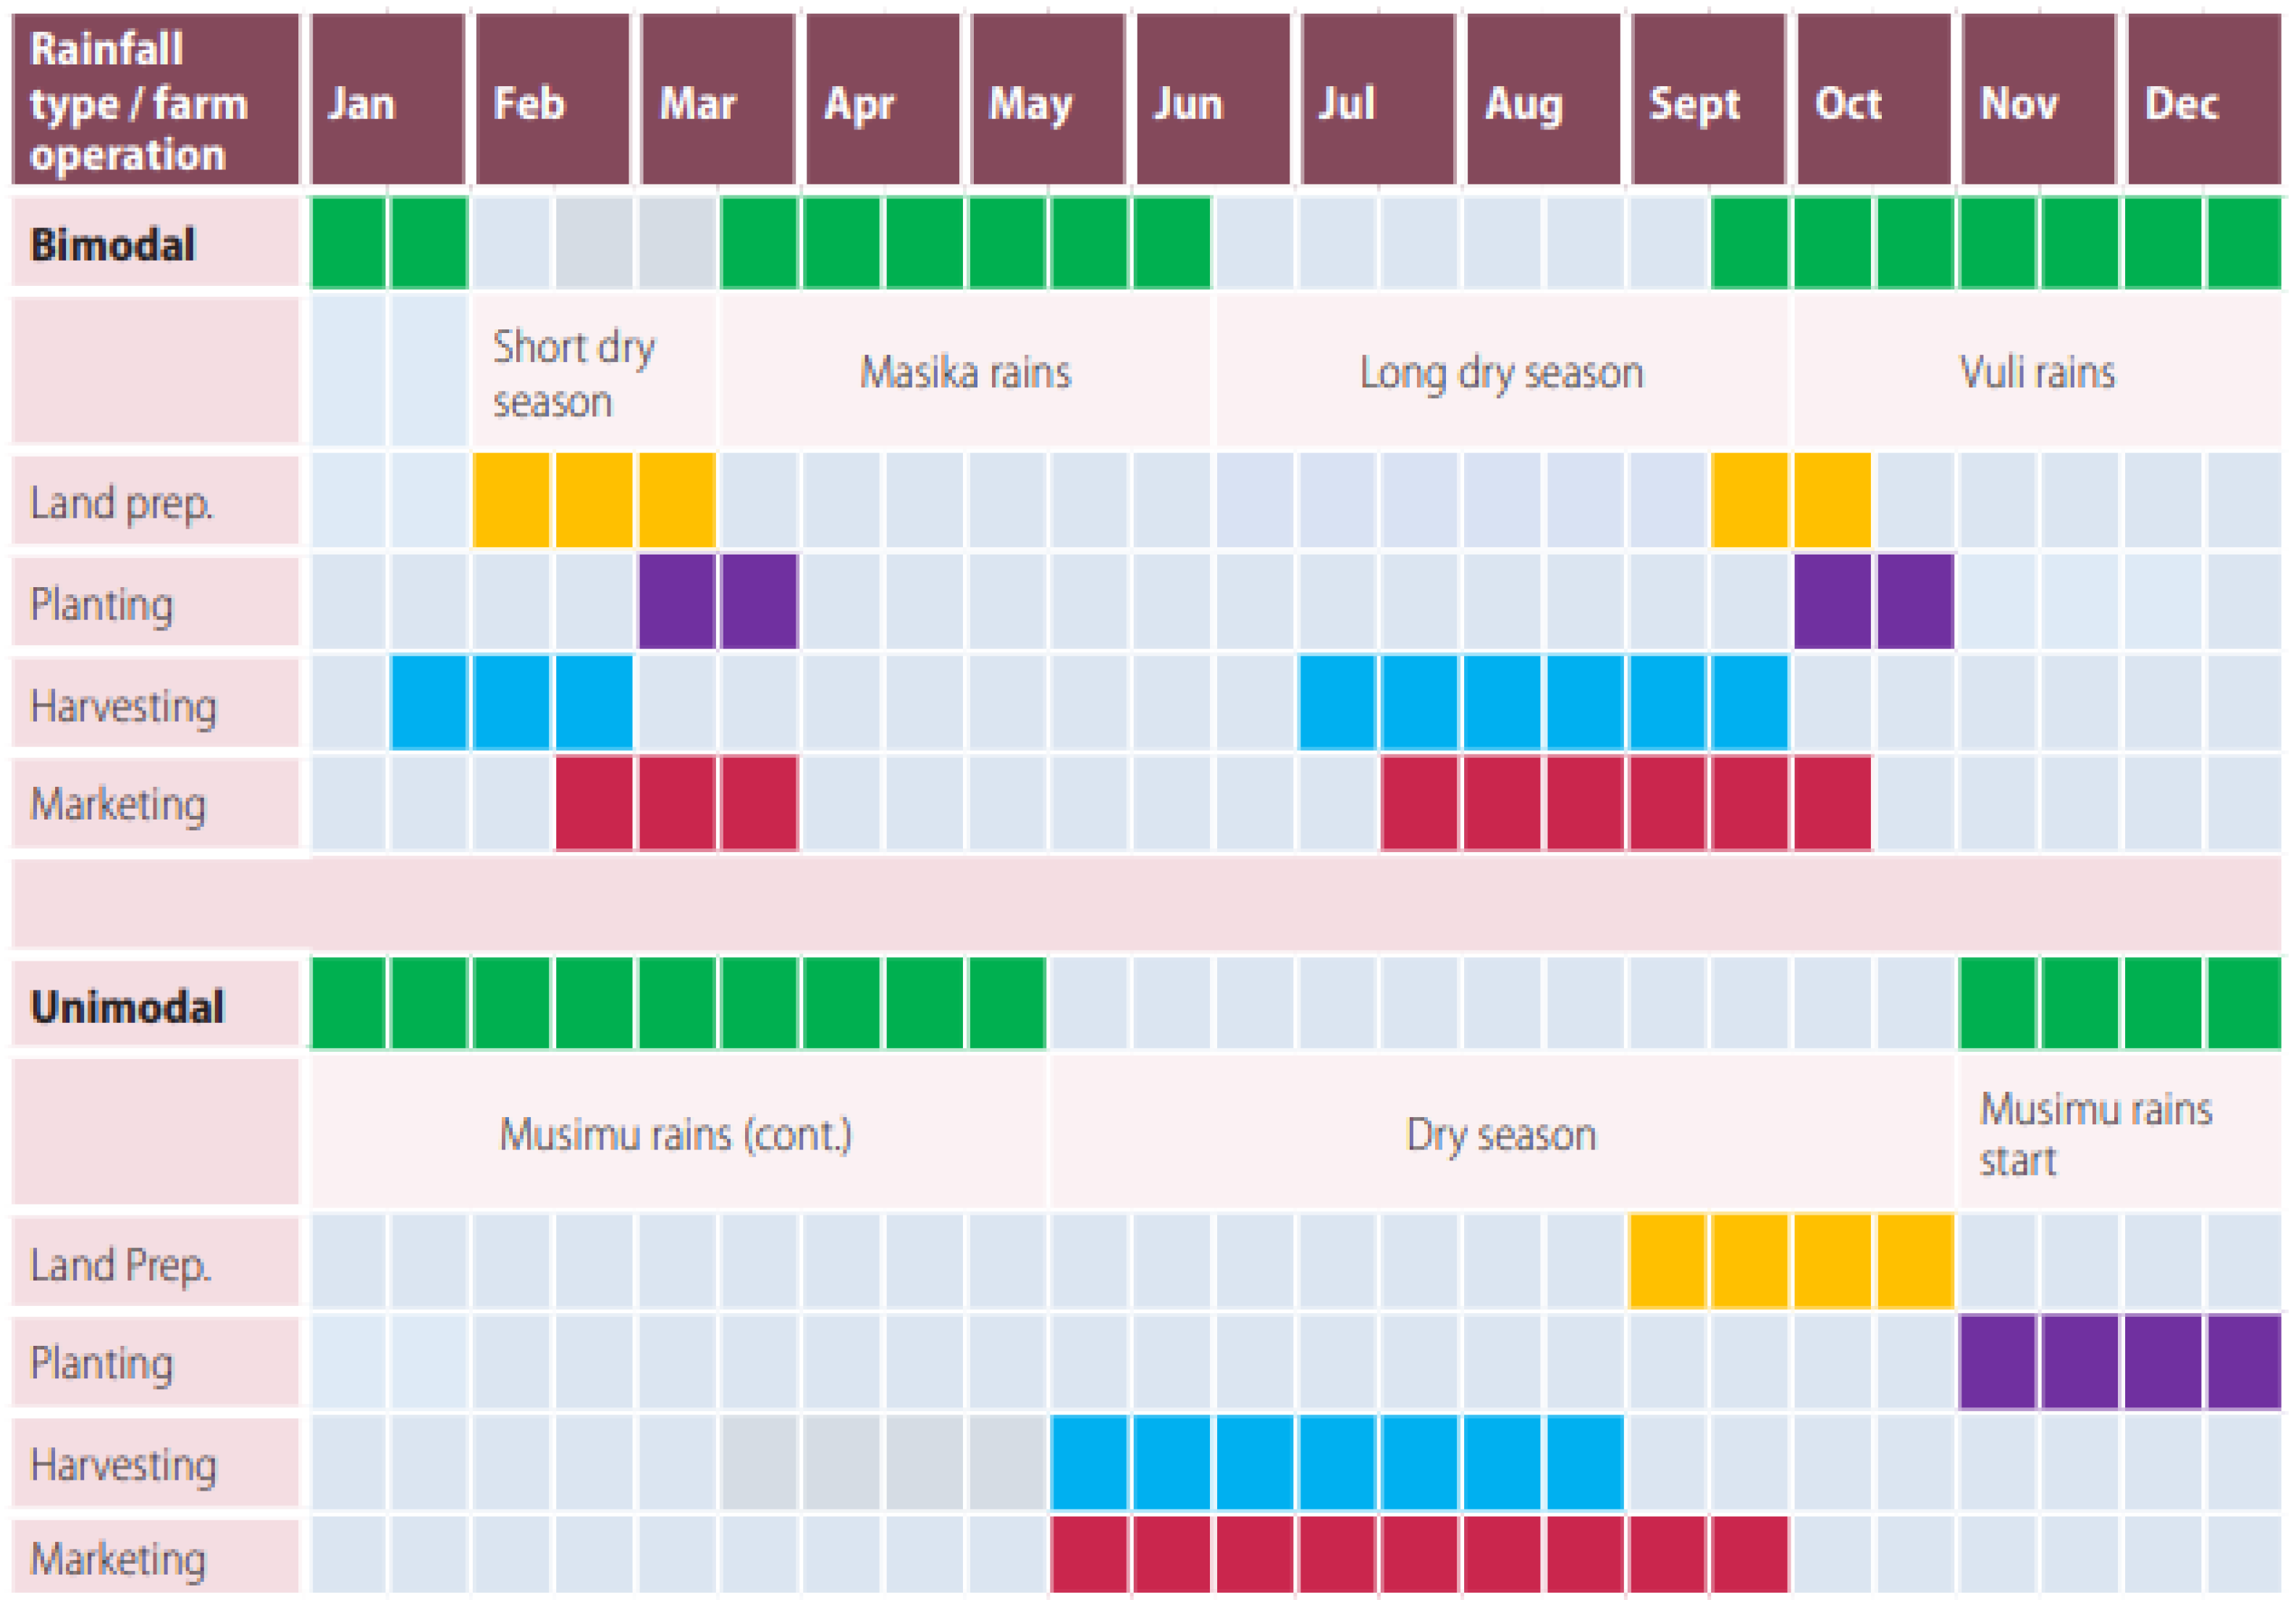
Tanzania is a country located in East Africa and is subdivided into regions at the first administrative level and into districts at the second administrative level. In Tanzania, maize cultivation depends on rainfall, and also the calendar of maize cultivation is different from district to district based on the rainfall modality of the district [22]. The districts in the northern, eastern and western highlands receive bimodal rainfall (two rainy seasons per year) while the remaining districts in the central and southern regions receive unimodal rainfall (one rainy season per year) [22,23]. Phenology of maize crop in Tanzania is shown through the maize cultivation calendar in Figure 3. Table 1 shows Tanzania mainland districts whose data were used in this study to train and test the deep learning models. A previous study [23] was used as guidance for determine each district’s rainfall modality. Note that some regions and districts were not involved in this study due to missing historical district maize yield data, which are required to train the deep learning models. For unimodal districts, we used data (NDVI, maximum temperature, minimum temperature, soil moisture, and precipitation) from the beginning of rainy season (November) to the end of rainy season (May) to train and test the unimodal deep learning model. For bimodal districts, we used the data of both rainy seasons (start and end of each, from September to January and from March to June) to train and test the bimodal deep learning model. Figure 4 shows map of the study area (the districts of Tanzania).

2.4. Software Development Process

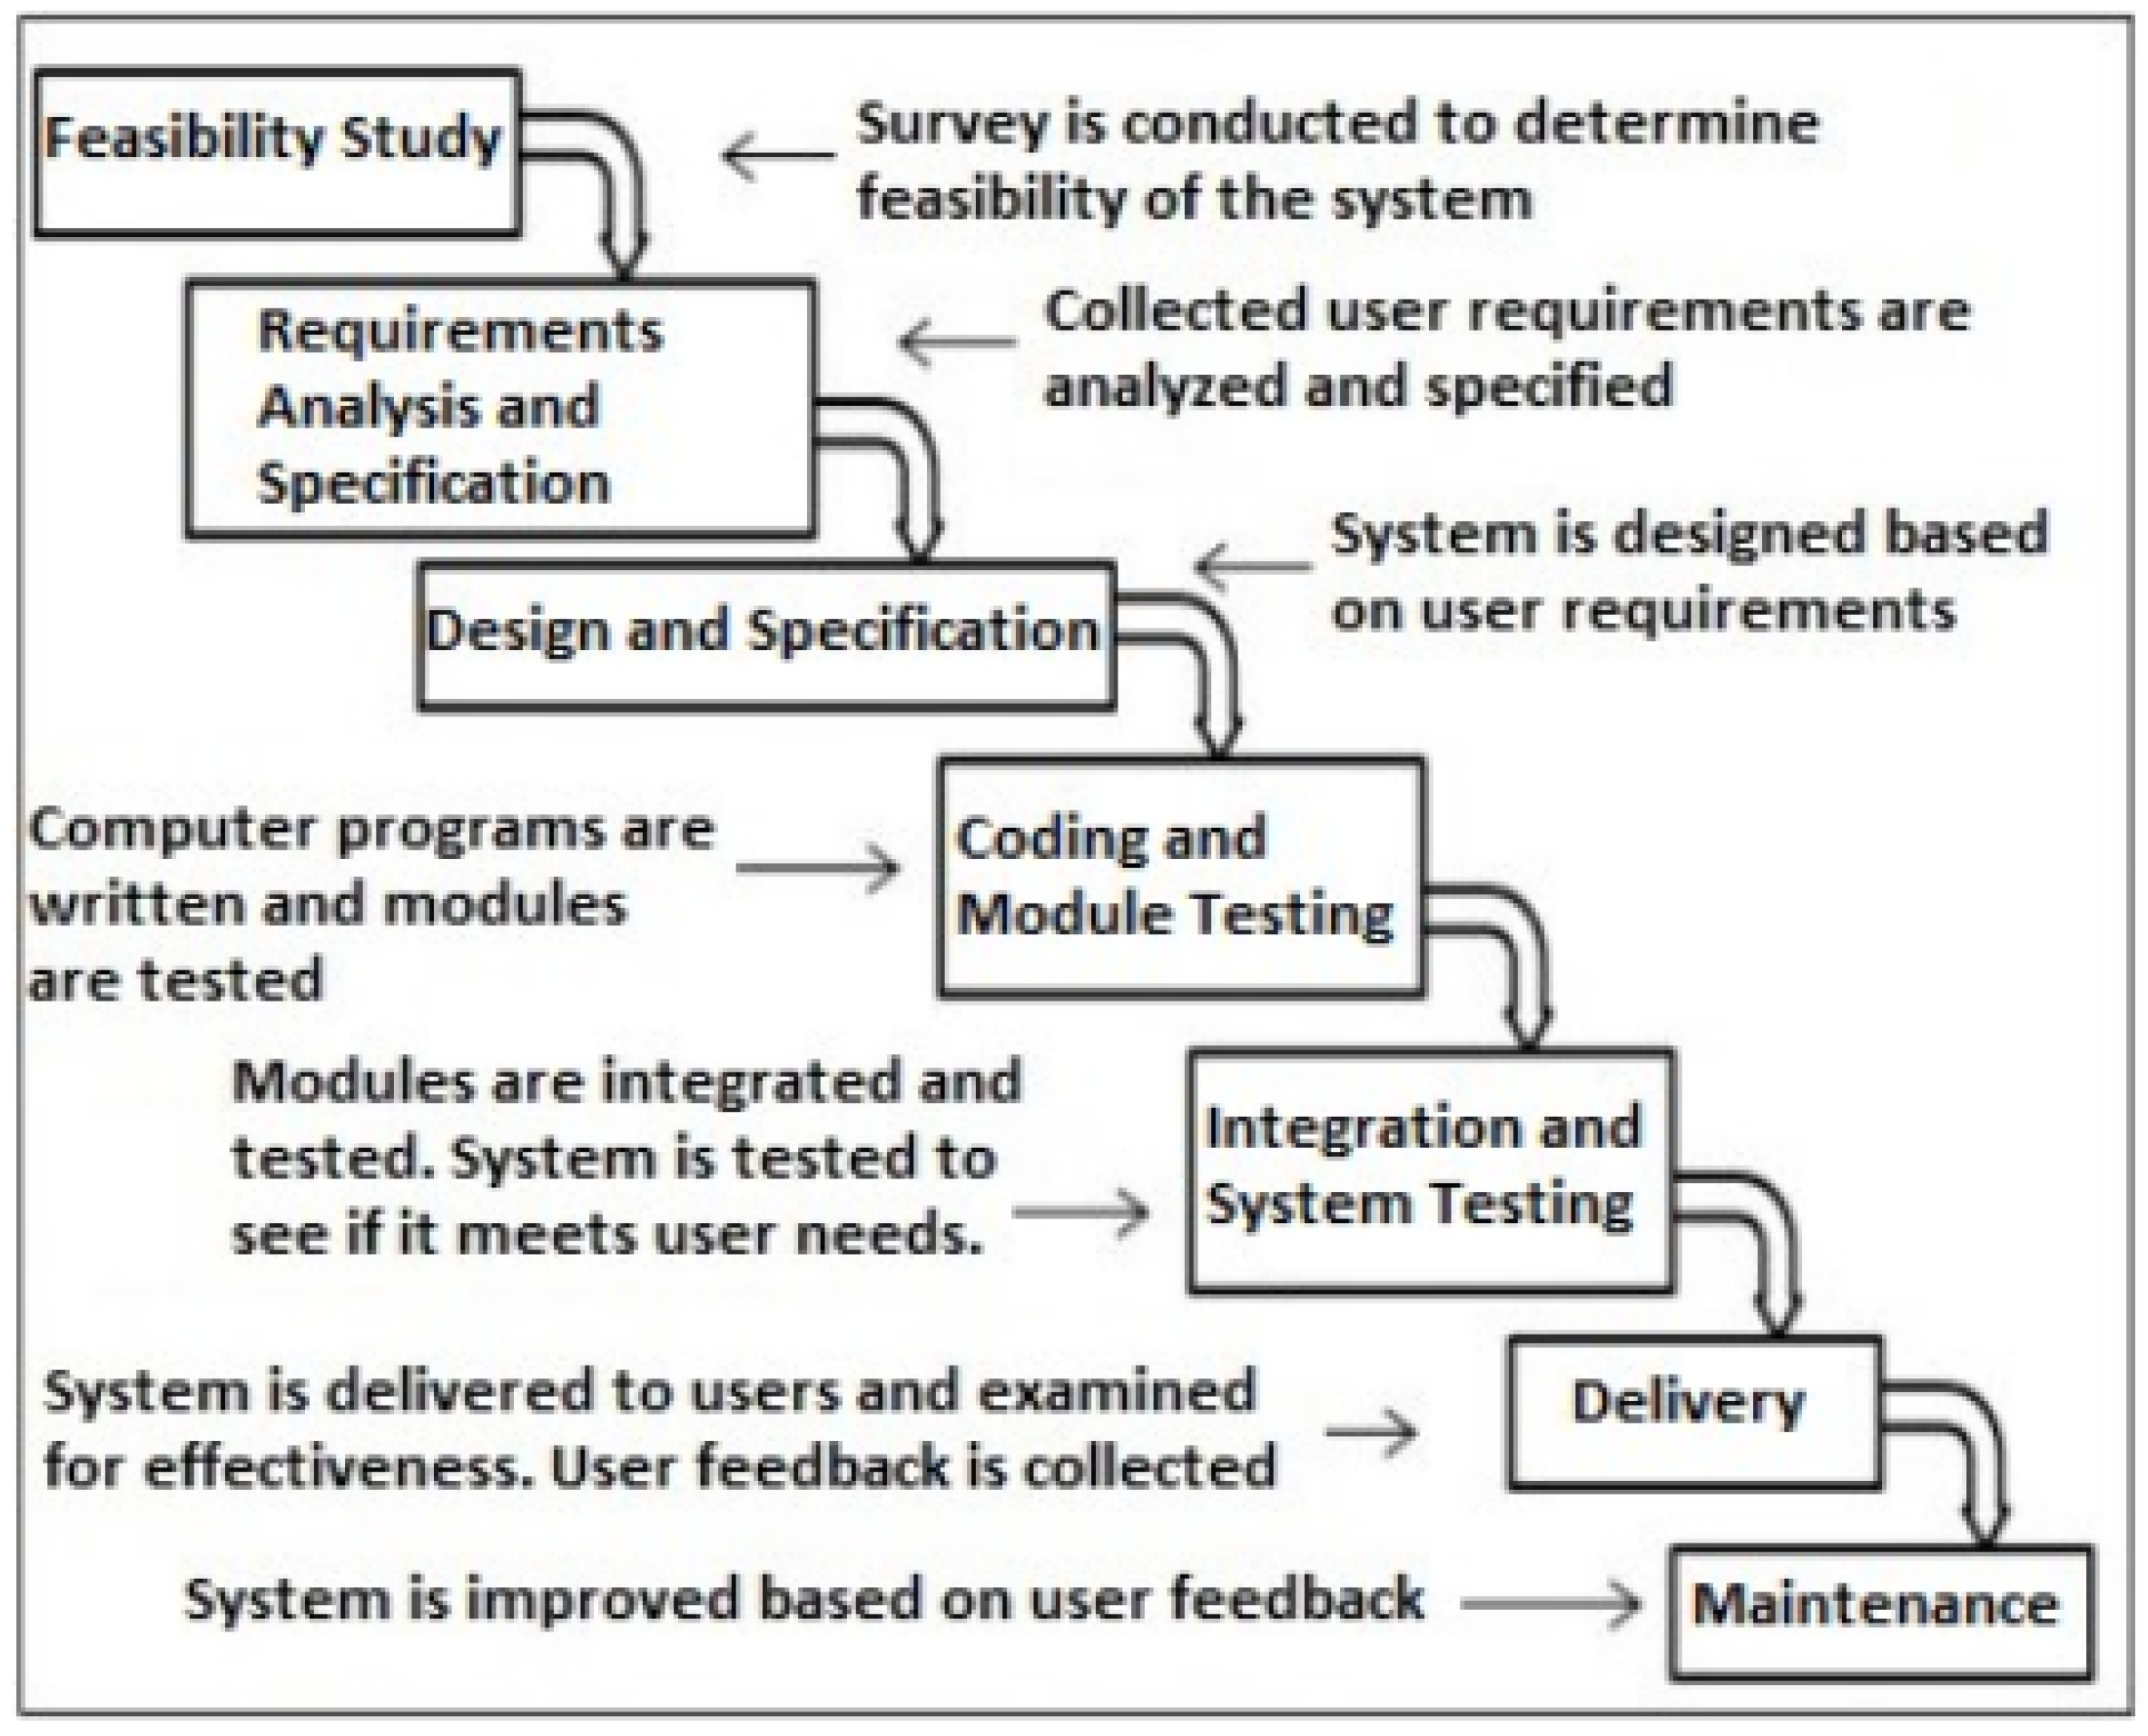
MYPS was developed by using Waterfall software development model as shown in Figure 5. First, feasibility study through survey was conducted to determine feasibility of the proposed system and collect information needs and user requirements, then the user requirements were analyzed and specified. Next, the system was designed based on user requirements. Next, computer programs were written and individul modules were tested. Afterwards integration testing of the modules was conducted and the whole system was tested. In future the system will be delivered to Tanzanian farmers and maintained to improve it based on users feedback and correct any errors.

2.5. Deep Learning Data

2.5.1. Terra MODIS Satellite NDVI

NDVI [shown in Equation (1)] is an important vegetation index and is normally used to indicate the health of vegetation [24]. NDVI is computed from the red (visible) and NIR (near-infrared) lights which are reflected by vegetation and captured by satellite images in spectral bands. Normally, healthy vegetation (high NDVI value) has ability to absorb large amount of the red light, and has ability to reflect a large amount of the near-infrared light, while, in contrast, vegetation which is unhealthy (low NDVI value) has ability to reflect larger amount of red light and less amount of near-infrared light. In this study, the NDVI data were used to indicate the health of maize grown in Tanzania districts. The 8-day (collected every eight days) time series (from 2002 to 2010) mean (average) unsmoothed NDVI from NASA (National Aeronautics and Space Administration) Terra MODIS (Moderate Resolution Imaging Spectroradiometer) satellite [25] for each individual district in Table 1 were downloaded from the NASA GIMMS Global Agricultural Monitoring application [26] in CSV format. IFPRI SPAM 2010 v1 maize crop masks for Tanzania districts were used to ensure that the NDVI data came from district areas that grow only maize. IFPRI SPAM 2010 v1 crop masks are part of the NASA GIMMS Global Agricultural Monitoring application. Monthly NDVI values for each district were computed by averaging the 8-day NDVI values. We downloaded and processed NDVI data for every district involved in this study in the month of April 2022.
N D V I = N I R r e d N I R + r e d .

2.5.2. Climate Data

Time-series (from 2002 to 2010) monthly mean (average) climate data [maximum temperature, minimum temperature, soil moisture, and precipitation (rainfall)] for each district in Table 1 were downloaded in CSV format from the TerraClimate-Monthly dataset [27] in the Google Earth Engine (GEE) [28] through the ClimateEngine research application [29]. ClimateEngine offers easy-to-use interfaces to download time series data from the GEE in CSV format instead of directly interacting with the GEE through computer programs. Global Administrative Unit Layers (GAUL) Administration 2 [30] (which are part of ClimateEngine) were used to download climate data individually for each district in Tanzania. We downloaded and processed climate data for two months (May and June 2022) for every district involved in this study.

2.5.3. Historical Maize Yield Data

Historical maize yield data for the 2002/2003, 2003/2004, 2004/2005, 2005/2006, 2006/2007, 2007/2008, 2008/2009, and 2009/2010 maize seasons for all involved districts (in PDF or Microsoft Excel format) were downloaded from the website of the Tanzania Ministry of Agriculture [31]. Because almost all districts showed no strong trend in maize yields (increasing or decreasing) over a period of 8 years (from 2002/2003 to 2009/2010), we decided not to perform any detrending for district maize yields.

2.5.4. Input Data

To train the deep learning models, input data (NDVI, maximum temperature, minimum temperature, soil moisture, and precipitation) features were combined to form time-series input data points. Each data point has several timesteps of input data (seven data timesteps for a unimodal district representing 7 months of a unimodal maize season or nine data timesteps for a bimodal district representing 9 months of a bimodal maize season). Each data point was labeled with one numerical value to represent the maize yield at the end of that season. Each district had eight data points representing each season from 2002/2003 to 2009/2010, with data points from the 2002/2003 to 2008/2009 seasons used for training the deep learning models and data points from the 2009/2010 season used for testing the deep learning models on their effectiveness to correctly predict maize yields using data they had never seen before.
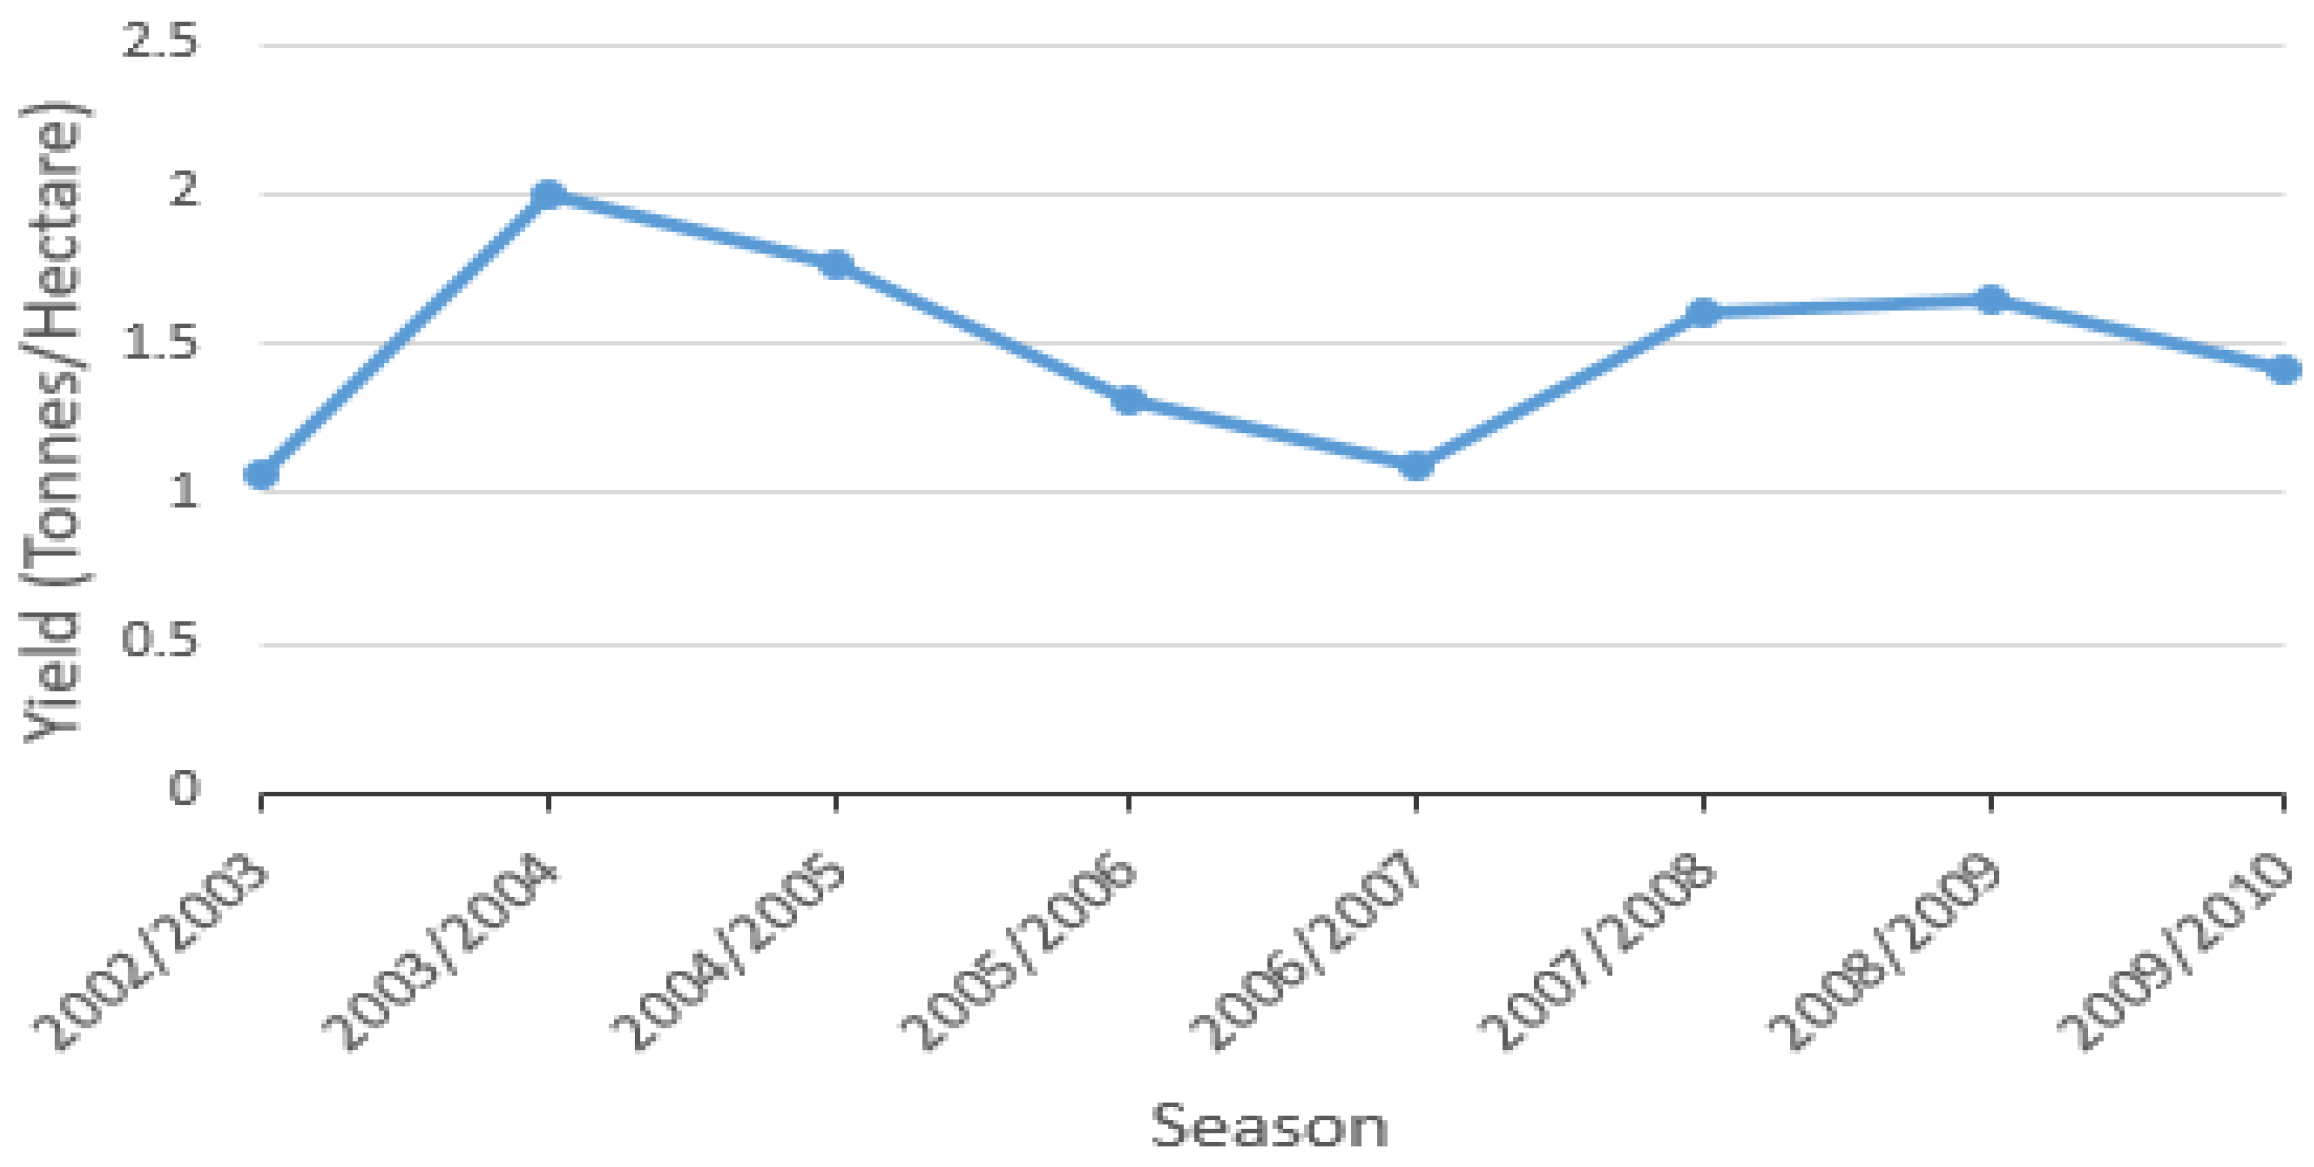
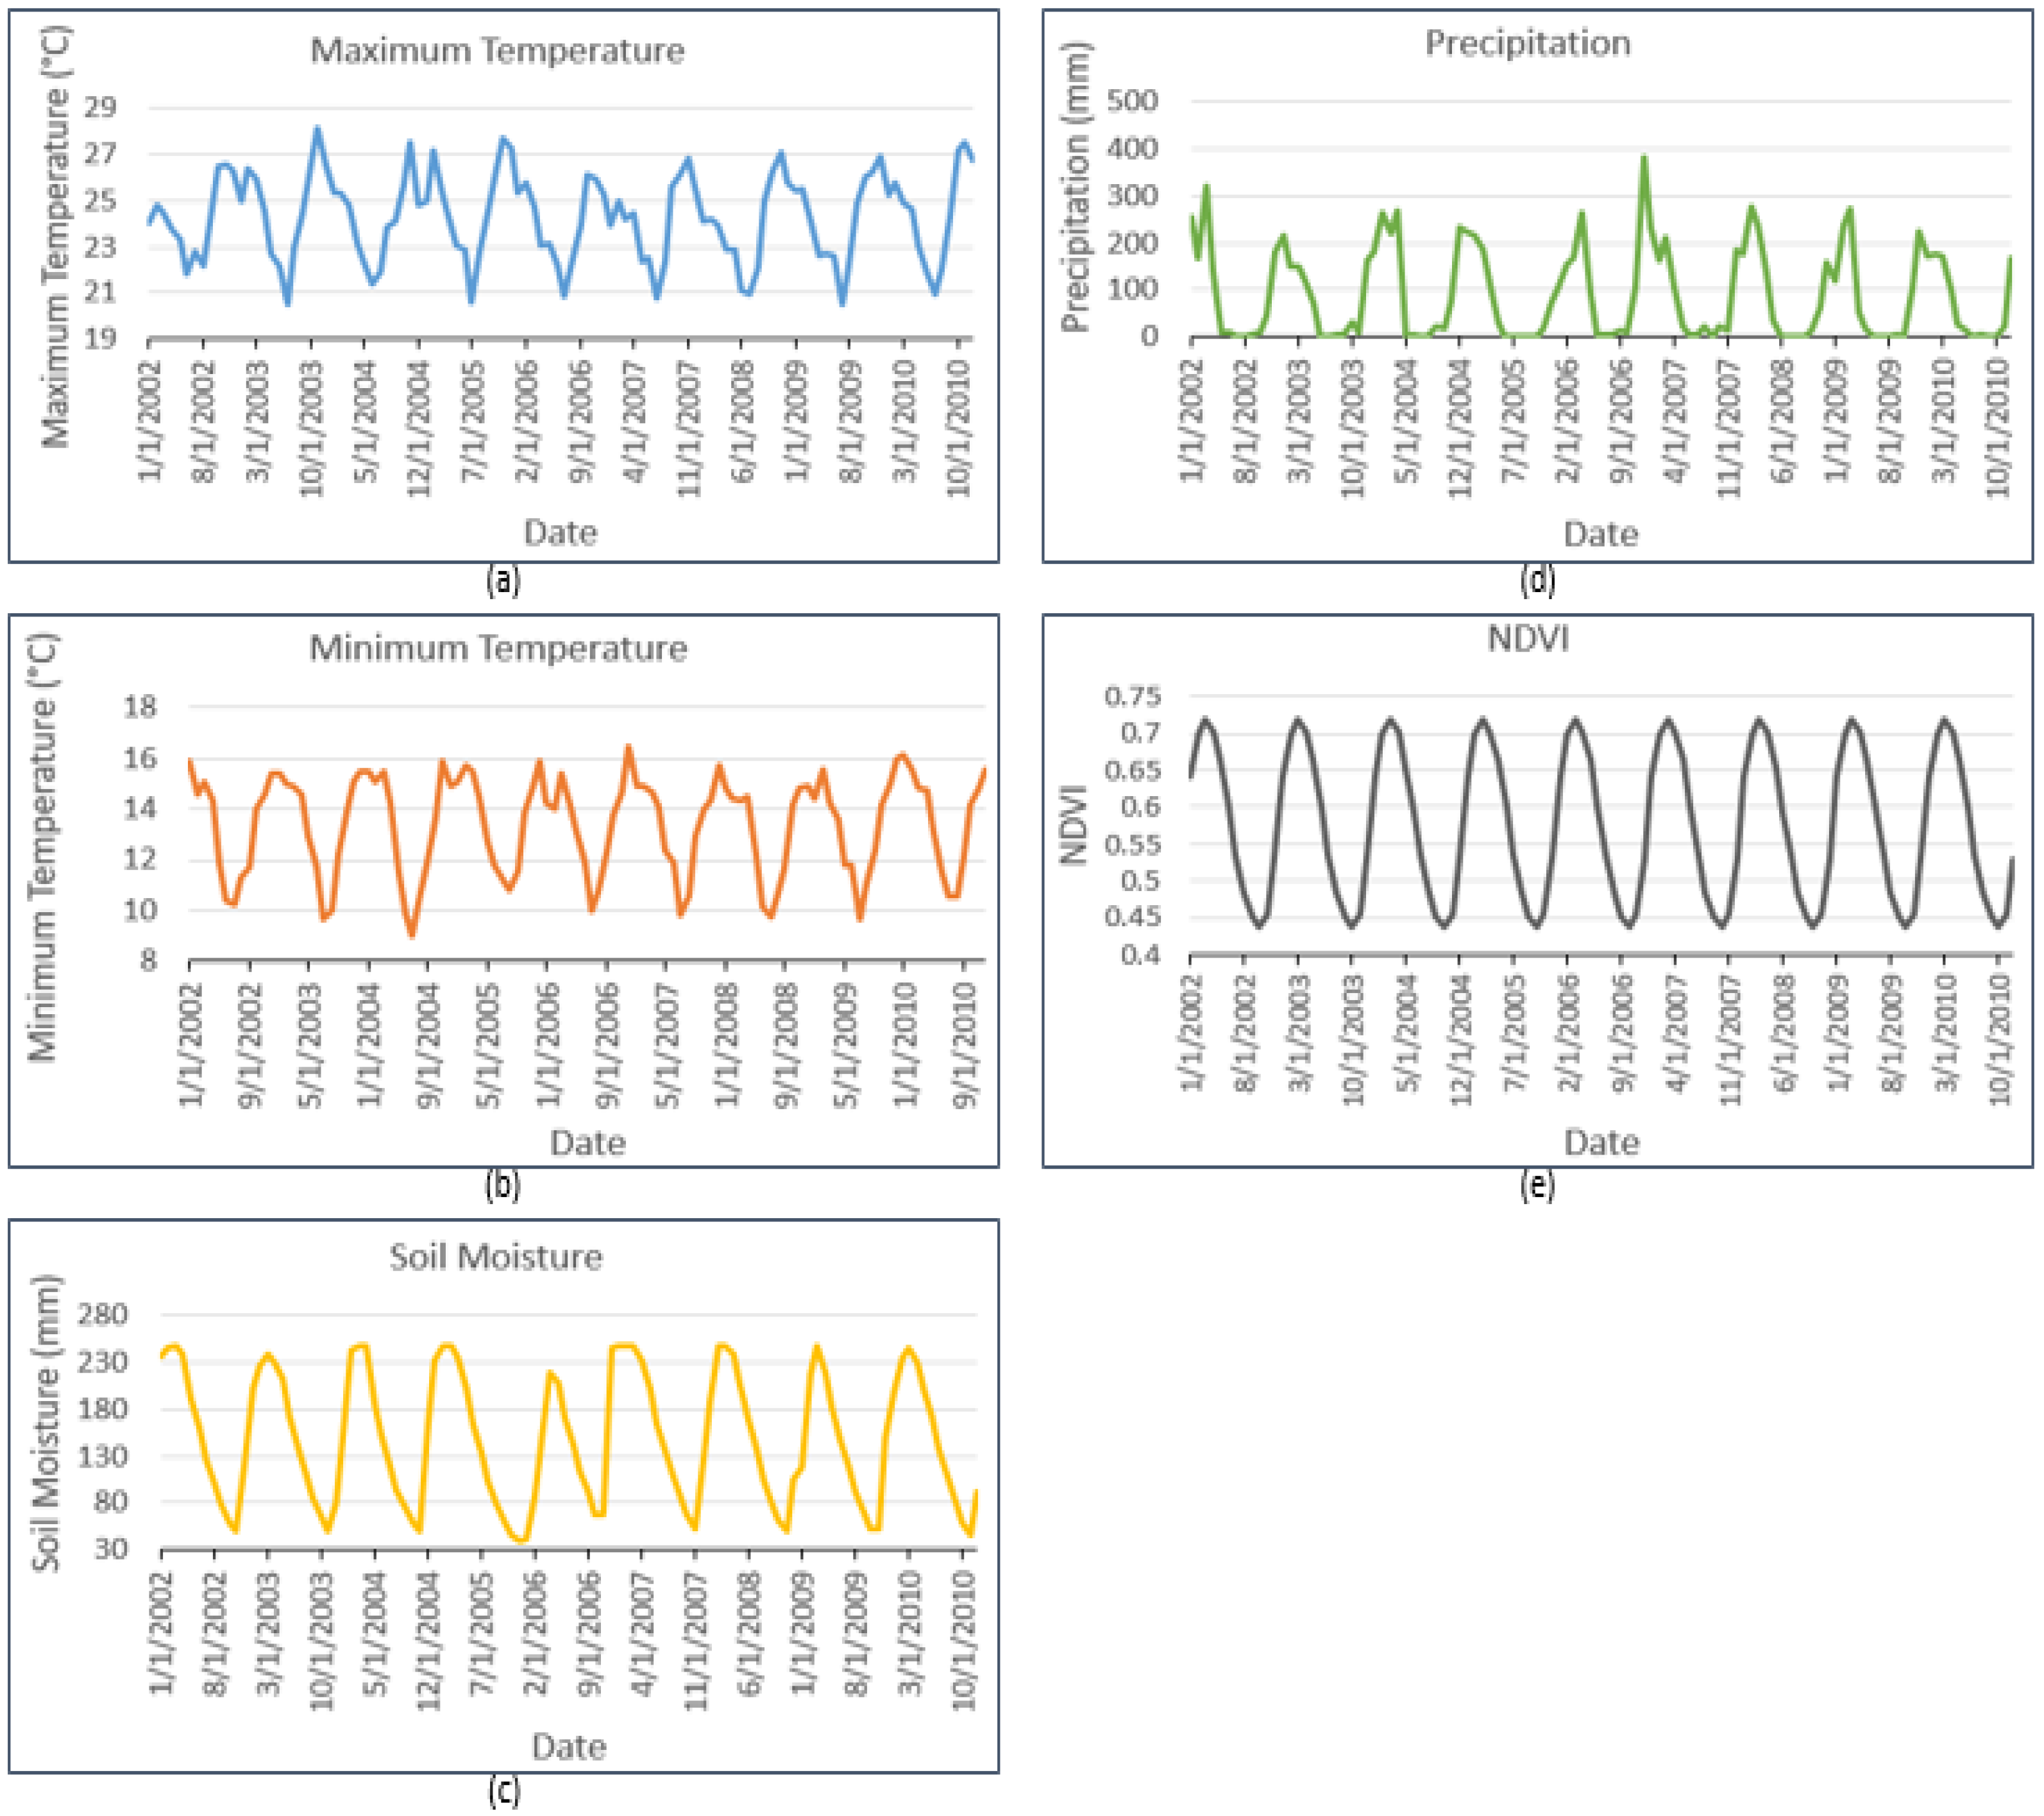
Table 2 shows an example of a data point (2002/2003 season) for a unimodal district (Liwale district) and another example of a data point (2002/2003 season) for a bimodal district (Kiteto district). Figure 6 shows historical maize yields for Mufindi district over a period of 8 years, from the 2002/2003 season to the 2009/2010 season, while Figure 7 shows the variation of 8 years of time-series data from the 2002/2003 season to the 2009/2010 season for Mufindi district (unimodal district). All districts showed variations in data values over the duration of each maize season.

2.5.5. Correlation of Input Data

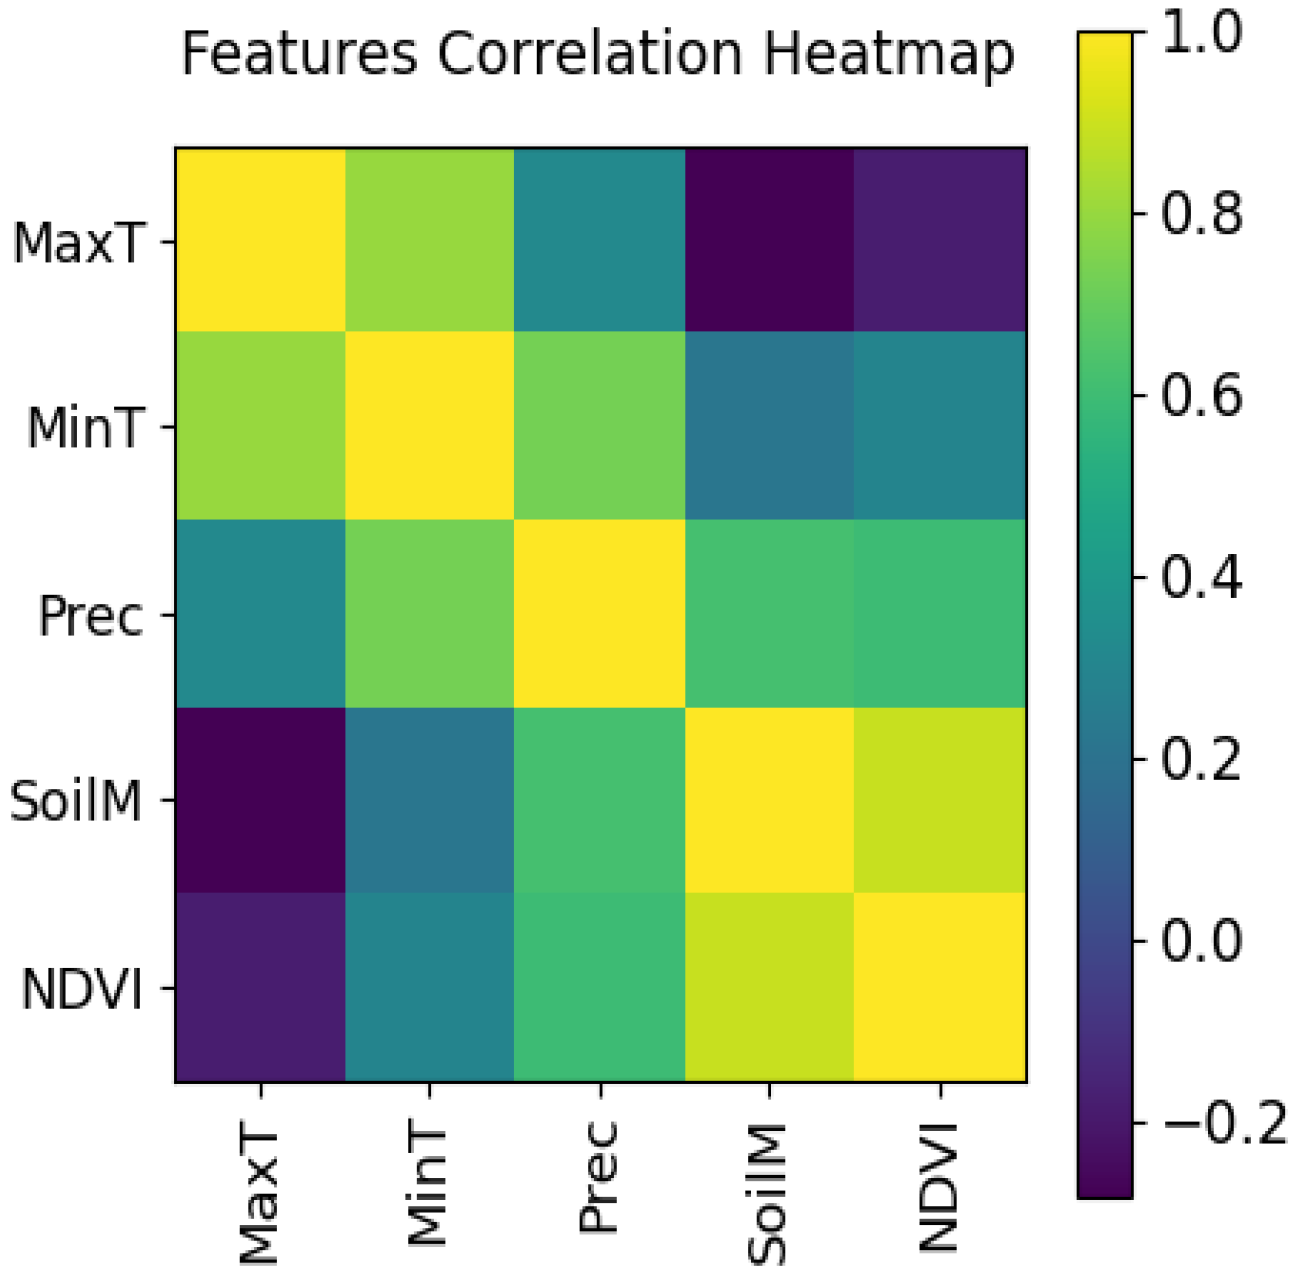
As strongly correlated data can affect the training of machine learning models, we used the Pearson correlation coefficient (Pearson’s r) [32] to analyze the correlation between the input data features climate data [maximum temperature, minimum temperature, soil moisture, precipitation (rainfall), and NDVI] for the 8 years of maize seasons (2002/2003 to 2009/2010). On average, correlation heatmaps of all districts showed that all five of the input data features are suitable for use in training deep learning models, with no parameters showing overly strong correlation. Figure 8 shows the Mufindi district correlation heatmap.

2.6. Deep Learning Models

2.6.1. Architecture of Deep Learning Models

The purpose of using deep learning model is for pattern recognition in the timesteps of individual data points in input data and correctly predict the maize yield. We decided to use the same architecture (shown in Figure 9) for both unimodal and bimodal deep learning models. The only difference between the two deep learning models is the data points they process (data points with seven timesteps are used to train and test the unimodal deep learning model, while data points with nine timesteps are used to train and test the bimodal deep learning model). The architecture of the deep learning models is explained as follows.
  • Preprocessing: Both the unimodal and bimodal deep learning models need to be trained with training data to correctly predict the maize yield and tested with test data to evaluate their effectiveness in predicting maize yields. In order to train and test the models, each data point has to be labelled. In this study, the labels are maize yields at the end of crop seasons. We labeled all district data points with their corresponding end-of-season maize yields as shown in Table 1. Because deep learning models only process numerical data as input; therefore, we transformed all data points into the float32 format. The unimodal training set contained 371 data points (2597 timesteps of input data), while the unimodal test set contained 53 data points (371 timesteps of input data). The bimodal training set contained 245 data points (2205 timesteps of input data), while the bimodal test set contained 35 data points (315 timesteps of input data). All of the datasets are provided in the Supplementary Materials.
  • LSTM layers: To learn the patterns in the input data points and correctly predict maize yields, we chose to use an LSTM network (a type of RNN) because it performs highly in processing data which have sequences such as time series data and data containing text. The proposed LSTM network is used to process the data points, timestep by timestep, by looping over the timesteps of the input data points at the same time keeping a memory (state) of the timestep data that it has processed. While doing this, the LSTM network saves the information with the purpose of using it later for preventing older signals from gradually vanishing (vanishing gradients) which results into better input data understanding. LSTM layer has several arguments one of which is output-dimensionality (number of units), indicating LSTM layer dimensionality for the output space. Usually, sequence batches are processed by the LSTM layer which takes the 3D tensor with the shape (batch-size, timesteps, input-features) as input and then returns a 3D tensor with the shape (batch-size, timesteps, output-features), like in the first LSTM layer in our deep learning model architecture or a 2D tensor with the shape (batch-size, output-features), like in the second LSTM layer in our deep learning model architecture]. The batch-size is used to indicate the amount of samples that has to be processed in every batch, input-features is used to indicate the input feature space dimensionality, timesteps indicates the length of sequence, and output-featuresis used to indicate the output feature space dimensionality.
  • Dense layer: Trained to output a single numerical value as the predicted maize yield.

2.6.2. Deep Learning Loss Function (MSE)

While training the deep learning models, we used loss function of Mean squared error (MSE) [refer to Equation (2)]. MSE measures the average squared difference between the forecasted (predicted) maize yield value x i and the true (actual) maize yield value y i . During training, the Adam optimizer [33] minimizes this loss to ensure the model learns appropriate weights to help predicting maize yield values which are close to the true maize yield values.
M S E = 1 n i = 1 n ( y i x i ) 2 .

2.6.3. Deep Learning Evaluation Metric (MAPE)

The mean absolute percentage error (MAPE) [refer to Equation (3)] was used as an evaluation metric while training and testing the deep learning models. It measures the prediction accuracy between the predicted maize yield value x i and actual maize yield value y i .
M A P E = 100 % n i = 1 n | y i x i y i | .

2.7. K-Fold Cross-Validation

To build an effective deep learning model, it is important that deep learning model hyperparameters are tuned. While training of both the unimodal and bimodal deep learning models, we continuously adjusted several parameters, like number of LSTM layers, the size of LSTM layers, and amount of epochs, by looking at how the models perform on the validation datasets. During the process of training our deep learning models, K-fold cross-validation [34] was used. In K-fold cross-validataion, the training dataset is partitioned into K partitions, and then for every partition, the model is trained on the rest K 1 partitions and then evaluated on that specific partition. Then the model’s validation MSE score is the average of the K validation MSE scores. For our research, we used Four-fold cross-validation, choosing four as the value of K. Unimodal and bimodal training sets were separately used in K-fold cross-validation experiments for the unimodal and bimodal deep learning models, respectively.

2.8. Design of System

2.8.1. Architecture of System

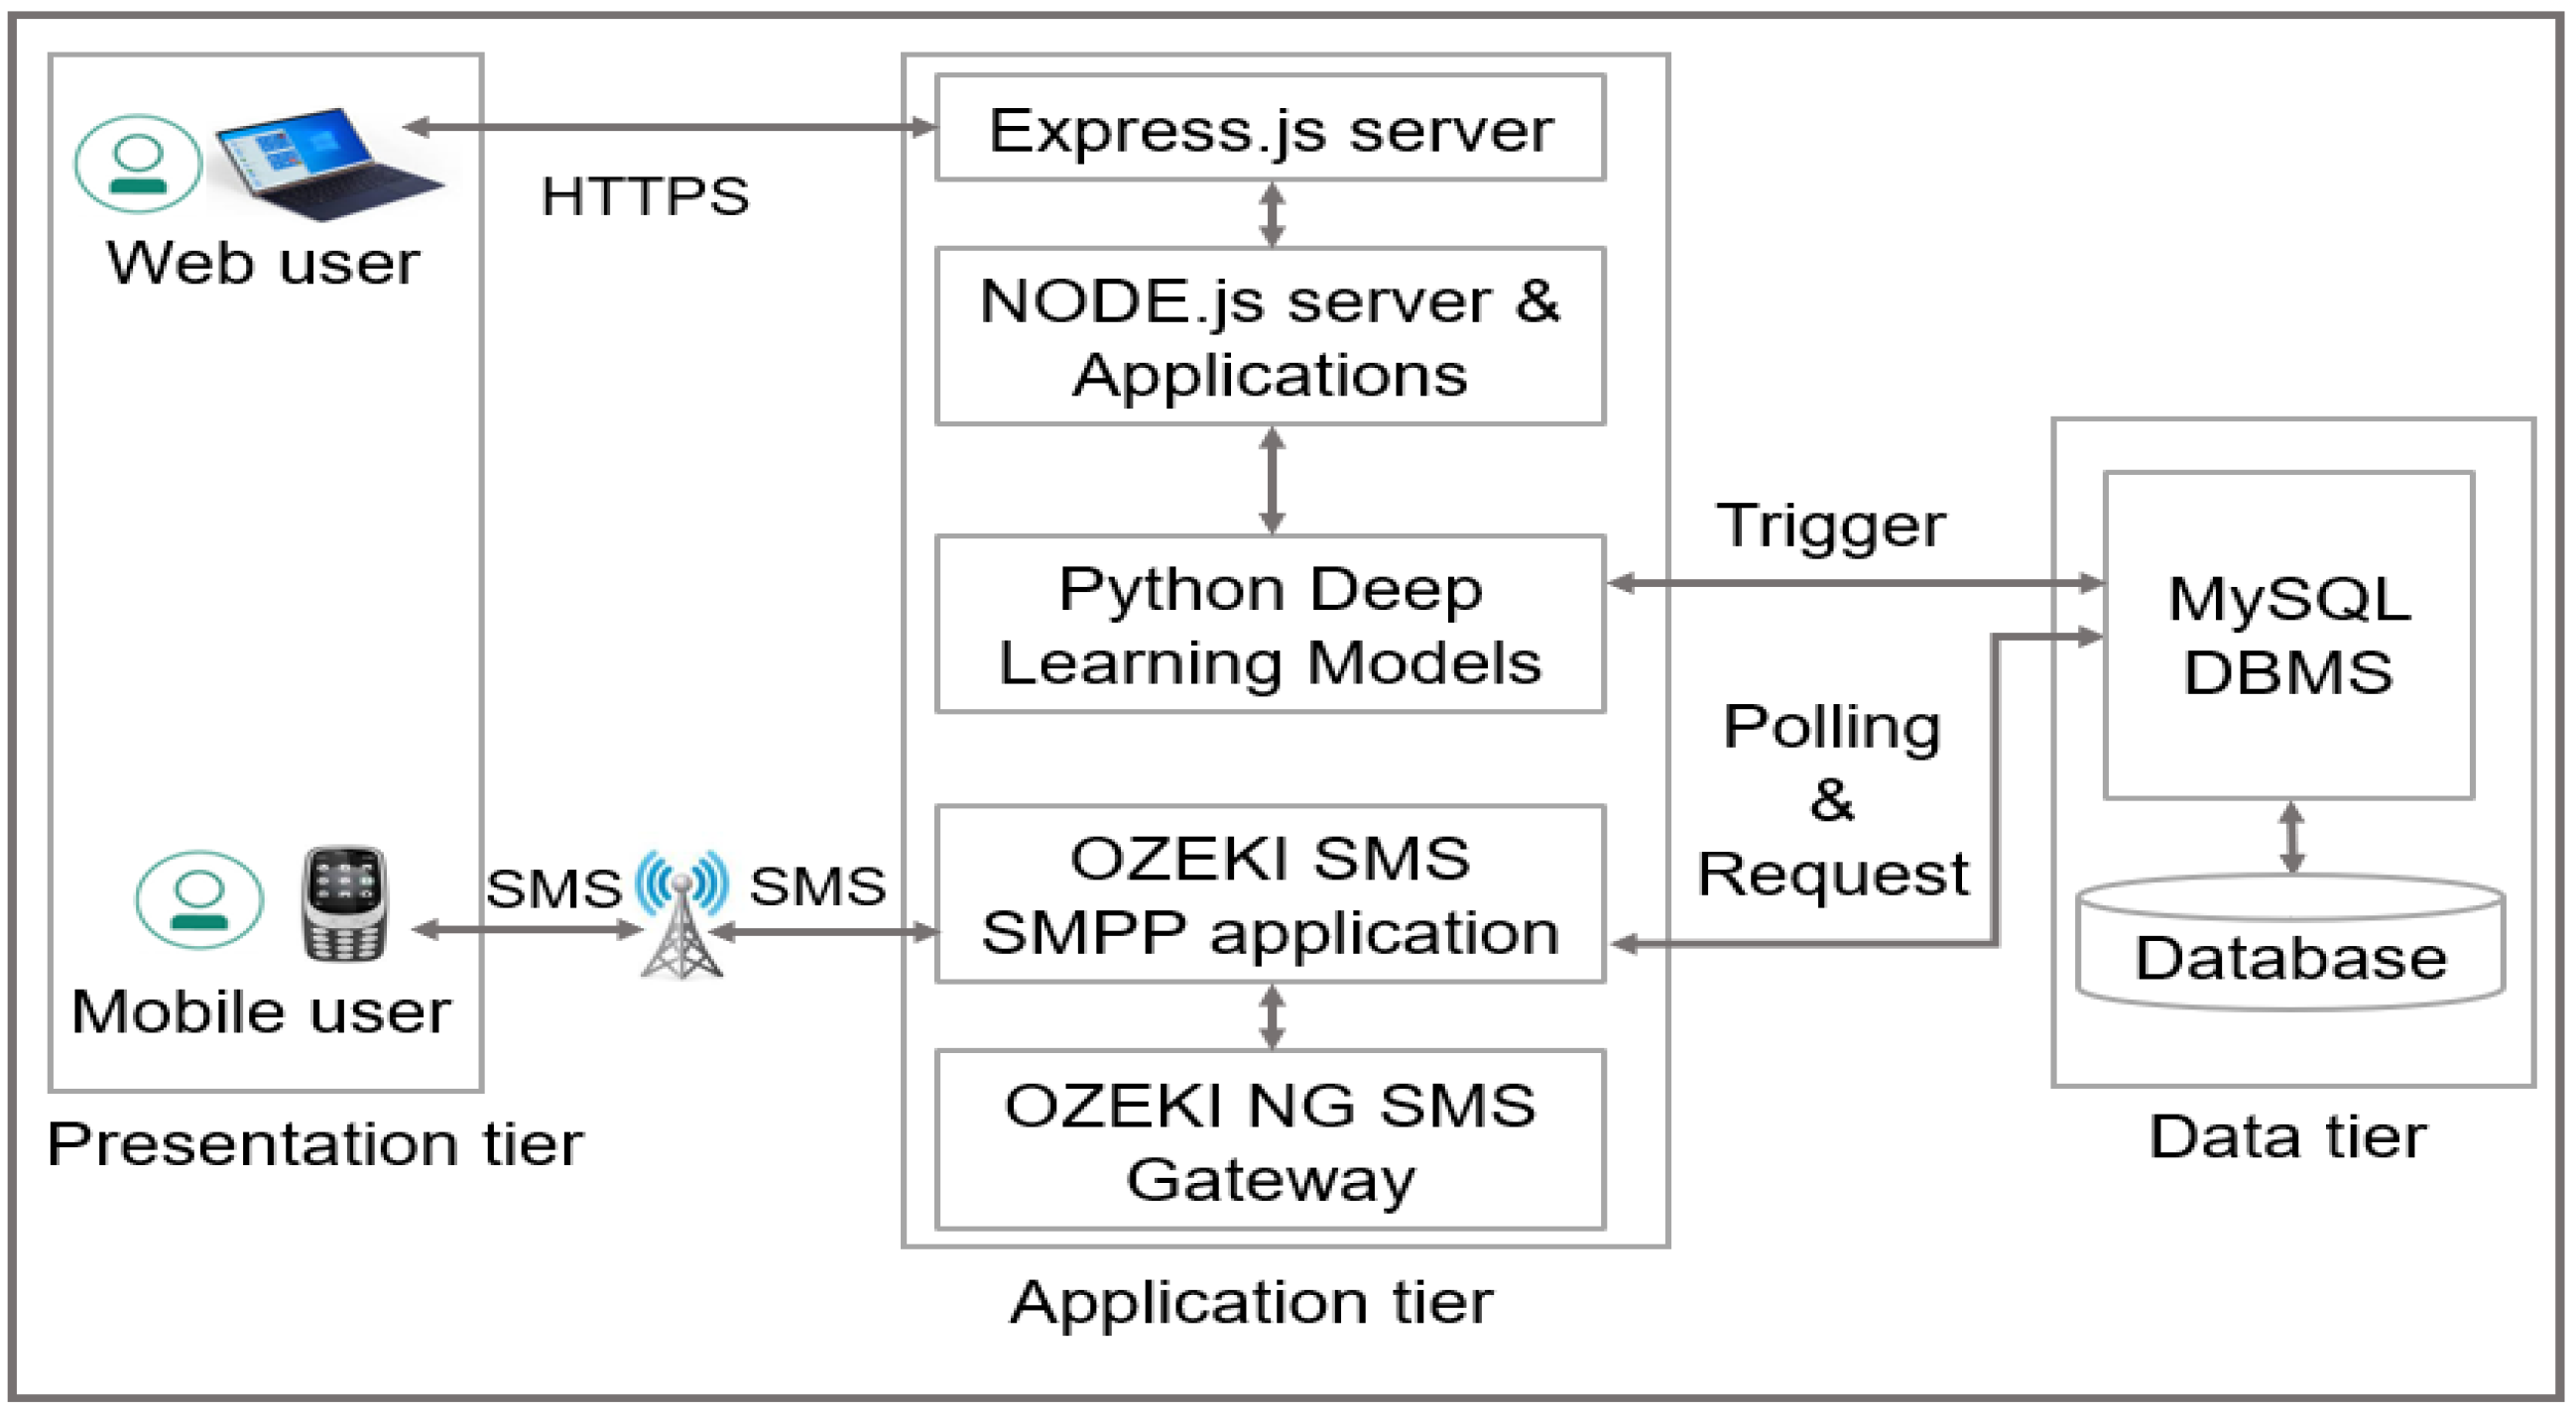
MYPS design uses three-tier architecture which is shown in Figure 10. In case of an SMS query, the Ozeki NG SMS Gateway [35] together with the MySQL stored procedures are used for interpreting the keyword, aunthenticating the user (cooperative union officer or farmer), and executing SQL queries to insert prediction data into trigger tables, which in turn pass the prediction data to Python programming language scripts of the deep learning models. The deep learning model (unimodal or bimodal) in turn predicts the district maize yield, which is then sent back to the user via SMS. Authenticating users assures security, while automatically responding to users’ requests assures short response time and availability. In case of the Web system, a district officer interacts with the Web system by using Web browser, gets authenticated and then registers or updates district prediction data and requests district maize yields prediction. In addition, a ministry officer uses a Web browser to interact with the Web system, and after authentication, he/she can request a district maize yield prediction. To request a district maize yield prediction, both users use HTML forms in the Pug (Jade) template engine to interact with Express.js and then Node.js, which interacts with the Python deep learning models through a Node.js child process spawn functionality [36], after which the predicted district maize yield is displayed. HTTPS (Hypertext Transfer Protocol Secure) in Web requests, users’ authentication, and sessions in Node.js programming language assure security. Automatic processing and response of Web requests by the Node.js server, the Express.js server, as well as MySQL assure availability.

2.8.2. Database Design

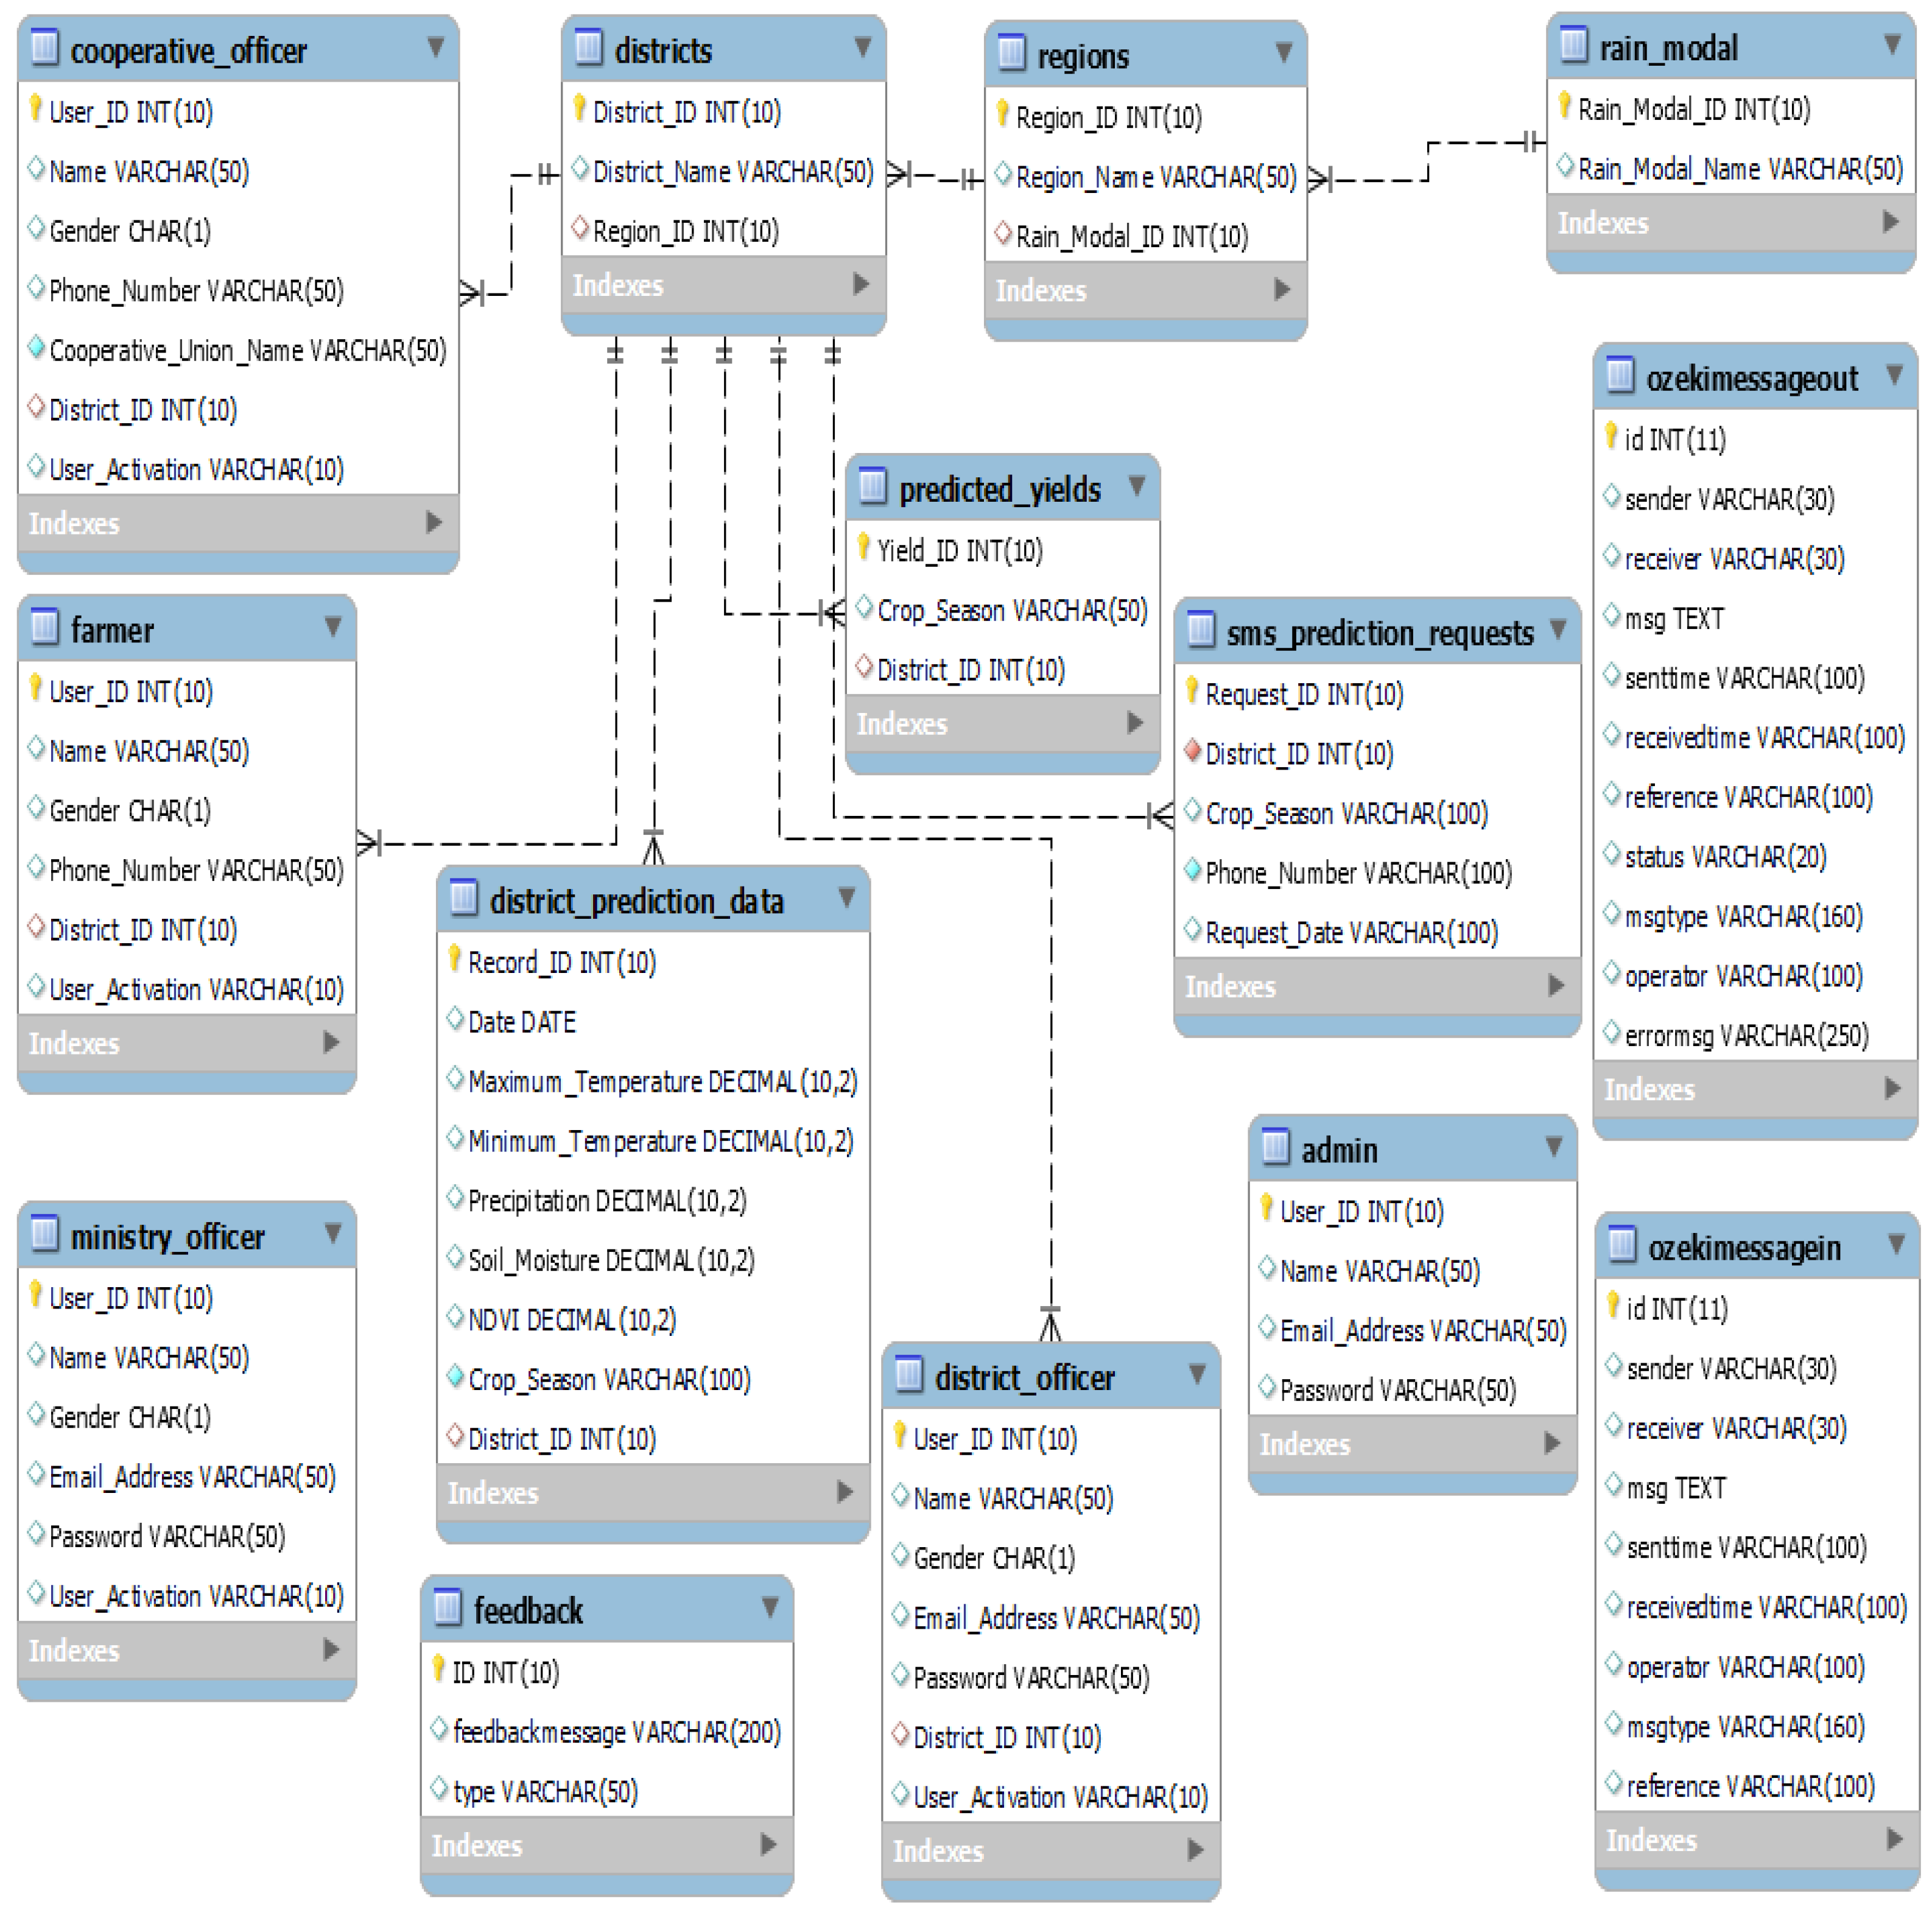
The MySQL database management system was used to create the system’s database, which is relational and contains several tables related to each other. The entity relationship diagram (ERD) in Figure 11 shows the relational database design. The ERD was generated using MySQL Workbench [37].

2.9. Prototype Implementation and Testing

We implemented MYPS prototype with all requested functions. It was not possible to travel to Tanzania due to the restrictions in travelling around the world, hence MYPS was not delivered to Tanzanian users. In order to test the functions in the system, the first author took the role of district officer and prepared and uploaded two data points in CSV format, each for a different district, Liwale (unimodal district) and Kiteto (bimodal district). A fellow student was also asked by the first author to take farmer’s role and then via SMS, request a prediction of maize yield from the system. Figure 12 shows how a ministry officer can request and receive Liwale district end-of-season maize yield predictions in the Web system, as well as how a farmer can sign up and request a Liwale district end-of-season maize yield prediction via SMS.

3. Results

3.1. Hyperparameter Tuning Experiments

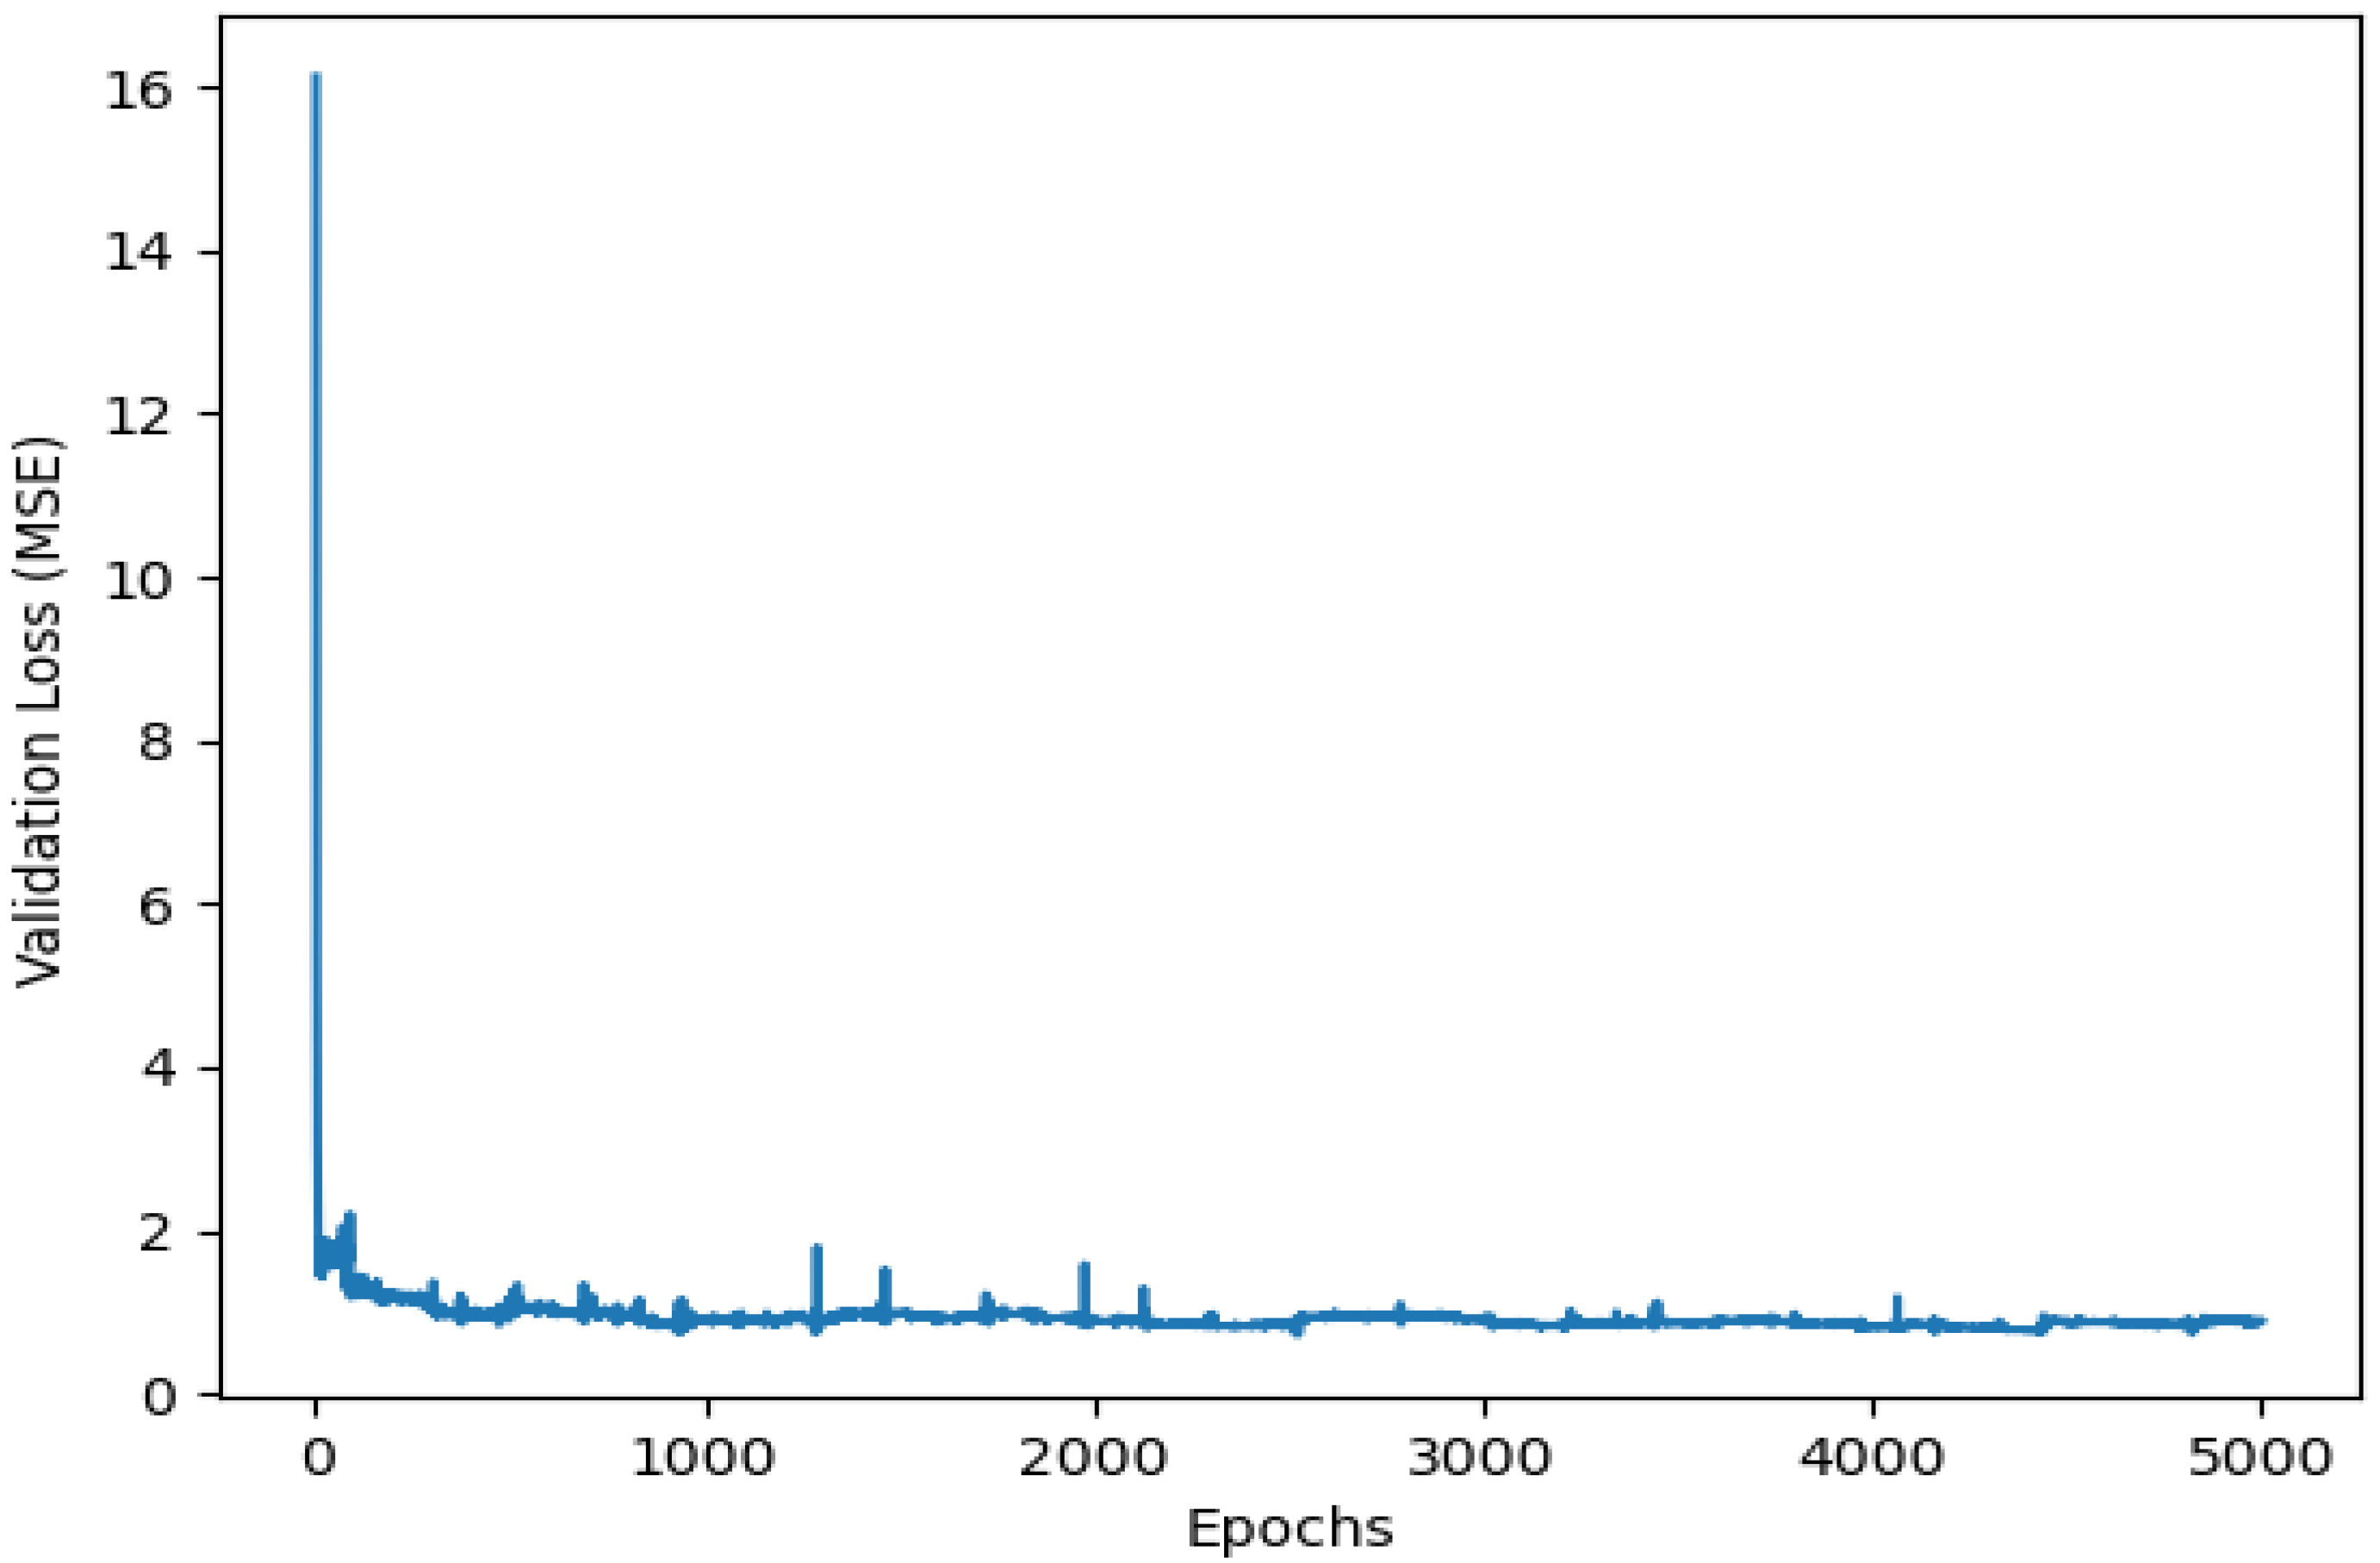
While training the deep learning models, we tuned the models by varying different hyperparameters. Four-fold cross-validation was used in evaluating models’ performances on validation datasets by observing MSE scores. While doing this, modification to the hyperparameters was done accordingly to improve the models’ validation accuracies. This activity was repeated a number of times to get the models’ best hyperparameters. For example, Figure 13 and Figure 14 indicate the average validation accuracy per each epoch in the cross-validation experiment while training the unimodal and bimodal deep learning models, respectively. At the end, we got the following hyperparameters for both deep learning models: 2 layers of LSTM, output-dimensionality of 100 and 200 for the first and second LSTM layers respectively, batch-size of 16, learning rate of 0.001 for Adam optimizer which is used to minimize the loss, and 4500 training epochs.

3.2. Final Training Experiments

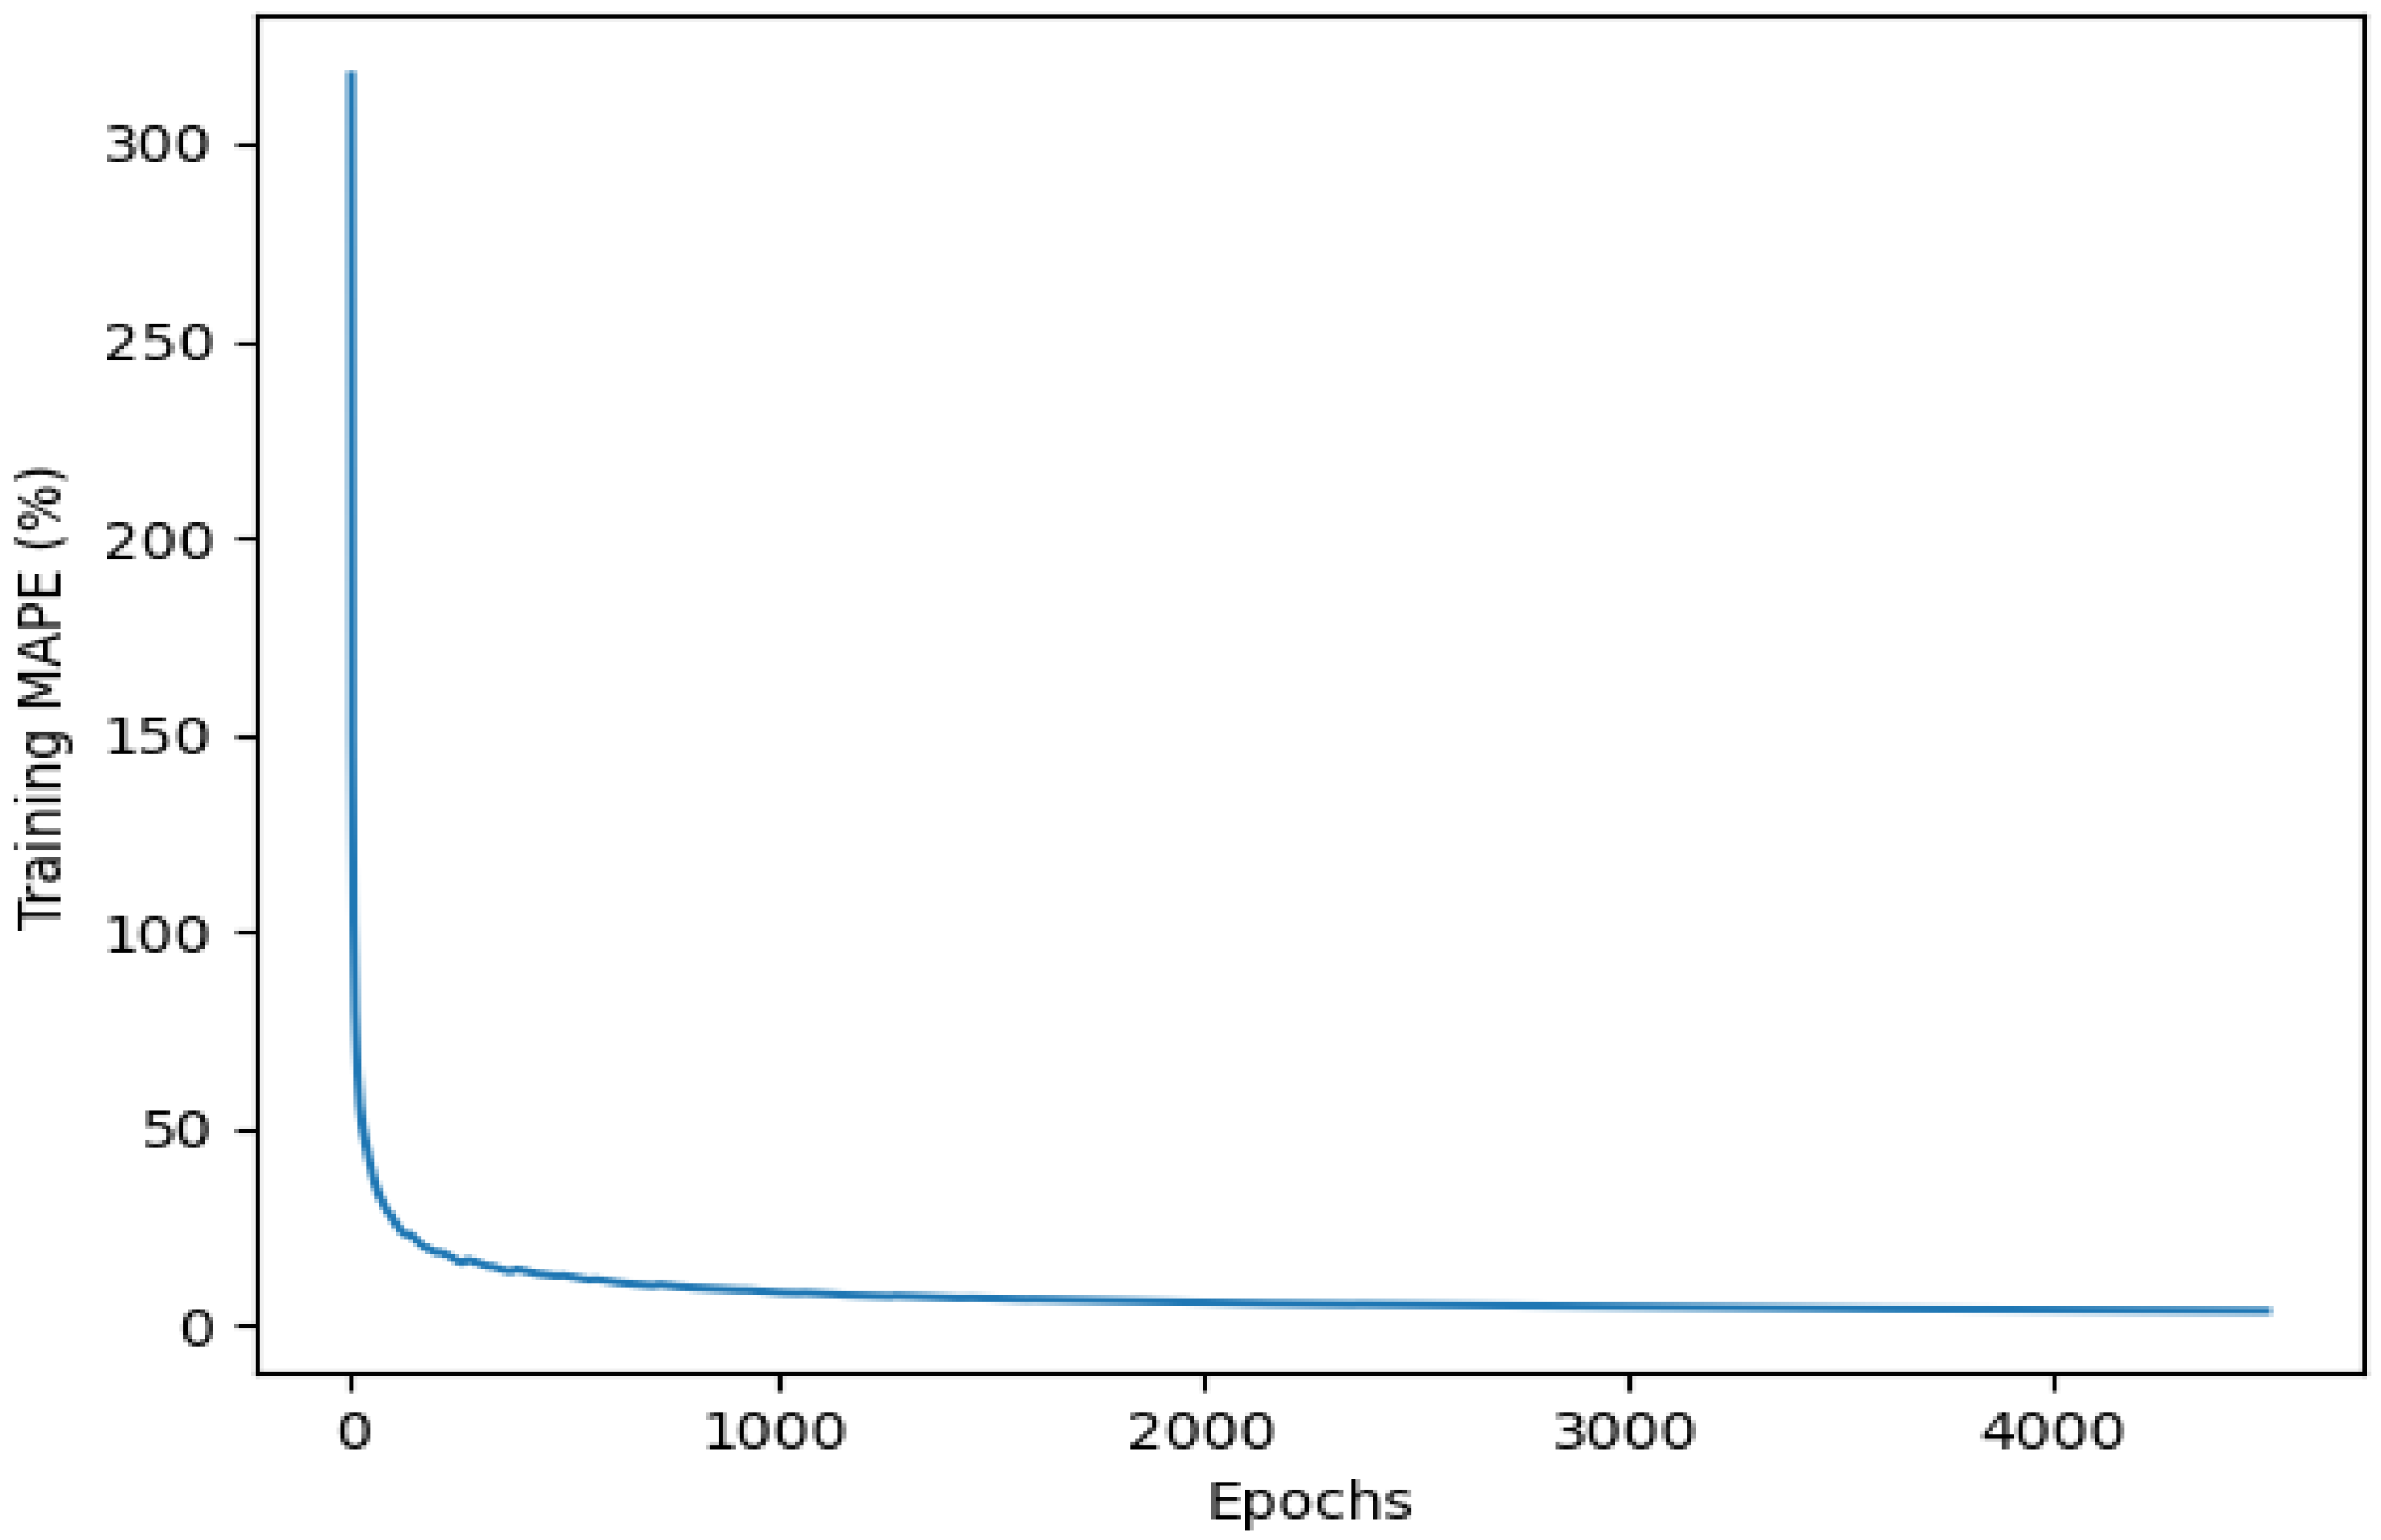
After completing tuning hyperparameters, the deep learning models were configured according to the hyperparameters we got and afterwards final experiments were conducted by training the unimodal and bimodal deep learning models on unimodal and bimodal training sets, respectively. Figure 15 and Figure 16 show the MAPE scores of the final training of the models. We conducted experiments in Keras version 2.3.1 deep learning library and TensorFlow version 2.0.0 deep learning backend on a desktop computer with Windows 10 Operating System (OS), 3.60-GHz Intel (R) Core (TM) i7 processor and 16 GB RAM (Random Access Memory).

3.3. Prediction Accuracy on Test Sets and Comparisons

For evaluating prediction accuracies of the deep learning models, their MAPE scores were evaluated on datasets that they had never seen before (test sets). Our unimodal and bimodal deep learning models obtained MAPE scores of 3.656% and 6.648%, respectively. These results indicate that, the deep learning models that we have proposed are highly effective and have high prediction accuracies for the end-of-season district maize yields in Tanzania.
In contrast, the evaluation of the proposed deep learning model in Nevavuori et al. [15], which also used an LSTM network to predict crop yields, revealed MAPE scores of 7.17% and 5.51% for crop yield predictions. These results imply that, on top of proposing easy to use Swahili based system, our proposed deep learning models have sufficient effectiveness because they have yield prediction accuracies which are comparable to those of existing deep learning models that have shown effectiveness in predicting crop yields in other countries.

4. Discussion and Conclusions

4.1. Discussion

4.1.1. Improved Accessibility

The inclusion of SMS in our proposed system allows grass-roots users, such as rural farmers and cooperative union officers, to request and receive end-of-season maize district yields even if they do not have Internet access, computers, or the knowhow to directly interact with deep learning models. This maize yield prediction will help these rural farmers, as well as the government, to make better and critical plans for food assurance, harvest management, and crop marketing.

4.1.2. Deep Learning Models Impact on Processing Combined NDVI and Climate Data

This study’s results reveal that, our LSTM deep learning models in MYPS can use combined input data of NDVI, maximum temperature, minimum temperature, soil moisture, and precipitation to predict end-of-season Tanzania district-specific maize yields with great effectiveness. The findings help in filling an existing information gap on the impact of deep learning models in predicting crop yields using this data combination, especially in Tanzania.

4.1.3. Study Limitations

Because some districts have missing historical maize yield data, the deep learning models did not have equal representation of data points during training, and some districts in Tanzania were not included at all. This might limit generalization of the developed system when deployed for all districts in Tanzania.

4.1.4. Major Contributions

Major contributions of this study include the following:
  • Completed and ready-to-use deep learning-based information system that allows farmers, cooperative union officers, district officers, and ministry officers in Tanzania to forecast end-of-season district maize yields via SMS and Web system.
  • Novel method of using SMS to query deep learning models using MySQL triggers.
  • Deep learning architectures that can also be adopted and used by other researchers.
  • Deep learning datasets with prediction data from almost all districts in Tanzania, which can be used by other researchers.
  • Performance evaluation findings that fill the existing information gap on effectiveness of deep learning models in predicting crop yields in Tanzania.

4.2. Conclusions

In this work, we have developed MYPS which is based on deep learning and which is accessed by SMS and the Web for predicting end-of-season maize yields for Tanzania districts. The key finding is that our deep learning networks are effective in predicting end-of-season Tanzania district-specific maize yields. As part of the implementation policy, we recommend to the government of Tanzania to invite investors who are able to implement deep learning based solutions to predict crop yields via SMS technology in affordable low end mobile phones in Tanzania. Future work will involve delivering MYPS to Tanzanian farmers and later evaluating its usability (how easy is to learn and use it) to the farmers through System Usability Scale (SUS).

Supplementary Materials

The following datasets are available online at https://www.mdpi.com/article/10.3390/agriculture13030627/s1: Data S1, Time-series datasets with maximum temperature, minimum temperature, soil moisture, precipitation, NDVI, and historical maize yield data for Tanzanian districts from 2002/2003 to 2009/2010 maize seasons for the purpose of training, validating, and testing the deep learning models.

Author Contributions

Conceptualization, methodology, software, validation, formal analysis, investigation, visualization, writing—original draft preparation, I.G.T.; resources, data curation, writing—review and editing, I.G.T., K.A., H.Y., T.K. and N.O.; supervision, project administration, funding acquisition, K.A., H.Y., T.K. and N.O. All authors have read and agreed to the published version of the manuscript.

Funding

This work was supported by the Japan Society for the Promotion of Science, KAKENHI Grant Numbers JP18K11268 and JP21K11849.

Institutional Review Board Statement

Not applicable.

Informed Consent Statement

Not applicable.

Data Availability Statement

The data presented in this study are available in the article and Supplementary Materials.

Conflicts of Interest

The authors declare no conflict of interest.

References

  1. URT [United Republic of Tanzania]: National Agriculture Policy. Available online: http://extwprlegs1.fao.org/docs/pdf/tan141074.pdf (accessed on 30 August 2022).
  2. The World Bank: Rural Population. Available online: https://data.worldbank.org/indicator/SP.RUR.TOTL.ZS?locations=TZ (accessed on 30 August 2022).
  3. URT [United Republic of Tanzania]: Household Budget Survey (HBS), 2011/12—Key Findings Report. Available online: https://www.nbs.go.tz/index.php/en/census-surveys/poverty-indicators-statistics/household-budget-survey-hbs/148-household-budget-survey-hbs-2011-12-key-findings-report (accessed on 30 August 2022).
  4. USDA [United States Department of Agriculture]: Tanzania—United Republic of, Grain and Feed Annual 2019 Tanzania Corn, Wheat and Rice Report. Available online: https://apps.fas.usda.gov/newgainapi/api/report/downloadreportbyfilename?filename=Grain%20and%20Feed%20Annual_Dar%20es%20Salaam_Tanzania%20-%20United%20Republic%20of_4-9-2019.pdf (accessed on 30 August 2022).
  5. Chen, Y.; Lee, W.S.; Gan, H.; Peres, N.; Fraisse, C.; Zhang, Y.; He, Y. Strawberry Yield Prediction Based on a Deep Neural Network Using High-Resolution Aerial Orthoimages. Remote Sens. 2019, 11, 1584. [Google Scholar] [CrossRef] [Green Version]
  6. Fernandez-Beltran, R.; Baidar, T.; Kang, J.; Pla, F. Rice-Yield Prediction with Multi-Temporal Sentinel-2 Data and 3D CNN: A Case Study in Nepal. Remote Sens. 2021, 13, 1391. [Google Scholar] [CrossRef]
  7. Danilevicz, M.F.; Bayer, P.E.; Boussaid, F.; Bennamoun, M.; Edwards, D. Maize Yield Prediction at an Early Developmental Stage Using Multispectral Images and Genotype Data for Preliminary Hybrid Selection. Remote Sens. 2021, 13, 3976. [Google Scholar] [CrossRef]
  8. Wang, Y.; Zhang, Z.; Feng, L.; Du, Q.; Runge, T. Combining Multi-Source Data and Machine Learning Approaches to Predict Winter Wheat Yield in the Conterminous United States. Remote Sens. 2020, 12, 1232. [Google Scholar] [CrossRef] [Green Version]
  9. Wang, L.; Ma, H.; Li, J.; Gao, Y.; Fan, L.; Yang, Z.; Yang, Y.; Wang, C. An automated extraction of small- and middle-sized rice fields under complex terrain based on SAR time series: A case study of Chongqing. Comput. Electron. Agric. 2022, 200, 107232. [Google Scholar] [CrossRef]
  10. Sepp, H.; Jürgen, S. Long short-term memory. J. Neural Comput. 1997, 9, 1735–1780. [Google Scholar]
  11. Alibabaei, K.; Gaspar, P.D.; Lima, T.M. Crop Yield Estimation Using Deep Learning Based on Climate Big Data and Irrigation Scheduling. Energies 2021, 14, 3004. [Google Scholar] [CrossRef]
  12. Haider, S.A.; Naqvi, S.R.; Akram, T.; Umar, G.A.; Shahzad, A.; Sial, M.R.; Khaliq, S.; Kamran, M. LSTM Neural Network Based Forecasting Model for Wheat Production in Pakistan. Agronomy 2019, 9, 72. [Google Scholar] [CrossRef] [Green Version]
  13. Cho, W.; Kim, S.; Na, M.; Na, I. Forecasting of Tomato Yields Using Attention-Based LSTM Network and ARMA Model. Electronics 2021, 10, 1576. [Google Scholar] [CrossRef]
  14. Zhang, L.; Zhang, Z.; Luo, Y.; Cao, J.; Tao, F. Combining Optical, Fluorescence, Thermal Satellite, and Environmental Data to Predict County-Level Maize Yield in China Using Machine Learning Approaches. Remote Sens. 2020, 12, 21. [Google Scholar] [CrossRef] [Green Version]
  15. Nevavuori, P.; Narra, N.; Linna, P.; Lipping, T. Crop Yield Prediction Using Multitemporal UAV Data and Spatio-Temporal Deep Learning Models. Remote Sens. 2020, 12, 4000. [Google Scholar] [CrossRef]
  16. Sun, J.; Di, L.; Sun, Z.; Shen, Y.; Lai, Z. County-Level Soybean Yield Prediction Using Deep CNN-LSTM Model. Sensors 2019, 19, 4363. [Google Scholar] [CrossRef] [PubMed] [Green Version]
  17. The World Bank: Mobile Cellular Subscriptions (per 100 People)—Tanzania. Available online: https://data.worldbank.org/indicator/IT.CEL.SETS.P2?locations=TZ (accessed on 30 August 2022).
  18. Tende, I.G.; Kubota, S.; Yamaba, H.; Aburada, K.; Okazaki, N. Evaluation of farmers market information system to connect with some social stakeholders. J. Inf. Process. 2018, 26, 247–256. [Google Scholar]
  19. Wang, J.-H.; Liu, T.-W.; Luo, X. Combining Post Sentiments and User Participation for Extracting Public Stances from Twitter. Appl. Sci. 2020, 10, 8035. [Google Scholar] [CrossRef]
  20. Al-Laith, A.; Shahbaz, M.; Alaskar, H.F.; Rehmat, A. AraSenCorpus: A Semi-Supervised Approach for Sentiment Annotation of a Large Arabic Text Corpus. Appl. Sci. 2021, 11, 2434. [Google Scholar] [CrossRef]
  21. Yasar, H.; Kilimci, Z.H. US Dollar/Turkish Lira Exchange Rate Forecasting Model Based on Deep Learning Methodologies and Time Series Analysis. Symmetry 2021, 12, 1553. [Google Scholar] [CrossRef]
  22. Feed the Future (U.S. Government’s Global Hunger and Food Security Initiative): Maize Production Manual for Smallholder Farmers in Tanzania. Available online: https://cgspace.cgiar.org/bitstream/handle/10568/109806/Maize%20production%20manual%20for%20smallholder%20farmers%20in%20Tanzania.pdf?sequence=1 (accessed on 30 August 2022).
  23. United Nations World Food Programme: Special Report, FAO/WFP Crop and Food Supply Assessment Mission to the United Republic of Tanzania. Available online: https://www.fao.org/3/w7958e/w7958e00.htm (accessed on 30 August 2022).
  24. NASA Eath Observatory: Normalized Difference Vegetation Index (NDVI). Available online: https://earthobservatory.nasa.gov/features/MeasuringVegetation/measuring_vegetation_2.php#:~:text=Normalized%20Difference%20Vegetation%20Index%20(NDVI,up%20the%20spectrum%20of%20sunlight (accessed on 30 August 2022).
  25. NASA TERRA: Moderate Resolution Imaging Spectroradiometer. Available online: https://terra.nasa.gov/about/terra-instruments/modis (accessed on 30 August 2022).
  26. NASA: GIMMS Global Agricultural Monitoring. Available online: https://glam1.gsfc.nasa.gov/ (accessed on 30 August 2022).
  27. Abatzoglou, J.; Dobrowski, S.; Parks, S.; Hegewisch, K.C. TerraClimate, a high-resolution global dataset of monthly climate and climatic water balance from 1958-2015. Sci. Data 2018, 5, 170191. [Google Scholar] [CrossRef] [Green Version]
  28. Google: Google Earth Engine. Available online: https://earthengine.google.com/ (accessed on 30 August 2022).
  29. Climate Engine: Research App. Available online: https://app.climateengine.com/climateEngine (accessed on 30 August 2022).
  30. FAO [The Food and Agriculture Organization]: Global Administrative Unit Layers (GAUL). Available online: https://data.review.fao.org/map/catalog/srv/api/records/9c35ba10-5649-41c8-bdfc-eb78e9e65654 (accessed on 30 August 2022).
  31. URT [United Republic of Tanzania], Ministry of Agriculture: TAKWIMU. Available online: https://www.kilimo.go.tz/resources/category/takwimu (accessed on 30 August 2022).
  32. Wikipedia: Pearson Correlation Coefficient. Available online: https://en.wikipedia.org/wiki/Pearson_correlation_coefficient (accessed on 30 August 2022).
  33. Keras: Adam Optimizer. Available online: https://keras.io/api/optimizers/adam/ (accessed on 30 August 2022).
  34. Refaeilzadeh, P.; Tang, L.; Liu, H. Cross-Validation. In Encyclopedia of Database Systems; Liu, L., Özsu, M.T., Eds.; Springer: Boston, MA, USA, 2016. [Google Scholar]
  35. OZEKI NG SMS Gateway. Available online: https://ozekisms.com/ (accessed on 30 August 2022).
  36. Node.js Organization: Node.js v18.8.0 Documentation, Child Process. Available online: https://nodejs.org/api/child_process.html#child_processspawncommand-args-options (accessed on 30 August 2022).
  37. MySQL Workbench. Available online: https://www.mysql.com/products/workbench/ (accessed on 30 August 2022).
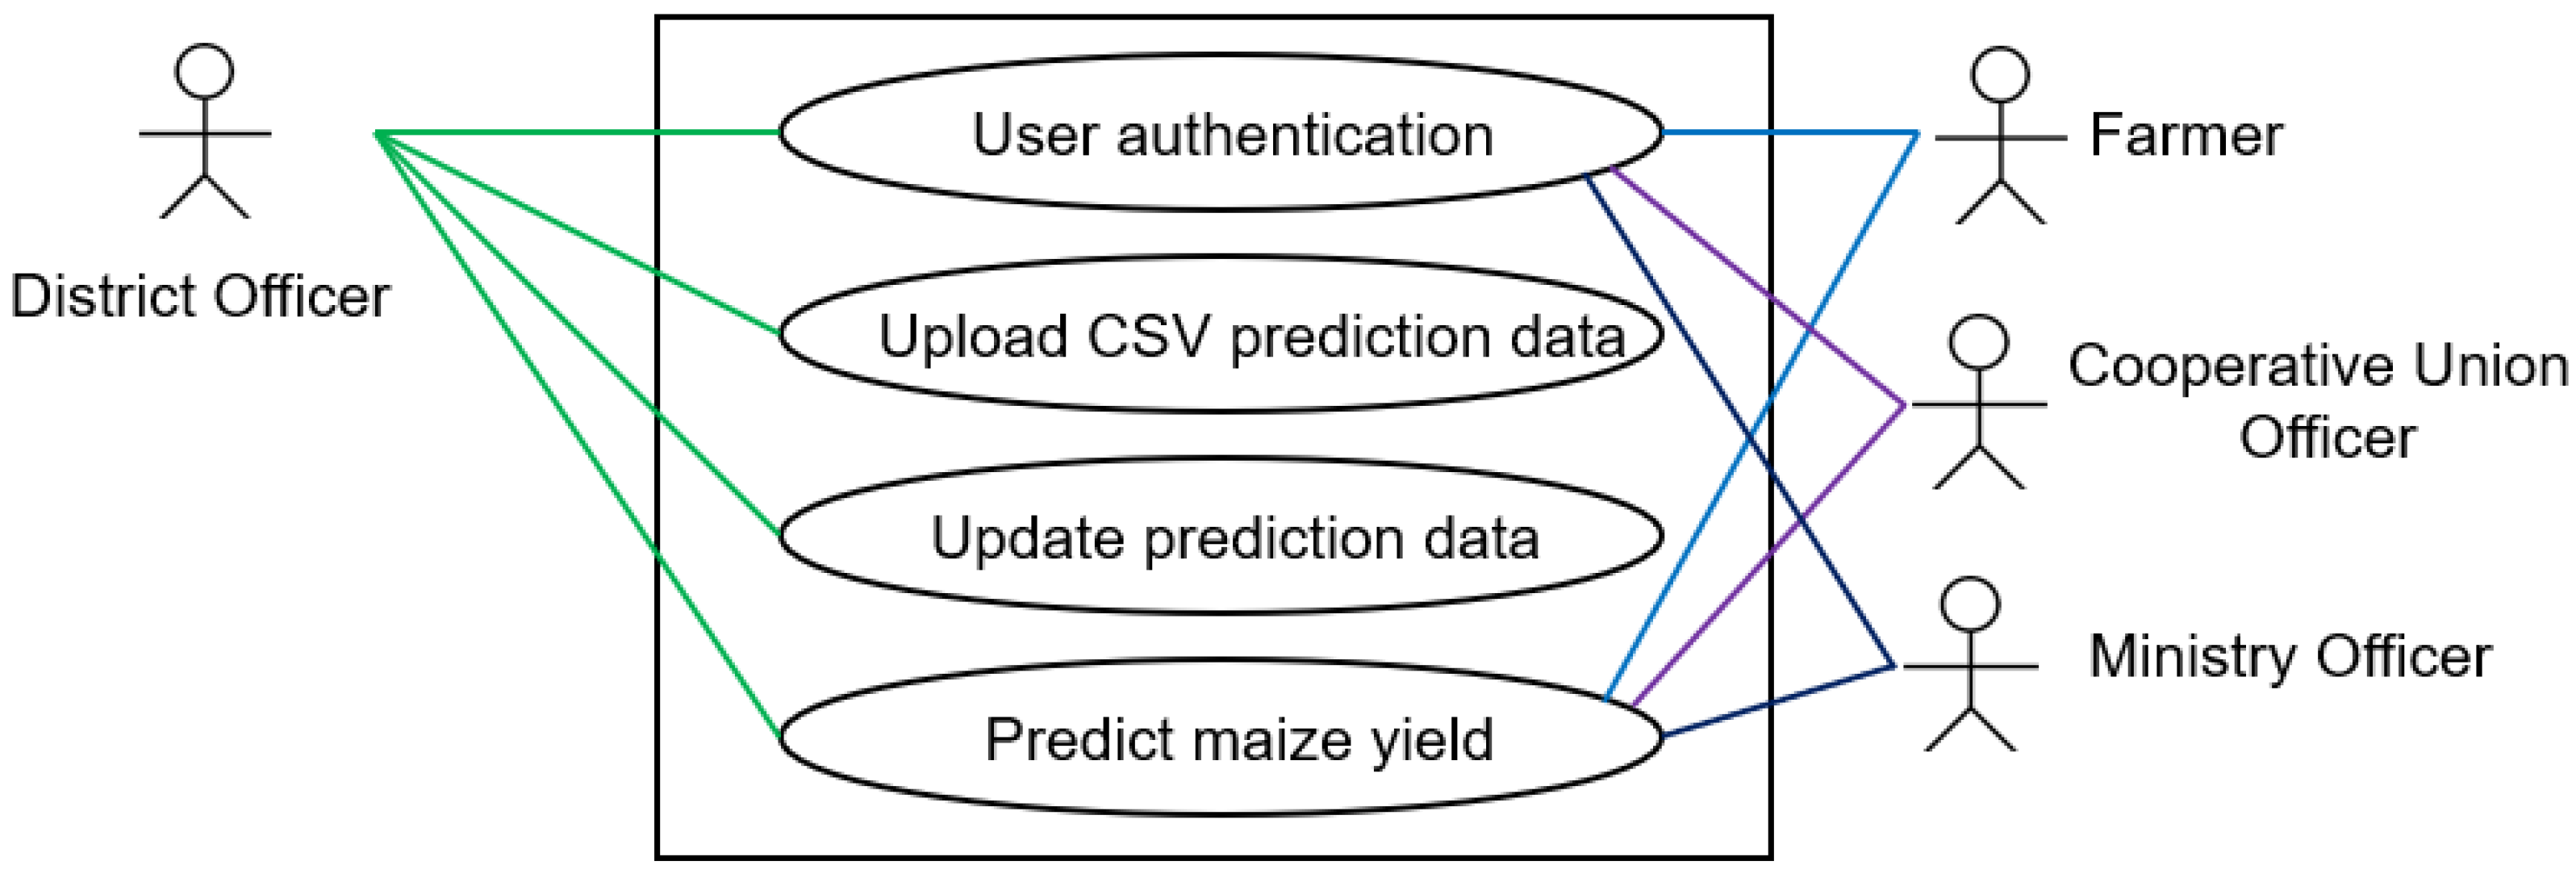
Figure 1. Use case diagram describing users’ functions.
Agriculture 13 00627 g001
Figure 2. Sequence diagram for first request of maize yield prediction via SMS.
Agriculture 13 00627 g002
Figure 3. Maize cultivation calendar in Tanzania (Source: [22]).
Agriculture 13 00627 g003
Figure 4. Map of Tanzania in Africa (left) and map of Tanzania districts (right).
Agriculture 13 00627 g004
Figure 5. Waterfall software development model.
Agriculture 13 00627 g005
Figure 6. Mufindi district maize yields from 2002/2003 to 2009/2010 seasons.
Agriculture 13 00627 g006
Figure 7. Mufindi district data features (Maximum Temperature, Minimum Temperature, Soil Moisture, Precipitation and NDVI) from 2002/2003 to 2009/2010 maize seasons.
Agriculture 13 00627 g007
Figure 8. Mufindi district correlation heatmap based on data from 2002/2003 to 2009/2010 maize seasons.
Agriculture 13 00627 g008
Figure 9. Architecture of unimodal and bimodal deep learning models.
Agriculture 13 00627 g009
Figure 10. System design using three-tier architecture.
Agriculture 13 00627 g010
Figure 11. Entity relationship diagram with database design.
Agriculture 13 00627 g011
Figure 12. Top left: Ministry officer requests Liwale district end-of-season maize yield in the Web system. Bottom left: Requested maize yields displayed in the Web system. Right: Farmer signs up and requests and receives Liwale district end-of-season maize yields in Swahili.
Agriculture 13 00627 g012
Figure 13. Average validation MSE in Four-fold cross-validation experiment for unimodal deep model.
Agriculture 13 00627 g013
Figure 14. Average validation MSE in Four-fold cross-validation experiment for bimodal deep model.
Agriculture 13 00627 g014
Figure 15. Final training MAPE of unimodal deep learning model.
Agriculture 13 00627 g015
Figure 16. Final training MAPE of bimodal deep learning model.
Agriculture 13 00627 g016
Table 1. Tanzania districts whose data were used to train and test deep learning models.
Rainfall ModalRegionDistricts
UnimodalDodomaKondoa and Mpwapwa
IringaLudewa, Makete, and Mufindi
LindiKilwa, Lindi Rural, Lindi Urban, Liwale, Nachingwea, and Ruangwa
MbeyaChunya, Kyela, Mbarali, Mbeya Rural, and Mbeya Urban
SongweIleje and Mbozi
MorogoroKilombero, Kilosa, Morogoro Rural, Mvomero, and Ulanga
MtwaraMasasi, Mtwara Rural, Mtwara Urban, Newala, and Tandahimba
RukwaNkasi, Sumbawanga Rural, and Sumbawang Urban
RuvumaMbinga, Namtumbo, Songea Rural, Songea Urban, and Tunduru
SimiyuBariadi, Maswa, and Meatu
ShinyangaKahama, Kishapu, Shinyanga Rural, and Shinyanga Urban
GeitaBukombe
SingidaIramba, Manyoni, and Singida Rural
TaboraIgunga, Nzega, Sikonge, Tabora Urban, Urambo, and Uyui
BimodalArushaKaratu, Ngorongoro, and Monduli
Dar es SalaamIlala, Temeke, and Kinondoni
KageraMuleba
KigomaKasulu, Kibondo, and Kigoma Rural
KilimanjaroHai, Moshi Rural, Mwanga, Rombo, and Same
ManyaraHanang, Kiteto, and Simanjiro
MaraBunda and Serengeti
MwanzaIlemela, Kwimba, Magu, Misungwi, Sengerema, and Ukerewe
PwaniBagamoyo, Kisarawe, Mafia, Mkuranga, and Rufiji
TangaHandeni, Lushoto, Pangani, and Tanga
Table 2. Liwale and Kiteto district single data points for 2002/2003 maize season.
DistrictDateMax-Temp (°C)Min-Temp (°C)Precipitation (mm)Soil-Moisture (mm)NDVIYield (Tonne/Hectare)
Liwale11/1/200231.0222.31107.530.680.48 
12/1/200230.9222.28140.8450.020.57 
1/1/200329.6622.66170.3999.030.7 
2/1/200330.2822.38132119.280.76 
3/1/200330.4722.34109.86115.90.78 
4/1/200329.621.3982.24103.640.78 
5/1/200328.320.137.0381.240.750.32
Kiteto9/1/200227.0713.5715.214.670.31 
10/1/200228.7815.1648.0212.870.29 
11/1/200229.516.5436.5911.480.31 
12/1/200229.0716.81142.1741.150.38 
1/1/200329.1316.450.5827.170.52 
3/1/200329.616.4156.6617.350.61 
4/1/200328.8217.0646.3514.830.65 
5/1/200325.5315.5283.5518.730.63 
6/1/200325.3914.117.2514.70.520.53
Disclaimer/Publisher’s Note: The statements, opinions and data contained in all publications are solely those of the individual author(s) and contributor(s) and not of MDPI and/or the editor(s). MDPI and/or the editor(s) disclaim responsibility for any injury to people or property resulting from any ideas, methods, instructions or products referred to in the content.