Article

Real-Time Kinematic Imagery-Based Automated Levelness Assessment System for Land Leveling

1
Division of Crop Rotation Research for Lowland Farming, Kyushu-Okinawa Agricultural Research Center, National Agriculture and Food Research Organization, 496 Izumi, Chikugo, Fukuoka 833-0041, Japan
2
Division of Intelligent Agricultural Machinery Research, Institute of Agricultural Machinery, National Agriculture and Food Research Organization, 1-31-1 Kannondai, Tsukuba, Ibaraki 305-0856, Japan
*
Author to whom correspondence should be addressed.
Agriculture 2023, 13(3), 657; https://doi.org/10.3390/agriculture13030657
Submission received: 7 February 2023 / Revised: 6 March 2023 / Accepted: 8 March 2023 / Published: 11 March 2023
(This article belongs to the Special Issue UAV-Based Remote Sensing: Driving Green Practices in Agriculture)

Abstract

:
Many cropping systems, notably for rice or soybean production, rely largely on arable land levelness. In this study, an automated levelness assessment system (ALAS) for evaluating lowland levelness is proposed. The measurement accuracy of total station, real-time kinematic (RTK) receiver, and RTK unmanned aerial vehicle (UAV) instruments used at three study sites was evaluated. The ALAS for assessing the levelness of agricultural lowlands (rice paddy fields) was then demonstrated using UAV-based imagery paired with RTK geographical data. The ALAS (also a program) enabled the generation of an orthomosaic map from a set of RTK images, the extraction of an orthomosaic map of a user-defined field, and the visualization of the ground altitude surface with contours and grade colors. Finally, the output results were obtained to assess land levelness before and after leveling. The measurement accuracy results of the instruments used indicated that the average horizontal distance difference between RTK-UAV and total station was 3.6 cm, with a standard deviation of 1.7 cm and an altitude root mean squared error of 3.3 cm. A visualized ground altitude surface and associated altitude histogram provided valuable guidance for land leveling with the ALAS; the ratios of the ground altitude of ±5 cm in the experiment fields (F1 and F2) increased from 78.6% to 98.6% and from 71.0% to 96.9%, respectively, making the fields more suitable for rice production. Overall, this study demonstrates that ALAS is promising for land leveling and effective for further use cases such as prescription mapping.

1. Introduction

Level arable lands, particularly lowland fields, are advantageous for maintaining the same water-holding capacity or moisture level in the field. However, soil movement caused by machinery-based land preparation or natural disasters (e.g., frequent floods) can induce shifts in field levelness. In lowlands where rice (Oryza sativa L.) is cultivated, uneven ground usually causes excessive shallow water in elevated areas or excessive deep water in low-lying areas, making water management and weed–pest control difficult throughout the growing season. The high likelihood of weed occurrence in convex areas (water-nonpenetrating areas) also makes weed control difficult. Furthermore, in uneven lowlands where wheat (Triticum aestivum L.) or soybean (Glycine max. (L.) Merr.) is cultivated, wet injury to crops often occurs in low elevation areas [1,2] that are readily saturated with water when heavy rainfall, flooding, and poor drainage occur. Notably, precision land leveling is extensively recognized as an efficient method for eliminating uneven ground [3].
Land leveling entails modifying a piece of land’s topography to create a more even surface and irrigation by regulating the amount of water resources and reduces the time and labor inputs required for field management in rice-growing lowlands. However, conducting precision land leveling at an origin rice paddy with slightly uneven areas is extremely challenging when decisions regarding soil cuts and fills are based solely on the operator’s view on a moving tractor equipped with a laser leveler. Generally, precision land leveling includes assessing the target field levelness in advance and then performing leveling operations to meet the levelness assessment criteria. In Japan, the recommended criterion for rice paddy fields is an elevation difference within ±5 cm or ±3.5 cm from the mean horizontal plane [3] or an elevation standard deviation below 2 cm [4]. This criterion may vary with land use or crop type.
Conventional survey methods applicable to centimeter-level land surveys include the use of total stations (TSs), theodolites, and global navigation satellite system (GNSS) receivers to collect accurate geographic data [5]. However, these methods are often time-consuming and cost-inefficient for field data collection, and their measurement accuracy is limited to sample points and not the entire land area. They are also unavailable for locations where human access may be difficult or dangerous. Although advanced survey methods based on laser imaging detection and ranging [6,7] and terrestrial laser scanners [8,9] can acquire high-spatial geographic data in a streamlined format of the scanned area, they are inefficient and expensive [10,11,12,13]. Despite their high efficiency in surveying arable lands in large areas [14], satellite imagery-based survey methods are insufficiently effective, as the spatial resolution in meters per pixel [15,16] cannot distinguish centimeter-level differences in lowland fields.
Unmanned aerial vehicle (UAV) photogrammetry for land surveying—a viable alternative devoid of the aforementioned drawbacks—has been increasingly employed to conduct high-quality and efficient ground surface surveying [17,18]. Notably, a photogram-metric image processing technique of structure from motion (SfM) [19] paired with UAV photogrammetry can produce a digital terrain model (DTM) and a 3D point cloud comprising a set of points with geographic or distance data. In [18], the authors used SfM to assess land leveling with a non-real-time kinematics (RTK) UAV and numerous ground control points (GCPs), achieving high measurement accuracy with a root mean square error (RMSE) of 0.11 m. However, setting and measuring GCPs was a time-consuming task. Nonetheless, the accuracy was deemed sufficient for assessing levelness in lowland areas, particularly in rice paddy fields.
Since the UAV was equipped with an RTK receiver, RTK-UAV-based photogrammetry has become an increasingly common technology for monitoring and surveying applications. When non-RTK aerial imagery is employed, DTM accuracy relies largely on the number and geographic distribution of GCPs [20]. In contrast, when RTK aerial imagery is used without geo-referencing to any GCPs, the DTM’s horizontal accuracy can reach a few centimeters, although high vertical accuracy still requires geo-referencing to GCPs [21,22]. However, the topographical features of our study areas, the differences between using a base station or a network RTK connection, and the advances in UAV specifications did not meet our requirements for assessing field levelness in rice paddy fields.
As reported in [23], the vertical accuracy can be improved by flying the UAV at a higher altitude above ground level (AGL), and this improvement is particularly noticeable in flat terrain such as lowlands. This has prompted us to consider a research methodology that directly assesses the levelness of flat rice paddy fields using RTK-fixed aerial imagery without the need for GCPs and complicated professional knowledge. Despite UAV photogrammetry’s several advantages, such as low cost, fast surveying, and ultra-fine accuracy, the professional knowledge required for aerial image processing and data analysis impedes its widespread use among common farmers. Regarding level assessment for lowland fields, the major procedures for generating assessment results include flight conduct for aerial image acquisition, photogrammetric ground surface generation, and level assessment for the surveyed fields, each of which requires optimizing parameter settings for high accuracy. Cloud-based platforms for data processing, such as PIX4D cloud, Drone Deploy, and AGRON maps, have provided facilitative solutions to generate DTM, orthomosaic or vegetation indices [24,25]. However, given the demand for high-quality level assessment of several centimeter criteria, a customizable platform that allows for parameter optimization and easy-to-understand report export is needed for our practical application case, especially for level assessment for land leveling decision-making.
This study focuses on the highlights of an automated levelness assessment system (ALAS) for UAV photogrammetry and successful demonstrations of ALAS effectiveness for practical land leveling in lowland fields. At the study sites, levelness assessments based on ALAS were conducted on two rice paddy fields to achieve the following aims:
(1) assessing the measurement accuracy of TS, GNSS-receiver, and RTK-UAV and evaluating the possibility of ground surface generation without GCP utilization; (2) designing and developing ALAS; and (3) demonstrating the levelness assessment for the surveyed fields using the proposed ALAS. Finally, the robustness and extensibility of ALAS as well as practical application case notices were discussed, followed by conclusions.

2. Materials and Methods

2.1. RTK Techniques

In this study, we used RTK techniques to obtain precise position data for our field measurements. RTK is a type of GNSS-based positioning technique that uses one or more base stations to provide corrections to the GNSS position signal in real-time, generally resulting in accurate and precise position data in centimeter-level accuracy. Based on the usage of base station, several typical RTK techniques can be organized into Table 1.
In our study area (Figure 1), located in southwestern Japan, the use of VRS or RRS is popular for precise positioning applications, whereas PIV-RTK and PPP-RTK are still emerging techniques with limited service providers.

2.2. The Study Sites

The study sites S1 and S2 were at the Okinawa Prefectural Agricultural Research Centre, Itoman, Okinawa, and the Kyushu Okinawa Agricultural Research Centre, NARO, Chikugo, Fukuoka, respectively. The measurement accuracy of the used measuring instruments was tested on S1 and S2, including the not-use GCP case. The S1 fields were typical uplands for growing sugarcane (Saccharum officinarum L.), with a slightly sloping ground surface within each field and grade elevation between fields, whereas the S2 and S3 fields were typical flat lowlands for growing crops suitable for a double cropping system.
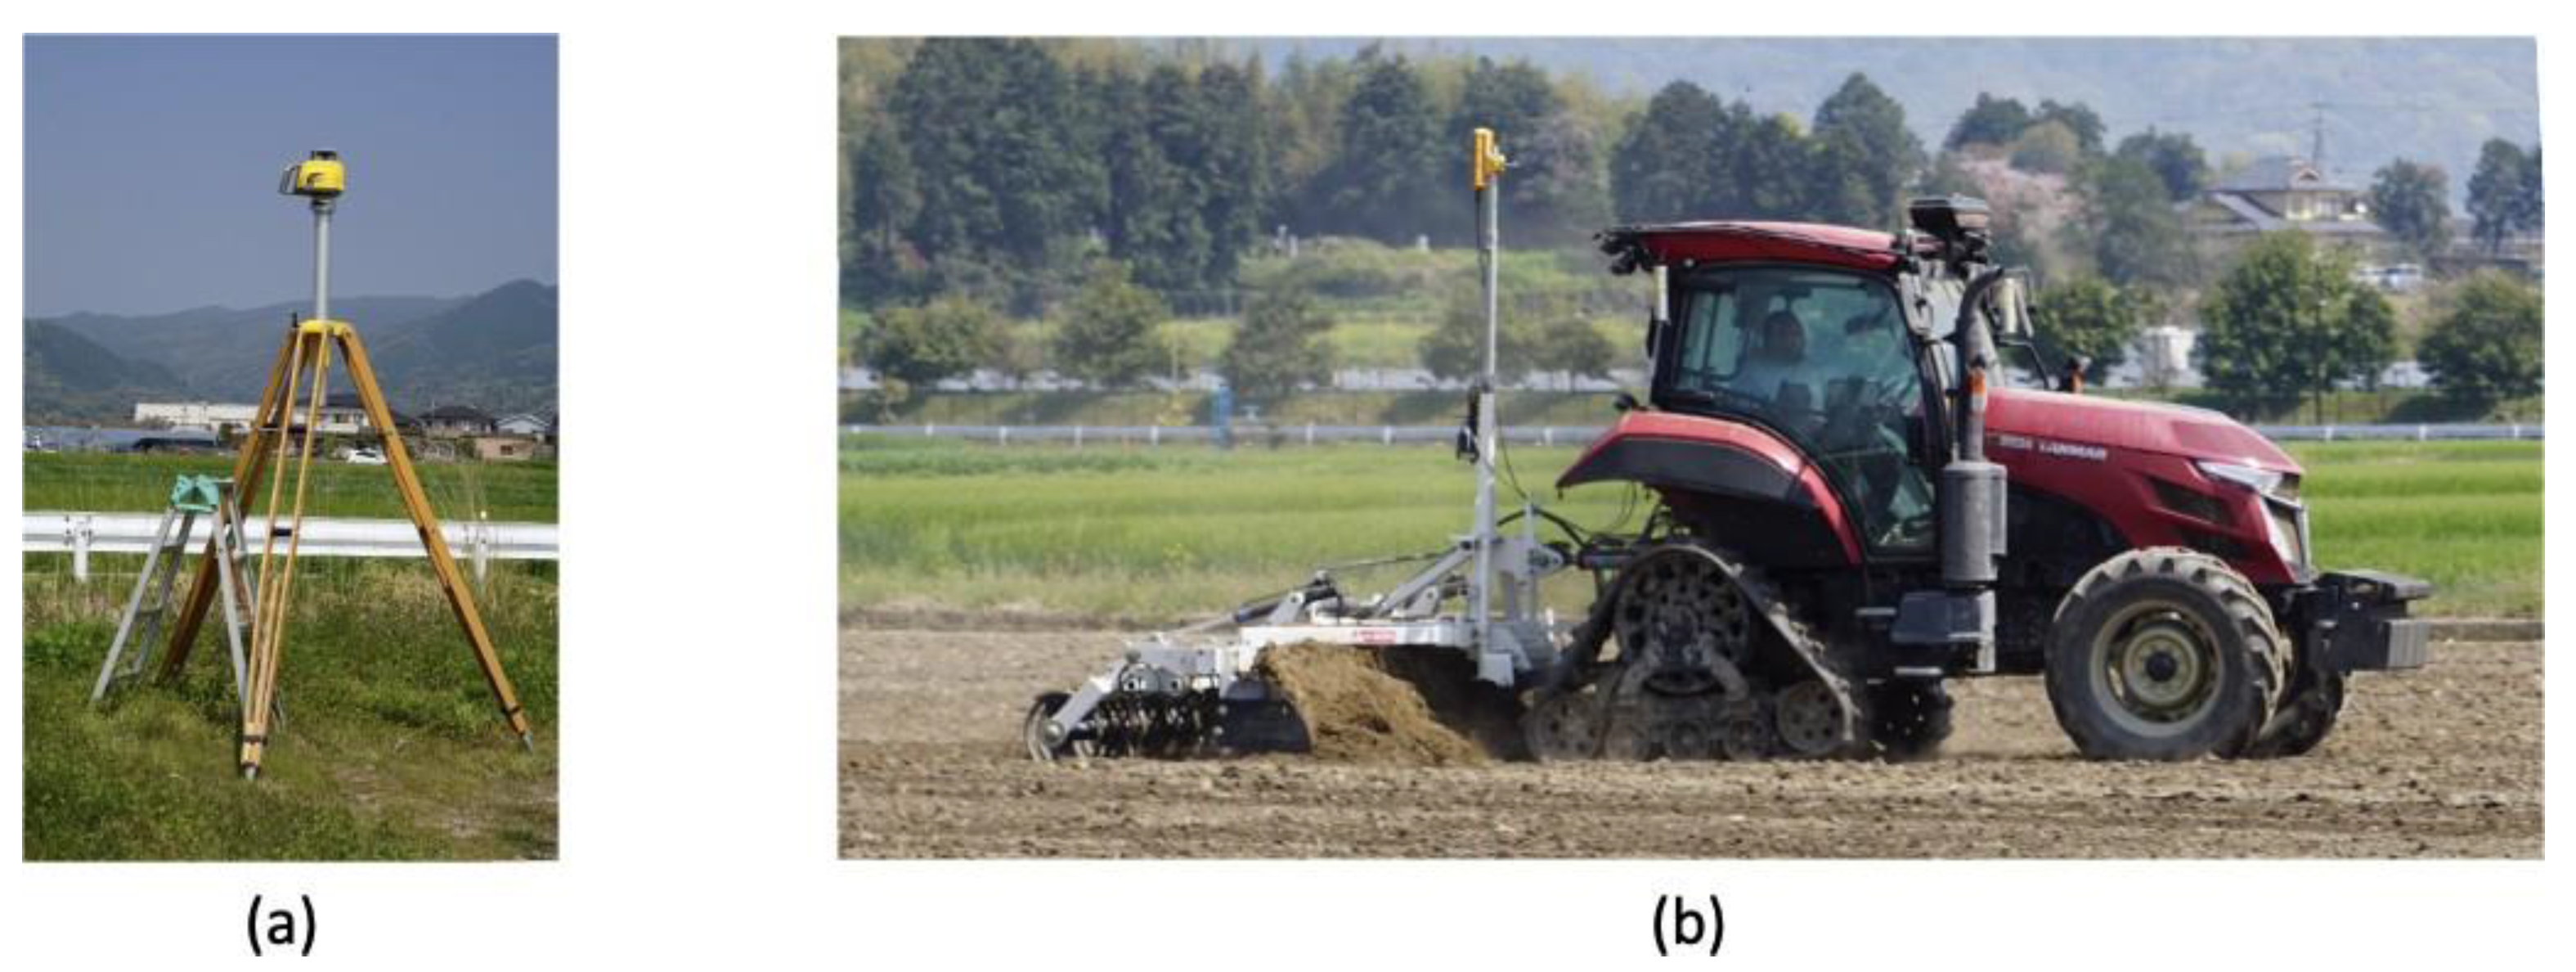
Double cropping in the lowland accounted for the greatest proportion in this area (S2 and S3 around). It is a common farming technique to grow rice and soybean in summer from late May to October and wheat or barley (Hordeum vulgare L.) in winter from November to mid-May in the same field. Because field levelness often varies due to field consolidation, land preparation, or flood disasters during season-to-season crop rotation, agricultural corporation decision-makers at S3 prioritize land leveling. They modify the cultivation plan for the winter season in order to conduct land leveling on uneven fields, relying on UAV-based level assessments of the fields or daily observations of water depths in flood rice paddies. Land leveling was conducted using a laser leveler (L4011A, Sugano, Ibaraki, Japan) (Figure 2) that was equipped with a laser transmitter and leveler unit with a laser receiver by projecting a laser beam across the surface at the same altitude. The leveler unit was mounted on a tractor (YT5113A, Yanmar, Osaka, Japan) to create a level ground surface through soil cuts and fills based on the laser beam.

2.3. The Used Instruments and Experimental Conditions

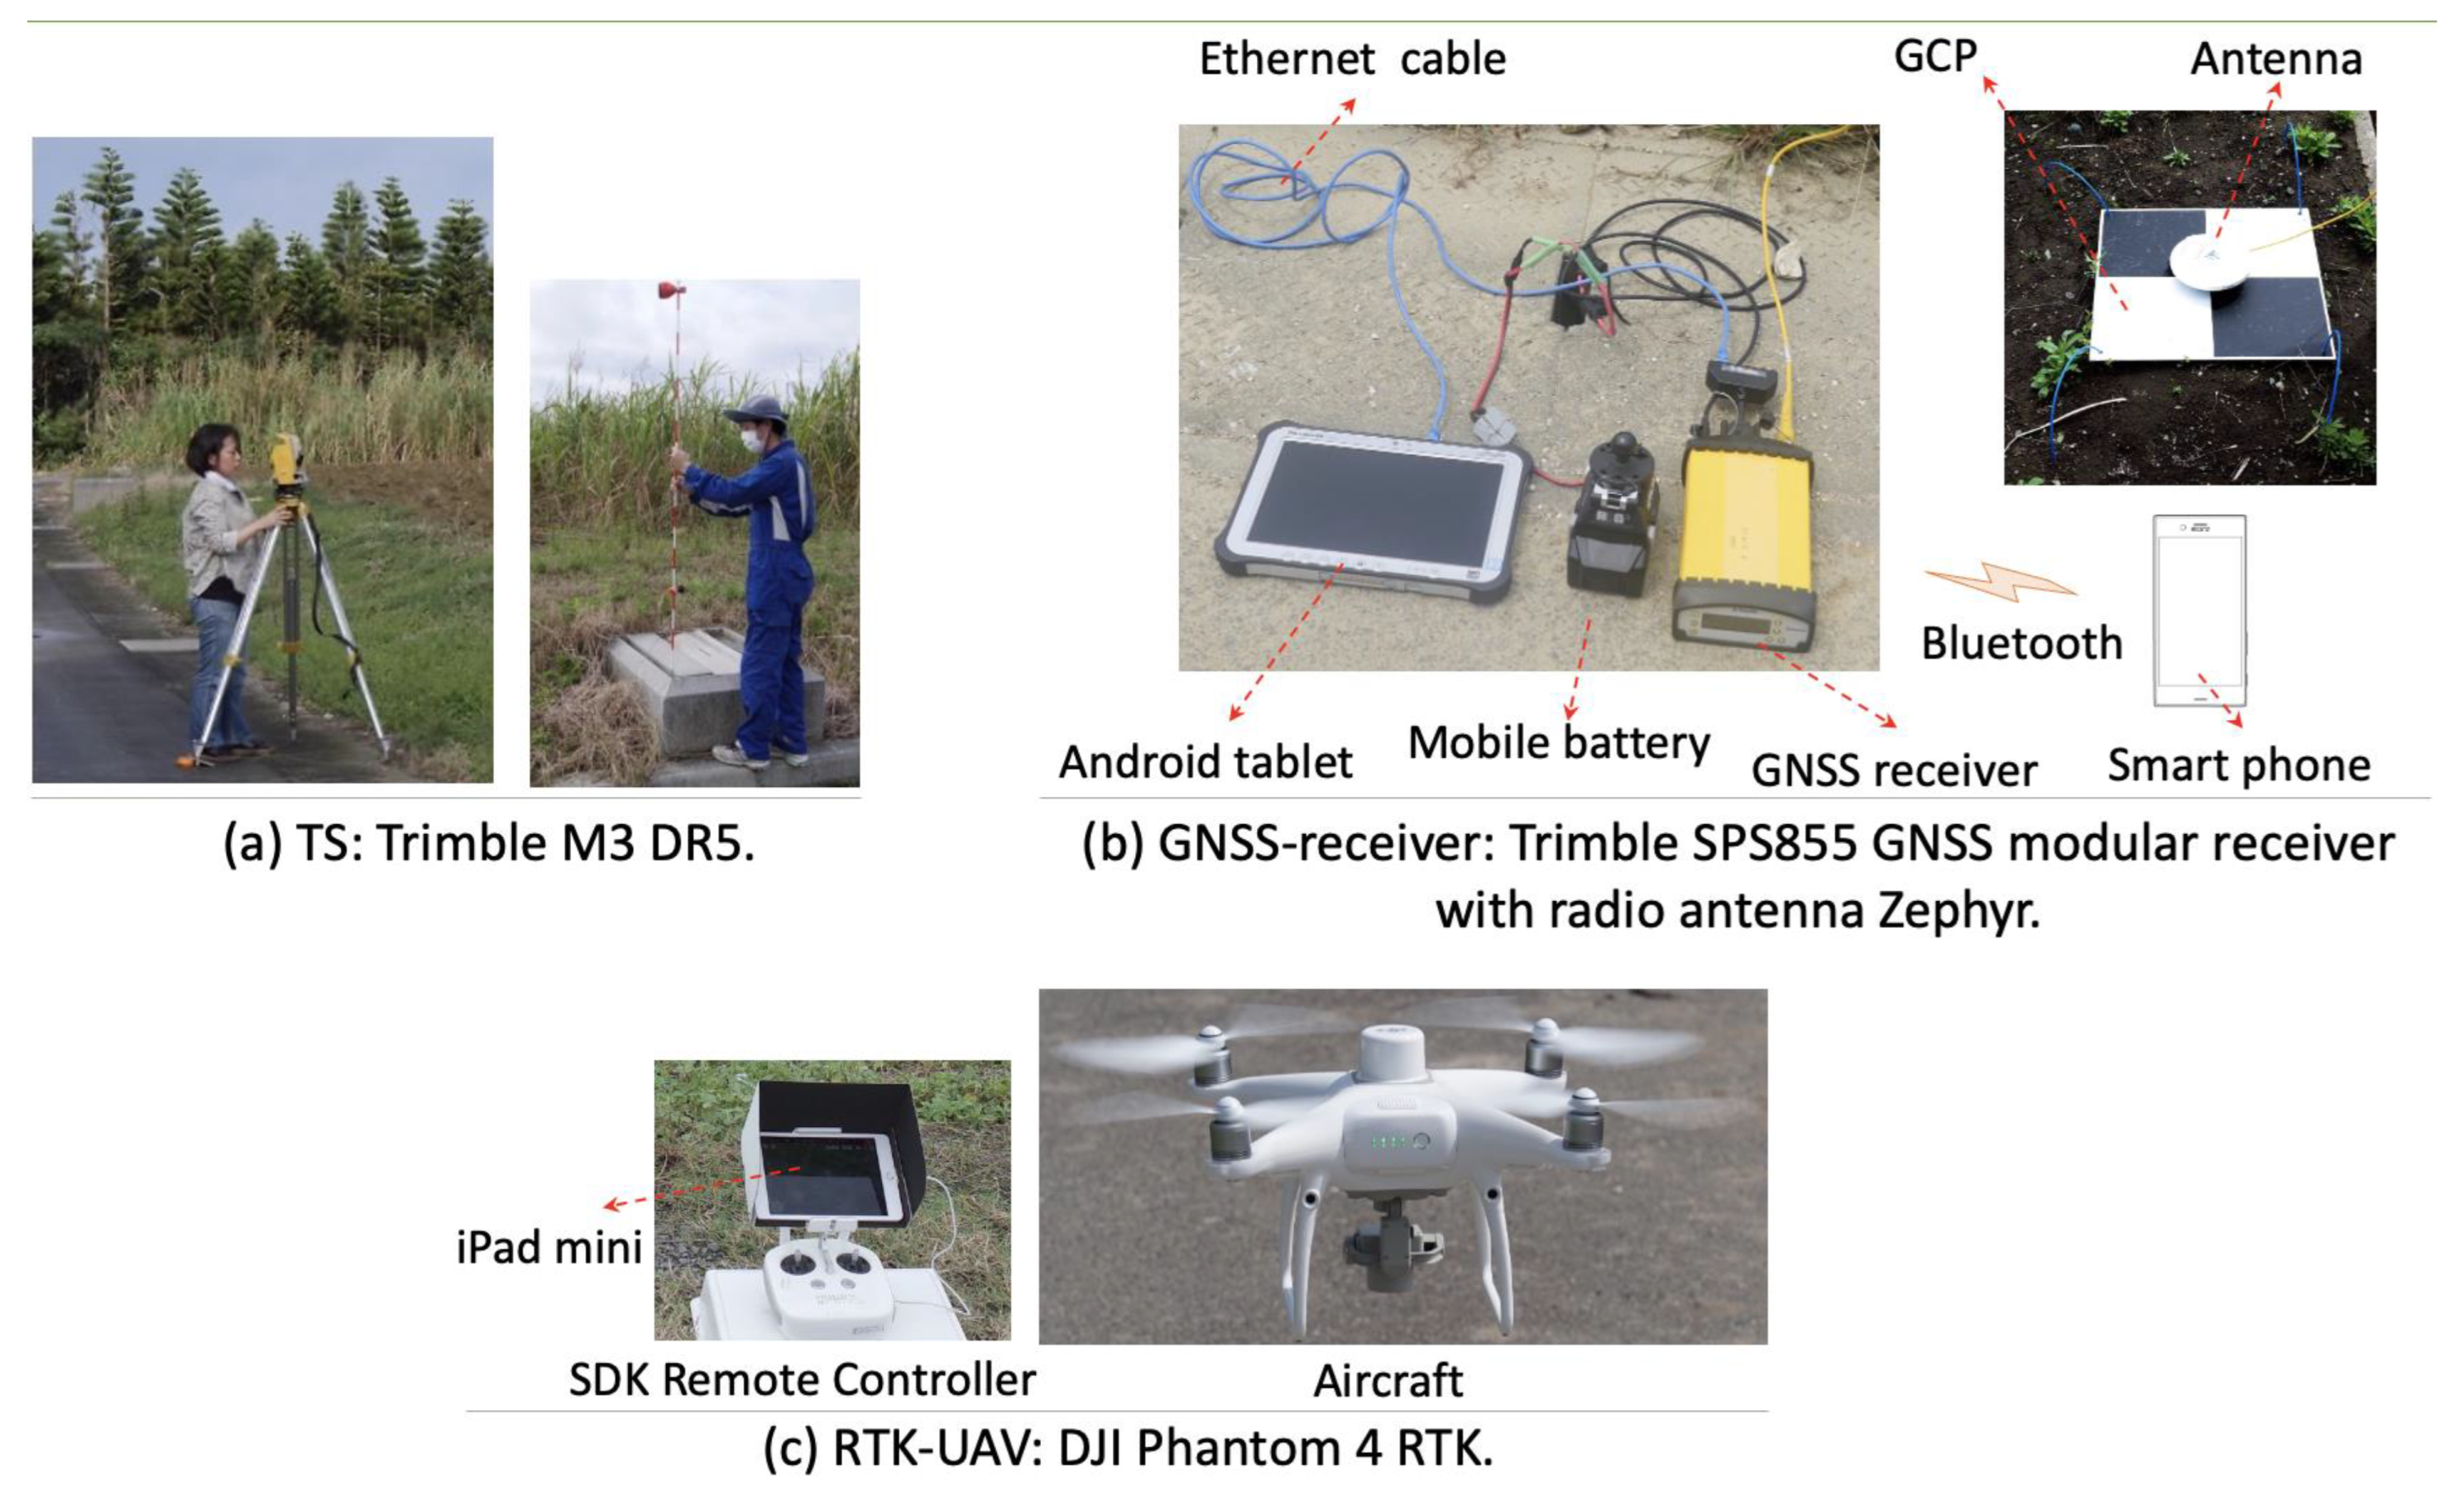
Figure 3 depicts the used instruments in the experiments for three objectives: (1) measurement accuracy comparison between TS (Trimble M3 DR5, Trimble Navigation, OH, USA) and GNSS-receiver (Trimble SPS855 GNSS modular receiver, Trimble Navigation, CA, USA) at both S1 and S2; (2) measurement accuracy comparison between the GNSS-receiver and RTK-UAV (DJI Phantom 4 RTK, DJI, Shenzhen, China), at S2; and (3) field levelness assessment using the RTK-UAV, at S3.
The TS was used to measure the geographical coordinates of the measurement points shown in Figure 4. The raw measured coordinates were set in an arbitrary coordinate system whose origin was the location where the TS was installed. The surveying was conducted using the radiation method and a prism target following the standard procedures outlined in the TS user’s manual. These measurement points were GCP markers or some immovable flat objects dispersed in the study area. In order to avoid interference with the cultivated crops, these measurement points were selected to be evenly distributed around the test field edges or corners. Table 2 lists the experiment date, weather, wind speed, temperature, and coordinate reference system (CRS) of the measured data at S1 and S2. The weather data were obtained from the weather station at S2, as well as from the historical weather data provided by Japan Weather Association.
At the same measurement points at S1 and S2, the geographical coordinates in WGS 84 were measured by the GNSS-receiver. As shown in Figure 3b, the GNSS-receiver, equipped with an antenna (Trimble Zephyr, Trimble Navigation, CA, USA), was set up to receive raw data in national marine electronics association (NMEA) format at a 1 Hz frequency via a Bluetooth link to a smartphone (Xperia XZ, Sony, Tokyo, Japan). An app called “SmarTrip2” was installed on the smartphone and used to connect to a NTRIP server using a VRS service provided by Nippon GPS Data Service corporation (Tokyo, Japan). While the RTK status was fixed, the raw data was recorded into a text file through an Android tablet that was connected to the GNSS receiver via an Ethernet cable.
At S2 and S3, the RTK-UAV was used to photograph the target survey area to acquire a set of aerial images with high precision geographical data. As shown in Figure 3c, we used the SDK remote controller, attached with an iPad mini (Apple Inc., CA, USA), for the flight control. The flight control application used was DJI GS Pro 2.0.16 (10657) running on iOS 13.7. The RTK-UAV photogrammetry was conducted at a 100-m flight altitude AGL, with 80% forward overlap and 75% side overlap, whereas the RTK status was fixed using another VRS service provided by Jenoba Co., Ltd (Tokyo, Japan). The spatial resolution of the RTK-UAV-acquired aerial images was approximately 2.7 cm per pixel.
At S3, the experiments on field levelness assessment were conducted at two lowland fields F1 and F2 with their respective central latitude, and longitude of 33.337575° and 130.375342°, and 33.308242° and 130.353665°. During the winter season, the two fields were devoid of vegetation for the land leveling plan. In 2021, the RTK-UAV flights were conducted at F1 on 15 January before leveling, on 19 March after the first leveling, and on 2 June after the final leveling. On the other hand, in 2022, the flights at F2 were conducted on 21 January before leveling and 9 June 2022 after leveling.
In order to compare the measured coordinates in a same CRS, we converted the TS-recorded coordinates using the procedure of axis transformation and rotation, as follows:
  • Calculate the center point ( x ¯ p, y ¯ p) of all the RTK-UAV-measured points in a universal transverse Mercator (UTM) coordinate system: the UTM zone 52N for our study case.
  • Calculate the angles of θp for all points (xp x ¯ p, yp y ¯ p) (usually by a mathematics function atan2) and their average value θ ¯ p
  • Calculate the center point ( x ¯ t, y ¯ t) of all TS-measured points
  • Calculate the angles of θt for all points (xt x ¯ t, yt y ¯ t) and their average value θ ¯ t
    Calculate the rotation angle of θ by θ = θ ¯ t θ ¯ p
  • Rotate the points (x, y) by x = xt cos θ + yt sin θ, y = −xt sin θ + yt cos θ
  • Transform all the points (x, y) into the UTM coordinate system by x = x + x ¯ p, y = y + y ¯ p
The GNSS-receiver-measured coordinates in WGS 84 were also converted into the UTM zone 52N by a tiny Python program. Using the RTK-UAV images with the geographical data in WGS 84, the coordinates in UTM zone 52N of the measurement points were extracted from the orthomosaic created by the data processing procedure called ALAS.

2.4. Description of Research Methodology

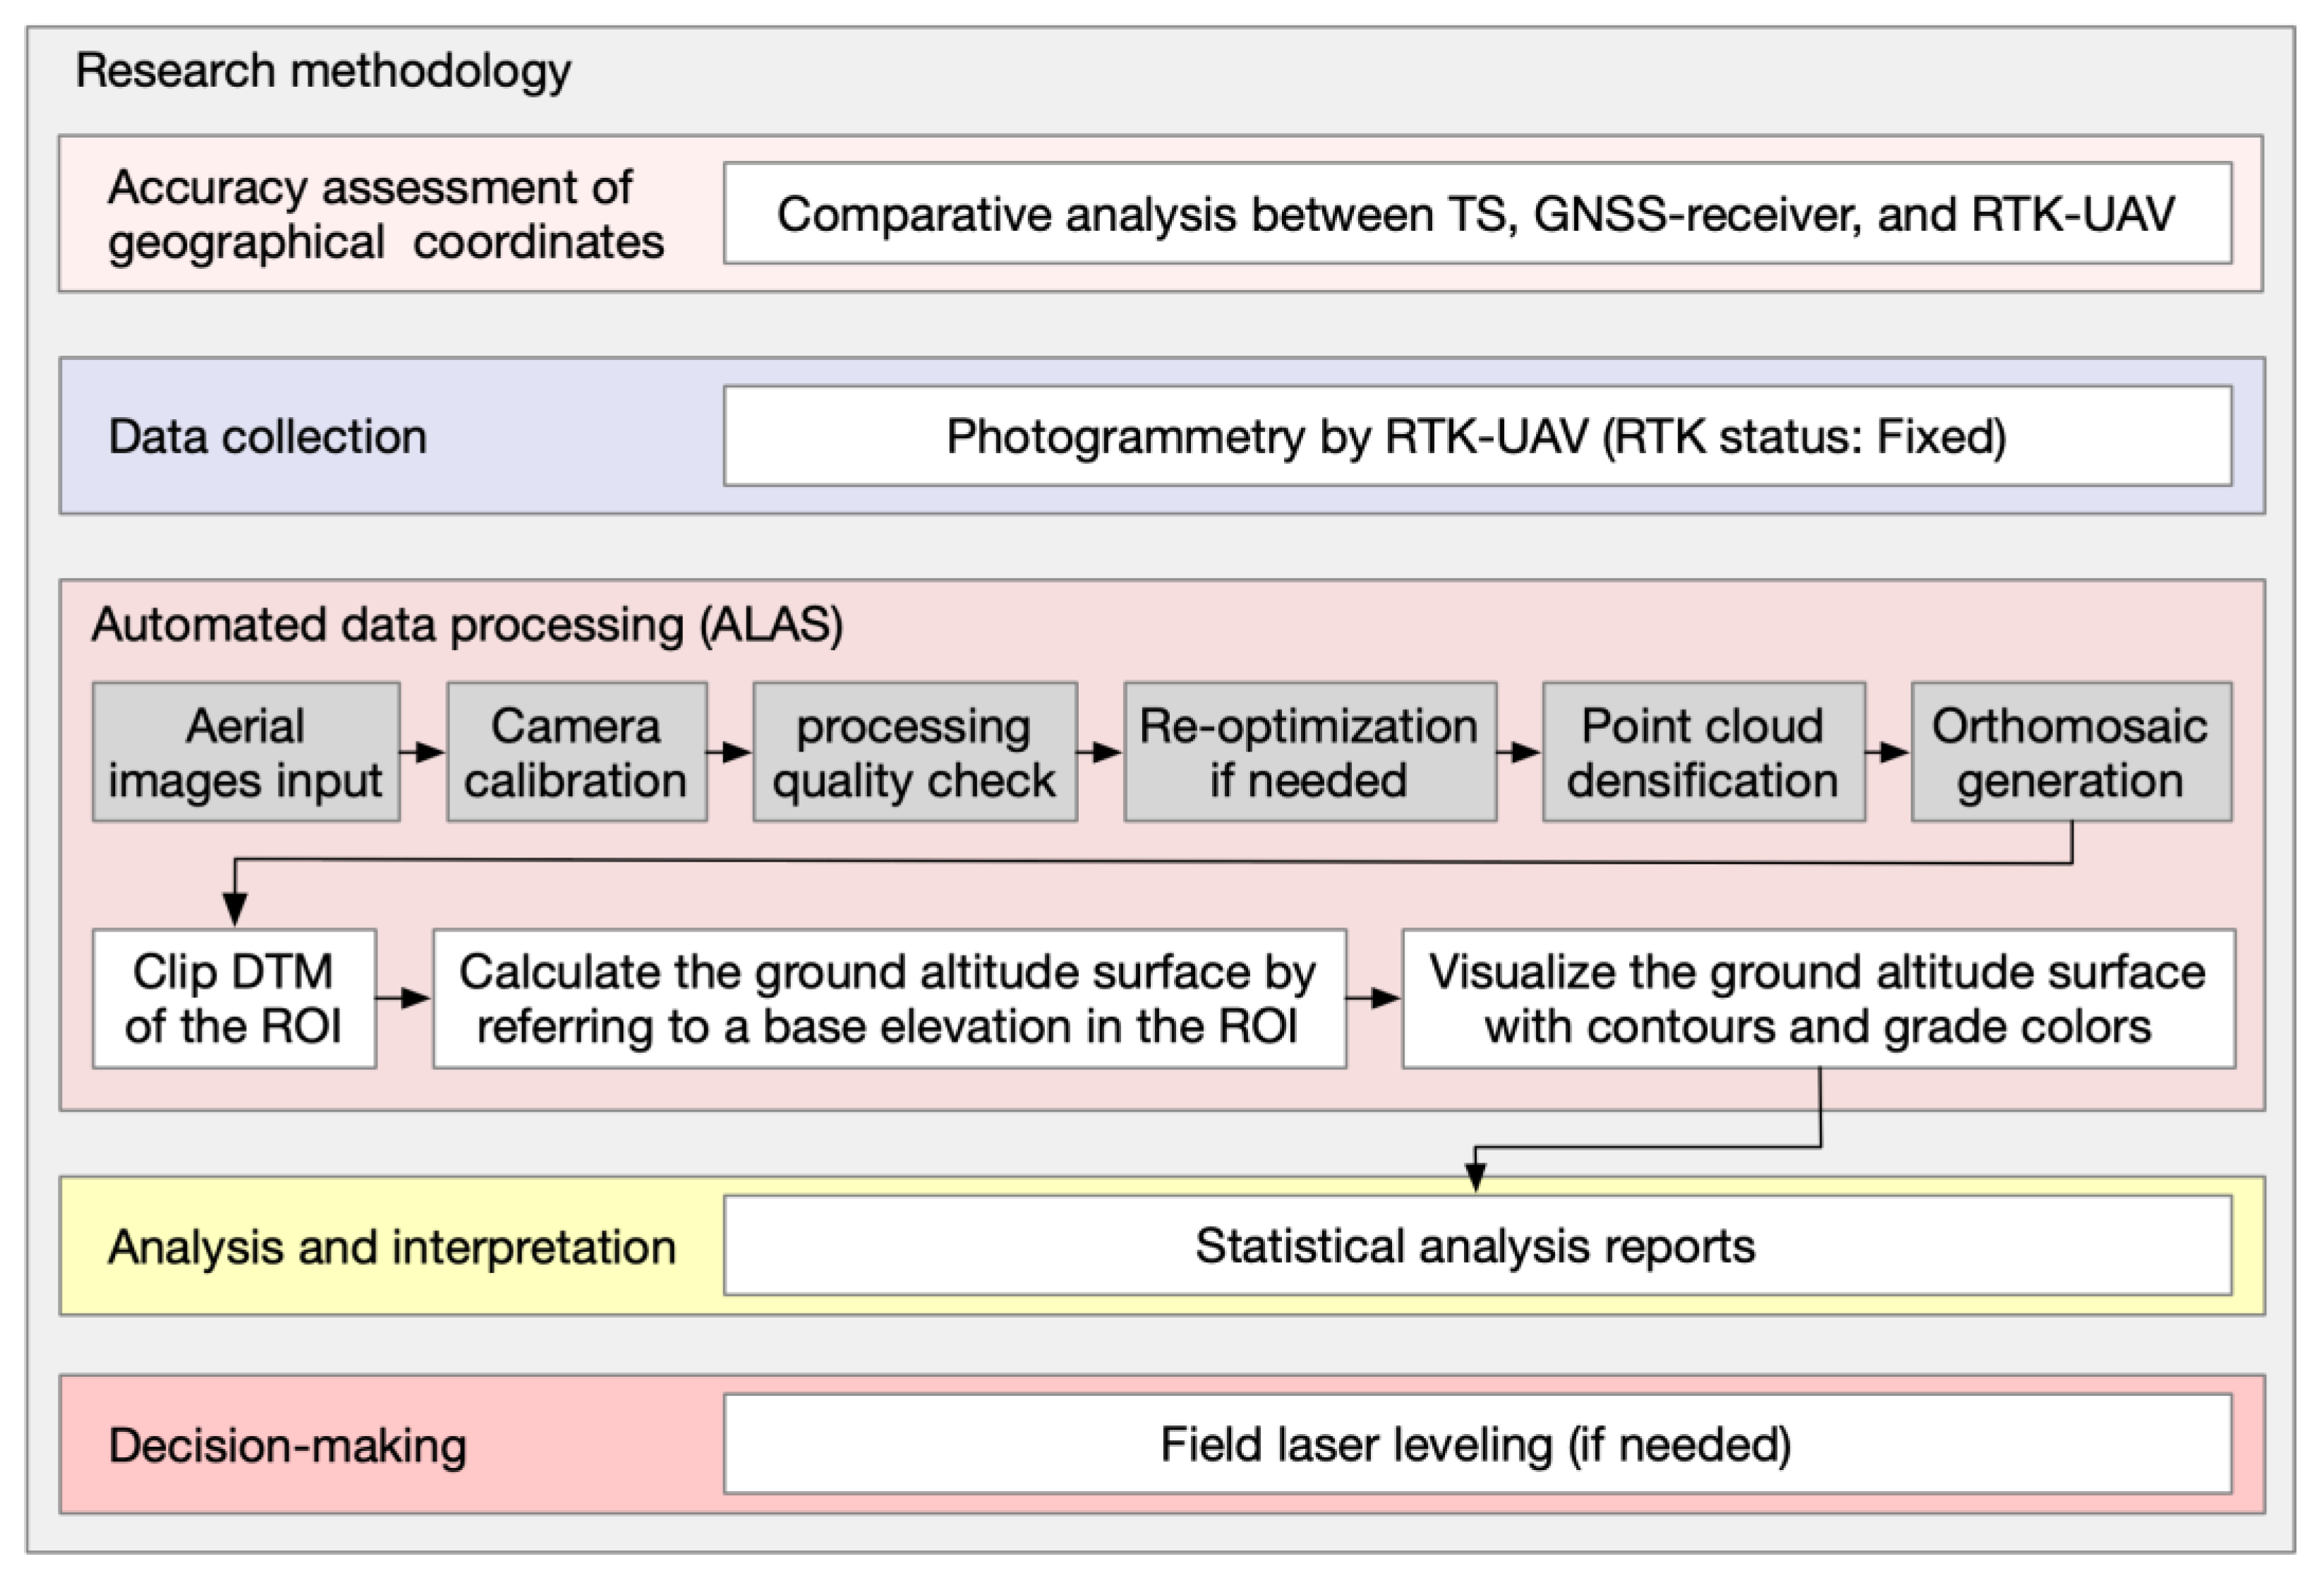
Our research methodology (Figure 5) consists of (1) an accuracy assessment of geographical coordinates measured between the TS, the GNSS-receiver, and the RTK-UAV; (2) data collection by the RTK-UAV photogrammetry; (3) automated data processing called ALAS from the aerial images to automated generation of the ground altitude surfaces of the target field; (4) analysis and interpretation for the field levelness; and (5) decision-making for field laser leveling.
ALAS was developed in the Python 3.6 language with an OS platform of Windows 10 Pro, 64 bits, running on a PC with the specification of an Intel Core i7-8850HK CPU (2.6 GHz, 6 cores), 32 GB of memory, and a graphics accelerator with 1024 GPU cores (NVIDIA Quadro P2000). The program was implemented using a commercial PIX4Dengine SDK 1.4 package [26] and some open-source packages such as GDAL/OGR 3.3.2 [27]. PIX4Dengine SDK provided an interface for customizable configurations and processing controls, which could be accomplished primarily in PIX4D mapper Pro 4.7.5—a processional end-user’s SfM software developed by the same provider. For example, the interval camera calibration could be checked and re-optimized by its callback interface; the processing steps for camera calibration, densification mesh, and orthomosaic or index maps could be fully customized; and the output data format and quality could be predefined by the user’s source code. The GCP markers could also be distinguished by its automarking module.
The procedures in ALAS from “Aerial images input” to “Orthomosaic generation”, powered by PIX4Dengine SDK, generate an orthomosaic along with a digital surface model (DSM), DTM, or index maps based on the predefined configurations. For each observation field piece, the field geometry called the region of interest (ROI) is created in advance using free and open-source software QGIS 3.28.0 [28] and is used in the subsequent procedure “Clip DTM of the ROI”. With the clipped DTM, the next procedure is to calculate the ground altitude surface in centimeter units by referring to a base elevation in the ROI, which is typically calculated from the minimum or mean elevation of the observation field. Finally, ALAS ends with a visualization of the ground altitude surface. For bare land, the ground surface represented both DSM and DTM. Accordingly, DTM was used instead of DSM to calculate the ground altitude surface.
In addition to Python, the programming language R 4.2.2 running on an integrated development environment of RStudio build 576 (RStudio, PBC) was used for the subsequent statistical analysis of the ALAS output results and measurement accuracy of tested instruments.

3. Results

3.1. Comparisons of the Measurement Accuracy for the TS, the GNSS-Receiver and the RTK-UAV Instruments

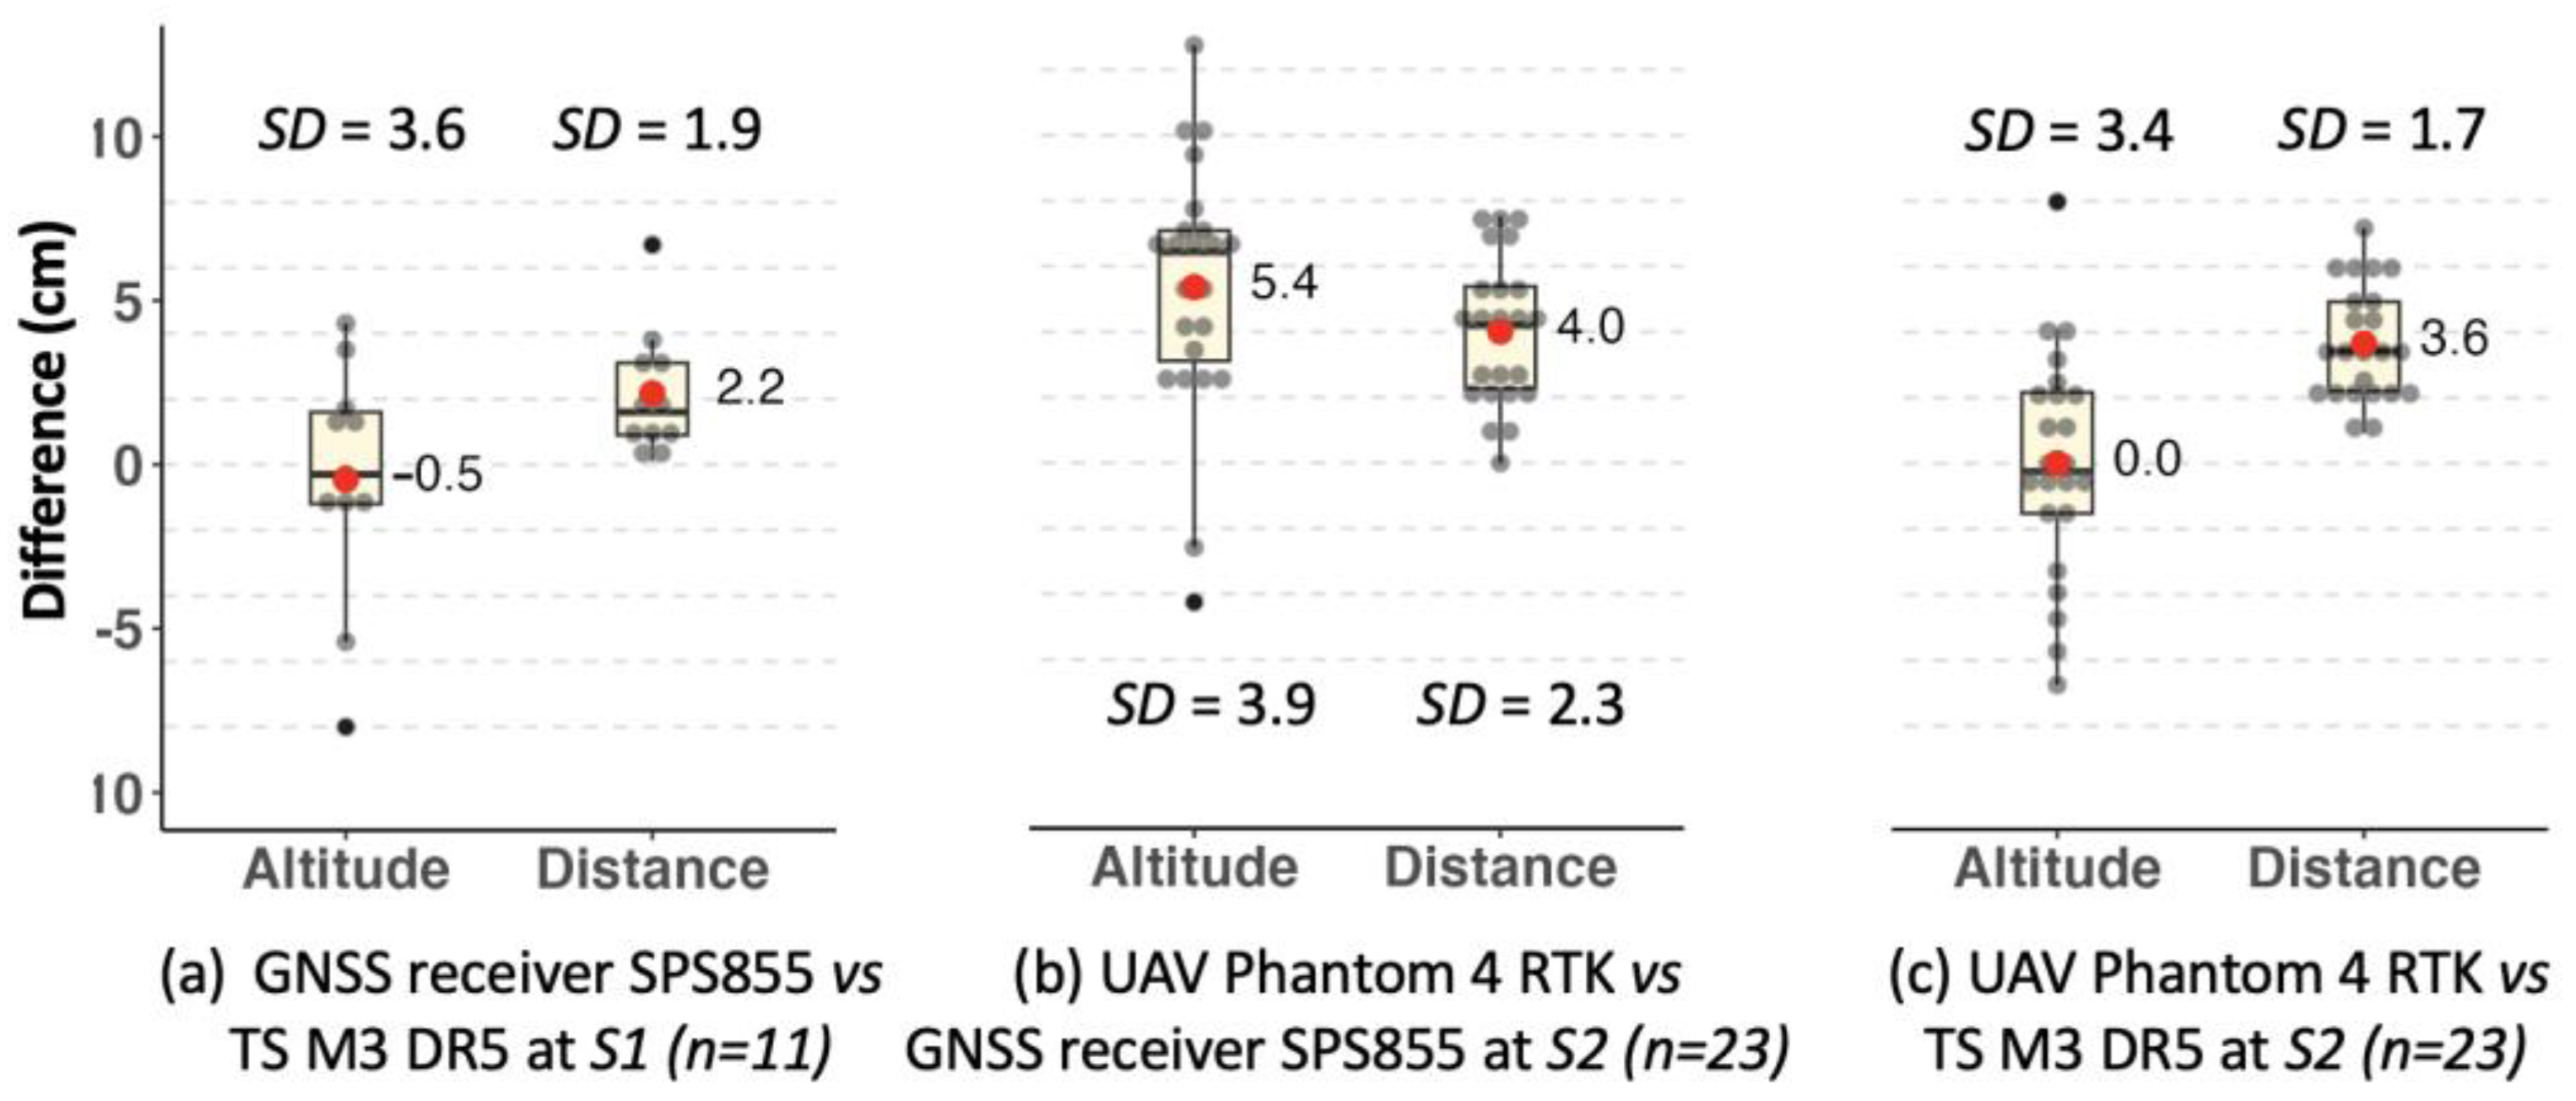
Figure 6 shows three groups of box-and-whisker diagrams depicting the differences measured between the TS, the GNSS-receiver, and the RTK-UAV instruments. Each diagram corresponds to one of the datasets of the comparison results at the measurement points and comprises six parts: the box denotes the interquartile range, the lower whisker represents the range to the minimum value, the upper whisker represents the range to the maximum value of the measurement data, the horizontal line drawn in the box midpoint denotes the middle value, and the outliers denote data outside the whisker boundary and gray dots denote data distribution. The red dots with labels represent the average difference values.
At site S1 (Figure 6a), the average altitude and distance differences between the GNSS-receiver and the TS at the 11 measurement points were −0.5 and 2.2 cm, with the corresponding standard deviations of 3.6 and 1.9 cm, respectively. The distance difference was calculated by subtracting the TS-measured distance between the measurement point and a base point from the RTK-receiver-measured distance between the measurement point and same base point. Compared to the relatively small difference in distance, the altitude difference ranged from −8 cm to 4.3 cm, indicating moderate instability when using the GNSS-receiver.
This instability was also observed in the altitude accuracy measurement conducted at S2 for the RTK-UAV vs the GNSS-receiver and vs the TS. In the subfigures of Figure 6b,c, the average altitude differences at the 23 measurement points were 5.4 and 0.0 cm, with the corresponding standard deviations of 3.9 and 3.4 cm, respectively. The average distance difference of 3.6 cm with the corresponding standard deviation of 1.7 cm for comparison between the RTK-UAV and the TS was slightly smaller than the corresponding values of 4.0 and 2.3 cm for comparison between the RTK-UAV and the GNSS-receiver.
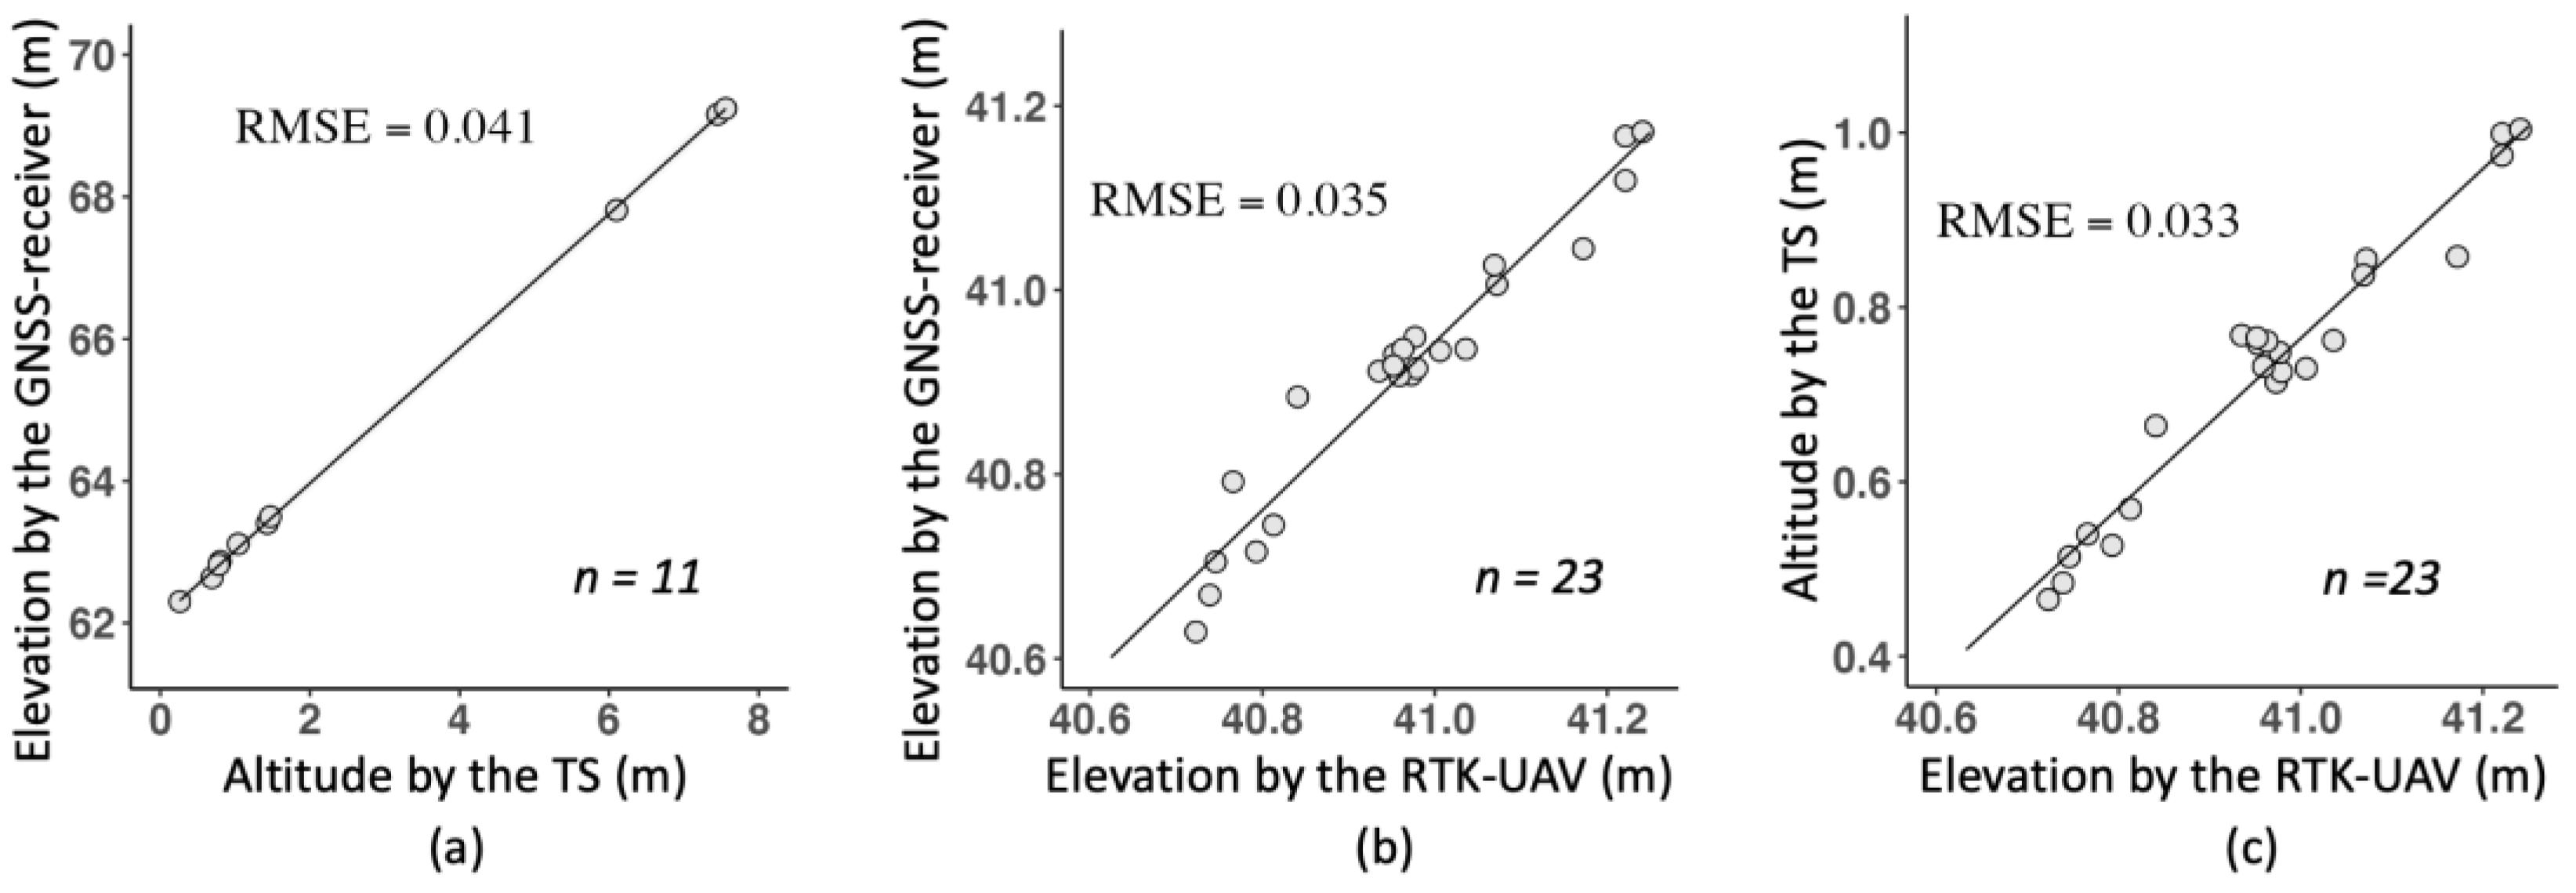
The results of RMSE comparisons between the TS, the GNSS-receiver, and the RTK-UAV are plotted in Figure 7a–c at the same corresponding study site in the subfigures of Figure 6a, Figure 6b, and Figure 6c, respectively. The RMSE value between the TS and the RTK-UAV at S2 (Figure 6c) reached 3.3 cm, which was slightly smaller than those in both Figure 7a 4.1 cm and Figure 7b 3.5 cm. Despite the instability of the elevation data when the RTK-UAV and the GNSS-receiver were used, the RMSE accuracy of Figure 7c demonstrated the high applicability for practical use cases without geo-referencing to GCPs, especially for typical lowland areas such as S2 and S3.

3.2. Data Analysis on the Field Levelness

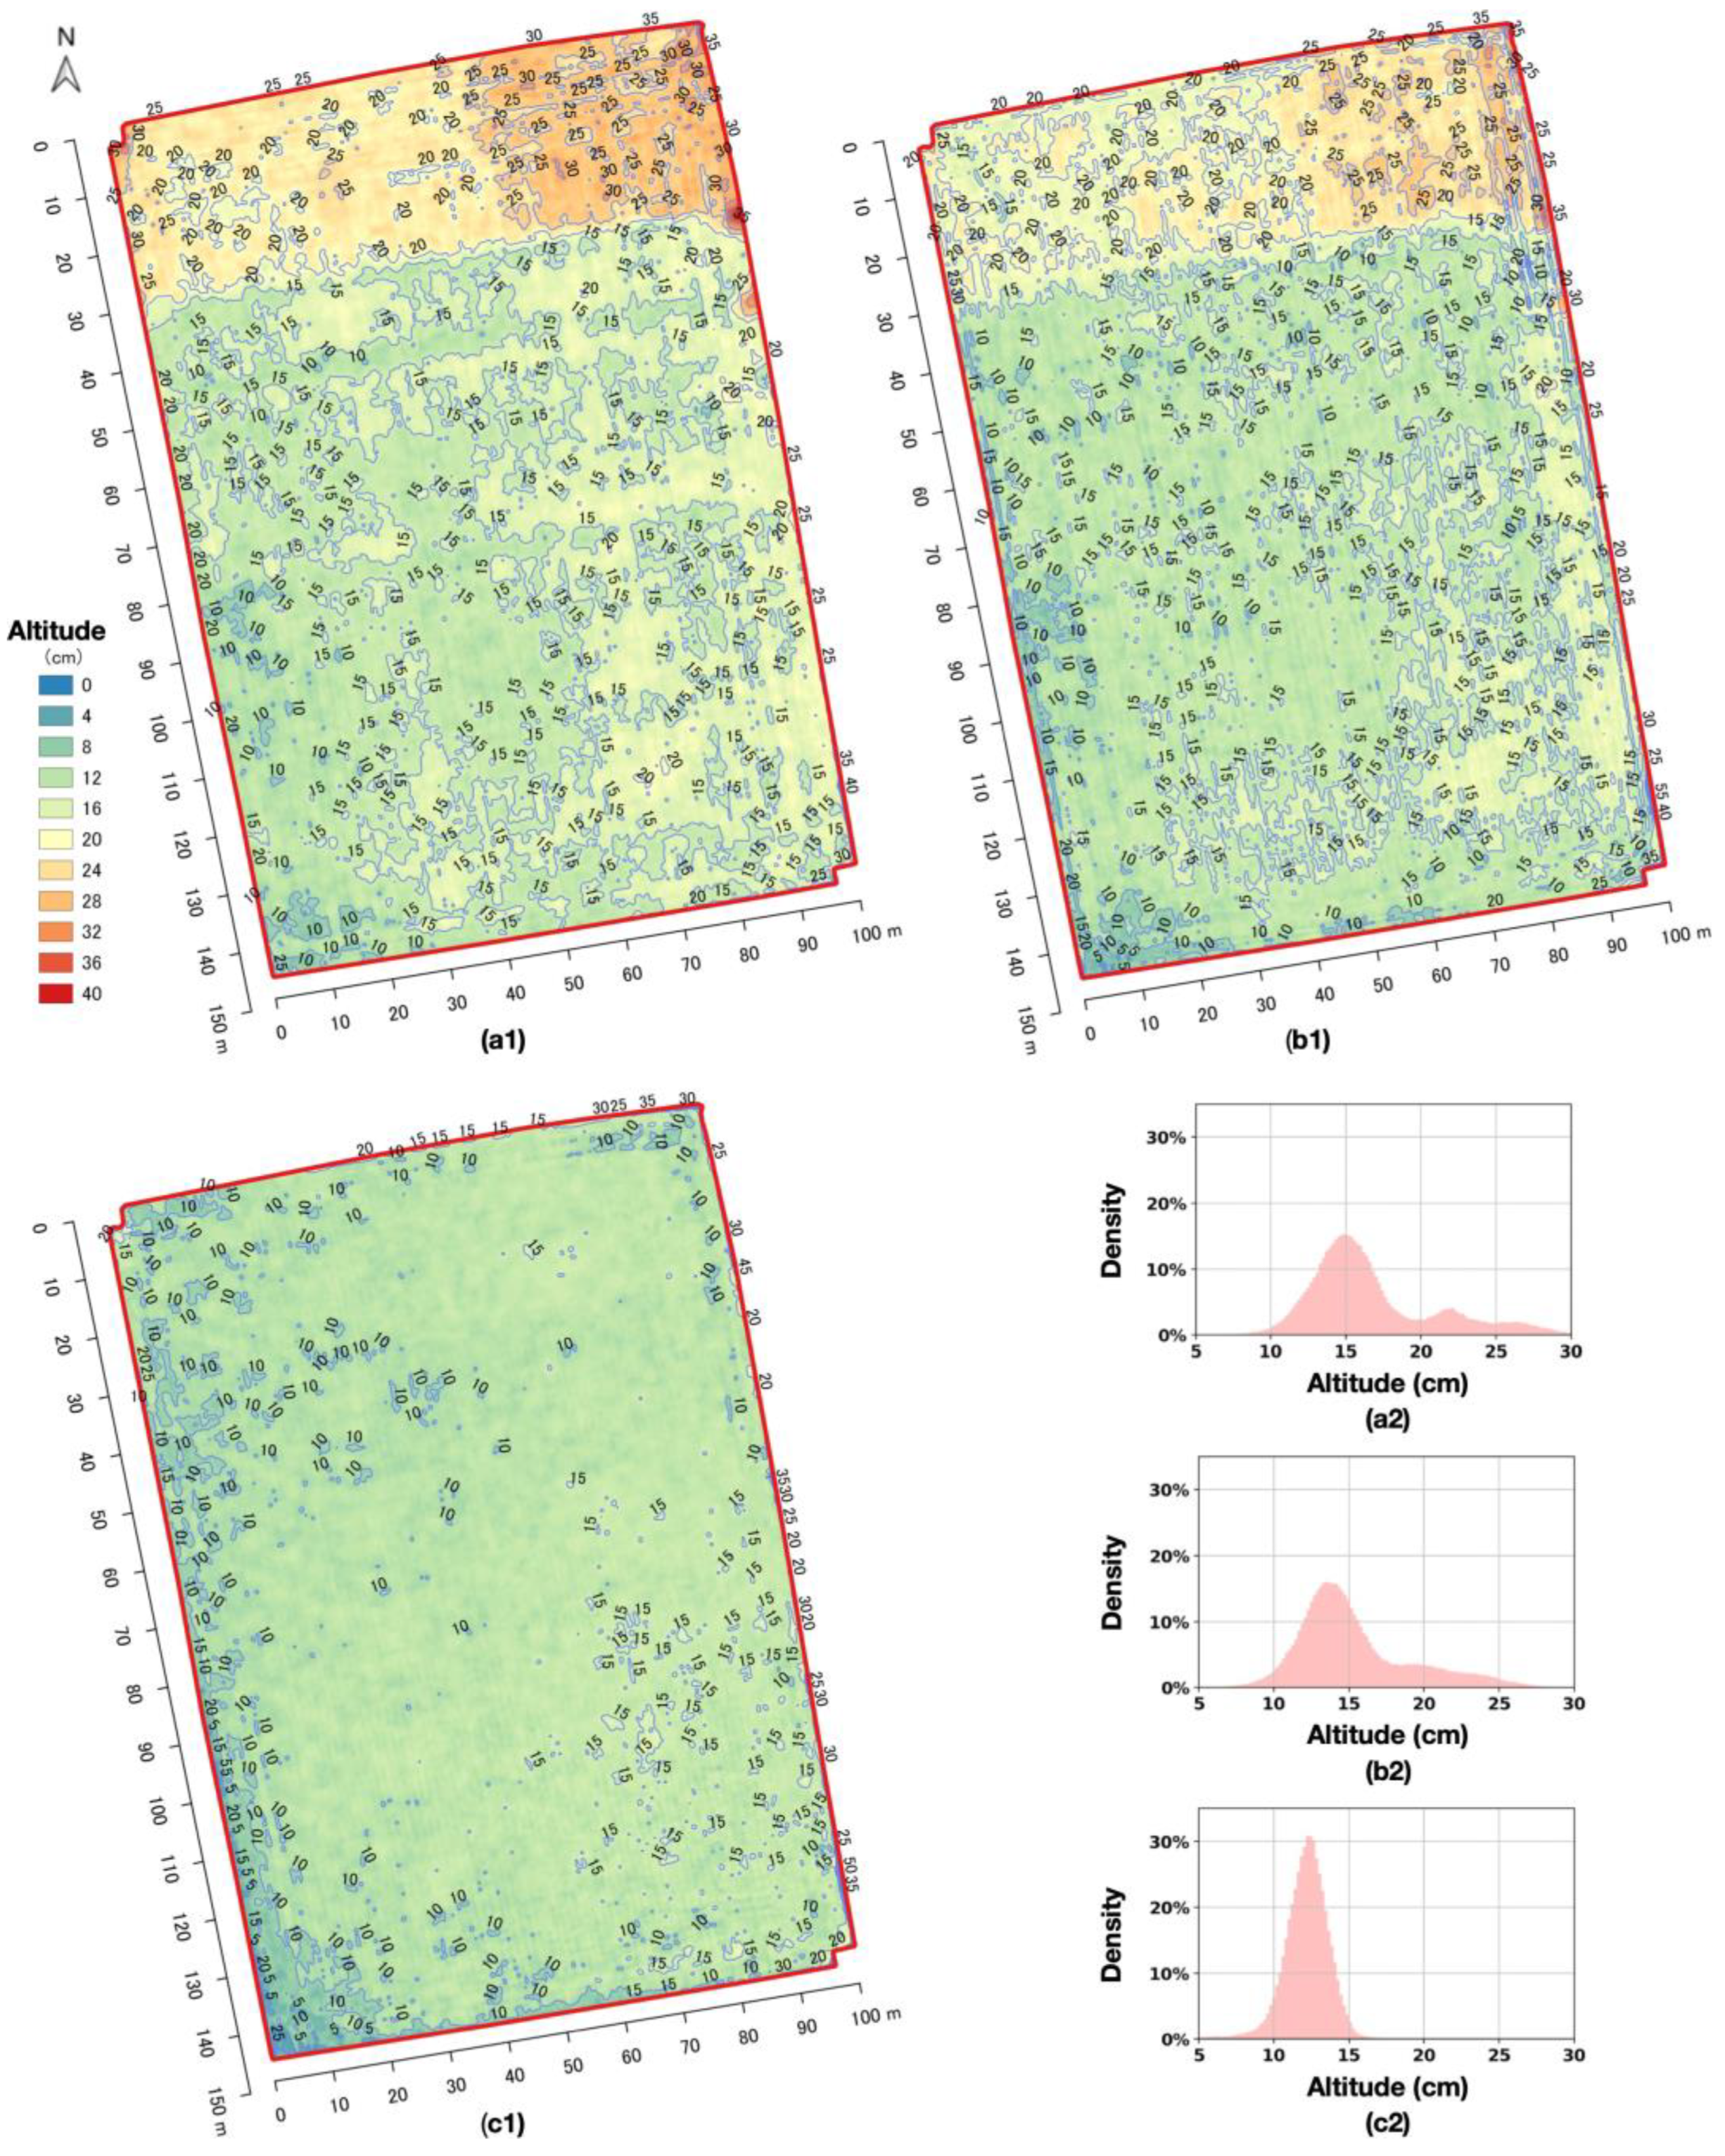
In the two fields F1 and F2 for land leveling, the ground altitude surfaces in centimeter units were generated by ALAS. Figure 8 depicts the levelness assessment results for F1 with an area of 1.5 ha. Figure 8(a1–c1) shows the generated ground altitude surfaces embedded with 5 cm contours and grade colors before the leveling, after the first leveling, and after the final leveling, respectively. Figure 8(a2–c2) shows the corresponding altitude histograms of the ground altitude surfaces. All the altitude values used in the figures were reduced by a minimum of 47.05 m from the DTM’s elevation.
F1 was consolidated from four small pieces of adjacent rice paddies with elevation differences in dozens of cm level that were originally designed for irrigation water flow through a public canal. In order to facilitate land leveling, some preparation works, such as removing the ridges between rice paddies and raising the remaining ridges in relatively low areas, were carried out before the first UAV photogrammetry date of 15 January 2021. Figure 8(a1) shows the levelness state after the preparation works. The altitude values in the upper north area markedly exceeded those in the lower south area. Partial areas with obvious altitude differences would result in no water reaching the high area or excess water in the low area when maintaining the water depth at a certain level. In the corresponding histogram of the ground altitude (Figure 8(a2)), two peaks were observed, and altitude values over 15 cm accounted for more than 50%.
Due to the time-consuming leveling work, the levelness assessment after the first leveling (Figure 8(b1,b2)) did not reach the intended level. However, both the changes in contours and grade colors indicated that the field became leveler than those depicted in Figure 8(a1), simultaneously with similar changes in the histogram of Figure 8(b2).
As shown in Figure 8(c1,c2), after the final land leveling, the field’s levelness reached an acceptable state. Although a few areas that were too low appeared in the left-bottom corner, the well-distributed histogram demonstrated that the field could effectively maintain normal water depths for rice cultivation.
Table 3 lists the 5-cm interval percentages of the ground altitude varying from the mean value. The percentage between [−5, 5] cm increased from the origin 78.6% to 98.6% after the final leveling. After the initial leveling, the median percentage value of 83.0% did not meet the levelness assessment criteria, but the ground altitude standard deviations improved, indicating a better trend. After the final leveling, it reached 2.0 cm, the recommended level for land leveling for rice paddy cultivation [4].
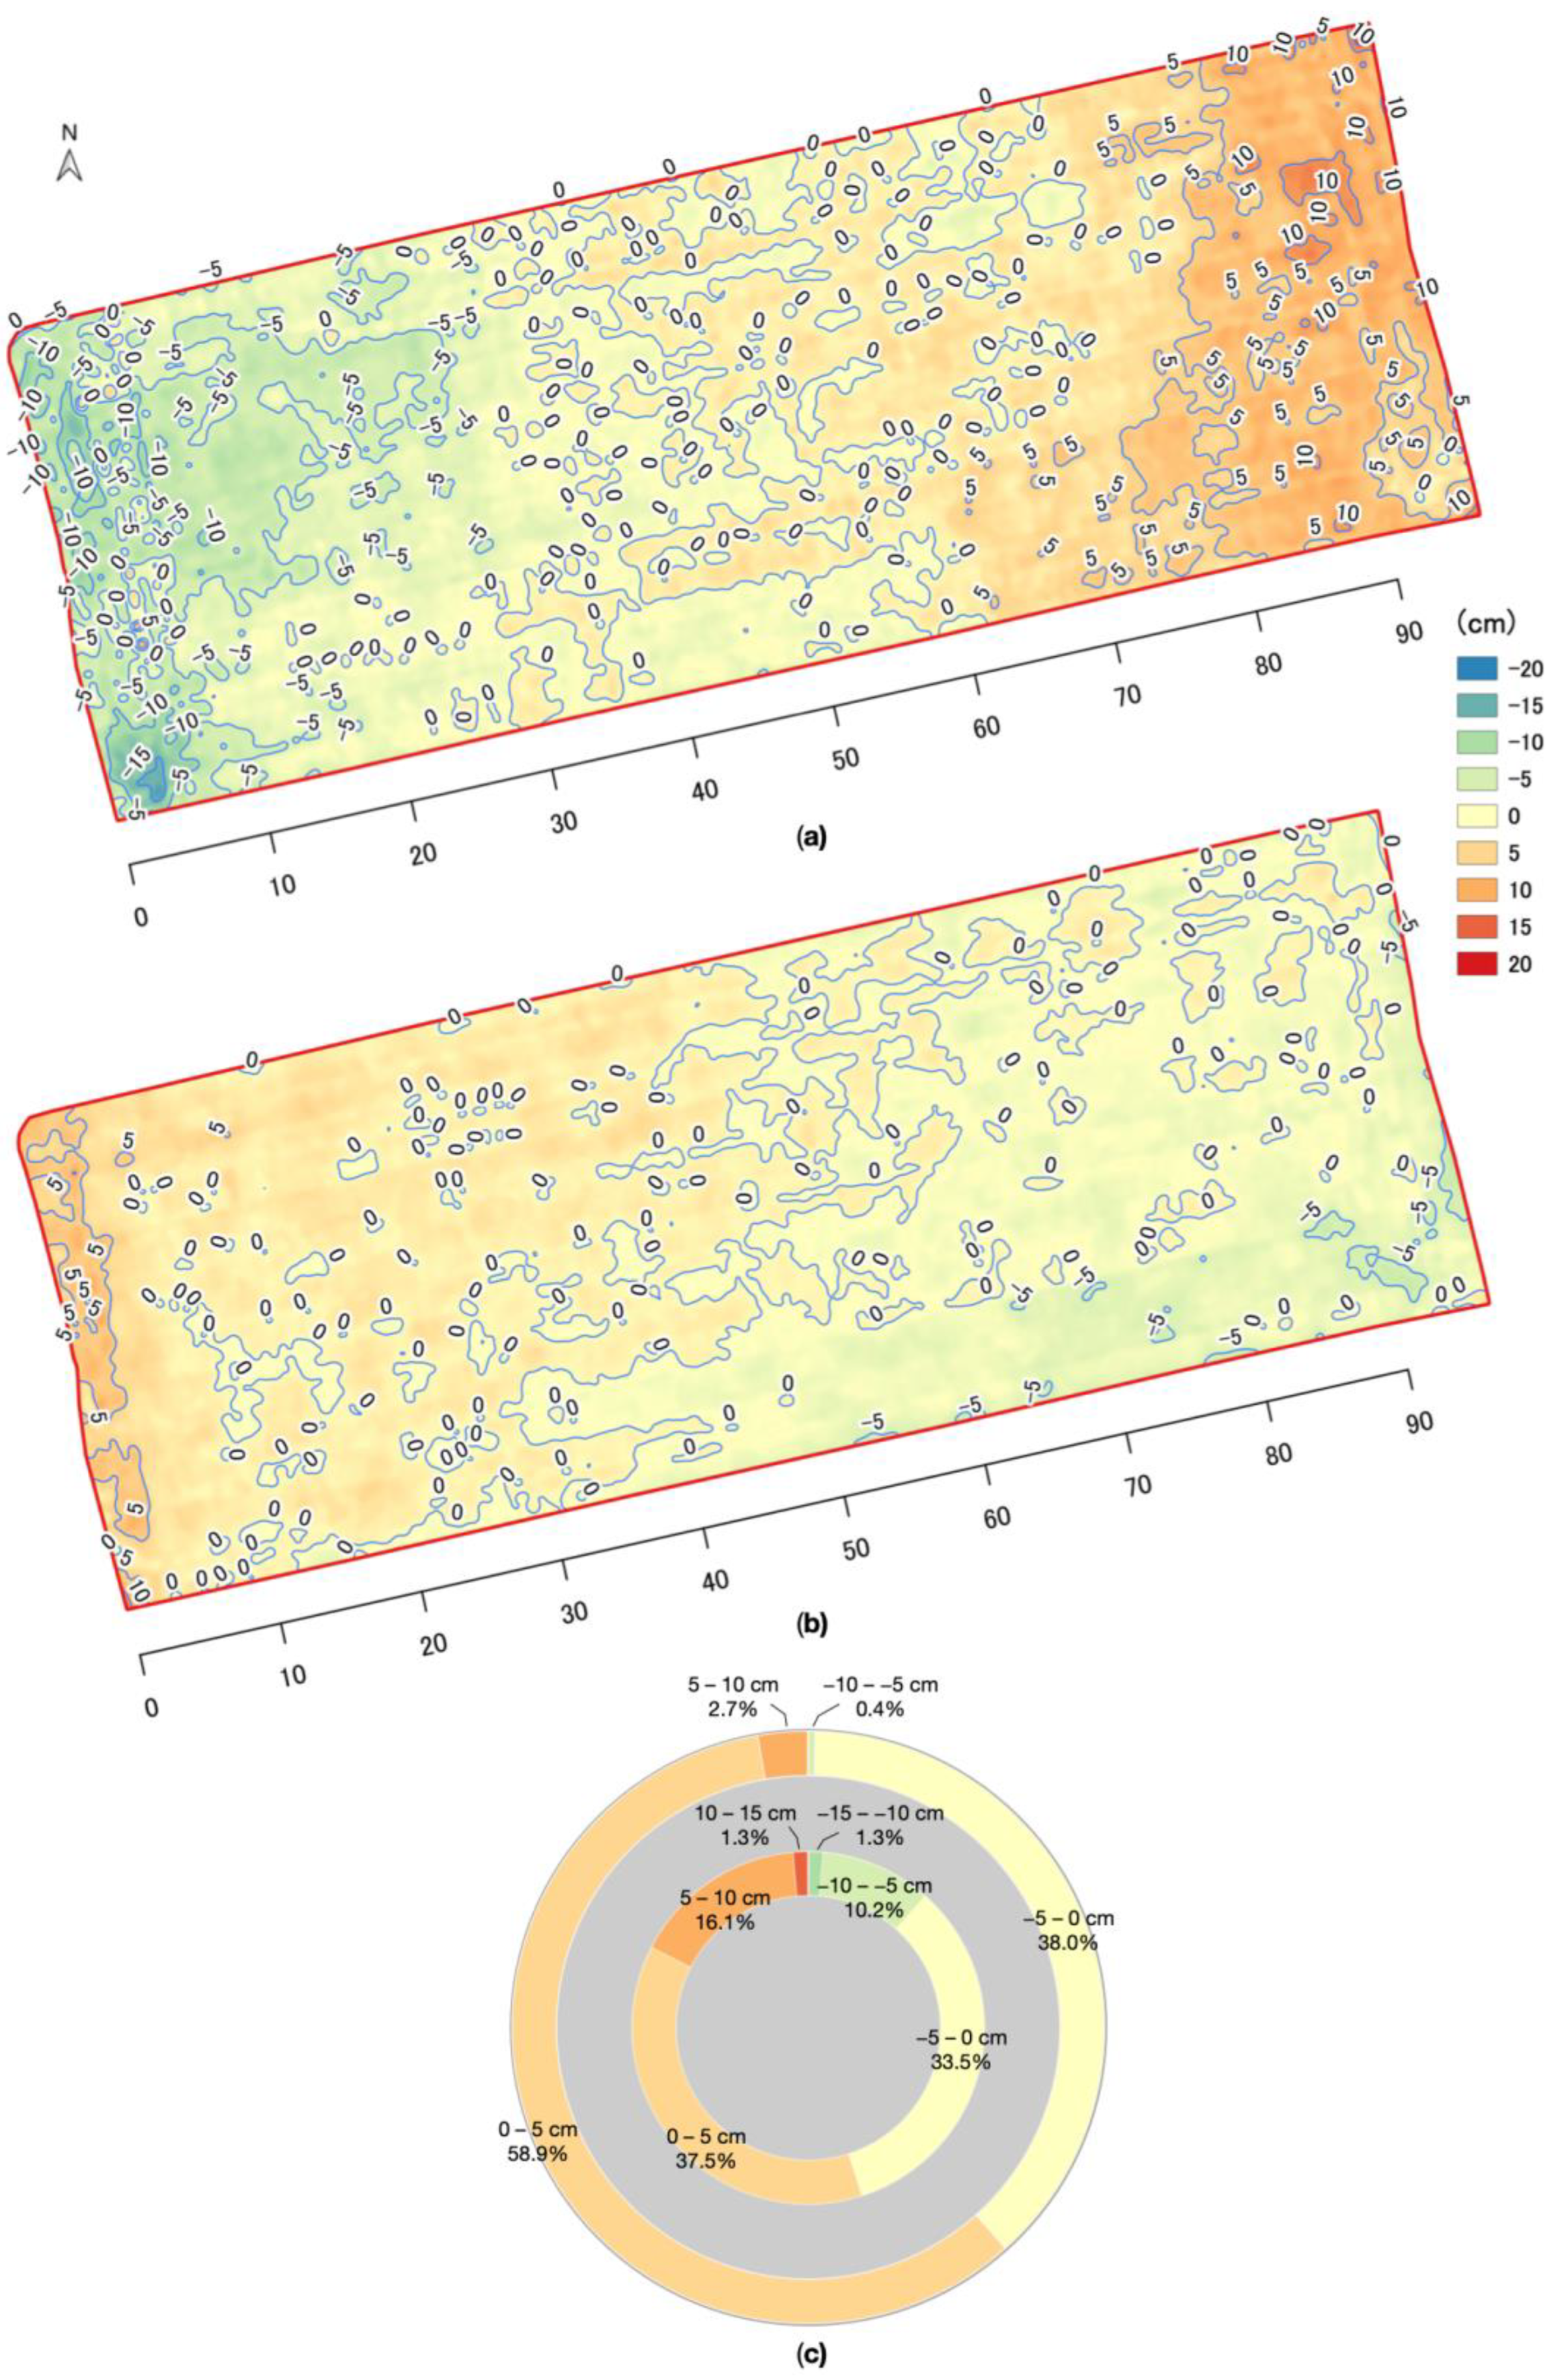
Figure 9 illustrates the levelness assessment for F2 with an area of 0.3 ha. The uneven ground altitude surface was primarily caused by season-to-season crop rotation and flood from the adjacent canal. The subfigures of Figure 9a,b show the ground altitude surfaces embedded with 5 cm contours and grade colors before and after land leveling, respectively. The subfigure in Figure 9c is depicted as a double doughnut chart comprising an inner part and an outer part with the same grade colors, showing the respective percentages of the ground altitudes before and after the land leveling. The ground altitude values in Figure 9a were reduced by a mean elevation of 38.66 m with respect to DTM, whereas those in Figure 9b were reduced by 38.80 m. Due to soil cuts and fills caused by land leveling, the mean elevation changes were considered.
Since the same grade colors were used in both subfigures Figure 9a,b, the difference changes in the ground altitudes before and after land leveling differed significantly. The 5 cm contours also indicated these changes. The standard deviation of the ground altitudes was improved, as it was 2.1 cm after land leveling compared to the origin 4.6 cm before land leveling. As shown in subfigure Figure 9c, simultaneously, the colored doughnut parts of “−5–0 cm” and “0–5 cm” also remarkably increased after land leveling. The sum of the percentages between [−5, 5] cm increased from 71.0% before to 96.9% after land leveling, which exceeded the experience value of 95%.

4. Discussion

This study employed RTK-UAV photogrammetry to assess the levelness of rice paddies for land leveling. The measurement accuracy of the RTK-UAV was evaluated by comparing it with the TS and the GNSS-receiver. The most critical accuracy, specifically the measurement accuracy acquired between the RTK-UAV and the TS at S2, with an average horizontal difference of 3.6 cm and RMSE accuracy of 3.3 cm in altitude, was closer to or better than those described in the articles of [22,23]. The assertion in [23] that the measurement accuracy on flat terrain may outperform that on uneven or complex terrain was also confirmed at our study sites. For example, in lowland fields with less than one or more dozens of centimeters in ground altitude differences, such as rice paddies, the RTK-UAV photogrammetry measurement accuracy was sufficient to distinguish areas with altitude differences of several centimeters. The RTK-UAV photogrammetry was found to be highly effective for levelness assessment, notably for fallow or consolidated rice paddies, in order to make land leveling decisions.
The criterion for assessing land leveling in this study was ±5 cm from the mean horizontal plane, which exceeded the recommendation of ±3.5 cm in [3]. In practical agricultural lands, the ground surface generated from UAV imagery contained all areas of the field: normal ground areas and areas that were always neglected in traditional ground surveying, such as agricultural machinery’s entry-end-exit areas and groove areas formed by tire tracks. Therefore, by later daily observations during the rice growth season following land leveling, we found that our assessment criterion for maintaining water depth at the normal range level recommended in Japan [29] was much more reasonable. Regarding another assessment criterion, the standard deviations of the ground altitudes at S2 and S3 were 2.0 and 2.1 cm, respectively, which are approximately equal to the recommended 2 cm in [4]. As a result, when assessing land leveling for rice paddies using UAV-based imagery, the percentage of altitudes of ±5 cm from the mean horizontal plane should be at least 95% or at most 2 cm of the ground altitude standard deviation. This criterion is currently suitable in most regions of Japan, although it may vary based on rice variety and climate region, such as when the rice paddy requires water depths of around 14 cm in Australia [30] or 10 to 15 cm in south United States [31].
The major advantages of ALAS include (1) fully customizable parameters and controls for a photogrammetry powered by PIX4Dengine SDK, which are unavailable in other cloud-based platforms [25]; (2) parallel or queued batch automated processing for multiple raw aerial imagery sets; and (3) simple output of levelness assessment of observation fields. In our practical application cases, the processing time for photogrammetry using PIX4Dengine SDK did not differ significantly from that using the standalone PIX4D mapper Pro. However, human intervention time was significantly reduced, resulting in a short total time for creating the final report on the levelness assessment. The significant disadvantages of utilizing PIX4Dengine SDK included costs and the need for photogrammetry expertise.
ALAS can help farmers acquire accurate assessment reports of agricultural lands directly from raw UAV aerial images. Professional land leveling business providers can also use it to provide precise and effective levelness assessment reports. In the practical application case, GCPs were not required to generate accurate orthomosaic and DTM when using RTK-UAV aerial imagery, but high-quality “Camera calibration” was required, as shown in the research methodology (Figure 5). In our RTK-UAV photogrammetry, we did not assess some of the environmental factors that might interfere with the RTK signal, such as weather, wind speed, and direction, in the measurement accuracy assessment. We found that the generated ground altitude data were quite identical to field observation data in our study cases if high-quality camera calibration was achieved in the orthomosaic generation process based on aerial images acquired in RTK-fix status. Nevertheless, we recommend conducting UAV photogrammetry during stable, fine weather to minimize potential interference from environmental factors like wind speed and direction. Several notices on high accuracy of ground altitude surface are addressed as follows: (1) conducting the UAV flights at an altitude of 100 m AGL or higher during stable fine weather, which was also recommended in [23]; (2) achieving high-quality camera calibration during the orthomosaic generation process; (3) for new agriculture lands requiring one-time levelness assessment, ALAS without using GCPs is fast and efficient; and (4) for agriculture lands requiring a time-series of levelness assessment, ALAS requires the use of an auto-detectable GCP marker available for PIX4Dengine SDK or human-assisted GCP geo-referencing.
The extensibility of ALAS was the deciding factor for selecting the commercial PIX4Dengine SDK as the photogrammetry tool, considering future development for a wide range of application scenarios. ALAS is an integral component of our automated platform for UAV aerial imagery processing. The platform is being developed for multiple agricultural application cases, such as (1) monitoring and assessing soil flatness, canopy height, lodging, number of plants, uniformity rate and miss-planted rate; (2) predicting biomass quantity and optimal time for harvesting and yield; (3) detecting weeds, diseases or insects; and (4) making decisions for topdressing and spraying based on vegetation indices. As a further application based on the levelness assessment results, a prescription map for variable pesticide spraying is also being implemented on the platform. In future studies, we intend to make the automated processing platform far more robust and competent for all the aforementioned agricultural application scenarios.

5. Conclusions

In this study, we developed ALAS, a novel method for assessing the levelness of ground altitude surfaces directly from raw RTK aerial imagery without the use of GCPs. Our experimental results demonstrated that the high measurement accuracy of RTK-UAV photogrammetry provided a reliable basis for assessing the levelness of ground surfaces with centimeter-scale differences, particularly in flat lowland areas, such as rice paddies. We successfully applied the levelness assessment findings provided by ALAS to guide land leveling operations on two experimental fields, and our evaluation results validated the leveling operations’ success. Beyond its usefulness for land leveling decision-making, ALAS has the potential for widespread agricultural applications such as monitoring topographic changes and evaluating the success of drainage systems. We believe that our study provides a valuable contribution to improving the management of agricultural land resources.

Author Contributions

Conceptualization, methodology, software, validation, formal analysis, visualization, writing—original draft preparation, S.G.; investigation, resources, data curation, writing—review and editing, S.G., K.N., K.F., W.C. and K.T.; supervision, project administration, K.T.; funding acquisition, K.T. and S.G. All authors have read and agreed to the published version of the manuscript.

Funding

This research was funded by “Research project for technologies to strengthen the international competitiveness of Japan’s agriculture and food industry” Shin1do1 (21452858) and “JSPS KAKENHI Grant Number 18K05914”.

Institutional Review Board Statement

Not applicable.

Data Availability Statement

Not applicable.

Acknowledgments

The authors would like to acknowledge machinery specialists Akitoshi Honbu, Makoto Nakajima, Yasutaka Nakahara, Atsuya Yokota, and Yasutaka Kawaguchi for their assistance in data acquisition for both the field survey experiment and the UAV photogrammetry. The authors also extend their appreciation to Chikugo management team for their highly effective supports with all strength, and to Okinawa Prefectural Agricultural Research Center and Agribase Niiyama Ltd. for providing the experimental fields and relative resources. Special thanks go to Masumi Kabashima for her daily assistance in programming and data processing related to this work.

Conflicts of Interest

The authors declare no conflict of interest. The funders had no role in the design of the study; in the collection, analyses, or interpretation of data; in the writing of the manuscript; or in the decision to publish the results.

Abbreviations

The following abbreviations are used in this manuscript:
AGLAbove Ground Level
ALASAutomated Levelness Assessment System
CRSCoordinate Reference System (CRS)
DSMDigital Surface Model
DTMDigital Terrain Model
GCPGround Control Point
GNSSGlobal Navigation Satellite System
GSDGround Sample Distance
NMEANational Marine Electronics Association
NTRIPNetworked Transport of RTCM via Internet Protocol (NTRIP)
PIVPrecise Integrated Visual
PPPPrecise Point Positioning
RMSERoot Mean Squared Error
ROIRegion of Interest
RRSReal Reference Station
RTCMRadio Technical Commission for Maritime Services
RTKReal-Time Kinematic
TSTotal Station
UAVUnmanned Aerial Vehicle
UTMUniversal Transverse Mercator (UTM)
VRSVirtual Reference Station
WGSWorld Geodetic System

References

  1. Kawaguchi, K. Wet Injury of Wheat in Upland Field Converted from Paddy Field in Japan. In Proceedings of the 7th Asian Crop. Science Association Conference, Bogor, Indonesia, 27–30 September 2011; pp. 147–152. [Google Scholar]
  2. Nomiyama, R.; Matsuo, N.; Wakiyama, Y.; Shibata, S.; Sakae, S.; Ishitsuka, N.; Iwasaki, N.; Sakamoto, T. Effects of the Roughness of Paddy Field After the Kumamoto Earthquake on the Growth and Yield of Soybean. Jpn. J. Crop. Sci. 2018, 87, 176–182. [Google Scholar] [CrossRef] [Green Version]
  3. Osari, H. A method for assessing land leveling to produce high-quality consolidated paddy fields. Bull. Natl. Res. Inst. Agric. Eng. 2003, 42, 35–41. [Google Scholar] [CrossRef]
  4. Yamaji, E. Standard and evaluation of paddy field consolidation. In Proceedings of the Soil and Water Engineering for Paddy Field Management, Asian Institute of Technology, Bangkok, Thailand, 28–30 January 1992. [Google Scholar]
  5. Oguchi, T.; Yuichi, S.H.; Wasklewicz, T. Chapter Seven—Data Sources. In Geomorphological Mapping; Elsevier: Amsterdam, The Netherlands, 2011; Volume 15, pp. 189–224. [Google Scholar] [CrossRef]
  6. Cawood, A.J.; Bond, C.E.; Howell, J.A.; Butler, R.W.; Totake, Y. LiDAR, UAV or compass-clinometer? Accuracy, coverage and the effects on structural models. J. Struct. Geol. 2017, 98, 67–82. [Google Scholar] [CrossRef]
  7. Lin, Y.C.; Cheng, Y.T.; Zhou, T.; Ravi, R.; Hasheminasab, S.M.; Flatt, J.E.; Troy, C.; Habib, A. Evaluation of UAV LiDAR for mapping coastal environments. Remote Sens. 2019, 11, 2893. [Google Scholar] [CrossRef] [Green Version]
  8. Manfreda, S.; McCabe, M.F.; Miller, P.E.; Lucas, R.; Pajuelo Madrigal, V.; Mallinis, G.; Ben Dor, E.; Helman, D.; Estes, L.; Ciraolo, G.; et al. On the Use of Unmanned Aerial Systems for Environmental Monitoring. Remote Sens. 2018, 10, 641. [Google Scholar] [CrossRef] [Green Version]
  9. Ulvi, A. Documentation, Three-Dimensional (3D) Modelling and visualization of cultural heritage by using Unmanned Aerial Vehicle (UAV) photogrammetry and terrestrial laser scanners. Int. J. Remote Sens. 2021, 42, 1994–2021. [Google Scholar] [CrossRef]
  10. Kashani, A.G.; Graettinger, A.J.; Dao, T. Lidar-based methodology to evaluate fragility models for tornado-induced roof damage. Nat. Hazards Rev. 2016, 17, 04016006. [Google Scholar] [CrossRef]
  11. Mora, O.E.; Suleiman, A.; Chen, J.; Pluta, D.; Okubo, M.H.; Josenhans, R. Comparing sUAS photogrammetrically-derived point clouds with GNSS measurements and terrestrial laser scanning for topographic mapping. Drones 2019, 3, 64. [Google Scholar] [CrossRef] [Green Version]
  12. Štroner, M.; Urban, R.; Línková, L. A New Method for UAV Lidar Precision Testing Used for the Evaluation of an Affordable DJIZENMUSE L1 Scanner. Remote Sens. 2021, 13, 4811. [Google Scholar] [CrossRef]
  13. Diara, F.; Roggero, M. Quality Assessment of DJI Zenmuse L1 and P1 LiDAR and Photogrammetric Systems: Metric and Statistics Analysis with the Integration of Trimble SX10 Data. Geomatics 2022, 2, 254–281. [Google Scholar] [CrossRef]
  14. Aksoy, E.; Ozsoy, G.; Dirim, M. Soil mapping approach in GIS using Landsat satellite imagery and DEM data. Afr. J. Agr. Res. 2009, 4, 1295–1302. [Google Scholar]
  15. Hirano, A.; Welch, R.; Lang, H. Mapping from ASTER stereo image data: DEM validation and accuracy assessment. ISPRS-J. Photogramm. Remote Sens. 2003, 57, 356–370. [Google Scholar] [CrossRef]
  16. Sari, I.L.; Maulana, R.; Dyatmika, H.S.; Suprijanto, A.; Arief, R.; Ali, S. Study of Digital Elevation Model (DEM) Extraction using Stereo Radargrammetry TerraSAR-X in Madiun Area—Elevation Accuracy Improvement. E3S Web Conf. 2019, 94, 04003. [Google Scholar] [CrossRef]
  17. Mesas-Carrascosa, F.J.; Notario-García, M.D.; de Larriva, J.E.M.; de la Orden, M.S.; Porras, A.G.F. Validation of measurements of land plot area using UAV imagery. Int. J. Appl. Earth Obs. 2014, 33, 270–279. [Google Scholar] [CrossRef]
  18. Enciso, J.; Jung, J.; Chang, A.; Chavez, J.C.; Yeom, J.; Landivar, J.; Cavazos, G. Assessing land leveling needs and performance with unmanned aerial system. J. Appl. Remote Sens. 2018, 12, 016001. [Google Scholar] [CrossRef] [Green Version]
  19. Westoby, M.J.; Brasington, J.; Glasser, N.F.; Hambrey, M.J.; Reynolds, J.M. ‘Structure-from-Motion’ photogrammetry: A low-cost, effective tool for geoscience applications. Geomorphology 2012, 179, 300–314. [Google Scholar] [CrossRef] [Green Version]
  20. Sanz-Ablanedo, E.; Chandler, J.H.; Rodríguez-Pérez, J.R.; Ordóñez, C. Accuracy of unmanned aerial vehicle (UAV) and SfM photogrammetry survey as a function of the number and location of ground control points used. Remote Sens. 2018, 10, 1606. [Google Scholar] [CrossRef] [Green Version]
  21. Urban, R.; Reindl, T.; Broucˇek, J. Testing of drone DJI Phantom 4 RTK accuracy. In Advances and Trends in Geodesy, Cartography and Geoinformatics II.; CRC Press: Boca Raton, FL, USA, 2020; pp. 99–105. [Google Scholar]
  22. Ekaso, D.; Nex, F.; Kerle, N. Accuracy assessment of real-time kinematics (RTK) measurements on unmanned aerial vehicles (UAV) for direct geo-referencing. Geo Spat Inf Sci. 2020, 23, 165–181. [Google Scholar] [CrossRef] [Green Version]
  23. Jiménez-Jiménez, S.I.; Ojeda-Bustamante, W.; Marcial-Pablo, M.d.J.; Enciso, J. Digital terrain models generated with low-cost UAV photogrammetry: Methodology and accuracy. ISPRS Int. J. Geo-Inf. 2021, 10, 285. [Google Scholar] [CrossRef]
  24. Hinge, L.; Gundorph, J.; Ujang, U.; Azri, S.; Anton, F.; Rahman, A.A. Comparative analysis of 3D photogrammetry modeling software packages for drones survey. Int. Arch. Photogramm. Remote Sens. Spat. Inf. Sci. 2019, 42, 95–100. [Google Scholar] [CrossRef] [Green Version]
  25. Ihsan, M.; Somantri, L.; Sugito, N.; Himayah, S.; Affriani, A. The Comparison of Stage and Result Processing of Photogrammetric Data Based on Online Cloud Processing. IOP Conf. Ser. Earth Environ. Sci. 2019, 286, 012041. [Google Scholar] [CrossRef]
  26. PIX4D. Pix4Dengine SDK Quick-Start. PIX4D SA. 2019. Available online: https://developer.pix4d.com/server/1.4.0/quickstart.html (accessed on 6 March 2023).
  27. GDAL/OGR Contributors. GDAL/OGR Geospatial Data Abstraction software Library. Open Source Geospatial Foundation. 2021. Available online: https://gdal.org/faq.html#how-do-i-cite-gdal (accessed on 6 March 2023).
  28. QGIS.org. QGIS Geographic Information System. QGIS.org. 2022. Available online: https://qgis.org/en/site/getinvolved/faq/index.html (accessed on 6 March 2023).
  29. Anbumozhi, V.; Yamaji, E.; Tabuchi, T. Rice crop growth and yield as influenced by changes in ponding water depth, water regime and fertigation level. Agric. Water Manag. 1998, 37, 241–253. [Google Scholar] [CrossRef]
  30. Freney, J.; Trevitt, A.; Muirhead, W.; Denmead, O.; Simpson, J.; Obcemea, W. Effect of water depth on ammonia loss from lowland rice. Fert. Res. 1988, 16, 97–107. [Google Scholar] [CrossRef]
  31. Saichuk, J. Louisiana Rice Production Handbook; Louisiana State University Agricultural Center: Baton Rouge, LA, USA, 2009. [Google Scholar]
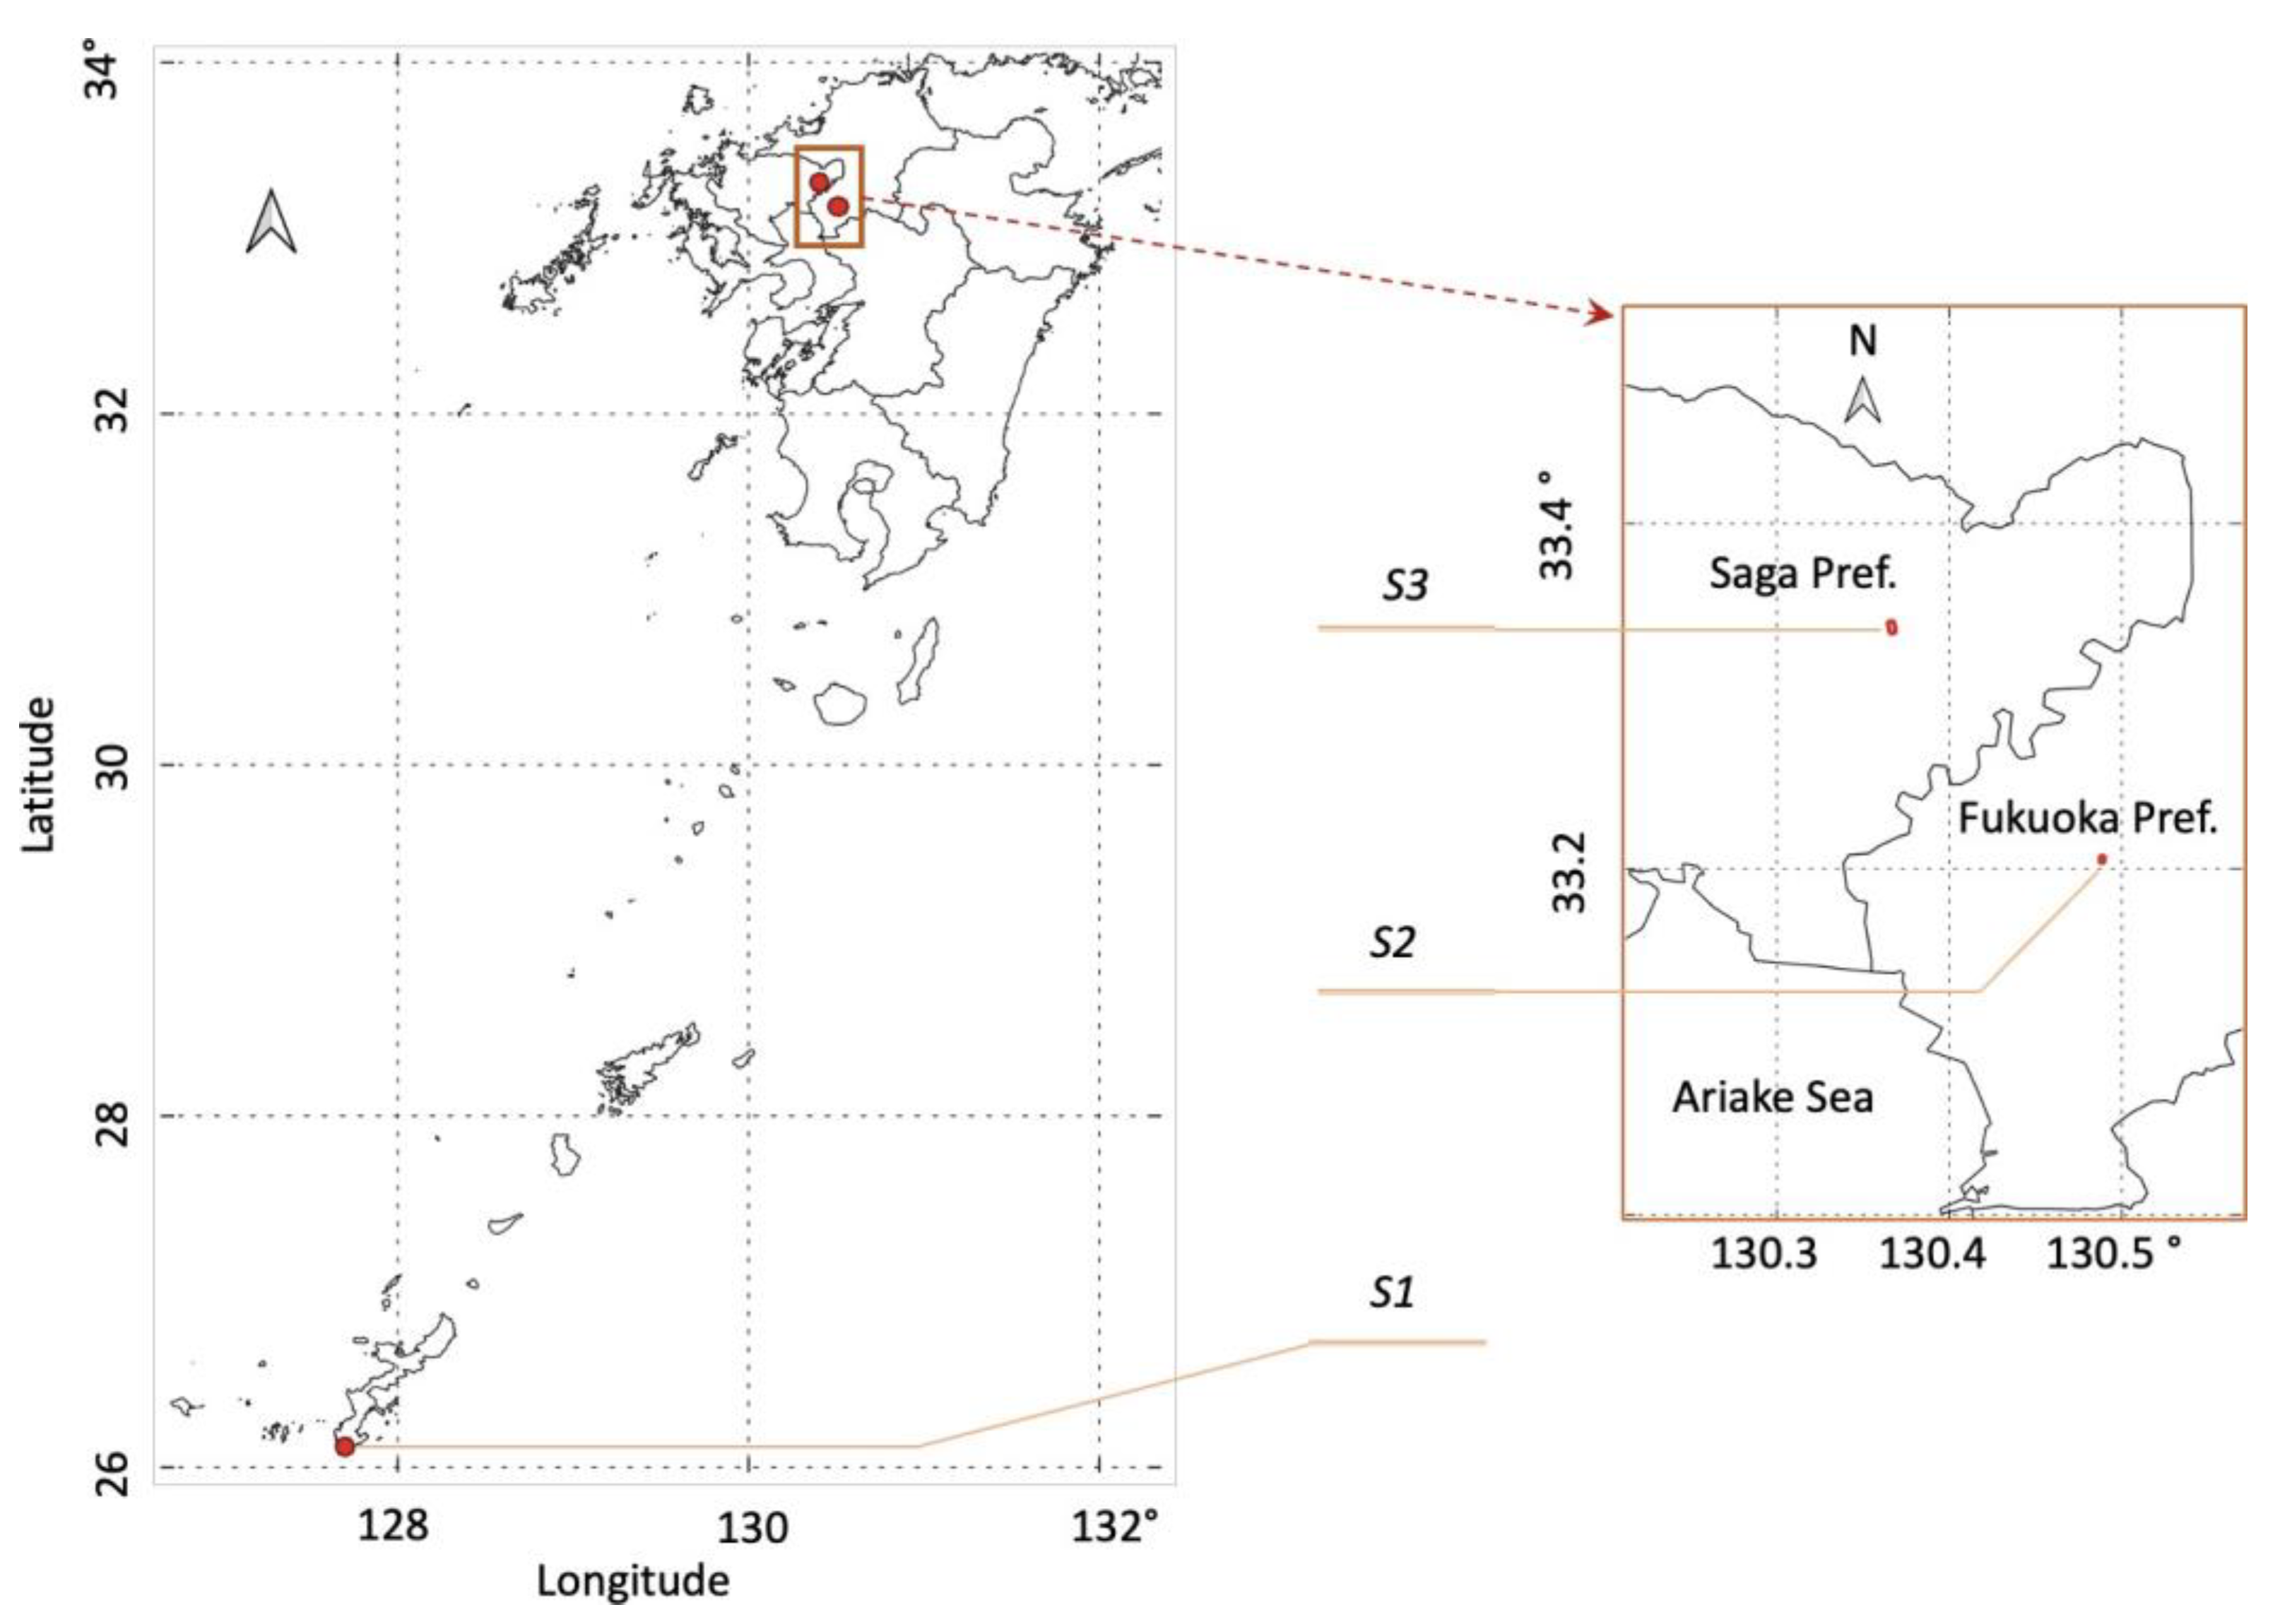
Figure 1. The study sites S1, S2, S3 in southwestern Japan.
Agriculture 13 00657 g001
Figure 2. Land leveling using a laser leveler: (a) a laser transmitter unit and (b) a leveler unit with a laser receiver (L4011A, Sugano, Ibaraki, Japan) mounted on a tractor (YT5113A, Yanmar, Osaka, Japan).
Agriculture 13 00657 g002
Figure 3. Used instruments.
Agriculture 13 00657 g003
Figure 4. Measurement points at the study sites S1 (a) and S2 (b) with grayscale background of DSMs. Green cycles: base points; and green and red cycles: measured points.
Agriculture 13 00657 g004
Figure 5. The research methodology.
Agriculture 13 00657 g005
Figure 6. Measurement accuracy comparisons between the TS, the GNSS-receiver, and the RTK-UAV instruments. SD denotes the standard deviation. Red dots: mean values; and gray dots: data distribution.
Agriculture 13 00657 g006
Figure 7. RMSE comparisons between the TS, the GNSS-receiver, and the RTK-UAV.
Agriculture 13 00657 g007
Figure 8. Levelness assessment results for F1 at S3. (a1c1): the ground altitude surfaces with 5 cm contours and grade colors before, after the first, and after the final land leveling. (a2c2): the altitude histograms corresponding to the previous surfaces.
Agriculture 13 00657 g008
Figure 9. Levelness assessment results for F2 at S3. (a,b): the ground altitude surfaces with 5 cm contours and grade colors before and after the land leveling. (c): the percentages of ground altitudes in 5-cm intervals corresponding to the previous surfaces (a,b).
Agriculture 13 00657 g009
Table 1. Typical RTK techniques.
RTK TechniqueDescriptionData Connection
Conventional RTKUses a single base station to provide corrections to a rover receiver.Radio link to base station
Virtual reference station (VRS)Uses multiple base stations to create a virtual base station at a known location to provide corrections to rover receivers.Network connection to networked transport of RTCM via Internet protocol (NTRIP) server
Real reference station (RRS)Uses physical reference base stations with known coordinates to provide real-time correction data to rover receivers.Network connection to NTRIP server
Precise integrated visual-RTK (PIV-RTK)Uses a combination of real-time kinematic positioning from NTRIP caster, inertial sensors, visual odometry to achieve high-accuracy positioning, without the need for a base station.Network connection to NTRIP caster with connection to NTRIP server
Precise Point Positioning (PPP)-RTKUses a precise clock and high-quality data from multiple GNSS satellites to calculate precise position, without the need for a base station.Network connection to a server providing PPP correction data
Table 2. Experimental conditions.
InstrumentStudy SiteDateWeather/Wind Speed (m/s)/
Wind Direction/Temperature (°)
CRS of the Measured Data/
Additional Information
TSS120 February 2019Cloudy/2.3/NE/22.0Arbitrary coordinate system/-
S221 January 2020Sunny/2.3/NE/9.7
GNSS-
receiver
S124 April 2019Cloudy/4.2/SSW/24.3world geodetic system (WGS) 84/RTK: VRS
S225 April 2019Sunny/1.5/ENE/22.7
RTK-UAVS230 April 2021Sunny/6/SW/22.9WGS 84/
Flight altitude: 100 m
Flight speed: 6.7 m/s
Forward overlap: 80
Side overlap: 75
RTK: VRS
S3 (F1)15 January 2021
19 March 2021
2 June 2021
Sunny/0.5/NE/8.1
Cloudy/1.4/W/19.6
Cloudy/2.5/ESE/26.8
S3 (F2)21 January 2022
9 June 2022
Sunny/7.4/EWE/9.9
Sunny/0.4/NS/25.1
Table 3. Percentages of the altitude deviation from the mean value at S3.
Altitude from the Mean Value (cm)Before the Land Leveling (a1)After the First Land Leveling (b1)After the Final Land Leveling (c1)
−20 to −15---
−15 to −10---
−10 to −53.42.60.8
−5 to 055.253.934.0
0–523.429.164.6
5–1012.912.00.4
10–154.42.20.2
15–200.20.10.1
>200.5--
The percentage between [−5, 5] cm78.683.098.6
The standard deviation of the ground altitudes (cm)4.43.92.0
Disclaimer/Publisher’s Note: The statements, opinions and data contained in all publications are solely those of the individual author(s) and contributor(s) and not of MDPI and/or the editor(s). MDPI and/or the editor(s) disclaim responsibility for any injury to people or property resulting from any ideas, methods, instructions or products referred to in the content.