2.2.1. Sensitive Plate Design
The loss monitoring sensor is composed of a sensitive plate and a signal processing circuit. The sensitive plate is composed of an impact plate and a piezoelectric ceramic. The impact plate is used to undertake the impact of corn grains and broken corncobs to form vibration signals. The piezoelectric ceramic is pasted on the back of the impact plate to convert the vibration signal into an electrical signal.
The design of the sensitive plate includes the material, size, structure, method of fixing of the impact plate and the installation position of the piezoelectric ceramic. Because the attenuation speed, vibration frequency and strain of the vibration of the impact plate are the main factors affecting the quality of the signal, the designed impact plate should have the characteristics of fast attenuation speed, high vibration frequency and large strain. The faster the attenuation, the lower the probability of interference by other signals in its signal cycle, so the higher the attenuation rate can effectively reduce the impact between signals. The larger the strain, the greater the peak voltage of the output electrical signal of the conversion element, and the easier it is to distinguish the vibration signal generated by the impact plate of different substances. The higher the signal frequency generated by the corn grains collision impact plate, the more effective it can distinguish the vibration noise frequency of the harvester and reduce the signal interference [
18].
The literature review [
19] found that 304 stainless steel as the impact plate material produces a better signal quality; impact plate design parameters are as follows (
Table 2):
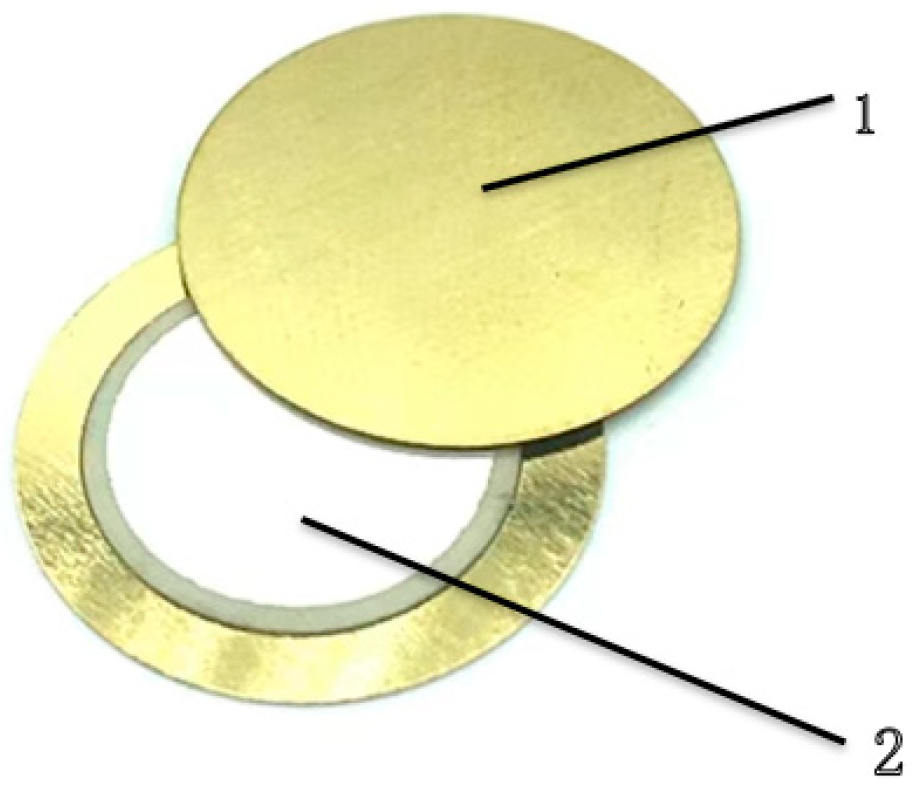
Piezoelectric ceramic is a commonly used conversion element in grain loss monitoring devices, such as piezoelectric ceramic buzzer due to its characteristics of fast response, fast signal attenuation, and large piezoelectric coefficient. The most important advantage of piezoelectric ceramic is its ability to adapt to the poor working environment in the field. It is a typical active element that converts mechanical energy into electrical energy through the piezoelectric effect. The main parameters of the selected piezoelectric ceramic sheet are shown in
Table 3, and the structure is depicted in
Figure 2. The piezoelectric ceramic serves as the positive electrode, and the negative output voltage signal is generated by the copper sheet.
When the piezoelectric ceramic is subjected to external force F, a charge q with opposite polarity and equal charge will appear on its two polar surfaces, so it can be regarded as a charge generator in parallel with a capacitor C
a. The definitions of terms used in Formulas (1)–(3) are shown in
Table 3.
The output voltage of the piezoelectric ceramic as the voltage source is U:
2.2.2. Signal Acquisition and Analysis
In order to design an accurate and efficient signal processing circuit, it is necessary to understand the characteristics of the signal generated by the core and grain collision-sensitive plate.
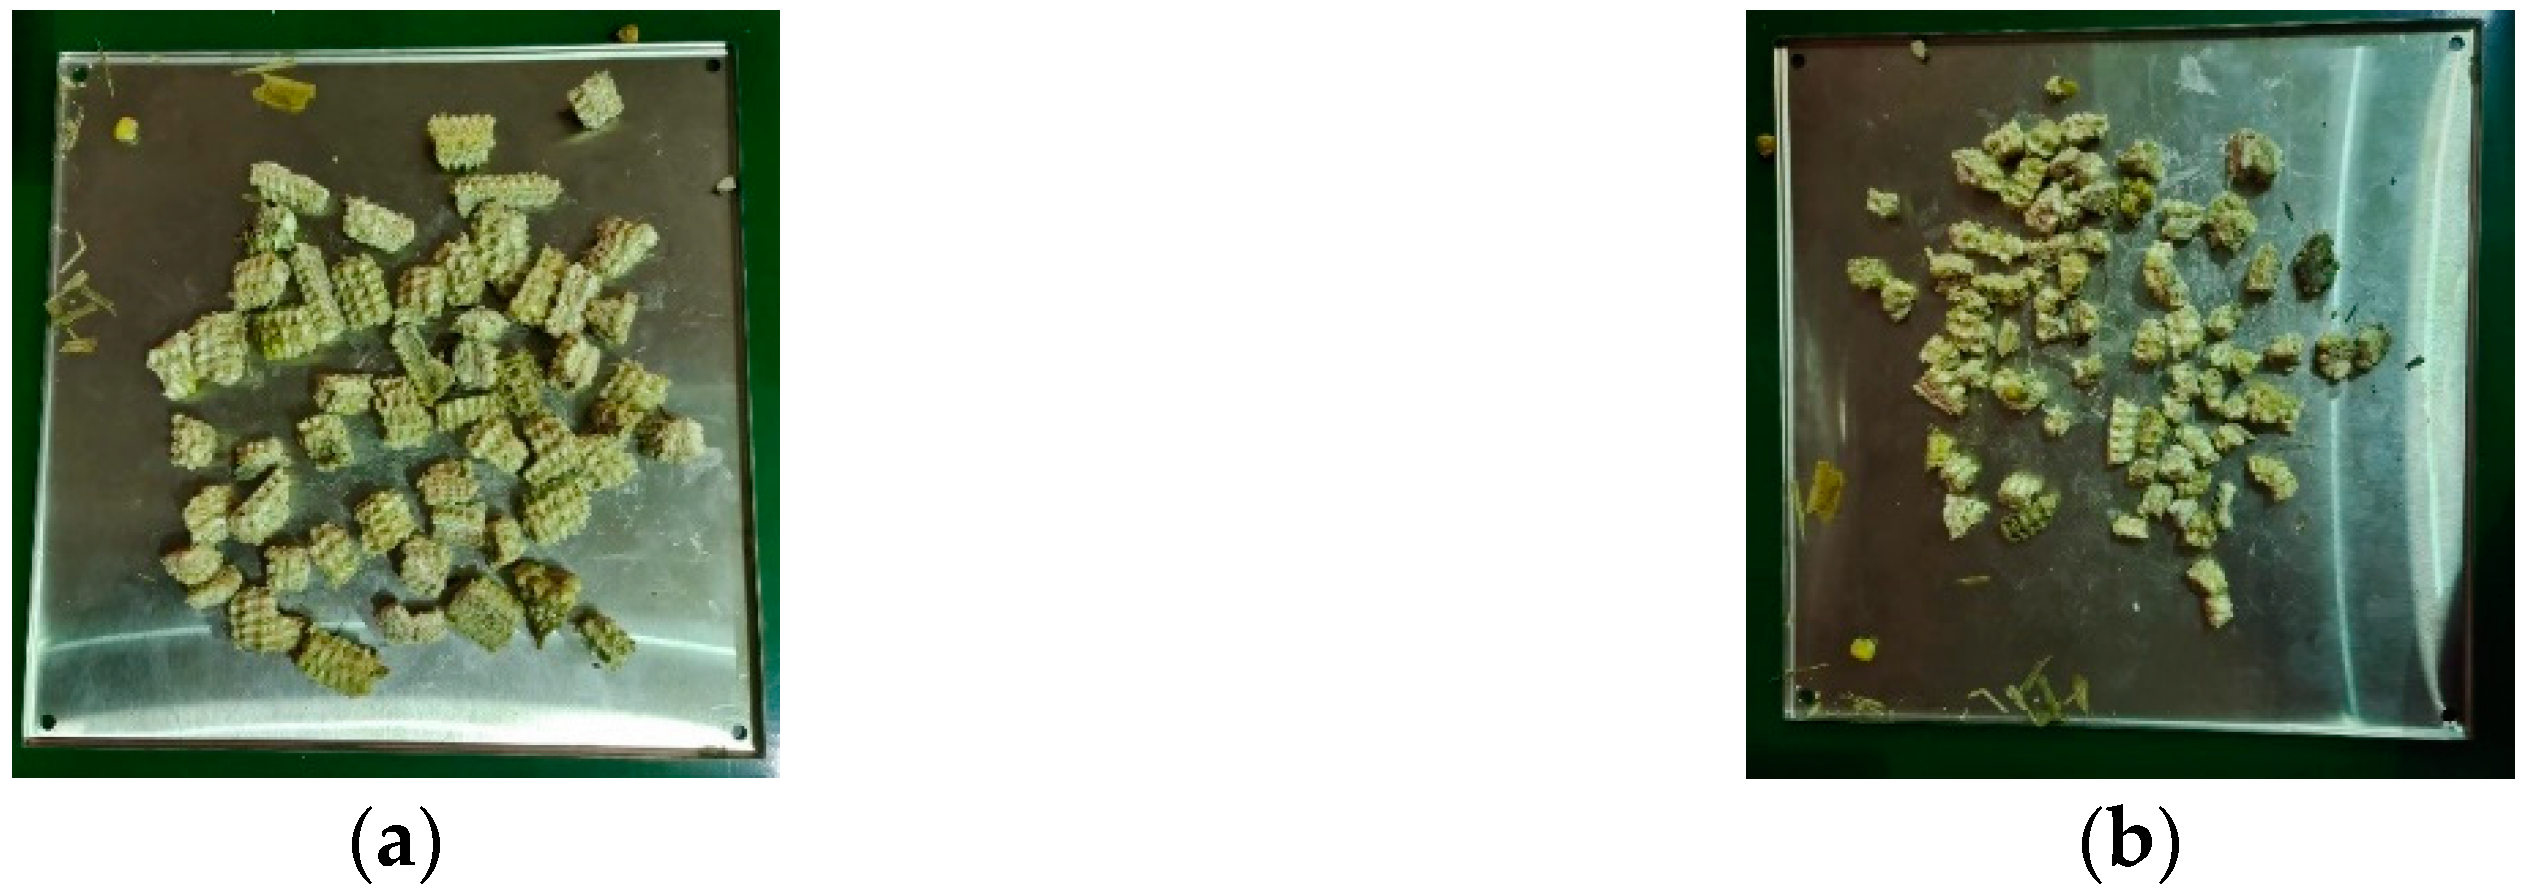
In this experiment, the signals generated by the collision-sensitive plate of broken corncobs and corn grains were collected 30 times, respectively, and there was no other vibration or noise interference in the collection process. The instruments and equipment used in the test include the sensitive plate, TBS1104 oscilloscope and tape. When the signal is collected, the sensitive plate is installed on the frame at a 45° tilt from the horizontal plane, and a single corn grain and the broken corncob fall freely from the top 40 cm to the sensitive plate. During the test, the time base of the oscilloscope is set to 10.0 ms, the total sampling time is 100ms, and the voltage range is set to −3 to 3 V. The sampling frequency of the oscilloscope under these settings is calculated to be fs = 2500/100 ms = 25,000 Hz, where 2500 is the storage depth of the oscilloscope.
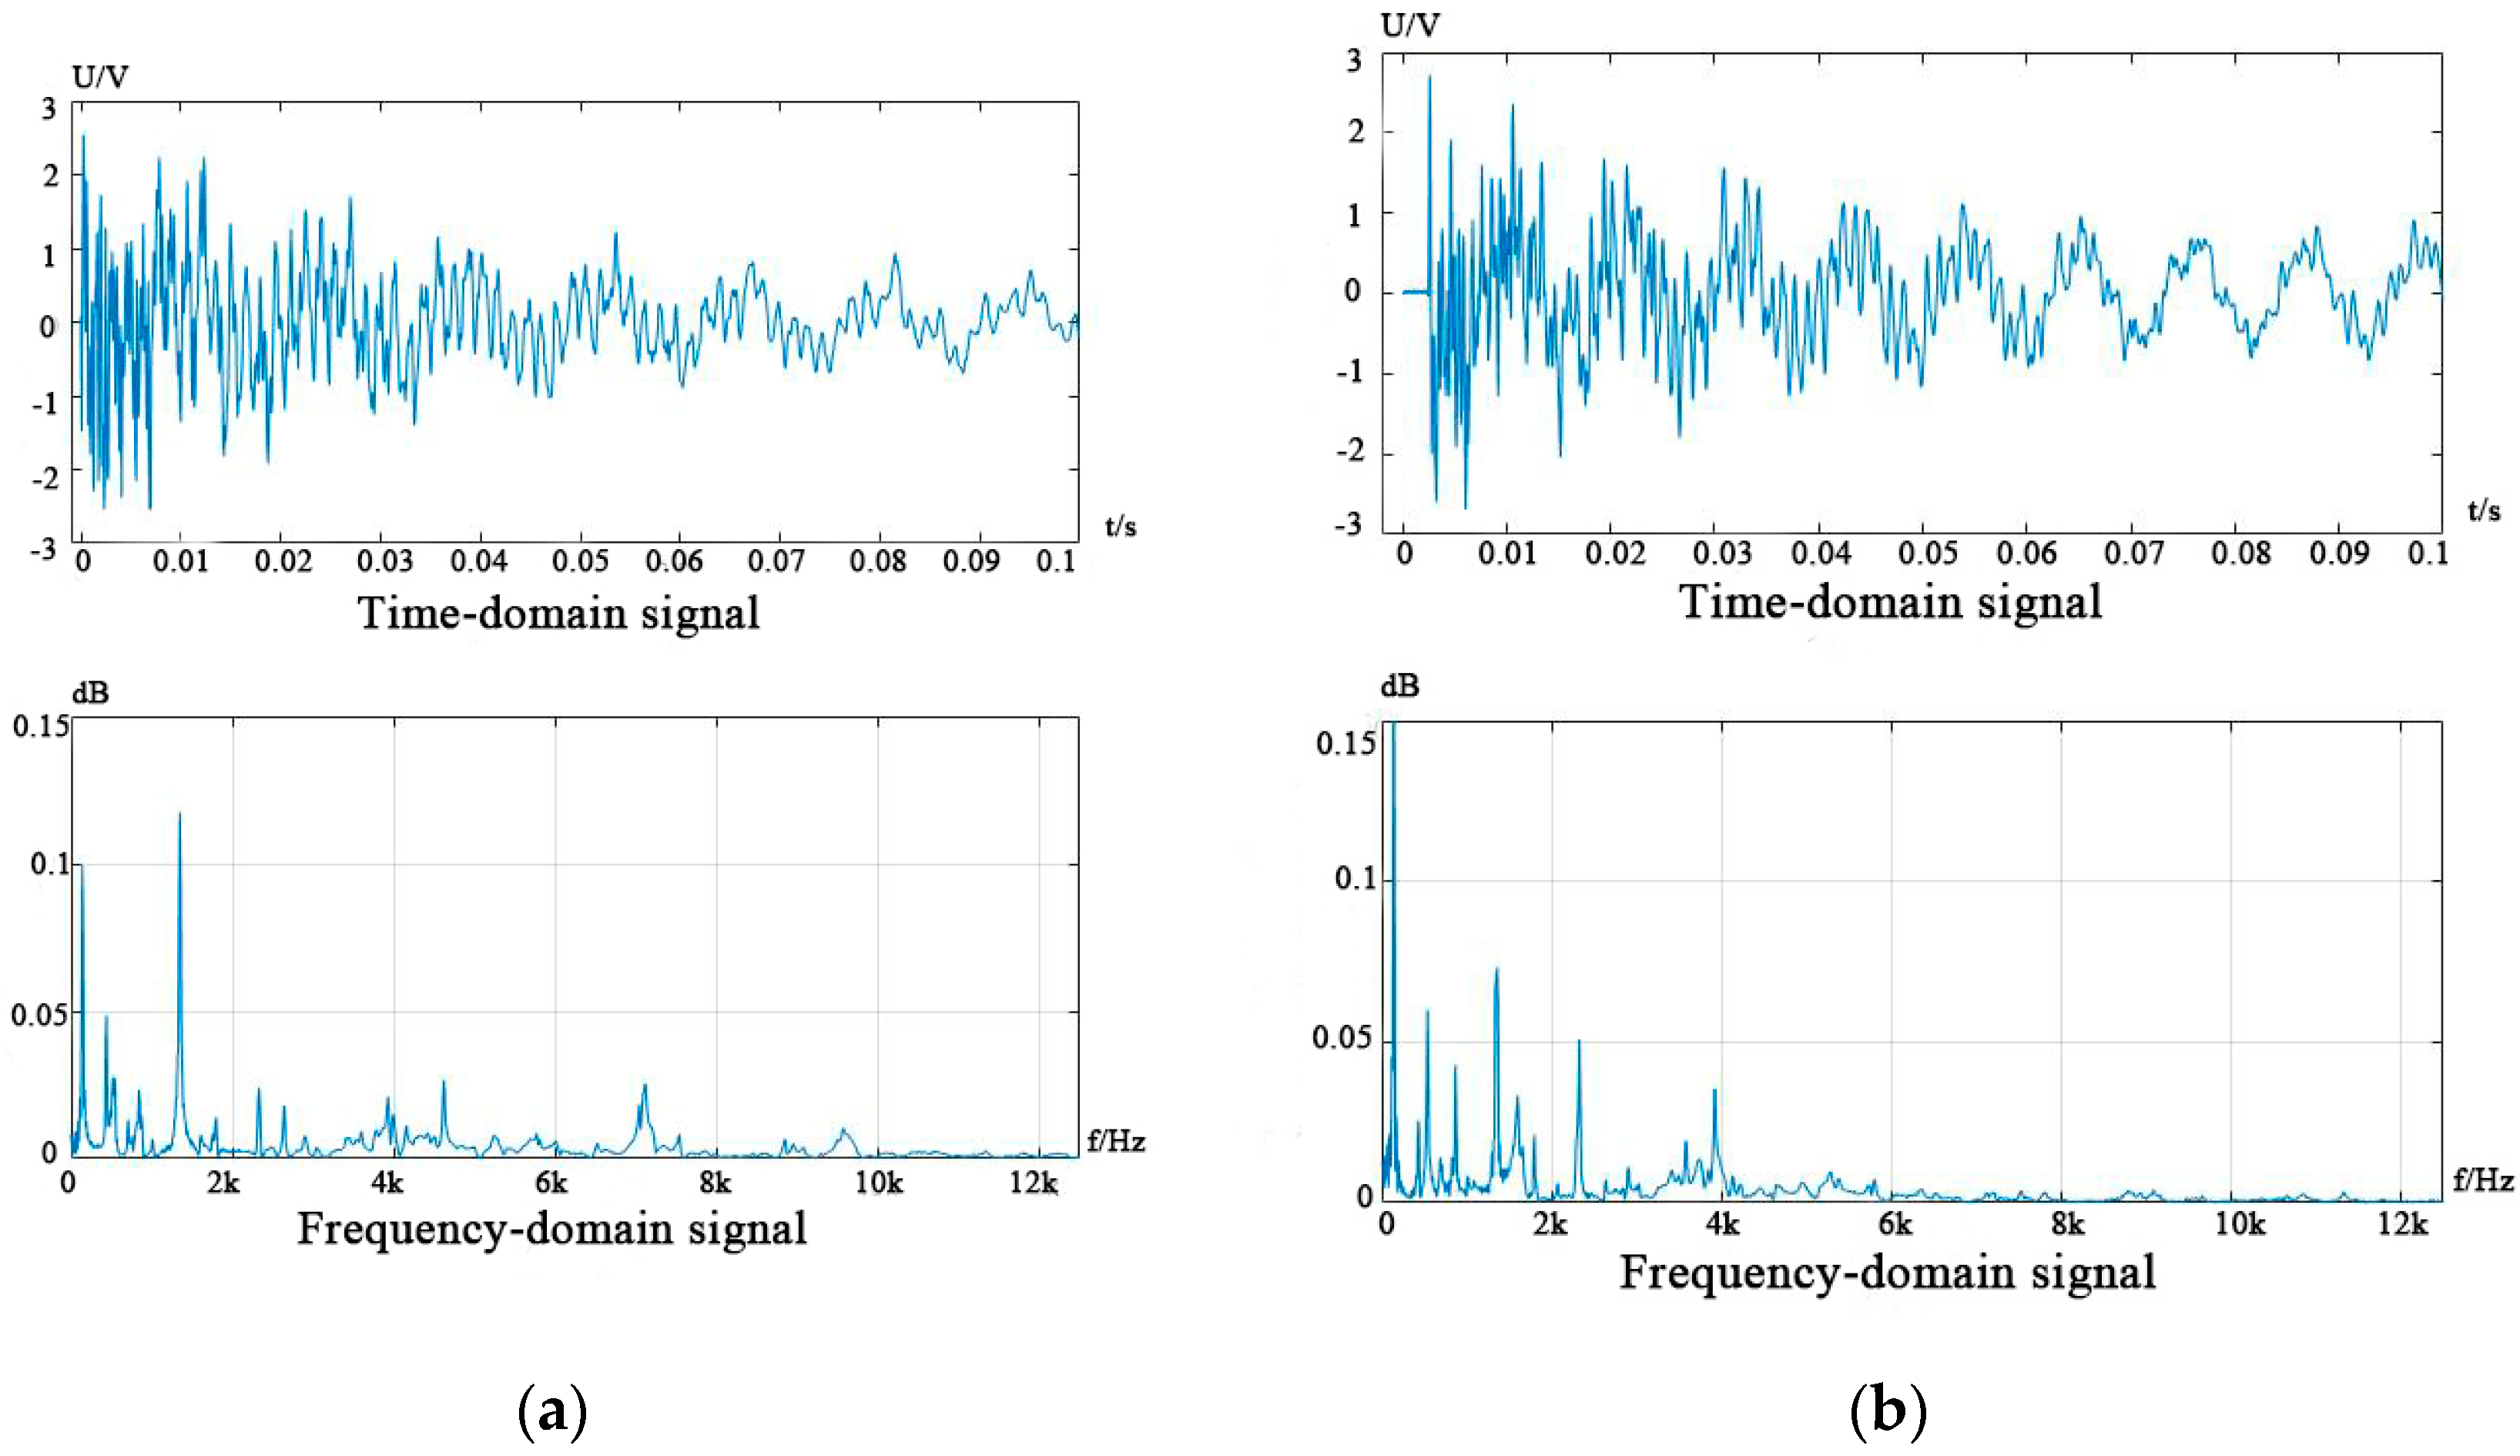
The collected vibration signal is a time domain signal, which describes the relationship between the output voltage of piezoelectric ceramic and time. The time domain waveform is the curve of the output voltage changing with time. In order to further understand and observe the signal characteristics through the measured signal, it is necessary to obtain the frequency domain signal. The Fourier Transform is used to transform the time domain signal into the frequency domain signal, and the frequency, amplitude and phase of the signal are obtained [
20,
21]. According to Nyquist’s law, the spectrum in the range of f = f
s/2 = 12,500 Hz can be analyzed within the sampling range. The time domain and frequency domain signals of corn grains and broken corncobs after transformation are shown in
Figure 3.
By observing and analyzing the collected 60 sets of signals, the amplitude intensity and frequency domain distribution of the signals generated by the corn grains collision and the signals generated by the broken corncobs collision are compared. It is found that there is no significant difference in the peak voltage of the two signals, but there is a certain difference in the frequency domain distribution. The main frequencies of the corn grains signal and broken corncobs signal are concentrated below 2 kHz or less, but the corn grain signal has a frequency of more than 6 kHz, while the broken corncob signal does not.
2.2.3. Signal Processing Circuit Design
The microprocessor cannot count the vibration signal directly output by the sensitive plate, and the signal processing circuit is needed to convert the vibration signal into a digital signal that the microprocessor can recognize. First, the function of signal processing circuit is to identify the corn grains signal, that is, filtering vibration, broken corncobs and other low-frequency interference signals, retain the high-frequency signal of the corn grains. The second is to convert the identified corn grains signal processing into a digital signal, so that the microprocessor can count the lost corn grains.
The signal processing circuit [
22,
23] is usually composed of charge amplification circuit, filter circuit, pulse shaping circuit and so on. Based on the design of the sensitive plate and the work of other researchers, this paper optimizes and improves the accuracy and efficiency of the loss monitoring sensor. Since the output voltage of the selected piezoelectric ceramic is relatively large, no charge amplification is required. The high-pass filter circuit can be used to filter out the low-frequency signal of the broken corncobs, and only the high-frequency signal of the corn grains is retained. The envelope detection circuit and voltage comparison circuit convert the filtered signal into a digital signal.
- (1)
High-pass filter circuit design
The high-pass filter circuit is used to retain the high-frequency signal of the corn grains and remove the broken corncobs signal. The cutoff frequency f
0 of the filter is set to be greater than the signal frequency generated by the broken corncobs, while the normal corn grains signal frequency is greater than f
0. According to the analysis results of
Section 2.2.2, the cutoff frequency f
0 is set to 8 kHz as the reference value of the high-pass filter circuit. The order of the filter will affect the bandwidth of the transition band. The rising rate of the first-order high-pass filter is 20 dB per ten-fold octave, and the rising rate increases by 20 dB for each additional order. Therefore, increasing the filter order can effectively reduce the bandwidth of the transition band. The introduction of positive feedback filter can increase the magnification, so that the cutoff frequency f
0 close to the characteristic frequency f
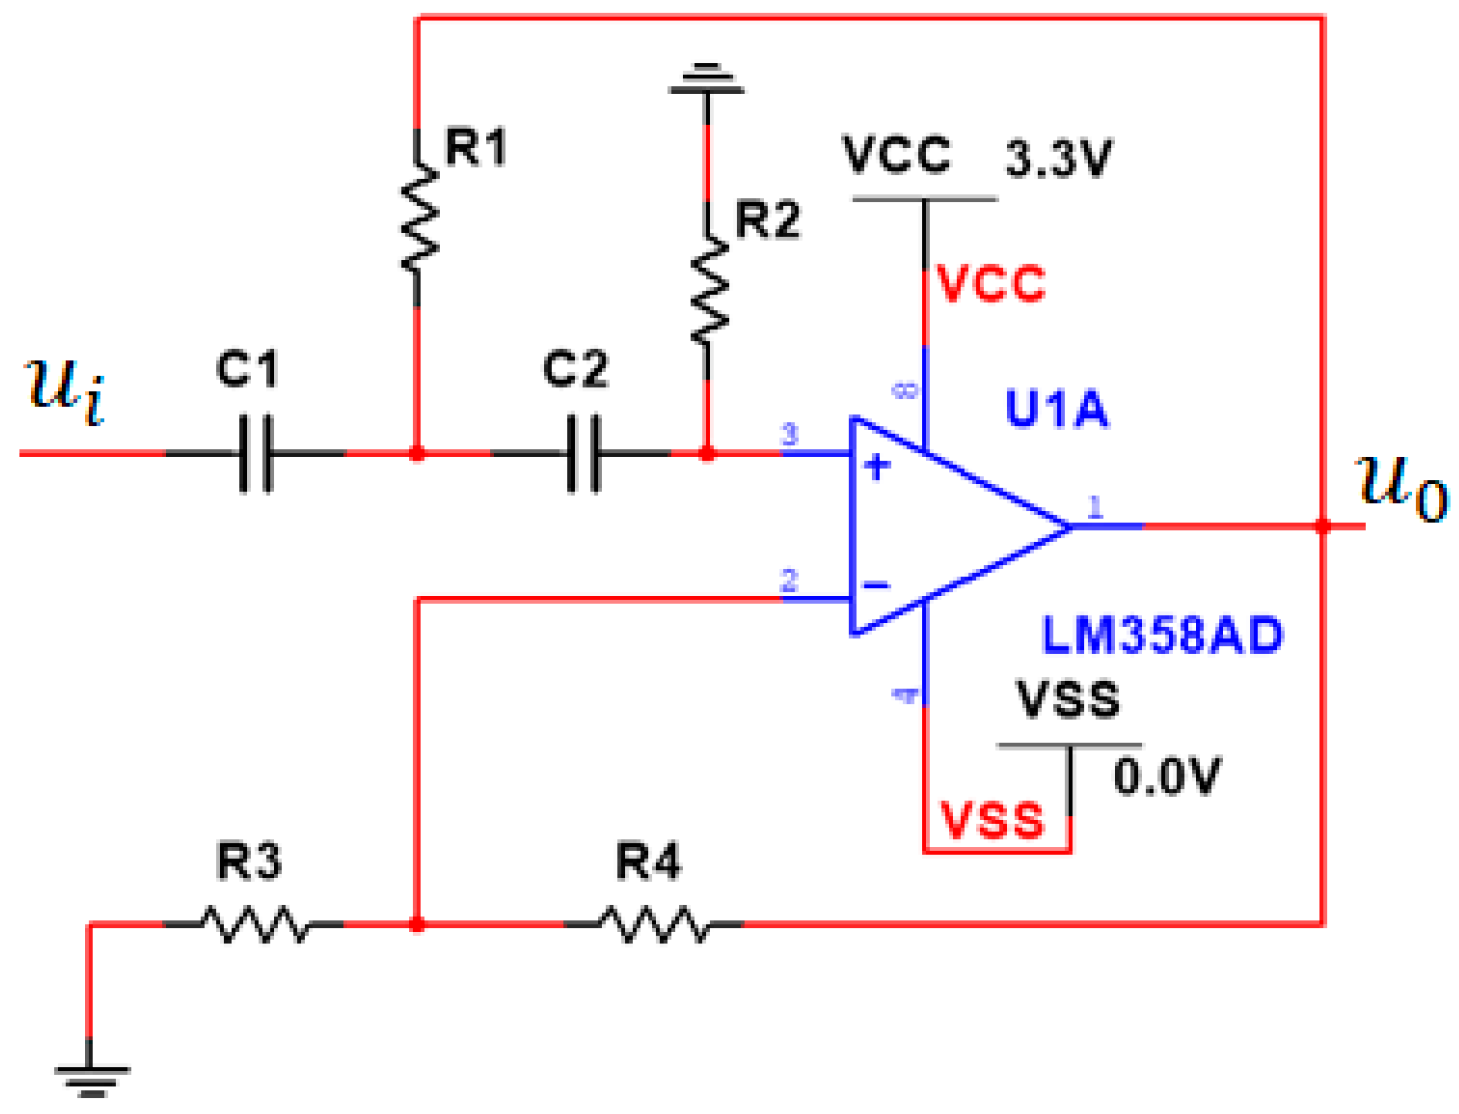
p. In summary, this study uses the voltage-controlled voltage source second-order active high-pass filter circuit shown in
Figure 4, also known as VCVS high-pass filter circuit. The transfer function of the filter circuit is:
The characteristic frequency is:
According to the original signal voltage range, microprocessor security voltage requirements, the amplifier supply voltage of 3.3 V. According to the design manual of the filter [
24,
25,
26], when the order K = 2, the normalized coefficient of the VCVS high-pass filter is B = 1.414, C = 1.00, and the value of C
1 is close to 10/f
0 μF. The resistance calculation formula is as follows (6)–(9).
- (2)
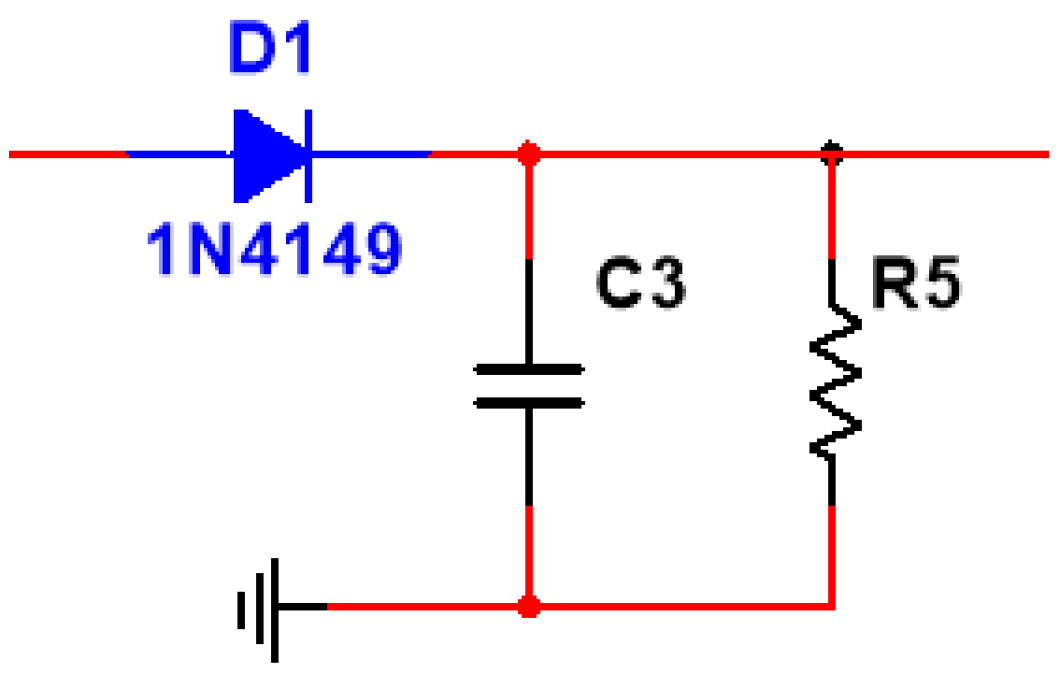
Envelope detection circuit design
The envelope detection circuit is shown in
Figure 5, which mainly utilizes the unidirectional conductive characteristics of the diode and the charging and discharging process of the detection load to complete the extraction of the modulation signal. The product of capacitance C
3 and resistance R
5 is the time constant. When the time constant has a suitable value, the output voltage corresponding to the envelope of the input voltage signal can be obtained. Therefore, the capacitance and resistance of the envelope detection circuit have a crucial impact on the performance of the circuit. According to the design experience, the time constant RC should satisfy 1/ω ≪ RC, where ω refers to the frequency of the signal, and the resistance is generally above 50KΩ, and the capacitance is at the nF level or above.
- (3)
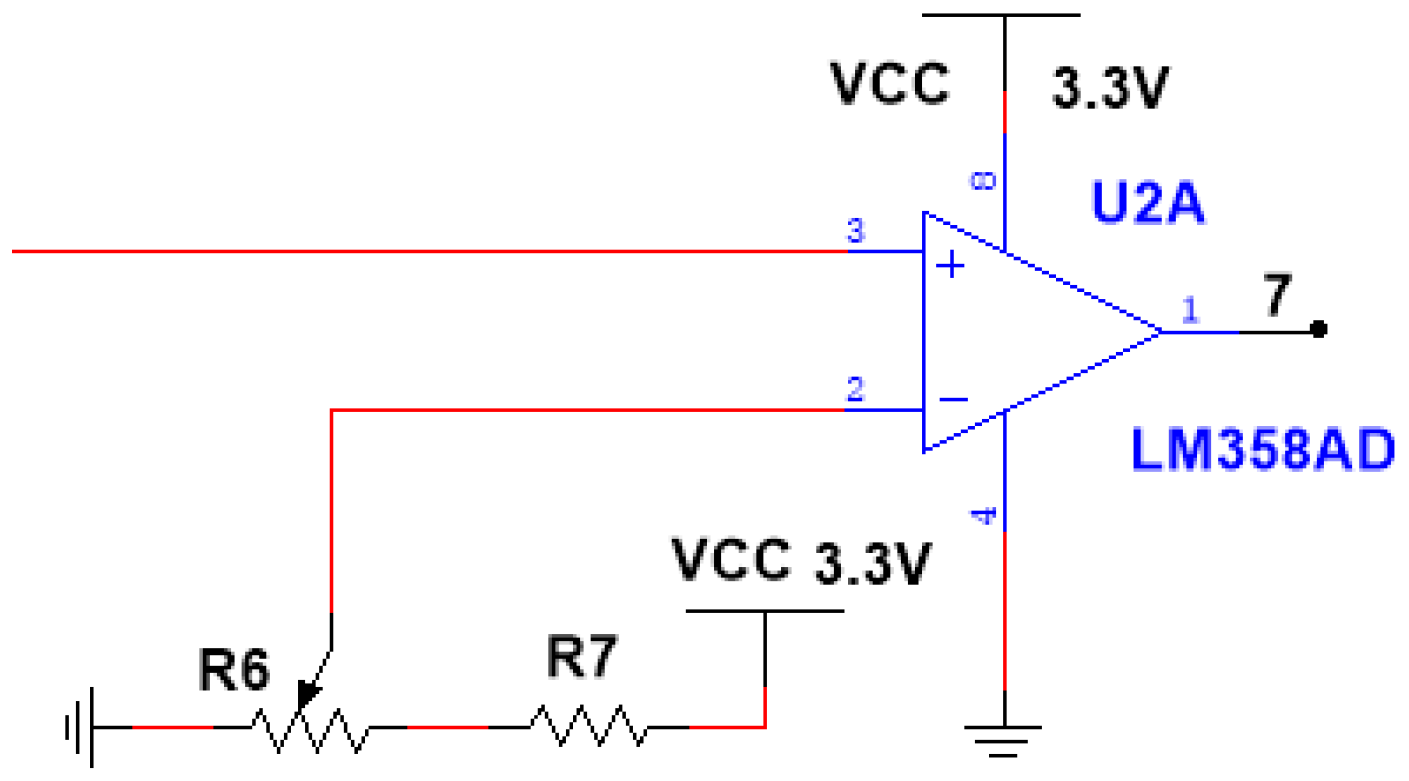
Voltage comparison circuit design
The voltage comparison circuit is shown in
Figure 6, which is a circuit for identifying and comparing input signals. Its output has only low-level and high-level two states, so the analog signal can be converted into a digital signal [
27]. When the forward input voltage of the operational amplifier is higher than the reverse input voltage, the voltage comparator output is high. Conversely, the output is low-level 0V. The operational amplifier used in this study is LM358. By adjusting the resistance of R
6 and R
7, the trigger level of the voltage comparator can be adjusted, which means the width (duty cycle) of the collected vibration signal can be adjusted to adjust the detection time of each corn grains. In order to facilitate the adjustment, R
6 is selected as a sliding rheostat.
- (4)
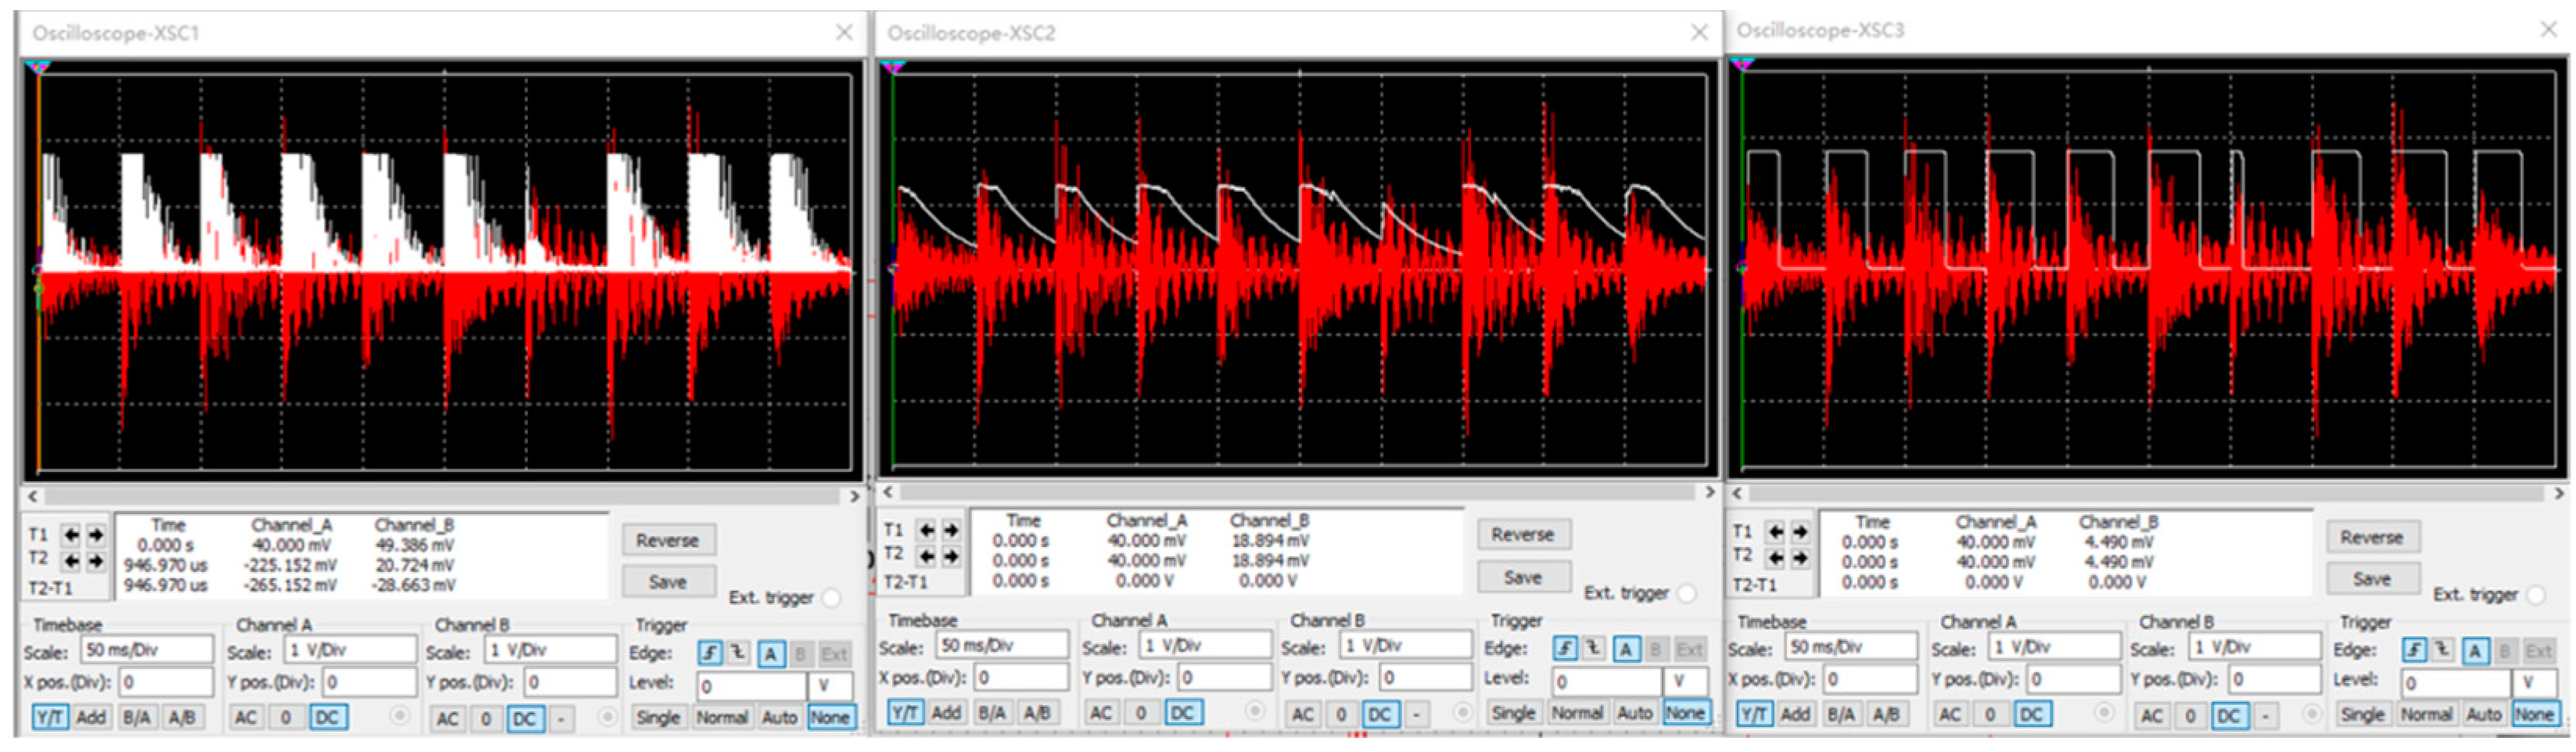
Simulation and test
The NI Multisim14.0 software was used for simulation optimization analysis. After the signal processing circuit was completed in the software, a voltage source named ‘Piecewise Linear Voltage Source’ was added to import the collected time-domain signal values using this type of voltage source. Three dual-channel oscilloscopes were placed in the circuit. One channel of each oscilloscope was connected to the voltage source, and the other channel was connected to the output end of each part of the circuit. The simulation was carried out.
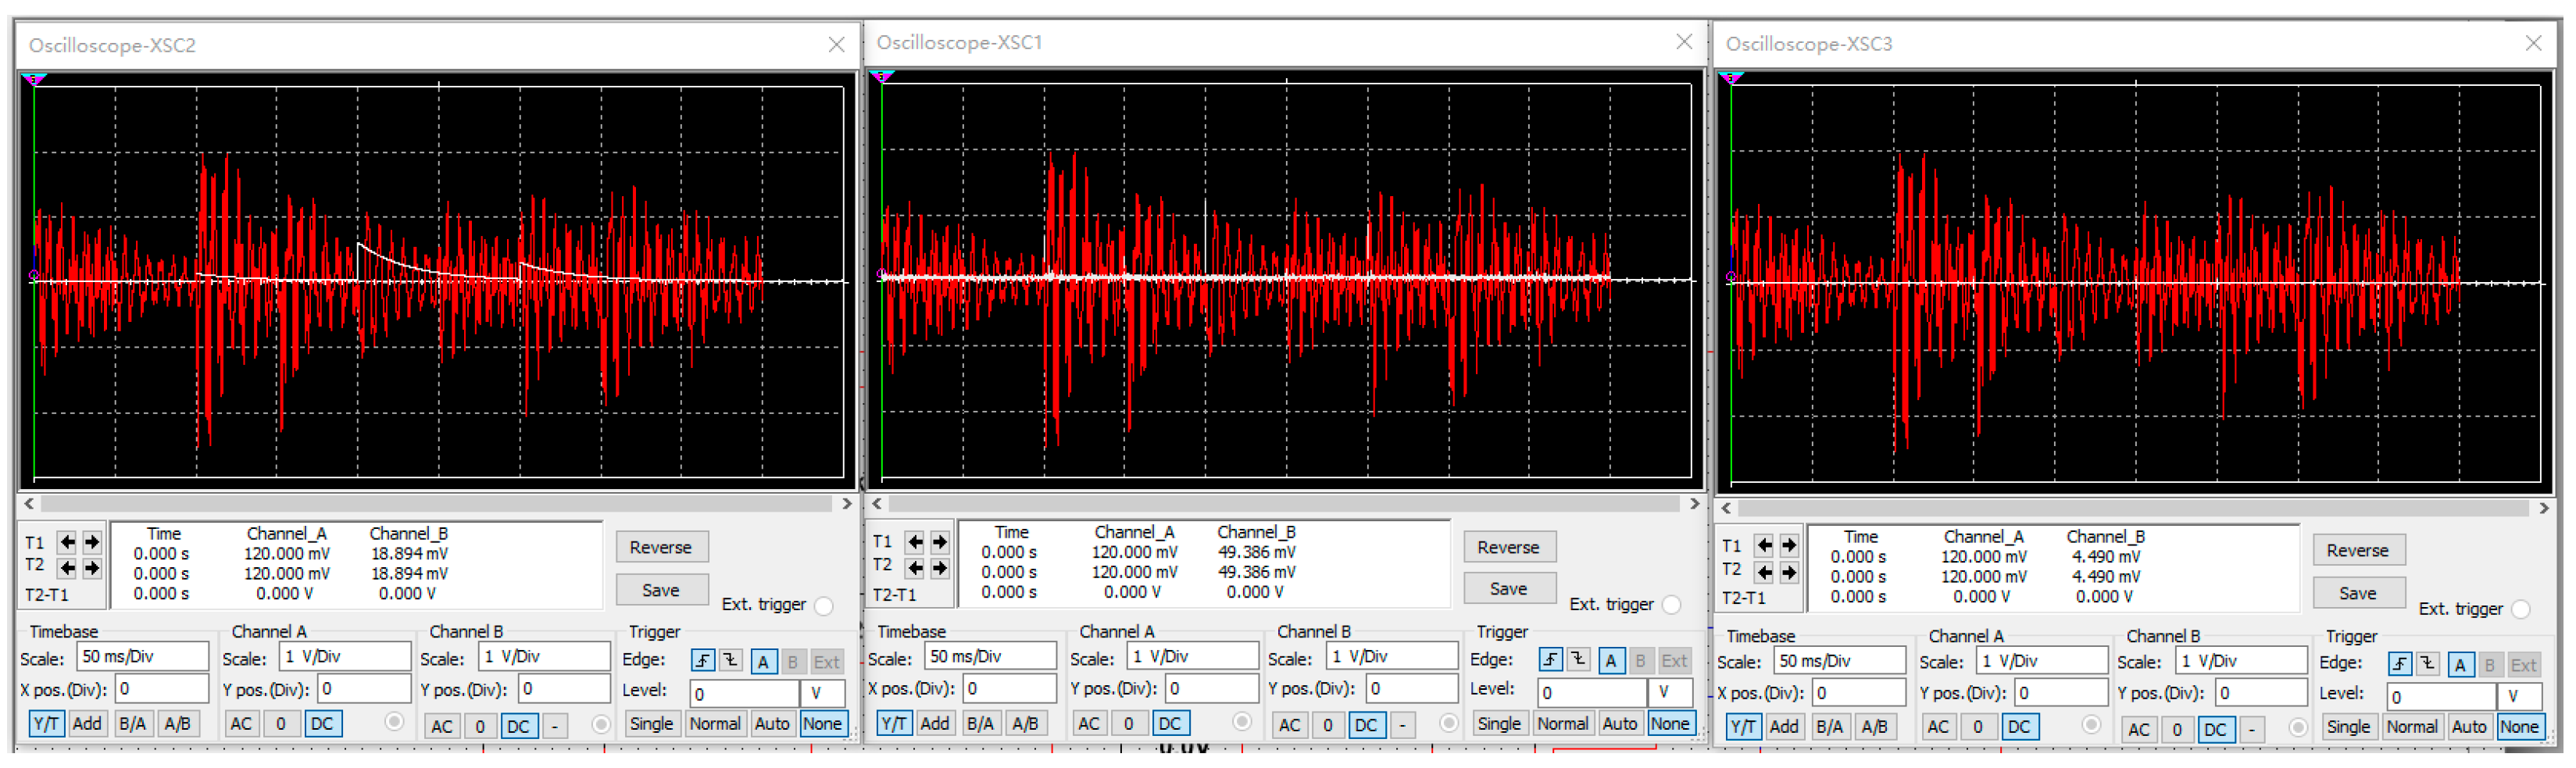
Figure 7 shows the change process of the signal generated by the corn grains collision-sensitive plate. Additionally,
Figure 8 shows the change process of the signal generated by the broken corncobs collision-sensitive plate. From left to right, is the figures show the change in the signal through the high-pass filter circuit, the envelope detection circuit, and the voltage comparison circuit. Based on the simulation results, it was found that the filter circuit can effectively filter out the low-frequency signal of the broken corncobs and retain the high-frequency signal of the corn grains. The filtered signal can output the pulse signal through the envelope detection circuit and the voltage comparison circuit, and by adjusting the sliding variable resistor, the high- and low-level signal ratio of the output pulse signal is almost the same, which is convenient for the microprocessor to count.
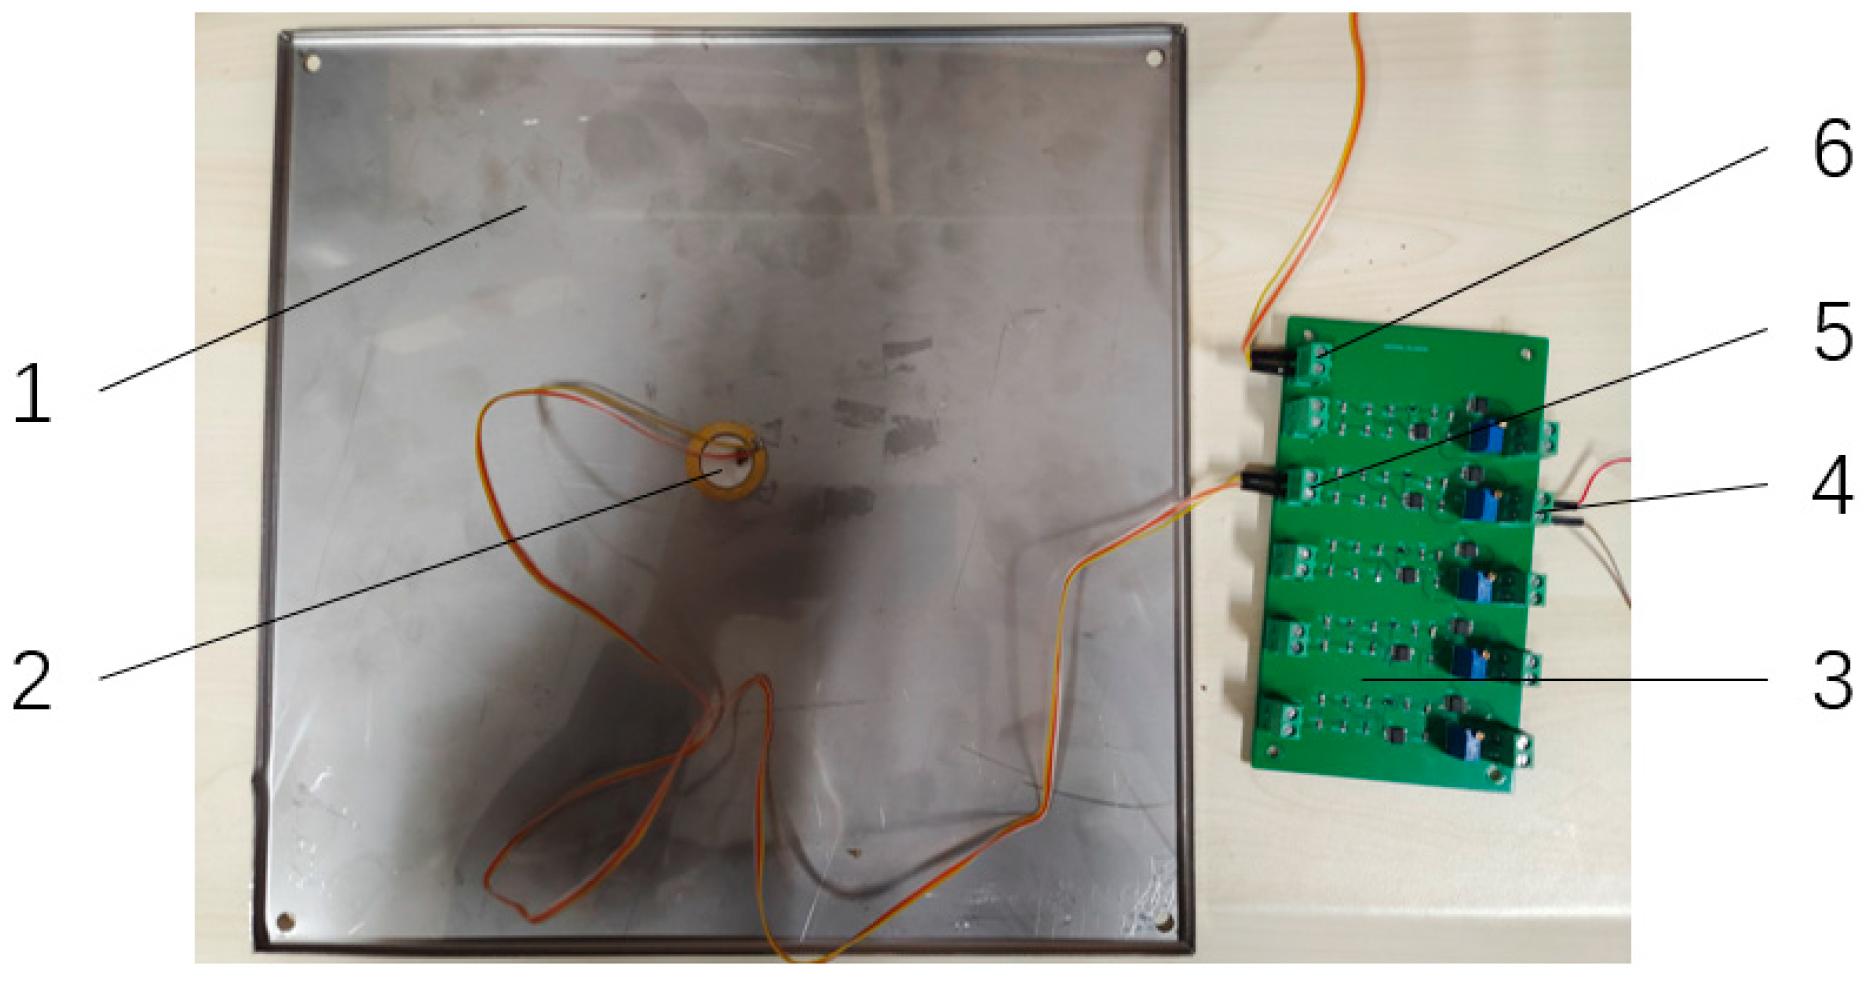
According to the designed signal processing circuit, the PCB board is made. Each circuit board has five signal processing circuits and one power input. The output end of the sensitive board signal is connected to the input end of the signal processing circuit to form a loss monitoring sensor, as shown in
Figure 9.
The oscilloscope was used to observe the changes in signals generated by corn grains and broken corncobs collision-sensitive plate through various parts of the circuit. It was found that the signal change process was similar to the simulation results. Using the microprocessor to receive the signal output, when the small-sized broken corncobs collided with the sensitive plate, the microprocessor did not produce a count. However, when large-sized broken corncobs collided with the sensitive plate, there was a certain probability that the microprocessor would produce a count, so it was necessary to install a screening device above the sensitive plate. However, when corn grains collided with the sensitive plate, there was a certain probability that the microprocessor would not produce a count, resulting in missed detection. Therefore, during the test, certain measures need to be taken to correct the relationship between the number of monitoring and the number of actual losses.


