Abstract
Solving the problem of the stem contour extraction of maize is difficult under open field conditions, and the stem diameter cannot be measured quickly and nondestructively. In this paper, maize at the small and large bell stages was the object of study. An adaptive threshold segmentation algorithm based on the color space model was proposed to obtain the stem contour and stem diameter of maize in the field. Firstly, 2D images of the maize stem in the field were captured with an RGB-D camera. Then, the images were processed by hue saturation value (HSV) color space. Next, the stem contour of the maize was extracted by maximum between-class variance (Otsu). Finally, the reference method was used to obtain the stem diameter of the maize. Scatter plots and Dice coefficients were used to compare the contour extraction effects of the HSV + fixed threshold algorithm, the HSV + Otsu algorithm, and the HSV + K-means algorithm. The results showed that the HSV + Otsu algorithm is the optimal choice for extracting the maize stem contour. The mean absolute error, mean absolute percentage error (MAPE), and root mean square error (RMSE) of the maize stem diameter at the small bell stage were 4.30 mm, 10.76%, and 5.29 mm, respectively. The mean absolute error, MAPE, and RMSE of the stem diameter of the maize at the large bell stage were 4.78 mm, 12.82%, and 5.48 mm, respectively. The MAPE was within 10–20%. The results showed that the HSV + Otsu algorithm could meet the requirements for stem diameter measurement and provide a reference for the acquisition of maize phenotypic parameters in the field. In the meantime, the acquisition of maize phenotypic parameters under open field conditions provides technical and data support for precision farming and plant breeding.
1. Introduction
Maize is an important food crop. Optimal varieties of maize are bred to increase their yield. Genetic and phenotypic analyses are the basis of maize breeding research [1,2,3]. Current genetic technology is developing rapidly, but the relative lag of phenotype monitoring technology is gradually leading to a bottleneck in crop breeding development [4,5]. The acquisition of maize phenotypic parameters can provide data support for germplasm screening and research on monitoring field maize growth [6,7,8]. In traditional phenotype monitoring technology, rulers were used to measure the phenotypic parameters of maize. The accuracy of measurement was high, but manual labor was heavily required. In addition, the efficiency was low and contact measurements destroyed the maize plants [9,10]. In modern phenotype monitoring techniques, phenotypic parameters of maize were measured by laser and image sensors. These sensors included LiDAR, color cameras, and depth cameras. This is a non-contact measurement method. Maize plants were measured nondestructively by this method. The method has improved the efficiency of measuring maize phenotypic parameters. Farmers no longer use vernier calipers to manually measure maize phenotypic parameters, reducing farmers’ labor intensity. The development of maize phenotype monitoring technology was promoted.
Among the phenotypic parameters of maize, stem diameter is one of the important agronomic traits. It can predict lodging resistance and yield [11,12,13]. Rapid and nondestructive measurement of maize stem diameter has been the focus of maize phenotype research. Miao et al. [14] used ground-based LiDAR to obtain 3D point cloud data of maize. Maize plant height and stem diameter were measured quickly and automatically. The sensor was less affected by light, but it required high-quality point cloud data, and the computational effort required was large. Moreover, image data cannot be acquired through this sensor. In addition to laser sensors, image sensors have also been used to obtain crop phenotype parameters. Bao et al. [15] studied a robotic system. Time-of-flight (TOF) cameras were mounted on a mobile robot to obtain 3D point cloud data of maize. An algorithm was developed to extract maize plant height, leaf angle, and stem diameter. The mean absolute error values of plant height before and after flowering were 0.15 m and 0.054 m, respectively. The mean absolute error value of the leaf inclination angle was 2.8°. Except for the stem diameter, the system was robust and accurate. Atefi et al. [16] developed a robotic system to measure the stem diameter of maize. A TOF camera was used as the sensor for this system. Deep learning algorithms were used to detect the stems in the images. Image processing techniques were used to find the grasping points on the stems. The stem diameter of the maize was measured by a linear potentiometer (LP) sensor. The relative error between the automatic and manual measurements was 4.97%. Although TOF cameras are lower-priced sensors, their camera resolution is insufficient and sensitive to natural light. Therefore, the extraction accuracy of maize stem diameter is limited under open field conditions. In recent years, RGB-D cameras have attracted the attention of scholars. They can acquire color images, depth images, and 3D point clouds of crops at low price and high resolution. Among many RGB-D cameras, the Intel RealSense D435 camera shows low sensitivity to lighting conditions. It is suitable for extracting crop phenotypic parameters under open field conditions [17]. Qiao et al. [18] used an Intel RealSense D435i camera to capture images of red jujube tree trunks, and the improved PSPNet model was used to segment the tree trunks. Image processing techniques and the Euclidean distance formula were used to measure the tree trunks’ diameter. Compared with the original network, the average relative error of the algorithm was reduced by 9.92%. However, the trunk was marked point by point, and the workload was large. Fan et al. [19] proposed an in situ measurement method of the stem diameter of maize based on high-throughput phenotyping robots. An Intel RealSense D435i camera was used to obtain 3D point cloud data of maize. The stem diameter was calculated by the planar projection of the convex hull and point cloud. The results showed that the R2 and root mean square error (RMSE) of the stem diameter measurement were 0.72 and 2.95 mm, respectively, with high measurement accuracy.
In conclusion, the study of crop phenotypic monitoring technologies is moving in the direction of high accuracy, high robustness, and multiple scenarios. In this paper, maize was the object of study. An Intel RealSense D435i camera was used to obtain color images of maize in the field. The stem contour of the maize was extracted by hue saturation value (HSV) color space and the adaptive threshold segmentation algorithm. The stem diameter of the maize was measured by the reference method. This study combined contour extraction and stem diameter measurement based on image processing techniques. It provides more complete and diverse phenotype data for agronomists and a basis for subsequent studies combined with 3D point clouds.
2. Materials and Methods
2.1. Data Collection
The experimental site was the teaching and research base of Jilin Agricultural University, Changchun, Jilin Province. The maize variety was Ji nong yu 218. A planting area of 36 × 30 m2 was selected as the experimental field. The planting density was 67,000/hm2. The planting row spacing was 50 cm, and the plant spacing was 40 cm. Images were collected from 11:00 to 15:00 in July 2021 and July 2022.The data can be divided into two periods: the small-bell stage, with 10 leaves, and the large-bell stage, with 14 leaves. The plants have little overlapping cover in the pre-growth period, and the crown density is negligible. The main instruments used in this study were an Intel RealSense D435i camera, a shooting platform, a Vernier caliper, a checkerboard grid, and a laptop. The checkerboard grid consisted of black and white squares. The dimensions of each square were 15 × 15 mm. The Intel RealSense D435i camera rotated 40° from the vertical plane toward the maize plant to capture color images of maize in the field. The distance between the camera and the ground was 50 cm, and the camera was 60 cm from the bottom of the stem. The information collection device is shown in Figure 1. Intel RealSense SDK 2.0 was installed on a Windows 10 operating system. Color images of the maize were stored in the data collection terminal. Four rows of maize were randomly selected in the experimental field for image acquisition. The camera takes two sets of images of the same maize plant in the same attitude: one with a checkerboard and one without a checkerboard. A Vernier caliper was used to measure the true value of the maize stem diameter. The maize stem collection information is shown in Figure 2. According to the guidance of agronomists, the second stem node of the maize was set as the area of interest [20]. Three sets of stem diameters were measured randomly in the area. The average of the three groups of stem diameters was taken as the true diameter.
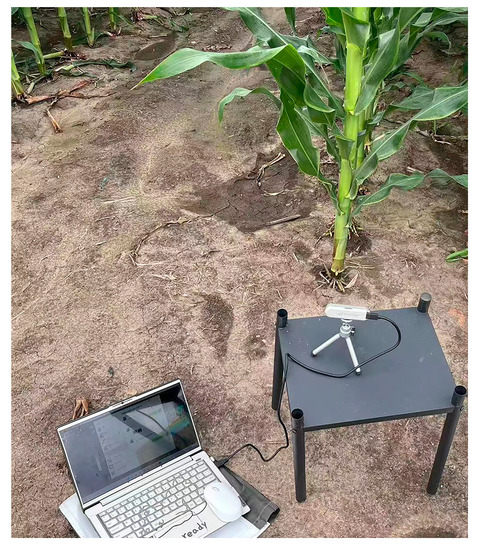
Figure 1.
Image acquisition device.
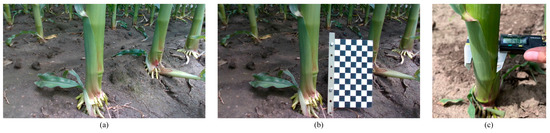
Figure 2.
Maize stem information collection: (a) field maize image; (b) field maize image with a checkerboard grid; (c) digital display Vernier caliper measurement.
2.2. Color Image Processing
The stem contour of the maize was extracted by image processing techniques. The overall process included color space selection and image segmentation.
2.2.1. Color Space Selection
The variation in light intensity in the field affected the shooting effect, and the field color image contained maize plants and soil, which have significant color differences. Therefore, it is beneficial for image segmentation to choose a color space model in which the luminance and chrominance components are independent and retain color information.
In order to select the color space model most suitable for this paper, three color space models were considered. The RGB model consists of red (R), green (G), and blue (B) and is the most common model of color space. However, the RGB model is usually used to process grayscale images; as such, it is liable to lose color information and is sensitive to brightness information. Therefore, it is not applicable to the study in this paper. Y denotes the brightness information in Ycrcb. Cb denotes the difference between blue composition and brightness. Cr denotes the difference between red composition and brightness. In this paper, the green target will be extracted. Therefore, this method also is not applicable. The HSV color space model is created on the basis of the intuitive characteristics of colors. This model matches the human visual characteristic. Therefore, it is commonly used in the research of the acquisition of plant phenotypic information, shadow elimination, and deer body segmentation [21,22,23]. In the HSV model, H is hue, S is saturation, and V is chroma. Hue can reflect the plant color information well and separate the target from the background [24,25]. Therefore, the HSV color space model is the best choice for image processing in this paper. The formula for converting RGB into HSV is shown below.
2.2.2. Image Segmentation
Image segmentation is an essential step in feature extraction. Threshold segmentation algorithms and image segmentation algorithms based on clustering are commonly used to process agricultural images [26,27,28]. In order to select the image segmentation algorithm most suitable for this paper, three image segmentation algorithms were compared. The fixed threshold algorithm determines the optimal threshold on the basis of prior knowledge. The threshold value is selected manually. However, images with different degrees of lightness and darkness cannot be processed well by this algorithm. The K-means algorithm is an unsupervised clustering algorithm. Firstly, the K initial cluster centers are randomly selected. Moreover, the distance is used as a similarity index to divide the remaining objects into the nearest cluster center. Then, the center points of each cluster are recalculated to obtain the new cluster center points. The calculation is carried out iteratively until the clustering objective function converges. However, the choice of K values is difficult. The maximum between-class variance (Otsu) is an adaptive thresholding segmentation algorithm. This algorithm divides images into background and target pixels. The optimal threshold value is selected by maximizing the between-class variance. The algorithm is not affected by image brightness and contrast. Furthermore, the threshold value is selected automatically. Therefore, the Otsu algorithm is the best choice for threshold segmentation. The formula of Otsu is shown below.
Here, ω0 and ω1 represent the ratio of target and background pixels to the image pixels, respectively. u0 and u1 represent the mean grayscale value of the target and background pixels, respectively. u represents the mean grayscale value of the whole image. σ2 represents the between-class variance.
Two groups of field maize images from 60 samples in two periods were randomly selected for the experiments. The field maize images, images based on the HSV, and images based on HSV + Otsu are shown in Figure 3 and Figure 4.
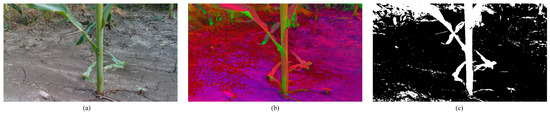
Figure 3.
Image processing of maize at the small bell stage: (a) field maize image; (b) hue saturation value (HSV) color space image; (c) HSV + maximum between-class variance (Otsu) image.
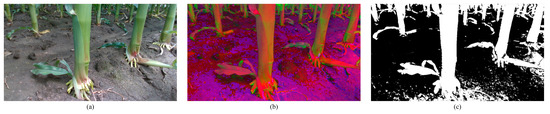
Figure 4.
Image processing of maize at the large bell stage: (a) field maize image; (b) HSV color space image; (c) HSV + Otsu image.
2.3. Measurement Method of the Stem Diameter of Maize
The stem contour of the maize was extracted from the complex field environment by using the HSV + Otsu algorithm. The reference method was used to relate the 3D experimental scenes with the 2D images. The flow chart of stem diameter measurement is shown in Figure 5.
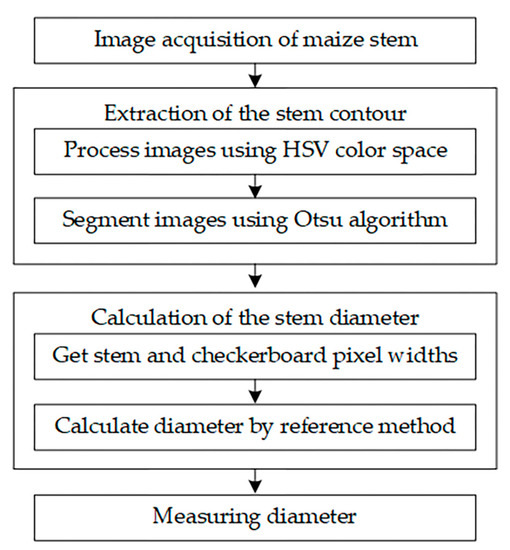
Figure 5.
Flow chart of measurement of the stem diameter.
In Python, the coordinates were extracted semiautomatically by library functions in the OpenCV library. The console can output coordinate results. In this paper, the reference method was used to extract the stem diameter parameters. The principle of the reference method is pinhole imaging. A checkerboard grid was used as reference object. The resolution of the original image was 1280 × 720 and the resolution of the processed image was still 1280 × 720, so the stem diameters were calculated by using the checkerboard grid of the original image instead of the checkerboard grid of the image after processing. This avoids the influence of an incomplete checkerboard after image processing on the experiment. The side length of each square in the checkerboard grid is n. The average pixel width of the three squares is w. Three groups of contour points were randomly selected within the second stem node of the maize. The average pixel width of the three sets of contour points is l. L is the measuring diameter of the maize stem. The process of measuring the stem diameter of the maize is shown in Figure 6. L can be calculated according to Formula (5):
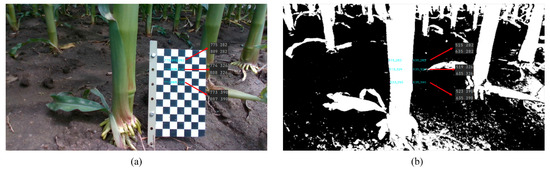
Figure 6.
The process of measuring the stem diameter of maize: (a) pixel width of the square and (b) pixel width of maize stem.
2.4. Experimental Platform
The Python programming language and the OpenCV image library were used in this experiment. The experimental environment and parameter settings are shown in Table 1.

Table 1.
Experimental environment.
2.5. Evaluation Indicators
2.5.1. Image Evaluation for Contour Extraction
The images were evaluated by using a combination of subjective and objective methods. The 3D scatter plot was used to intuitively evaluate the impact of ambient noise on the segmentation target. The Dice coefficient was used to calculate the similarity of the two samples [29,30]. The values of the Dice coefficient ranged from 0 to 1, indicating no similarity to complete consistency. The formula for the Dice coefficient is as follows:
Here, A represents the number of pixels of the predicted image and B represents the number of pixels of the manually segmented image.
2.5.2. Evaluation Metrics for Stem Diameter Error
Absolute error, mean absolute percentage error (MAPE), and root mean square error (RMSE) were used to assess the accuracy of the stem diameter measurement. Absolute error is the difference between the true diameter and the measuring diameter. The formulas for MAPE and RMSE are as follows:
Here, m represents the number of maize plant samples, Si represents the true diameter, and Li represents the measuring diameter.
3. Results
3.1. Comparison of Different Contour Extraction Methods
Take the first group of maize images in the field as an example. Photoshop was used to obtain the manually segmented image. Scatter plots were used to compare the contour extraction effects of the HSV + K-means algorithm, the HSV + fixed threshold algorithm, and the HSV + Otsu algorithm. The results are shown in Figure 7, Figure 8 and Figure 9. The manually segmented image and scatter plot are shown in Figure 10. The values of the Dice coefficient of the three algorithms are shown in Figure 11.
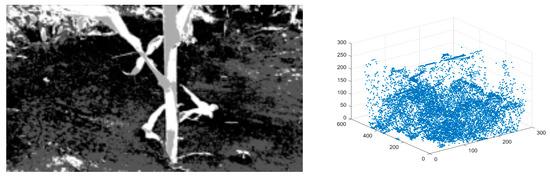
Figure 7.
Processing result of the HSV + K-means algorithm.
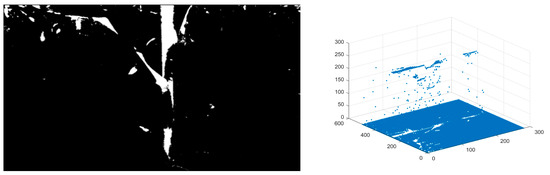
Figure 8.
Processing result of the HSV + fixed threshold algorithm.
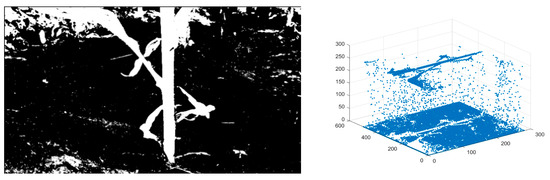
Figure 9.
Processing result of the HSV + Otsu algorithm.
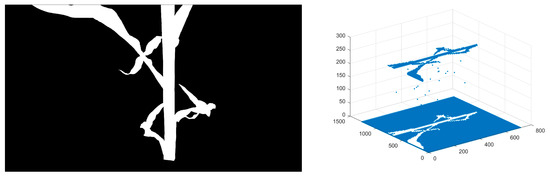
Figure 10.
Processing result of the manually segmented image.
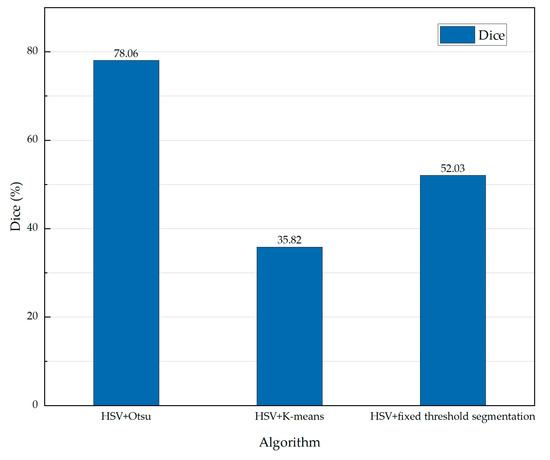
Figure 11.
Histogram of the values of the Dice coefficient.
Figure 7, Figure 8, Figure 9 and Figure 10 show that the processing result of the HSV + Otsu algorithm was closest to that of the manual segmentation effect. Figure 11 shows that the values of the Dice coefficient of the HSV + Otsu algorithm, the HSV + K-means algorithm, and the HSV + fixed threshold algorithm were 78.06%, 35.82%, and 52.03%, respectively. The results show that the HSV + Otsu algorithm is the optimal choice to extract the stem contour of maize.
3.2. Error Analysis of Stem Diameter Measurement
In order to verify the accuracy of the HSV + Otsu algorithm, a total of 60 groups of maize images in the field during two periods were selected for comparison experiments. The comparison results between the true diameter and measuring diameter of the maize stem are shown in Table 2.
Table 2.
Comparison between the true diameter and measuring diameter of the maize stem.
The results show that the mean absolute error, MAPE, and RMSE of the stem diameter of the maize at the small-bell stage were 4.30 mm, 10.76%, and 5.29 mm, respectively. The mean absolute error, MAPE, and RMSE of the stem diameters of the maize at the large bell stage were 4.78 mm, 12.82%, and 5.48 mm, respectively. The MAPE was within 10–20%. In summary, the HSV + Otsu algorithm can accurately measure the stem diameter of maize in the small- and large-bell stages.
4. Discussion
To focus on the need for extraction of crop phenotypic parameters under open field conditions, an Intel RealSense D435i camera was used to obtain color images of the maize at different growing stages. Image processing techniques were used to extract the stem contour. The reference method was used to obtain the stem diameter of the maize. The experimental results showed that the HSV + Otsu algorithm was feasible to obtain the stem contour and diameter.
However, some limitations in the proposed method remain to be addressed. Firstly, although using the HSV + Otsu algorithm made it possible to obtain maize stem contours under sunny conditions, the robustness of the HSV + Otsu algorithm under different weather conditions was not verified. In addition, to reduce interference from the ground and adjacent plants, the camera angle was set to tilt 40° from the vertical plane toward the maize plant. To reduce the distortion of the checkerboard grid image, the checkerboard grid was kept parallel to the image plane of the camera by tilting it backward. However, the backward tilt caused an error in calculating the stem diameter. The error in the vertical direction was greater than the error in the horizontal direction. The stem diameter was calculated through the data in the horizontal direction. The mean absolute percentage error (MAPE) was within 10–20%.
In the future, the combination of 2D coordinates and 3D point cloud data will be the focus of follow-up research, as well as the measurement of other phenotypic parameters such as plant height, leaf width, and leaf inclination angle through image processing techniques. Moreover, phenotypic parameters of maize in other growth stages besides the small and large bell stages will also be a focus for future research. This will provide ideas for maize phenotypic monitoring techniques and more comprehensive data support for agronomists.
5. Conclusions
An adaptive threshold segmentation algorithm based on HSV + Otsu was proposed to extract the stem contour of maize in the field. The HSV + Otsu algorithm was compared with the HSV + fixed threshold algorithm and the HSV + k-means algorithm, and the results show that the HSV + Otsu algorithm was the optimal choice for extracting maize stem contour. The reference method was used to obtain the stem diameter of the maize. The mean absolute error, MAPE, and RMSE of the stem diameter of the maize at the small- bell stage were 4.30 mm, 10.76%, and 5.29 mm, respectively. The mean absolute error, MAPE, and RMSE of the stem diameter of the maize at the large-bell stage were 4.78 mm, 12.82%, and 5.48 mm, respectively. The error range of the MAPE was within 10–20%. The results show that the HSV + Otsu algorithm can meet the demand of stem diameter measurement. It can provide a reference for the acquisition of the phenotypic parameters of maize. It is significant for predicting the lodging resistance, yield, and growth control time of maize to carry out field experiments during two rapid growth periods. At the same time, the accurate acquisition of phenotypic parameters of maize across multiple periods also provides essential data support for genetic breeding. The measurement of multiple crop phenotypic parameters during multiple growth periods will also provide a new impetus for solving the maize yield crisis.
Author Contributions
Conceptualization, J.Z.; methodology, J.Z.; software, Y.W., K.M., and M.W.; validation, Y.W. and M.C.; formal analysis, W.W.; investigation, J.C. and Y.G.; resources, J.C.; data curation, Y.W.; writing—original draft preparation, J.Z., Y.W., and M.C.; writing—review and editing, X.G. and W.W.; visualization, Y.W. and M.C.; supervision, X.G. and W.W.; project administration, J.Z.; funding acquisition, J.Z. All authors have read and agreed to the published version of the manuscript.
Funding
This study was supported by Ministry of Science and Technology of the People’s Republic of China (2022YFD200160202), the Education Department of Jilin Province (JJKH20220336KJ), National Innovation and Entrepreneurship Training Project for University (China) (202110193017) and Jilin Provincial Department of science and technology (20230202042NC).
Institutional Review Board Statement
Not applicable.
Data Availability Statement
The data presented in this study are available on request from the corresponding author.
Acknowledgments
The authors would like to thank the editors and anonymous reviewers for their constructive comments on our manuscript.
Conflicts of Interest
The authors declare no conflict of interest.
References
- Andorf, C.; Beavis, W.D.; Hufford, M.; Smith, S.; Suza, W.P.; Wang, K.; Woodhouse, M.; Yu, J.; Lübberstedt, T. Technological advances in maize breeding: Past, present and future. Theor. Appl. Genet. 2019, 132, 817–849. [Google Scholar] [CrossRef]
- Pratap, A.; Gupta, S.; Nair, R.M.; Schafleitner, R.; Basu, P.; Singh, C.M.; Prajapati, U.; Gupta, A.K.; Nayyar, H.; Mishra, A.K.; et al. Using plant phenomics to exploit the gains of genomics. Agronomy 2019, 9, 126. [Google Scholar] [CrossRef]
- Wang, B.; Lin, Z.; Li, X.; Zhao, Y.; Zhao, B.; Wu, G.; Ma, X.; Wang, H.; Xie, Y.; Li, Q.; et al. Genome-wide selection and genetic improvement during modern maize breeding. Nat. Genet. 2020, 52, 565–571. [Google Scholar] [CrossRef] [PubMed]
- Song, P.; Wang, J.; Guo, X.; Yang, W.; Zhao, C. High-throughput phenotyping: Breaking through the bottleneck in future crop breeding. Crop. J. 2021, 9, 633–645. [Google Scholar] [CrossRef]
- Yang, W.; Feng, H.; Zhang, X.; Zhang, J.; Doonan, J.H.; Batchelor, W.D.; Xiong, L.; Yan, J. Crop phenomics and high-throughput phenotyping: Past decades, current challenges, and future perspectives. Mol. Plant. 2020, 13, 187–214. [Google Scholar] [CrossRef]
- Tu, K.; Wen, S.; Cheng, Y.; Xu, Y.; Pan, T.; Hou, H.; Gu, R.; Wang, J.; Wang, F.; Sun, Q. A model for genuineness detection in genetically and phenotypically similar maize variety seeds based on hyperspectral imaging and machine learning. Plant Methods 2022, 18, 81. [Google Scholar] [CrossRef]
- Qiu, Q.; Sun, N.; Bai, H.; Wang, N.; Fan, Z.; Wang, Y.; Meng, Z.; Li, B.; Cong, Y. Field-based high-throughput phenotyping for maize plant using 3D LiDAR point cloud generated with a “Phenomobile”. Front. Plant. Sci. 2019, 10, 554. [Google Scholar] [CrossRef]
- Qiu, R.; Zhang, M.; He, Y. Field estimation of maize plant height at jointing stage using an RGB-D camera. Crop. J. 2022, 10, 1274–1283. [Google Scholar] [CrossRef]
- Xue, J.; Gao, S.; Li, L.; Xu, H.; Ming, B.; Wang, K.; Hou, P.; Xie, R.; Li, S. Synergistic development of maize stalk as a strategy to reduce lodging risk. Agron. J. 2020, 112, 4962–4975. [Google Scholar] [CrossRef]
- Shang, Q.; Zhang, D.; Li, R.; Wang, K.; Cheng, Z.; Zhou, Z.; Hao, Z.; Pan, J.; Li, X.; Shi, L. Mapping quantitative trait loci associated with stem-related traits in maize (Zea mays L.). Plant. Mol. Biol. 2020, 104, 583–595. [Google Scholar] [CrossRef]
- Liu, H.; Wang, H.; Shao, C.; Han, Y.; He, Y.; Yin, Z. Genetic Architecture of Maize Stalk Diameter and Rind Penetrometer Resistance in a Recombinant Inbred Line Population. Genes 2022, 13, 579. [Google Scholar] [CrossRef] [PubMed]
- Huang, J.; Liu, W.; Zhou, F.; Peng, Y.; Wang, N. Mechanical properties of maize fibre bundles and their contribution to lodging resistance. Biosyst. Eng. 2016, 151, 298–307. [Google Scholar] [CrossRef]
- Mousavi, S.M.N.; Illés, Á.; Bojtor, C.; Nagy, J. The impact of different nutritional treatments on maize hybrids morphological traits based on stability statistical methods. Emir. J. Food Agric. 2020, 32, 666–672. [Google Scholar] [CrossRef]
- Miao, Y.; Peng, C.; Wang, L.; Qiu, R.; Li, H.; Zhang, M. Measurement method of maize morphological parameters based on point cloud image conversion. Comput. Electron. Agric. 2022, 199, 107174. [Google Scholar] [CrossRef]
- Bao, Y.; Tang, L.; Srinivasan, S.; Schnable, P.S. Field-based architectural traits characterisation of maize plant using time-of-flight 3D imaging. Biosyst. Eng. 2019, 178, 86–101. [Google Scholar] [CrossRef]
- Atefi, A.; Ge, Y.; Pitla, S.; Schnable, J. Robotic detection and grasp of maize and sorghum: Stem measurement with contact. Robotics 2020, 9, 58. [Google Scholar] [CrossRef]
- Vit, A.; Shani, G. Comparing rgb-d sensors for close range outdoor agricultural phenotyping. Sensors 2018, 18, 4413. [Google Scholar] [CrossRef] [PubMed]
- Qiao, Y.; Hu, Y.; Zheng, Z.; Qu, Z.; Wang, C.; Guo, T.; Hou, J. A Diameter Measurement Method of Red Jujubes Trunk Based on Improved PSPNet. Agriculture 2022, 12, 1140. [Google Scholar] [CrossRef]
- Fan, Z.; Sun, N.; Qiu, Q.; Li, T.; Feng, Q.; Zhao, C. In situ measuring stem diameters of maize crops with a high-throughput phenotyping robot. Remote Sens. 2022, 14, 1030. [Google Scholar] [CrossRef]
- Zhang, Y.; Liu, P.; Zhang, X.; Zheng, Q.; Chen, M.; Ge, F.; Li, Z.; Sun, W.; Guan, Z.; Liang, T.; et al. Multi-locus genome-wide association study reveals the genetic architecture of stalk lodging resistance-related traits in maize. Front. Plant. Sci. 2018, 9, 611. [Google Scholar] [CrossRef]
- Hartmann, A.; Czauderna, T.; Hoffmann, R.; Stein, N.; Schreiber, F. HTPheno: An image analysis pipeline for high-throughput plant phenotyping. BMC Bioinform. 2011, 12, 148. [Google Scholar] [CrossRef]
- Wu, M.; Chen, R.; Tong, Y. Shadow elimination algorithm using color and texture features. Comput. Intell. Neurosci. 2020, 2020, 2075781. [Google Scholar] [CrossRef] [PubMed]
- Sun, Y.; Mu, Y.; Feng, Q.; Hu, T.; Gong, H.; Li, S.; Zhou, J. Deer body adaptive threshold segmentation algorithm based on color space. CMC Comput. Mater. Contin. 2020, 64, 1317–1328. [Google Scholar] [CrossRef]
- Riehle, D.; Reiser, D.; Griepentrog, H.W. Robust index-based semantic plant/background segmentation for RGB-images. Comput. Electron. Agr. 2020, 169, 105201. [Google Scholar] [CrossRef]
- Hernández-Hernández, J.L.; García-Mateos, G.; González-Esquiva, J.; Escarabajal-Henarejos, D.; Ruiz-Canales, A.; Molina-Martínez, J.M. Optimal color space selection method for plant/soil segmentation in agriculture. Comput. Electron. Agric. 2016, 122, 124–132. [Google Scholar] [CrossRef]
- Hamuda, E.; Glavin, M.; Jones, E. A survey of image processing techniques for plant extraction and segmentation in the field. Comput. Electron. Agric. 2016, 125, 184–199. [Google Scholar] [CrossRef]
- Arnal Barbedo, J.G. Digital image processing techniques for detecting, quantifying and classifying plant diseases. SpringerPlus 2013, 2, 660. [Google Scholar] [CrossRef]
- Li, Z.; Guo, R.; Li, M.; Chen, Y.; Li, G. A review of computer vision technologies for plant phenotyping. Comput. Electron. Agric. 2020, 176, 105672. [Google Scholar] [CrossRef]
- Jha, S.; Kumar, R.; Priyadarshini, I.; Smarandache, F.; Long, H.V. Neutrosophic image segmentation with dice coefficients. Measurement 2019, 134, 762–772. [Google Scholar] [CrossRef]
- Saha, A.; Grimm, L.J.; Harowicz, M.; Ghate, S.V.; Kim, C.; Walsh, R.; Mazurowski, M.A. Interobserver variability in identification of breast tumors in MRI and its implications for prognostic biomarkers and radiogenomics. Med. Phys. 2016, 43, 4558–4564. [Google Scholar] [CrossRef] [PubMed]


Disclaimer/Publisher’s Note: The statements, opinions and data contained in all publications are solely those of the individual author(s) and contributor(s) and not of MDPI and/or the editor(s). MDPI and/or the editor(s) disclaim responsibility for any injury to people or property resulting from any ideas, methods, instructions or products referred to in the content. |
© 2023 by the authors. Licensee MDPI, Basel, Switzerland. This article is an open access article distributed under the terms and conditions of the Creative Commons Attribution (CC BY) license (https://creativecommons.org/licenses/by/4.0/).