
An Experimental and Numerical Study for Discrete Element Model Parameters Calibration: Gluten Pellets
Abstract
:1. Introduction
2. Materials and Methods
2.1. Material Properties and DEM Model of Gluten Pellets
2.1.1. Material Properties Determination
- Size and density
- Shear modulus
2.1.2. DEM Model
- (1)
- Gluten pellet model
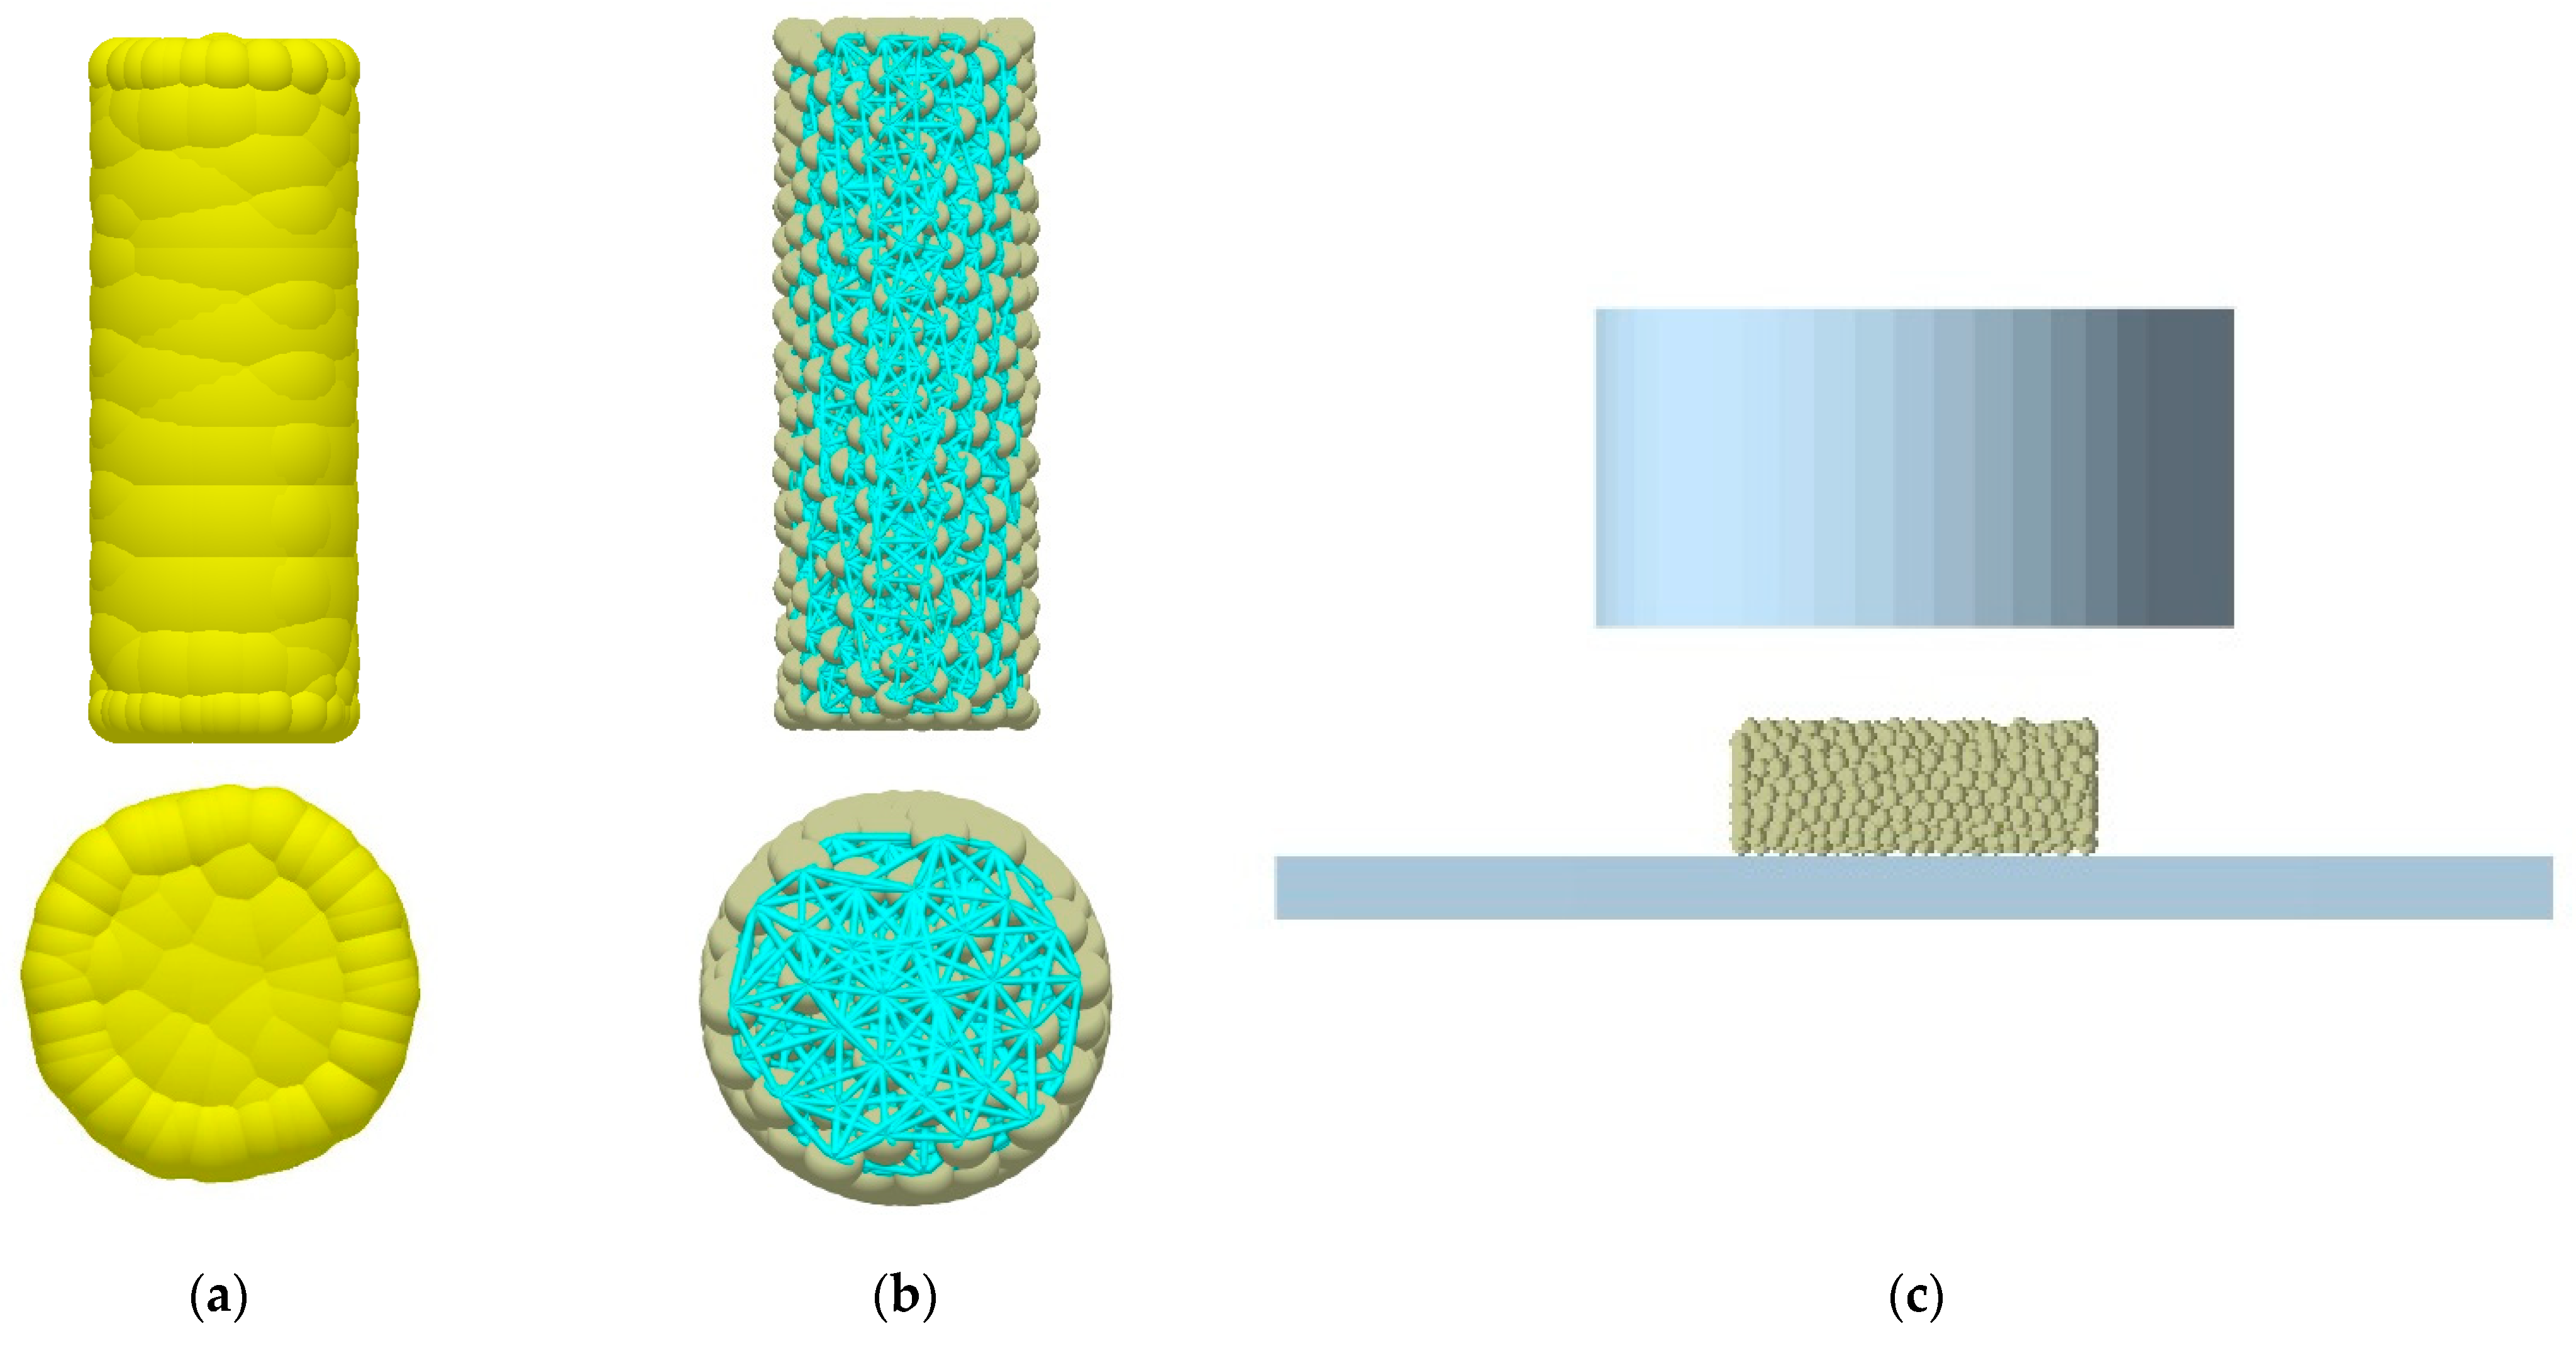
- Multi-spheres autofill model: According to the average geometric size of gluten pellets measured by the test above, a three-dimensional model was established in SolidWorks software, and the file (“.stl” format) was exported. Then, the file was imported into EDEM as an autofill template. The smoothing value and the minimum sphere radius were set to 2 and 0.5 × 10⁻³ m, respectively. The generated pellet model with a total of 177 particles is shown in Figure 3a. In order to be as close to the actual size of the pellets as possible in the simulation, a random size distribution with a minimum and maximum value was 0.85 and 1.15, respectively. The pellet’s size was scaled by volume.
- Bonded particle model: The pellet model file (“.stl” format) was imported into EDEM. Then, a box with a length, width, and height of 6 × 10⁻³ m, 6 × 10⁻³ m, and 13 × 10−3 m was created to contain the pellet model. The box and pellet model types were set to physical and virtual, respectively. The box was filled with particles, and the box and pellet model types were changed to virtual and physical, respectively. When the particle motion inside the pellet model was stable, and the external particles disappeared under gravity, the contact model of the particles was set to Hertz–Mindlin (no slip), and the connection parameters of the particles were set. Then, we started to generate bonding keys to connect the particles and deleted the box and the pellet model shell to achieve a gluten pellet model. The particle filling effect can be verified by Equation (3).where α is fill rate; r is the radius of actual gluten pellet, m; L is the length of actual gluten pellet, m; N is the number of particles filled; and R is the radius of particles filled, m.
- (2)
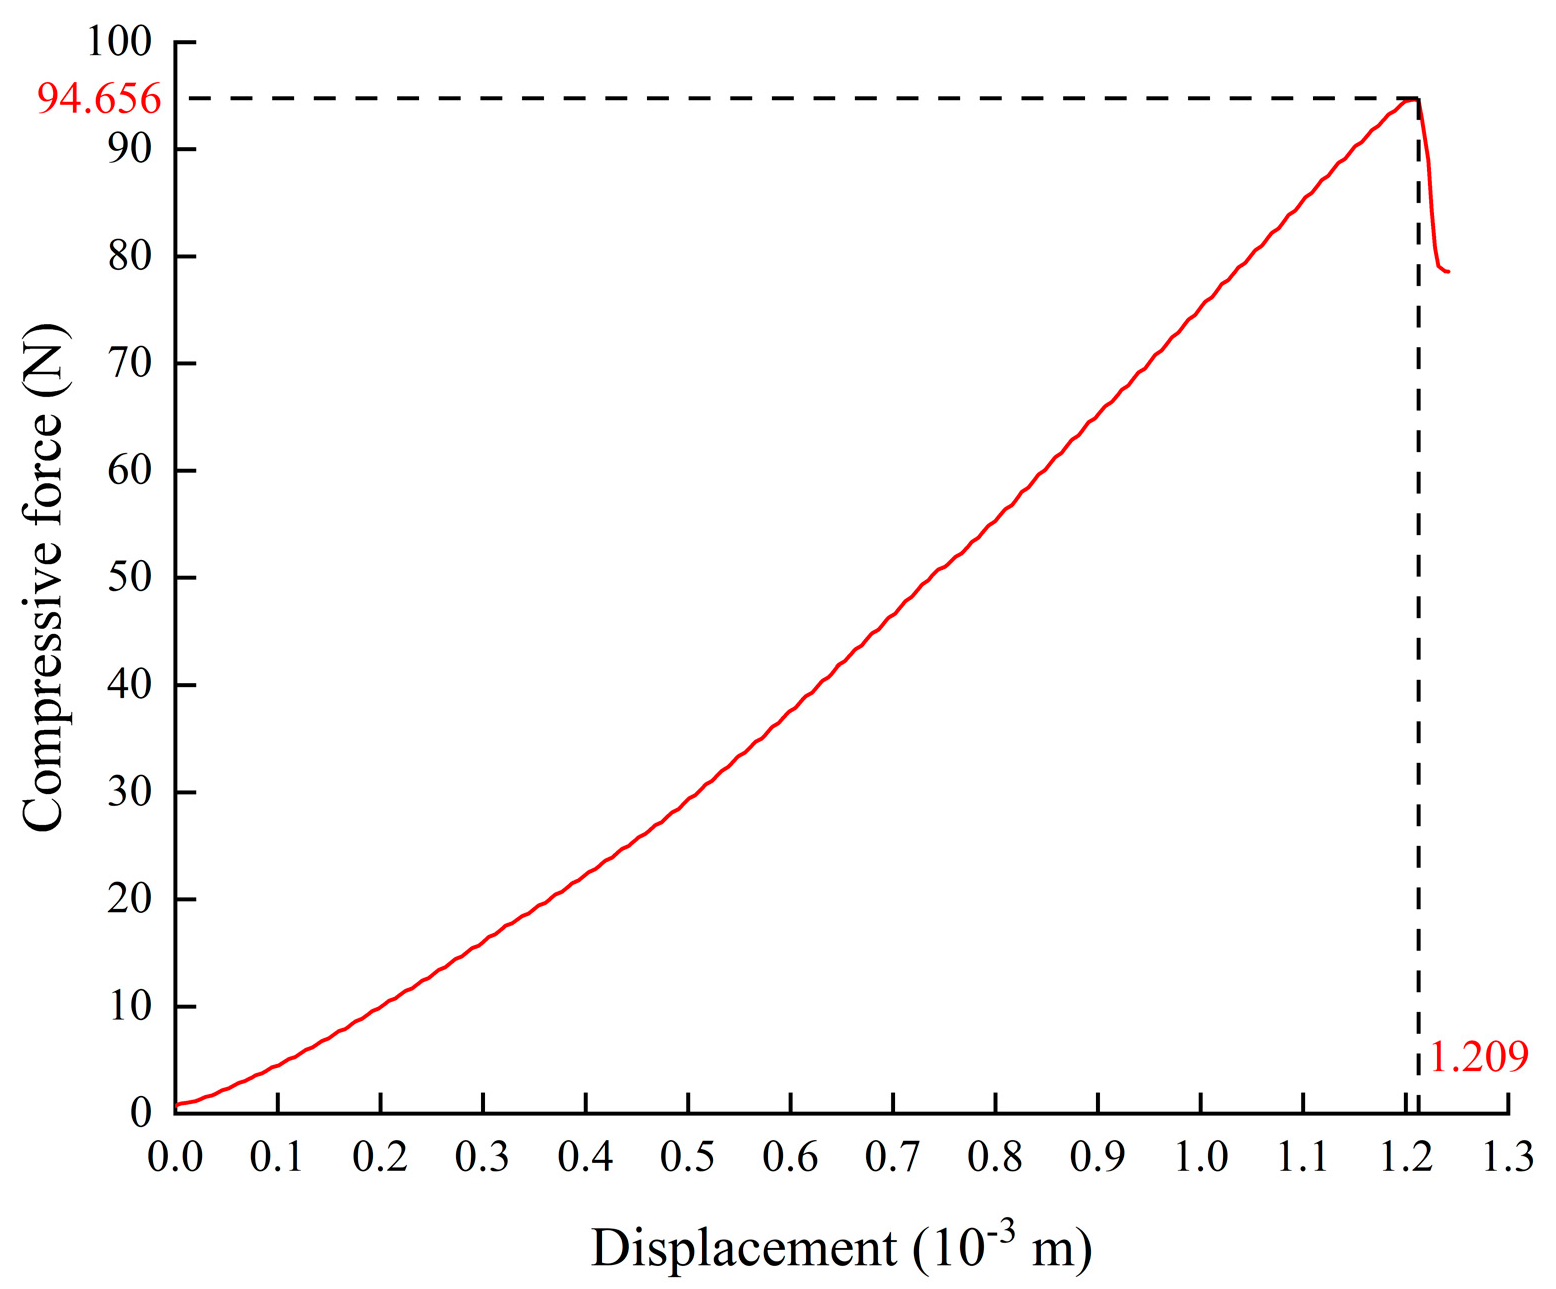
- Compression model
2.2. Test Design and Indicators Determination
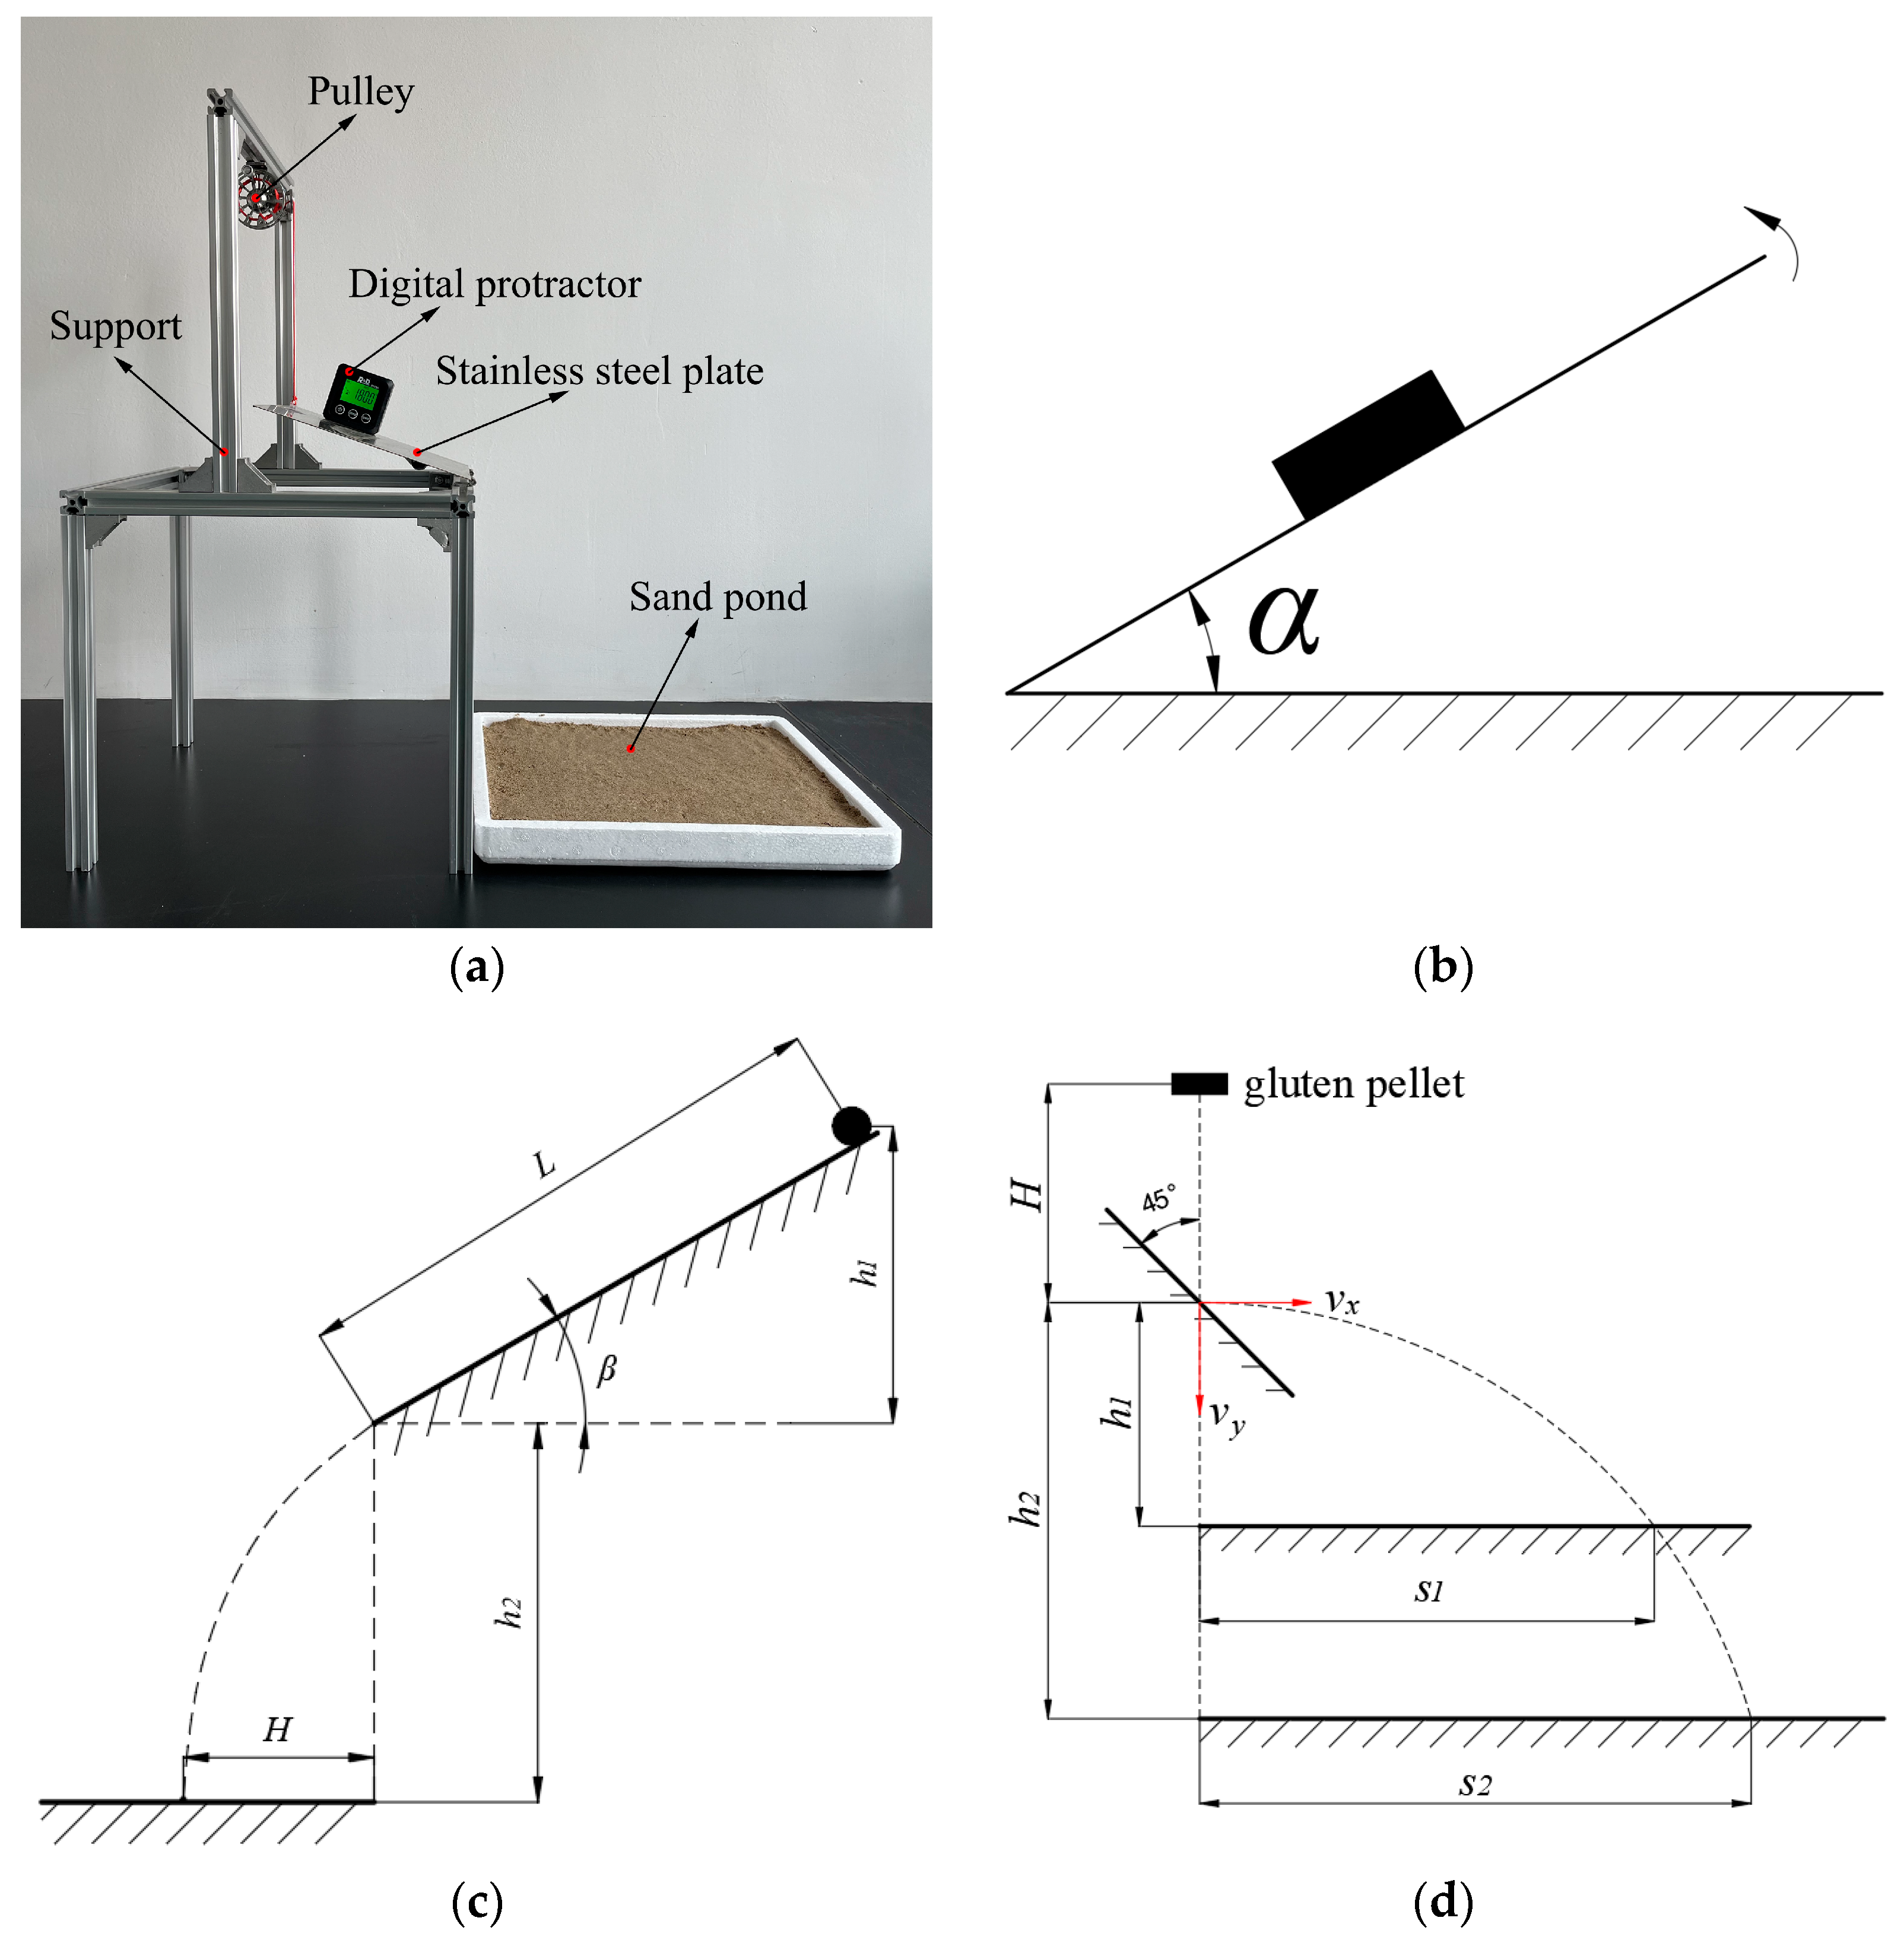
2.2.1. Interaction Parameters Determination of Pellet–Stainless Steel
- (1)
- Static friction coefficient
- (2)
- Rolling friction coefficient
- (3)
- Restitution coefficient
- (4)
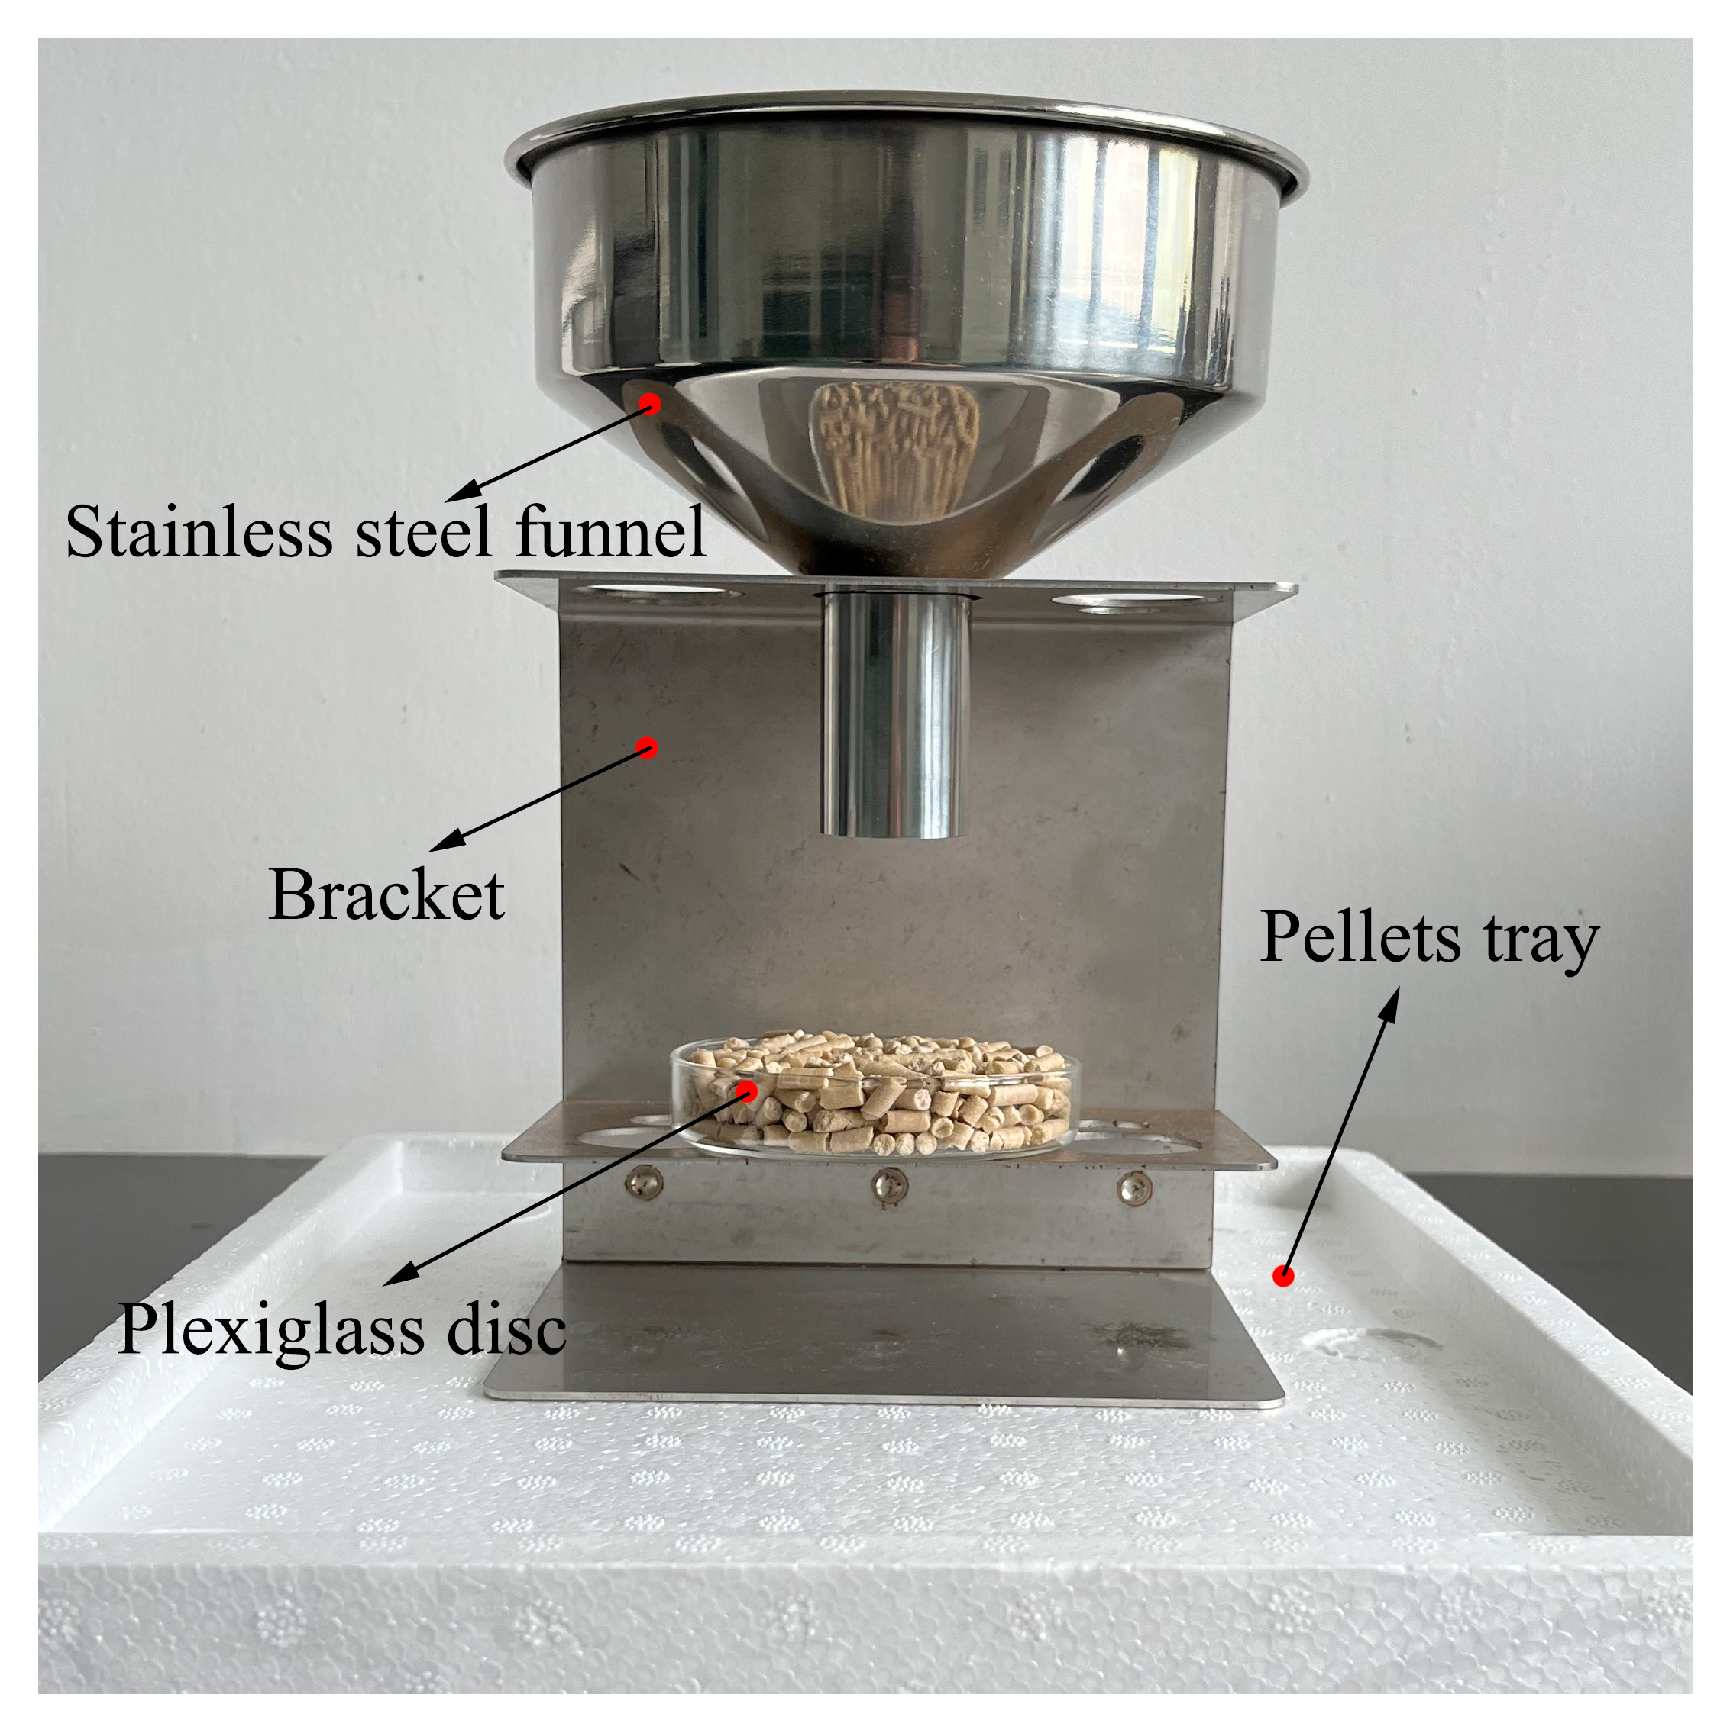
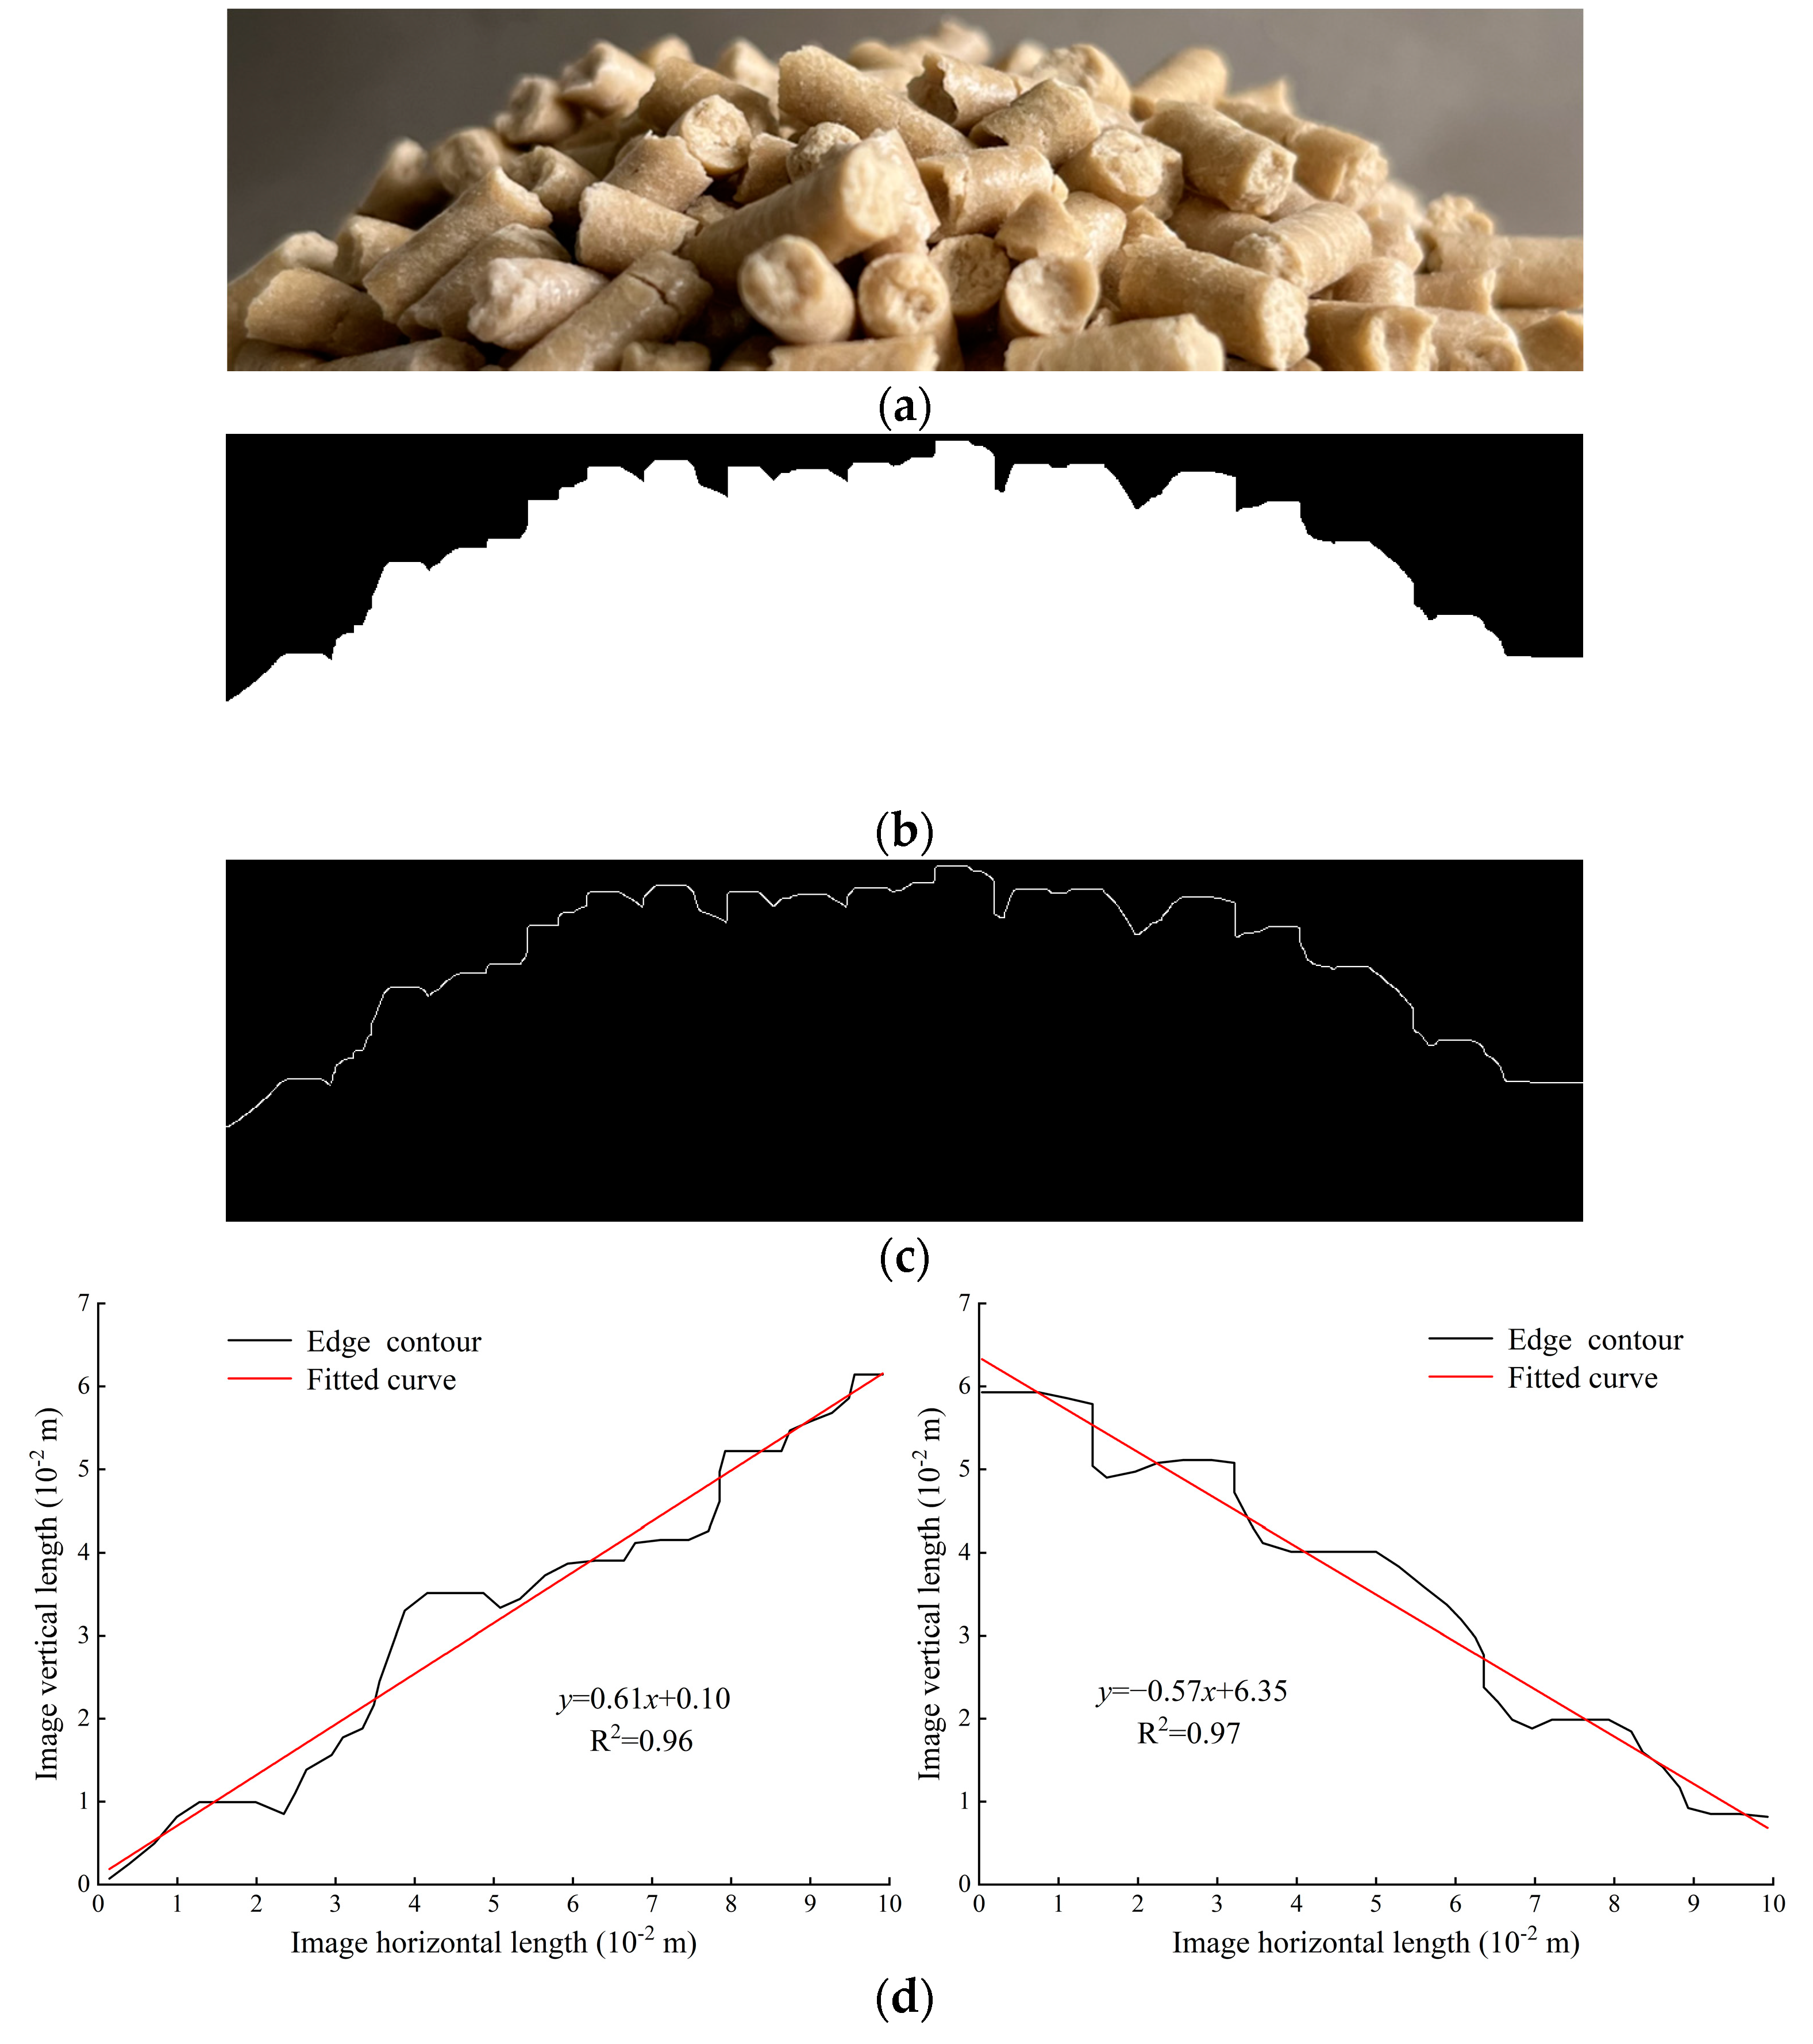
- Angle of repose
2.2.2. Interaction Parameters Determination of Pellet–Pellet
2.2.3. Bonding Parameters Calibration Test Design
3. Results
3.1. Parameters Calibration of Pellet–Pellet Test
3.1.1. Steepest Ascent Test
3.1.2. Quadratic Orthogonal Rotation Combination Test
3.2. Bonding Parameters Calibration Test
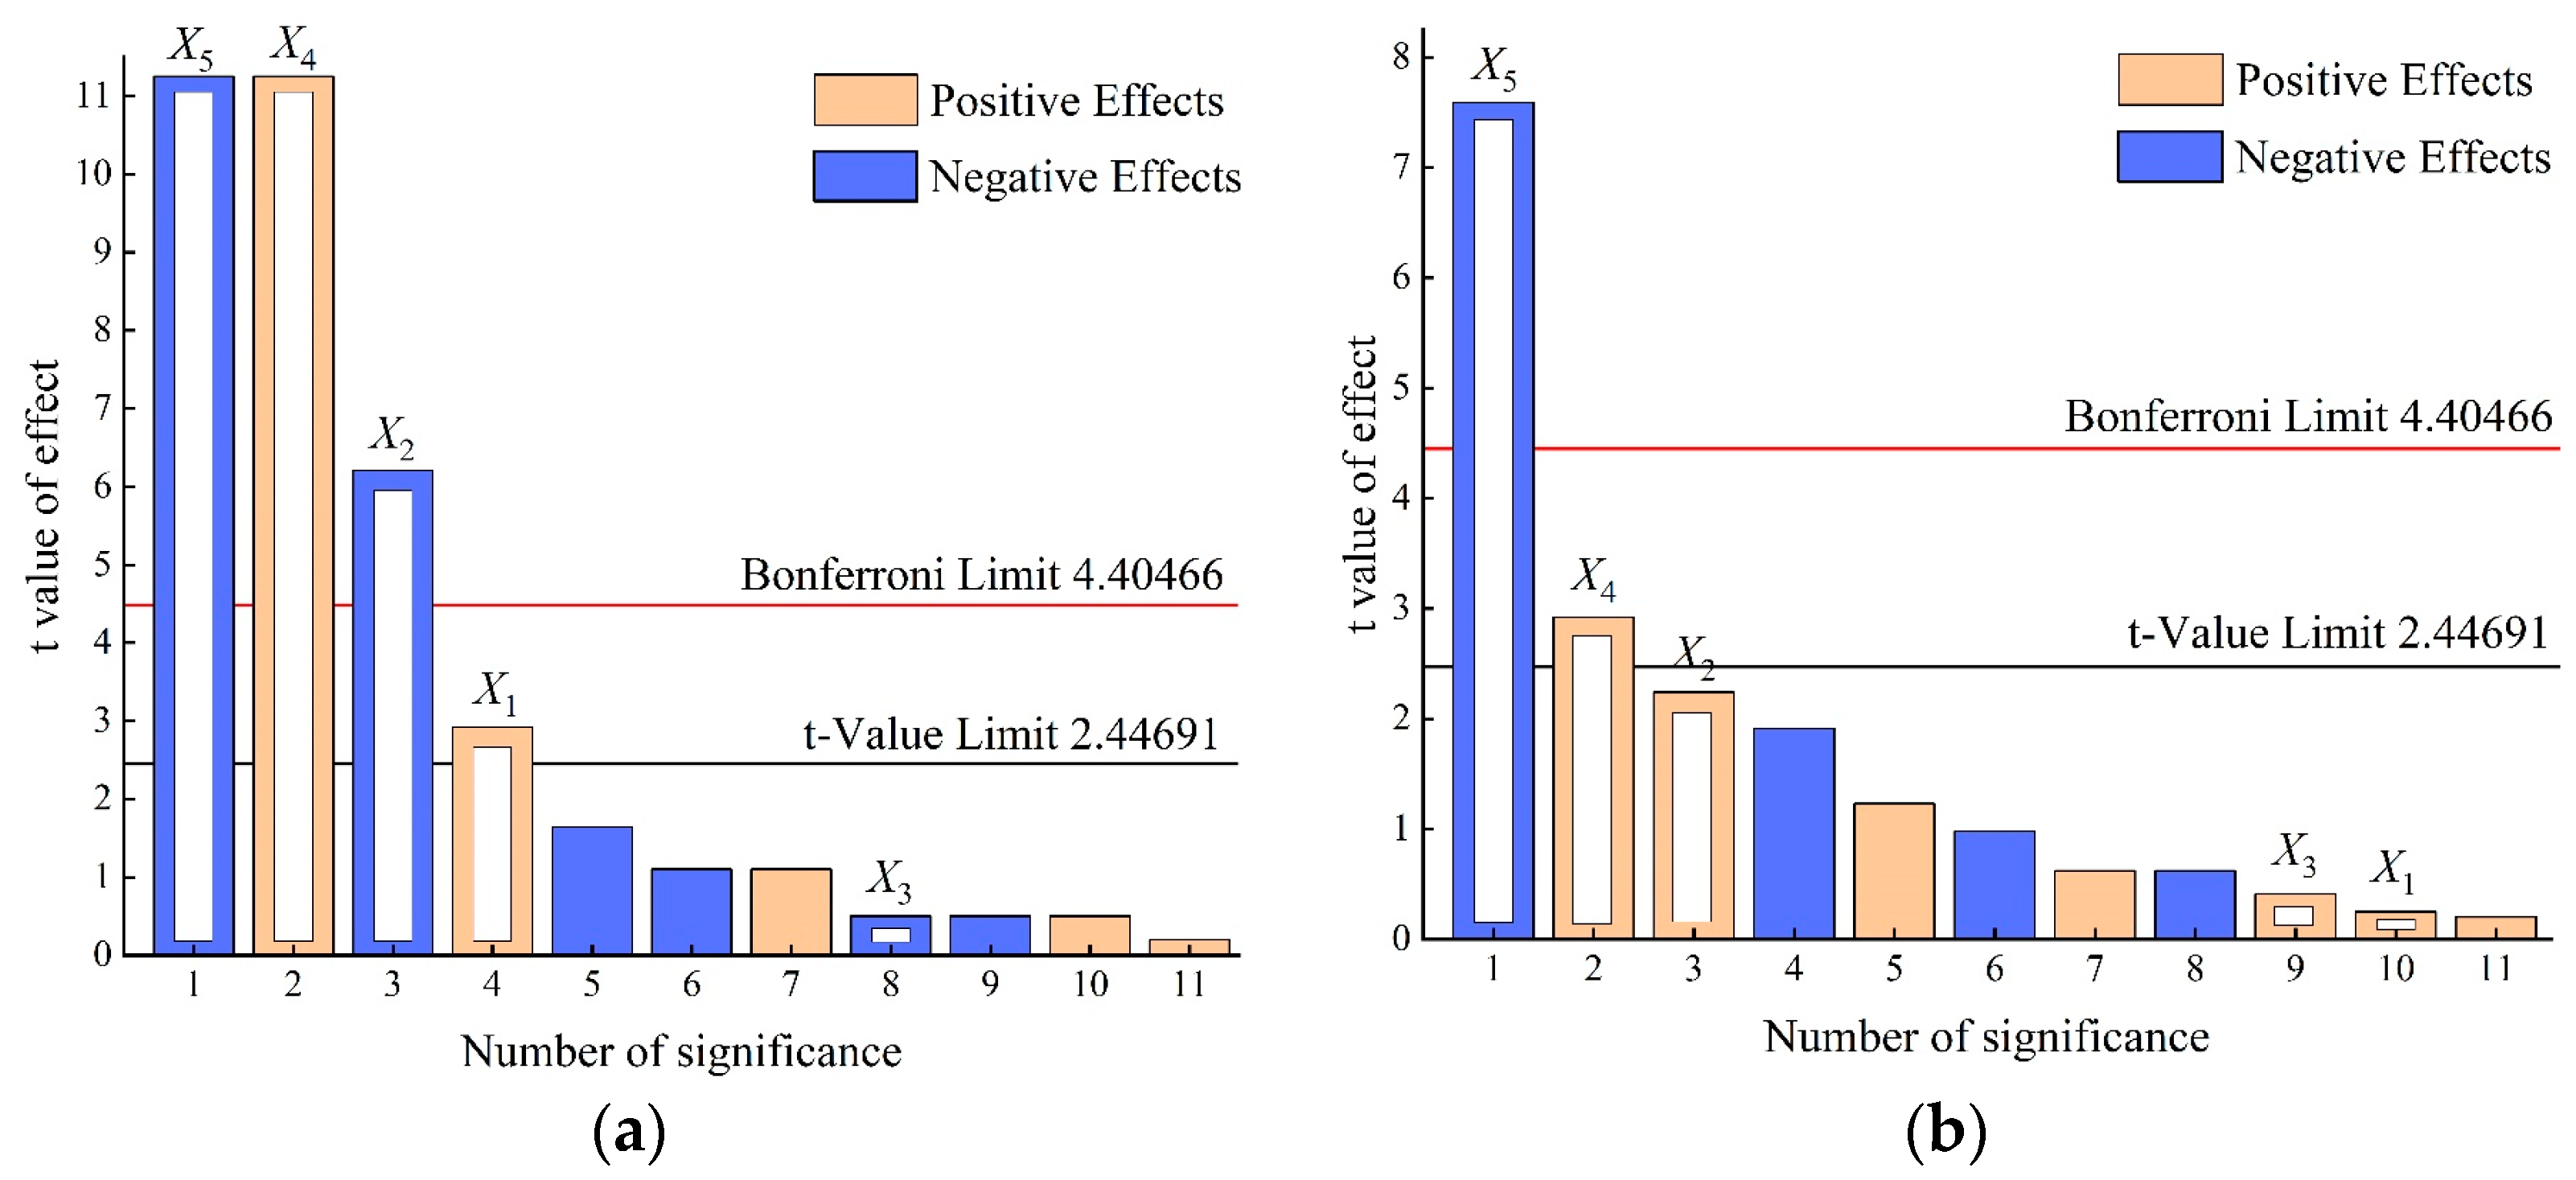
3.2.1. Plackett–Burman Test
3.2.2. Steepest Ascent Test
3.2.3. Box–Behnken Test
3.3. Adaptability Verification of Model Parameters
4. Discussion
5. Conclusions
Author Contributions
Funding
Institutional Review Board Statement
Informed Consent Statement
Data Availability Statement
Acknowledgments
Conflicts of Interest
References
- Biesiekierski, J.R. What is gluten? J. Gastroenterol. Hepatol. 2017, 32, 78–81. [Google Scholar] [CrossRef] [Green Version]
- Shewry, P. What is gluten—Why is it special? Front. Nutr. 2019, 6, 101. [Google Scholar] [CrossRef]
- Verbauwhede, A.E.; Lambrecht, M.A.; Jekle, M.; Lucas, I.; Fierens, E.; Shegay, O.; Brijs, K.; Delcour, J.A. Microscopic investigation of the formation of a thermoset wheat gluten network in a model system relevant for bread making. Int. J. Food Sci. Technol. 2020, 55, 891–898. [Google Scholar] [CrossRef]
- Wang, Y.H.; Zhang, Y.R.; Yang, Y.Y.; Shen, J.Q.; Zhang, Q.M.; Zhang, G.Z. Effect of wheat gluten addition on the texture, surface tackiness, protein structure, and sensory properties of frozen cooked noodles. LWT 2022, 161, 113348. [Google Scholar] [CrossRef]
- Khatkar, A.B.; Kaur, A. Effect of protein incorporation on functional, thermal, textural and overall quality characteristics of instant noodles. J. Food Meas. Charact. 2018, 12, 2218–2229. [Google Scholar] [CrossRef]
- Samard, S.; Gu, B.Y.; Ryu, G.H. Effects of extrusion types, screw speed and addition of wheat gluten on physicochemical characteristics and cooking stability of meat analogues. J. Sci. Food Agric. 2019, 99, 4922–4931. [Google Scholar] [CrossRef] [PubMed]
- Speranza, B.; Bevilacqua, A.; Campaniello, D.; Sinigaglia, M.; Musaico, D.; Corbo, M.R.; Lamacchia, C. The impact of gluten friendly flour on the functionality of an active drink: Viability of Lactobacillus acidophilus in a fermented milk. Front. Microbiol. 2018, 9, 2042. [Google Scholar] [CrossRef]
- Basto-Silva, C.; Guerreiro, I.; Oliva-Teles, A.; Neto, B. Life cycle assessment of diets for gilthead seabream (Sparus aurata) with different protein/carbohydrate ratios and fishmeal or plant feedstuffs as main protein sources. Int. J. Life Cycle Assess. 2019, 24, 2023–2034. [Google Scholar] [CrossRef]
- Jang, H.Q. Study on the Mechanism and Key Technology of Rotary Extrusion Forming of Feed Powder. Ph.D. Thesis, Nanjing University of Science & Technology, Nanjing, China, 2018. [Google Scholar]
- Niu, Z.Y.; Kong, X.R.; Sheng, B.S.; Li, H.C.; Geng, J.; Liu, J. Parameters Calibration of Discrete Element Simulation for Pellet Feed Attrition. Trans. Chin. Soc. Agric. Mach. 2022, 53, 132–140+207. [Google Scholar]
- Liu, X.P.; Li, J.W.; Liu, Y.Z.; Li, B.; Yang, L.; Zhang, Y.L. Contact Parameters Calibration and Flowing Property Analysis of Granular Feed. Feed Ind. 2021, 42, 6–17. [Google Scholar] [CrossRef]
- Cundall, P.A. A computer model for simulating progressive, large-scale movement in blocky rock system. In Proceedings of the International Symposium on Rock Mechanics, Nancy, France, 4–6 October 1971. [Google Scholar]
- Xie, C.; Yang, J.; Wang, B.; Zhuo, P.; Li, C.; Wang, L. Parameter calibration for the discrete element simulation model of commercial organic fertilizer. Int. Agrophys. 2020, 35, 107–117. [Google Scholar] [CrossRef]
- Ghodki, B.M.; Patel, M.; Namdeo, R.; Carpenter, G. Calibration of discrete element model parameters: Soybeans. Comput. Part Mech. 2019, 6, 3–10. [Google Scholar] [CrossRef]
- Zhang, R.; Han, D.L.; Qiao, L.; Ji, Q.L.; He, Y.; Li, J.Q. Calibration methods of sandy soil parameters in simulation of discrete element method. Trans. Chin. Soc. Agric. Mach. 2017, 48, 49–56. [Google Scholar] [CrossRef]
- Peng, F.; Wang, H.Y.; Fang, F.; Liu, Y.D. Calibration of Discrete Element Model Parameters for Pellet Feed Based on Injected Section Method. Trans. Chin. Soc. Agric. Mach. 2018, 49, 140–147. [Google Scholar] [CrossRef]
- Zhao, L.; Zhou, H.; Xu, L.; Song, S.; Zhang, C.; Yu, Q. Parameter calibration of coconut bran substrate simulation model based on discrete element and response surface methodology. Powder Technol. 2022, 395, 183–194. [Google Scholar] [CrossRef]
- Kong, X.; Liu, J.; Yang, T.; Su, Y.; Geng, J.; Niu, Z. Numerical simulation of feed pellet breakage in pneumatic conveying. Biosyst. Eng. 2022, 218, 31–42. [Google Scholar] [CrossRef]
- Wang, H.; Wu, P.; He, H.; Ma, Y.; Bu, K.; Xue, J. Calibration of Parameters for Discrete Element Simulation Model for Alfalfa with Different Moisture Contents Based on Angle of Repose Test. BioResources 2022, 17, 1467–1484. [Google Scholar] [CrossRef]
- Li, H.; Zeng, R.; Niu, Z.; Zhang, J. A calibration method for contact parameters of maize kernels based on the discrete element method. Agriculture 2022, 12, 664. [Google Scholar] [CrossRef]
- Horabik, J.; Wiącek, J.; Parafiniuk, P.; Stasiak, M.; Bańda, M.; Kobyłka, R.; Molenda, M. Discrete element method modelling of the diametral compression of starch agglomerates. Materials 2020, 13, 932. [Google Scholar] [CrossRef] [PubMed] [Green Version]
- Kanmani, N.; Romano, N.; Ebrahimi, M.; Amin, S.N.; Kamarudin, M.S.; Karami, A.; Kumar, V. Improvement of feed pellet characteristics by dietary pre-gelatinized starch and their subsequent effects on growth and physiology in tilapia. Food Chem. 2018, 239, 1037–1046. [Google Scholar] [CrossRef]
- Styks, J.; Wróbel, M.; Frączek, J.; Knapczyk, A. Effect of Compaction Pressure and Moisture Content on Quality Parameters of Perennial Biomass Pellets. Energies 2020, 13, 1859. [Google Scholar] [CrossRef] [Green Version]
- Gageanu, I.; Cujbescu, D.; Persu, C.; Tudor, P.; Cardei, P.; Matache, M.; Vladut, V.; Biris, S.; Voicea, I.; Ungureanu, N. Influence of Input and Control Parameters on the Process of Pelleting Powdered Biomass. Energies 2021, 14, 4104. [Google Scholar] [CrossRef]
- Behnke, K.C. Factors influencing pellet quality. Feed Tech. 2001, 5, 19–22. [Google Scholar]
- Said, N.; Daiem, M.; García-Maraver, A.; Zamorano, M. Influence of densification parameters on quality properties of rice straw pellets. Fuel Process. Technol. 2015, 138, 56–64. [Google Scholar] [CrossRef]
- American Society of Agricultural and Biological Engineers. S352. 2: Moisture Measurement—Unground Grain and Seeds; American Society of Agricultural and Biological Engineers: Saint Joseph, MI, USA, 2006. [Google Scholar]
- Wang, M.M.; Wang, W.Z.; Yang, L.G.; Hou, M.T. Research of discrete element modeling method of maizekernel based on EDEM. J. Henan Agric. Univ. 2018, 52, 80–84. [Google Scholar]
- Sun, J.X.; Guo, Y.M.; Yang, Z.M.; Cui, Q.L.; Wu, X.H.; Zhang, Y.Q. Experimental study on biomechanical properties of buckwheat grain and viscoelastic properties of buckwheat powder. Trans. Chin. Soc. Agric. Eng. 2018, 34, 287–298. [Google Scholar] [CrossRef]
- Li, B.; Cheng, Y.; Sun, P.; Li, B.; Liu, W.F. Engineering Measurement and Verification of Rolling Friction Coefficients. Constr. Mach. Equip. 2017, 48, 29–32. [Google Scholar] [CrossRef]
- Xing, J.J.; Zhang, R.; Wu, P.; Zhang, X.R.; Dong, X.H.; Chen, Y.; Ru, S.F. Parameter calibration of discrete element simulation model for latosol particles in hot areas of Hainan. Trans. Chin. Soc. Agric. Eng. 2020, 36, 158–166. [Google Scholar]
- Feng, B.; Sun, W.; Shi, L.R.; Sun, B.G.; Zhang, T.; Wu, J.M. Determination of restitution coefficient of potato tubers collision in harvest and analysis of its influence factors. Trans. Chin. Soc. Agric. Eng. 2017, 33, 50–57. [Google Scholar] [CrossRef]
- Zhang, X.H. Computer Numerical Simulation of Pellet Feed in Cooling Process. Ph.D. Thesis, Huazhong Agricultural University, Wuhan, China, 2004. [Google Scholar]
- Liao, Y.T.; Wang, Z.T.; Liao, Q.X.; Wan, X.Y.; Zhou, Y.; Liang, F. Calibration of discrete element model parameters of forage rape stalk at early pod stage. Trans. Chin. Soc. Agric. Mach. 2020, 51, 236–243. [Google Scholar]
- Liao, Y.T.; Liao, Q.X.; Zhou, Y.; Wang, Z.T.; Jang, Y.J.; Liang, F. Parameters calibration of discrete element model of fodder rape crop harvest in bolting stage. Trans. Chin. Soc. Agric. Mach. 2020, 51, 73–82. [Google Scholar] [CrossRef]
- Guo, S.Q.; Wan, P.; Yang, J.; Deng, Z.Y.; Wang, S.S.; Zhu, M.; Tan, H.Q. Discrete element based calibration and test of simulation parameters for fish feed. J. Huazhong Agric. Univ. 2022, 41, 286–295. [Google Scholar] [CrossRef]
- Peng, F.; Huang, Z.; Fang, F. Modeling and experiments of chewing mechanical properties of pellet feed using discrete element method. Int. J. Agric. Biol. Eng. 2020, 13, 37–44. [Google Scholar] [CrossRef]


| Parameters | Range |
|---|---|
| 0.20–0.80 | |
| 0.05–0.20 | |
| 0.15–0.75 |
| Factors | Codes | ||||
|---|---|---|---|---|---|
| −1.682 | −1 | 0 | 1 | 1.682 | |
| 0.44 | 0.49 | 0.56 | 0.63 | 0.68 | |
| 0.39 | 0.44 | 0.51 | 0.58 | 0.63 | |
| 0.11 | 0.12 | 0.14 | 0.16 | 0.17 | |
| Factors | Value | |
|---|---|---|
| Low Level | High Level | |
| X1/1010 N·m−3 | 1.64 | 2.24 |
| X2/1010 N·m−3 | 1.8 | 2.12 |
| X3/106 Pa | 7.25 | 8.5 |
| X4/106 Pa | 5.4 | 6.4 |
| X5/10−3 m | 0.34 | 0.44 |
| Test No. | Factors | Results | |||
|---|---|---|---|---|---|
| /% | |||||
| 1 | 0.20 | 0.05 | 0.15 | 36.06 | 26.03 |
| 2 | 0.32 | 0.08 | 0.27 | 33.49 | 17.04 |
| 3 | 0.44 | 0.11 | 0.39 | 26.64 | 6.88 |
| 4 | 0.56 | 0.14 | 0.51 | 27.68 | 3.25 |
| 5 | 0.68 | 0.17 | 0.63 | 30.29 | 5.89 |
| 6 | 0.80 | 0.20 | 0.75 | 30.92 | 8.07 |
| Test No. | |||||
|---|---|---|---|---|---|
| 1 | 0.49 | 0.44 | 0.12 | 30.56 | 6.82 |
| 2 | 0.63 | 0.44 | 0.12 | 35.28 | 23.31 |
| 3 | 0.49 | 0.58 | 0.12 | 28.1 | 1.78 |
| 4 | 0.63 | 0.58 | 0.12 | 34.53 | 20.69 |
| 5 | 0.49 | 0.44 | 0.16 | 35.38 | 23.66 |
| 6 | 0.63 | 0.44 | 0.16 | 39.18 | 36.95 |
| 7 | 0.49 | 0.58 | 0.16 | 29.16 | 1.92 |
| 8 | 0.63 | 0.58 | 0.16 | 34.65 | 21.11 |
| 9 | 0.44 | 0.51 | 0.14 | 30.71 | 7.34 |
| 10 | 0.68 | 0.51 | 0.14 | 36.36 | 27.09 |
| 11 | 0.56 | 0.39 | 0.14 | 37.38 | 30.65 |
| 12 | 0.56 | 0.63 | 0.14 | 34.17 | 19.43 |
| 13 | 0.56 | 0.51 | 0.11 | 32.65 | 14.12 |
| 14 | 0.56 | 0.51 | 0.17 | 34.34 | 20.03 |
| 15 | 0.56 | 0.51 | 0.14 | 29.73 | 3.91 |
| 16 | 0.56 | 0.51 | 0.14 | 29.56 | 3.32 |
| 17 | 0.56 | 0.51 | 0.14 | 30.07 | 5.10 |
| 18 | 0.56 | 0.51 | 0.14 | 28.2 | 1.43 |
| 19 | 0.56 | 0.51 | 0.14 | 29.09 | 1.68 |
| 20 | 0.56 | 0.51 | 0.14 | 28.93 | 1.12 |
| 21 | 0.56 | 0.51 | 0.14 | 29.17 | 1.96 |
| 22 | 0.56 | 0.51 | 0.14 | 29.79 | 4.12 |
| 23 | 0.56 | 0.51 | 0.14 | 27.65 | 3.36 |
| Source of Variation | Sum of Squares | Degree of Freedom | F-Value | p-Value |
|---|---|---|---|---|
| Model | 235.47 | 9 | 21.05 | <0.0001 ** |
| 65.65 | 1 | 52.82 | <0.0001 ** | |
| 27.44 | 1 | 22.08 | 0.0004 ** | |
| 11.89 | 1 | 9.57 | 0.0086 ** | |
| 1.45 | 1 | 1.16 | 0.3005 | |
| 0.4325 | 1 | 0.3479 | 0.5654 | |
| 7.11 | 1 | 5.72 | 0.0326 * | |
| 26.96 | 1 | 21.69 | 0.0004 ** | |
| 69.71 | 1 | 56.09 | <0.0001 ** | |
| 26.38 | 1 | 21.22 | 0.0005 ** | |
| Residual | 16.16 | 13 | ||
| Lack of fit | 11.20 | 5 | 3.61 | 0.0527 |
| Pure error | 4.96 | 8 | ||
| Cor Total | 251.63 | 22 |
| Test No. | X1/1010 N·m−3 | X2/1010 N·m−3 | X3/106 Pa | X4/106 Pa | X5/10−3 m | Y1/10−3 m | Y2/N |
|---|---|---|---|---|---|---|---|
| 1 | 2.24 | 2.12 | 7.25 | 6.4 | 0.44 | 1.171 | 82.171 |
| 2 | 1.64 | 2.12 | 8.5 | 5.4 | 0.44 | 1.052 | 69.787 |
| 3 | 2.24 | 1.8 | 8.5 | 6.4 | 0.34 | 1.336 | 102.652 |
| 4 | 1.64 | 2.12 | 7.25 | 6.4 | 0.44 | 1.183 | 85.844 |
| 5 | 1.64 | 1.8 | 8.5 | 5.4 | 0.44 | 1.107 | 74.813 |
| 6 | 1.64 | 1.8 | 7.25 | 6.4 | 0.34 | 1.302 | 94.112 |
| 7 | 2.24 | 1.8 | 7.25 | 5.4 | 0.44 | 1.151 | 68.353 |
| 8 | 2.24 | 2.12 | 7.25 | 5.4 | 0.34 | 1.192 | 103.427 |
| 9 | 2.24 | 2.12 | 8.5 | 5.4 | 0.34 | 1.192 | 95.357 |
| 10 | 1.64 | 2.12 | 8.5 | 6.4 | 0.34 | 1.262 | 110.69 |
| 11 | 2.24 | 1.8 | 8.5 | 6.4 | 0.44 | 1.253 | 75.765 |
| 12 | 1.64 | 1.8 | 7.25 | 5.4 | 0.34 | 1.224 | 90.113 |
| Source of Variation | Y1 | Y2 | ||||||||
|---|---|---|---|---|---|---|---|---|---|---|
| Sum of Squares | Degree of Freedom | Mean Square | F-Value | p-Value | Sum of Squares | Degree of Freedom | Mean Square | F-Value | p-Value | |
| Model | 0.0689 | 5 | 0.0138 | 59.93 | <0.0001 ** | 1973.55 | 5 | 394.71 | 14.00 | 0.0029 ** |
| X1 | 0.0023 | 1 | 0.0023 | 9.87 | 0.0200 * | 0.4665 | 1 | 0.4665 | 0.0165 | 0.9018 |
| X2 | 0.0086 | 1 | 0.0086 | 37.34 | 0.0009 ** | 143.30 | 1 | 143.30 | 5.08 | 0.0650 |
| X3 | 0.0000 | 1 | 0.0000 | 0.1598 | 0.7032 | 2.12 | 1 | 2.12 | 0.0752 | 0.7931 |
| X4 | 0.0289 | 1 | 0.0289 | 125.71 | <0.0001 ** | 203.23 | 1 | 203.23 | 7.21 | 0.0363 * |
| X5 | 0.0291 | 1 | 0.0291 | 126.57 | <0.0001 ** | 1624.43 | 1 | 1624.43 | 57.63 | 0.0003 ** |
| Residual | 0.0014 | 6 | 0.0002 | 169.13 | 6 | 28.19 | ||||
| Cor Total | 0.0703 | 11 | 2142.68 | 11 | ||||||
| Test No. | X1/1010 N·m−3 | X2/1010 N·m−3 | X4/106 Pa | X5/10−3 m | Y1/10−3 m | Y2/N | ||
|---|---|---|---|---|---|---|---|---|
| 1 | 1.64 | 2.12 | 5.4 | 0.44 | 1.120 | 7.438 | 65.007 | 31.326 |
| 2 | 1.76 | 2.06 | 5.6 | 0.42 | 1.143 | 5.537 | 66.570 | 29.675 |
| 3 | 1.88 | 2.00 | 5.8 | 0.40 | 1.180 | 2.479 | 87.037 | 8.053 |
| 4 | 2.00 | 1.94 | 6 | 0.38 | 1.233 | 1.928 | 90.943 | 3.926 |
| 5 | 2.12 | 1.86 | 6.2 | 0.36 | 1.280 | 5.785 | 95.747 | 1.148 |
| 6 | 2.24 | 1.80 | 6.4 | 0.34 | 1.307 | 7.989 | 101.943 | 7.694 |
| Test No. | X1/1010 N·m−3 | X2/1010 N·m−3 | X4/106 Pa | X5/10−3 m | Y1/10−3 m | Y2/N |
|---|---|---|---|---|---|---|
| 1 | 1.88 | 1.86 | 6 | 0.38 | 1.177 | 119.803 |
| 2 | 2.12 | 1.86 | 6 | 0.38 | 1.286 | 88.246 |
| 3 | 1.88 | 2 | 6 | 0.38 | 1.322 | 100.241 |
| 4 | 2.12 | 2 | 6 | 0.38 | 1.294 | 114.744 |
| 5 | 2 | 1.93 | 5.8 | 0.36 | 1.228 | 99.062 |
| 6 | 2 | 1.93 | 6.2 | 0.36 | 1.365 | 92.517 |
| 7 | 2 | 1.93 | 5.8 | 0.4 | 1.231 | 91.846 |
| 8 | 2 | 1.93 | 6.2 | 0.4 | 1.134 | 83.291 |
| 9 | 1.88 | 1.93 | 6 | 0.36 | 1.283 | 102.673 |
| 10 | 2.12 | 1.93 | 6 | 0.36 | 1.293 | 94.935 |
| 11 | 1.88 | 1.93 | 6 | 0.4 | 1.224 | 92.116 |
| 12 | 2.12 | 1.93 | 6 | 0.4 | 1.211 | 96.124 |
| 13 | 2 | 1.86 | 5.8 | 0.38 | 1.236 | 99.242 |
| 14 | 2 | 2 | 5.8 | 0.38 | 1.297 | 111.627 |
| 15 | 2 | 1.86 | 6.2 | 0.38 | 1.237 | 88.913 |
| 16 | 2 | 2 | 6.2 | 0.38 | 1.337 | 94.114 |
| 17 | 1.88 | 1.93 | 5.8 | 0.38 | 1.274 | 109.722 |
| 18 | 2.12 | 1.93 | 5.8 | 0.38 | 1.125 | 89.003 |
| 19 | 1.88 | 1.93 | 6.2 | 0.38 | 1.142 | 94.014 |
| 20 | 2.12 | 1.93 | 6.2 | 0.38 | 1.322 | 90.792 |
| 21 | 2 | 1.86 | 6 | 0.36 | 1.301 | 119.643 |
| 22 | 2 | 2 | 6 | 0.36 | 1.396 | 95.811 |
| 23 | 2 | 1.86 | 6 | 0.4 | 1.218 | 87.514 |
| 24 | 2 | 2 | 6 | 0.4 | 1.297 | 112.987 |
| 25 | 2 | 1.93 | 6 | 0.38 | 1.226 | 97.913 |
| 26 | 2 | 1.93 | 6 | 0.38 | 1.208 | 93.764 |
| 27 | 2 | 1.93 | 6 | 0.38 | 1.213 | 94.407 |
| 28 | 2 | 1.93 | 6 | 0.38 | 1.212 | 94.463 |
| 29 | 2 | 1.93 | 6 | 0.38 | 1.201 | 92.757 |
| Source of Variation | Y1 | Y2 | ||||||||
|---|---|---|---|---|---|---|---|---|---|---|
| Sum of Squares | Degree of Freedom | Mean Square | F-Value | p-Value | Sum of Squares | Degree of Freedom | Mean Square | F-Value | p-Value | |
| Model | 0.1215 | 14 | 0.0087 | 44.33 | <0.0001 ** | 2498.44 | 14 | 178.46 | 15.42 | <0.0001 ** |
| A-X1 | 0.0010 | 1 | 0.0010 | 5.06 | 0.0411 * | 166.69 | 1 | 166.69 | 14.41 | 0.0020 ** |
| B-X2 | 0.0198 | 1 | 0.0198 | 101.37 | <0.0001 ** | 57.04 | 1 | 57.04 | 4.93 | 0.0434 * |
| C-X4 | 0.0018 | 1 | 0.0018 | 9.07 | 0.0093 * | 269.43 | 1 | 269.43 | 23.29 | 0.0003 ** |
| D-X5 | 0.0253 | 1 | 0.0253 | 129.24 | <0.0001 ** | 138.47 | 1 | 138.47 | 11.97 | 0.0038 ** |
| AB | 0.0047 | 1 | 0.0047 | 23.97 | 0.0002 ** | 530.38 | 1 | 530.38 | 45.84 | <0.0001 ** |
| AC | 0.0271 | 1 | 0.0271 | 138.23 | <0.0001 ** | 76.54 | 1 | 76.54 | 6.61 | 0.0222 * |
| AD | 0.0001 | 1 | 0.0001 | 0.6755 | 0.4249 | 34.49 | 1 | 34.49 | 2.98 | 0.1062 |
| BC | 0.0004 | 1 | 0.0004 | 1.94 | 0.1851 | 12.90 | 1 | 12.90 | 1.12 | 0.3089 |
| BD | 0.0001 | 1 | 0.0001 | 0.3269 | 0.5765 | 607.75 | 1 | 607.75 | 52.53 | <0.0001 ** |
| CD | 0.0137 | 1 | 0.0137 | 69.92 | <0.0001 ** | 1.01 | 1 | 1.01 | 0.0873 | 0.7720 |
| A2 | 0.0001 | 1 | 0.0001 | 0.4156 | 0.5296 | 58.91 | 1 | 58.91 | 5.09 | 0.0406 * |
| B2 | 0.0227 | 1 | 0.0227 | 115.99 | <0.0001 ** | 422.72 | 1 | 422.72 | 36.53 | <0.0001 ** |
| C2 | 1.126 × 10⁻⁶ | 1 | 1.126 × 10⁻⁶ | 0.0058 | 0.9406 | 59.16 | 1 | 59.16 | 5.11 | 0.0402 * |
| D2 | 0.0067 | 1 | 0.0067 | 34.02 | <0.0001 ** | 0.0047 | 1 | 0.0047 | 0.0004 | 0.9842 |
| Residual | 0.0027 | 14 | 0.0002 | 161.99 | 14 | 11.57 | ||||
| Lack of Fit | 0.0024 | 10 | 0.0002 | 2.88 | 0.1597 | 146.88 | 10 | 14.69 | 3.89 | 0.1013 |
| Pure Error | 0.0003 | 4 | 0.0001 | 15.11 | 4 | 3.78 | ||||
| Cor Total | 0.1242 | 28 | 2660.43 | 28 | ||||||
| Tset | Investigation Parameter | Model | Relative Error/% | |
|---|---|---|---|---|
| Multi-Spheres Autofill Model | Bonded Particle Model | |||
| Collision test | Initial height/10−3 m | 128.647 | 128.574 | 0.578 |
| Post collision height/10−3 m | 64.242 | 63.873 | ||
| Sliding test | Initial sliding angle/° | 26.733 | 26.571 | 0.610 |
| Rolling test | Rolling off time/s | 0.431 | 0.427 | 0.937 |
Disclaimer/Publisher’s Note: The statements, opinions and data contained in all publications are solely those of the individual author(s) and contributor(s) and not of MDPI and/or the editor(s). MDPI and/or the editor(s) disclaim responsibility for any injury to people or property resulting from any ideas, methods, instructions or products referred to in the content. |
© 2023 by the authors. Licensee MDPI, Basel, Switzerland. This article is an open access article distributed under the terms and conditions of the Creative Commons Attribution (CC BY) license (https://creativecommons.org/licenses/by/4.0/).
Share and Cite
Ben, Z.; Zhang, X.; Yang, D.; Chen, K. An Experimental and Numerical Study for Discrete Element Model Parameters Calibration: Gluten Pellets. Agriculture 2023, 13, 744. https://doi.org/10.3390/agriculture13040744
Ben Z, Zhang X, Yang D, Chen K. An Experimental and Numerical Study for Discrete Element Model Parameters Calibration: Gluten Pellets. Agriculture. 2023; 13(4):744. https://doi.org/10.3390/agriculture13040744
Chicago/Turabian StyleBen, Zongyou, Xubo Zhang, Duoxing Yang, and Kunjie Chen. 2023. "An Experimental and Numerical Study for Discrete Element Model Parameters Calibration: Gluten Pellets" Agriculture 13, no. 4: 744. https://doi.org/10.3390/agriculture13040744