Article

Root, Yield, and Quality of Alfalfa Affected by Soil Salinity in Northwest China

1
Center for Agricultural Water Research in China, China Agricultural University, 17 Qinghua East Rd., Beijing 100083, China
2
National Field Scientific Observation and Research Station on Efficient Water Use of Oasis Agriculture in Wuwei of Gansu Province, Wuwei 733000, China
3
College of Water Resources Science and Engineering, Taiyuan University of Technology, Taiyuan 030024, China
*
Author to whom correspondence should be addressed.
Agriculture 2023, 13(4), 750; https://doi.org/10.3390/agriculture13040750
Submission received: 1 March 2023 / Revised: 14 March 2023 / Accepted: 20 March 2023 / Published: 23 March 2023
(This article belongs to the Section Crop Production)

Abstract

:
Growing crops in salt-affected soils has become increasingly important for sustainable development in arid and semi-arid regions. Knowledge on the responses of alfalfa root development, yield, and quality to soil salinity is critical for assessing the productivity and profitability of salt-affected soils. A field experiment with a total of six treatments combining three soil salinity levels and two biosolids fertilizer levels was conducted in 2018 and 2019 in northwest China. For salinity treatments, the salt addition rates were 2‰, 4‰, and 6‰ of 0–60 cm soil dry weight, while a commercial biosolids fertilizer was added at a rate of 0 and 1.5 Mg·ha−1 of 0–10 cm soil for biosolids treatment. Root parameters of root length (RL), surface area (RSA), diameter (RD), volume (RV), and dry matter (RDM) were obtained at the end of each year, while yield and quality parameters of crude protein (CP), acid detergent fiber (ADF), neutral detergent fiber (NDF) were measured for each cut of the two years. Most root parameters were significantly reduced by the highest soil salinity treatment in 2018, but not affected by salinity in 2019. Higher salinity treatments consistently led to lower plant height and yield, higher CP, and lower ADF and NDF in both years. The absolute slope value of the regression between yield of each cut with the respective soil salt content was smaller for the later cuts. The relationship between plant height and quality parameters varied depending on soil salinity levels and between the two years, and plant height was found to be a good predictor for alfalfa quality in 2019. Biosolids fertilizer had no significant effect on any alfalfa root, growth, or quality parameters. The results are expected to assist determining the proper soil salinity range, maximizing the productivity that takes both yield and quality into consideration.

1. Introduction

Salinity is one of the most serious abiotic stress factors limiting crop production, and rapid soil salinization is a worldwide phenomenon threatening global food supplies. Globally, about 932.2 Mha of land is affected by soil salinization, and China is one of the most affected countries [1]. It was reported that China has the saline and alkaline farmlands about 6.7 Mha, accounting for about 7% of the total cultivated lands of the country [2]. Continuous soil salinization and crop production declining led to the increase in the abandoned arable land [3,4] and an annual loss of income of $27.3 billion [5]. To make things worse, intensive cultivation needed to the meet the food demand is often accompanied with extensive application of irrigation and fertilizers, which have led to the expansion of salinized lands and shrinkage of arable lands in arid and semiarid regions in recent years [6,7]. Therefore, it becomes necessary to improve productivity by growing salt-tolerant crops in salinized soils in those regions to meet the fast-growing demand.
Alfalfa (Medicago sativa L.) is widely cultivated as perennial legume forage due to its large biomass production and high protein content [8]. It has been reported that alfalfa can tolerate moderate to high salinity. When growing on soils with some level of salinity, alfalfa yield might be reduced, but its nutrient composition and forage quality was improved [9]. In terms of alfalfa growth, previous studies have shown that salinity stress reduced alfalfa plant height (PH), stem-leaf ratio (SLR), and biomass yield [10,11,12]. Torabi et al. [13] found that salinity stress reduced PH and biomass yield of alfalfa in the seedling stage for as many as 20 alfalfa ecotypes. Similarly, Bao et al. [10] stated that average PH and biomass yield of the two varieties of alfalfa were reduced by more than 28% when exposed to 100 mM NaCl solution treated soil for 30 days. In a pot study, Monirifar [12] reported that adding NaCl (0.5% wt/wt) to soil reduced alfalfa stem dry weight more than leaf dry weight, resulting in lower SLR and biomass yield for the salinity treatment. In addition, a pot study on 15 varieties of alfalfa indicated that biomass mass per plant was reduced by 50% and 73% when exposed to at 18.3 dS·m−1 and 24.5 dS·m−1 salinity soil, respectively [11]. Qiu et al. [14] found that alfalfa yield decreased with salinity treatments of 3–6‰ (wt/wt dry soil) in a field experiment.
In addition to biomass yield, alfalfa quality can also be affected by salinity stress. Important forage quality parameters include crude protein (CP), acid detergent fiber (ADF), neutral detergent fiber (NDF), and relative feeding value (RFV). High crude protein and low fiber content indicate better quality with higher protein content, digestibility, and palatability [9]. Salinity stress was reported to have a positive influence on alfalfa quality [9]. Suyama et al. [15] reported that the CP content of alfalfa was 1.2% and 18.4% higher for treatments of soil salinity at 13 dS·m−1 and 20 dS·m−1, while NDF for the two salinity treatments decreased by 11.6% and 16.7%, respectively, when compared with no salinity treatment. Similarly, Arshad et al. [16] revealed that ADF and NDF contents of alfalfa grown in nutrient solutions decreased when solution salinity increased from 1.4 dS·m−1 to 14 dS·m−1. Ferreira et al. [9] reported that RFV increased with soil salinity level increased from 3.1 to 18.4 dS·m−1, due to the decrease in ADF and NDF contents. In addition, the response of alfalfa quality to salinity was found to be variable for different cuts with more pronounced response for earlier cuts. Robinson et al. [17] found that the average CP content of two alfalfa varieties for treatment of soil salinity at 25 dS·m−1 in cut 1 was 33.8% higher than that at 15 dS·m−1, while the difference in CP content between the two salinity treatments was less than 1% in both cut 3 and cut 5.
Previous studies have shown that salinity can affect root architecture, including total root length (RL), average root diameter (AD), total root surface area (RSA), etc., and the results were obtained mostly from pot studies under single salt stress (NaCl) with saline water irrigation [18,19,20]. Most studies found that the root parameters were negatively affected by salinity. For example, Mao et al. [21] found that RL and RSA of locust tree at seedling stage in soil with NaCl content approximately 0.5% (wt/wt) were 33% and 54% lower, whereas AD was about 8% higher than the control treatment in a pot study. Similarly, Alvarez et al. [22] showed that the RL of citrus tree was significantly reduced by 62% when grown in NaCl-added tap water with a soil electric conductivity (EC) of 4 dS·m−1, relative to the control treatment. However, the salinity effect on RDM was not consistent. Xiong et al. [23] reported that alfalfa RDM significantly decreased when the NaCl increased from 50 mM to 200 mM in a hydroponic experiment. Mao et al. (2016) found that the RDM of a locust tree at seedling stage was reduced by 61.47% in soil with a 5‰ salt content (wt/wt) as compared to the no-salinity treatment. In contrast, Wang et al. [24] reported that RDM of alfalfa in a pot with washed sand were considerably enhanced by 45.83% for the salinity treatment (i.e., sand was washed with nutrient solution mixed with NaCl and Na2SO4 (NaCl:Na2SO4 = 9:1) for 7 d), relative to the treatment washed with nutrient solution without additional salts. Feng et al. [25] stated that the RDM of Lycium chinense increased and reached the maximum when salinity increased from 0 to 170 mM of NaCl treatment and then decreased with the further increase in salinity levels in a pot experiment.
Understanding the response of growth, yield, and quality to soil salinity is of importance for assessing the productivity of alfalfa grown on salt-affected soils, as well as for determining the soil salinity range with which the balance of alfalfa yield and quality can be achieved. As mentioned above, previous studies on the effects of salinity stress on alfalfa growth and quality was conducted mostly in pots and during seedling period, with the salinity mostly from NaCl solution. Few studies have examined the responses of the growth and quality of alfalfa to salt-affected soils that is common in arid and semi-arid regions worldwide, especially on the potential persistent effect of soil salinity on the root development the perennial plants beyond the establishment year. The main objective of this study was to investigate the effect of different soil salinity levels on alfalfa root development, growth, and quality based on a two-year field experiment. The interrelationship between root parameters, growth, and quality indicators were examined. In addition, whether or not adding biosolids fertilizer could mitigate the salinity stress on alfalfa growth was also explored.

2. Materials and Methods

2.1. Study Site Description and Experimental Design

The field experiment site (37°52′20″ N, 102°50′50″ E, and altitude of 1581 m) was located at the Shiyanghe Experimental Station for Center of Agricultural Water Research of China Agricultural University in the Gansu Province of Northwest China. Average annual precipitation in the sites is 164 mm, and average annual pan evaporation was about 2000 mm, measured by a cylinder Class A evaporation pan (diameter of 120.7 cm, depth of 20.0 cm). Average annual temperature was 8.8 °C, with extreme temperature ranges from as low as about −25 °C to as high as about 38 °C. The frost-free period was over 150 days with a mean annual sunshine duration of over 3000 h. Average groundwater table was below 30 m.
This experiment was conducted from May 2018 to October 2019 in the field, and each plot had an area of 6.66 m2 (3.33 m × 2.0 m). The sides and bottom of each plot were sealed by a 20 cm thick concrete layer to block mass and water exchange with neighboring plots. Soil at the site was classified as arid soil with a sandy loam texture. There was a total of six treatments including three salinity levels and two biosolids fertilizer treatments. For the salinity treatments, salts at 2‰, 4‰, and 6‰ of dry mass weight of 0–60 cm soil (referred as S1, S2, and S3 treatment, respectively) were added by saline water irrigation before the start of the experiment in 2018. Specifically, salts were added into the soil composed of NaCl, MgSO4, and CaSO4, with the mass ratio of 2:2:1, which was based on the ratio of main chemical ion composition of the local groundwater [26]. For biosolids fertilizer treatment, 1500 kg ha−1 of biosolids were mixed into 0–10 cm soil as a basal fertilizer in both 2018 and 2019. The average bulk density of 0–100 cm soil was 1.5 g·cm−3, and pH was greater than 8.2. Field capacity (FC) and saturated water content (0–100 cm) were 0.30 cm3·cm−3 and 0.37 cm3·cm−3, respectively [27]. For each treatment, there were three replicates which led to a total of 18 plots.
The alfalfa cultivar of Golden Empress was planted with seeding rate of 30 kg ha−1 in May 2017, with a row spacing of 25 cm and a plant spacing of 10 cm. Alfalfa was cut three times in 2018 and five times in 2019 during the growing period (Table 1). At each harvest, alfalfa was cut manually to leave a 3–5 cm height. During the growth of alfalfa, pest control was carried out in accordance with common practice of the area, and weeds were removed manually after each cut. During this experiment, all plots were irrigated with the same amount of the difference between the average soil water content to FC, when the average soil water content of 18 plots dropped to 60–70% of the FC. Alfalfa was irrigated two times (a total of 85 mm) during cut 1, once (54 mm) during cut 2, and no irrigation was applied during cut 3 in 2018. In 2019, alfalfa was irrigated once during each cut period with the range from 62 to 72 mm.

2.2. Data Collection

2.2.1. Soil Ec and Soil Salt Content

Soil samples were gathered every 6–8 days from a 0–100 cm depth with a 20 cm interval using an auger, and the hole was quickly backfilled. Part of soil sample was used to measure Ec1:5 (μS·cm−1) by an Ec meter (FE32, Mettler-Toledo International Inc., Greifensee, Switzerland). For the further analysis, the measured Ec1:5 was changed to the soil salt content based on the relationship between soil salt content and Ec1:5. To obtain the relationship, soil Ec1:5 and soil salt content were measured for 27 soil samples collected from the same soils in the plots prior to the experiment. Soil salt content was determined after removing the organic matter by using H2O2 and oven drying to achieve a constant weight. The linear regression equation between soil content and soil Ec1:5 is:
Sc (‰) = 0.003 × Ec1:5 + 0.25

2.2.2. Root Parameters

Root samples were collected by the monolith method after the last cuts in 2018 and 2019. The size of the drill hole was a cylindrical shape with an internal diameter of 5 cm and an internal height of 20 cm. The root samples of alfalfa were collected at a depth of 120 cm with an interval of 20 cm, and the hole was backfilled with the same soil with the root removed. Roots then were rinsed and scanned (Epson Perfection V700 Photo). The images of scanned roots were analyzed with an image analyzer (WinRHIZO, Regent Instruments Inc., Quebec, QC, Canada) to obtain root parameters of RL, RSA, RD, and RV. Roots then were oven dried at 65 °C until a constant weight, and they were reweighed for RDM determination.

2.2.3. Plant Height, Stems-to-Leaves Ratio, and Biomass Yield

Plant height was measured for randomly selected ten alfalfa plants from the interior rows of each plot during each cut period. Stems and leaves of 20 plants in each plot were collected manually, and then oven-dried at 65 °C to a constant weight to obtain their dry matter. Stems-to-leaves ratio was obtained by dividing dry matter of stems-to-leaves. Fresh matter of each plot was obtained by harvesting and weighing alfalfa from all the middle six rows in the plot, while DM was calculated by multiplying the fresh matter with the ratio of dry and fresh matter of the corresponding plot. To receive the ratio of dry to fresh matter of each plot, about 500 g fresh biomass for each plot was placed into an oven at 105 °C for one hour and then at 65 °C until a constant weight was achieved.

2.2.4. Quality Characteristics of Alfalfa

The quality parameters of alfalfa, including CP, ADF, and NDF content, were measured for each harvest. Briefly, CP (%) content was obtained using Equation (2) based on plant total N content (%), measured by an automatic nitrogen testing system (Kjeltec 8400, FOSS, Hilleroed, Denmark), and NDF (%) and ADF (%) content were measured using an automated fiber analyzer (ANKOM 2000i, New York, NY, USA). RFV was calculated [28] as follows:
CP = N × 0.65
RFV = ( 120 / NDF ) × ( 88.9 0.779 × ADF ) / 1.29

2.3. Statistical Analysis

A two-way analysis of variance (ANOVA) was performed to evaluate effects of the salinity and biosolids fertilizer treatments with salinity, biosolids fertilizer, and their interaction as fixed factors on soil salt content, root parameters, PH, SLR, DM, and quality parameters for each cut of the two years. Mean difference between different treatments were compared using the Duncan multiple comparison test at a significance level of 0.05. Correlation coefficients between root and growth parameters were also calculated for 2018 and 2019 separately. Linear regressions were conducted between dry yield with soil salt content, and also between soil quality parameters of CP, ACF, and NCF with plant height for each cut of the two years. All statistical analyses were conducted using IBM SPSS Version 25 (IBM Corp., Armonk, NY, USA).

3. Results

3.1. The Temporal Changes of Soil Salt Content over the Growth Period

The temporal changes of the mean soil salt content in the depth of 0–100 cm for different treatments during the growth period of alfalfa in 2018 and 2019 are presented in Figure 1. Salinity treatment was found to have a significant (p < 0.05) effect on the soil salt content in both years, while the biosolids fertilizer and the interactions between them were found not significant. As expected, the soil salt content had the order of S3 > S2 > S1, with the average difference of 0.5‰ between S3 and S2 and 0.8‰ between S2 and S1. The temporal change pattern was similar between different treatments in both years. In 2018, the soil salt content declined evidently and steadily, from 4.1‰ to 2.6‰ for S3 and from 1.9‰ to 1.3‰ for S1. In contrast, there was no evident declining trend for salt content in 2019. Rather, soil salt content fluctuated within a relatively narrow range for different treatments. Specifically, average soil salt content changed from 1.5‰ to 1.3‰ for S1, 2.1‰ to 1.8‰ for S2, and 2.8‰ to 2.2‰ for S3 from the start to the end of the season.

3.2. Root Parameters

Table 2 shows the comparisons of root parameters after the last cut between different treatments for 2018 and 2019. RL was not significantly different between treatments in both years (p > 0.05). For the other parameters of RSA, AD, RV, and RDM, salinity was significant (p < 0.05) in 2018, while biosolids and the interaction between biosolids and salinity were not significant. Overall, RSA, AD, RV, and RDM were significantly (p < 0.05) lower for S3 than S1 and S2, while they were similar between S1 and S2. Relative to S1 in 2018, S3 reduced RSA by 31.7%, AD by 25.0%, RV by 47.6%, and RDM by 27.5%, while RSA, AD, RV, and RDM were 15.3%, 5.9%, 20.2%, and 11.9% lower for S3 than S1 in 2019, respectively. Although RSA, AD, RV, and RDM were lower for higher salinity treatments in 2019, none of treatments were found to be significantly different, with the exception of S3 having a significantly lower RV than S1 and S2.

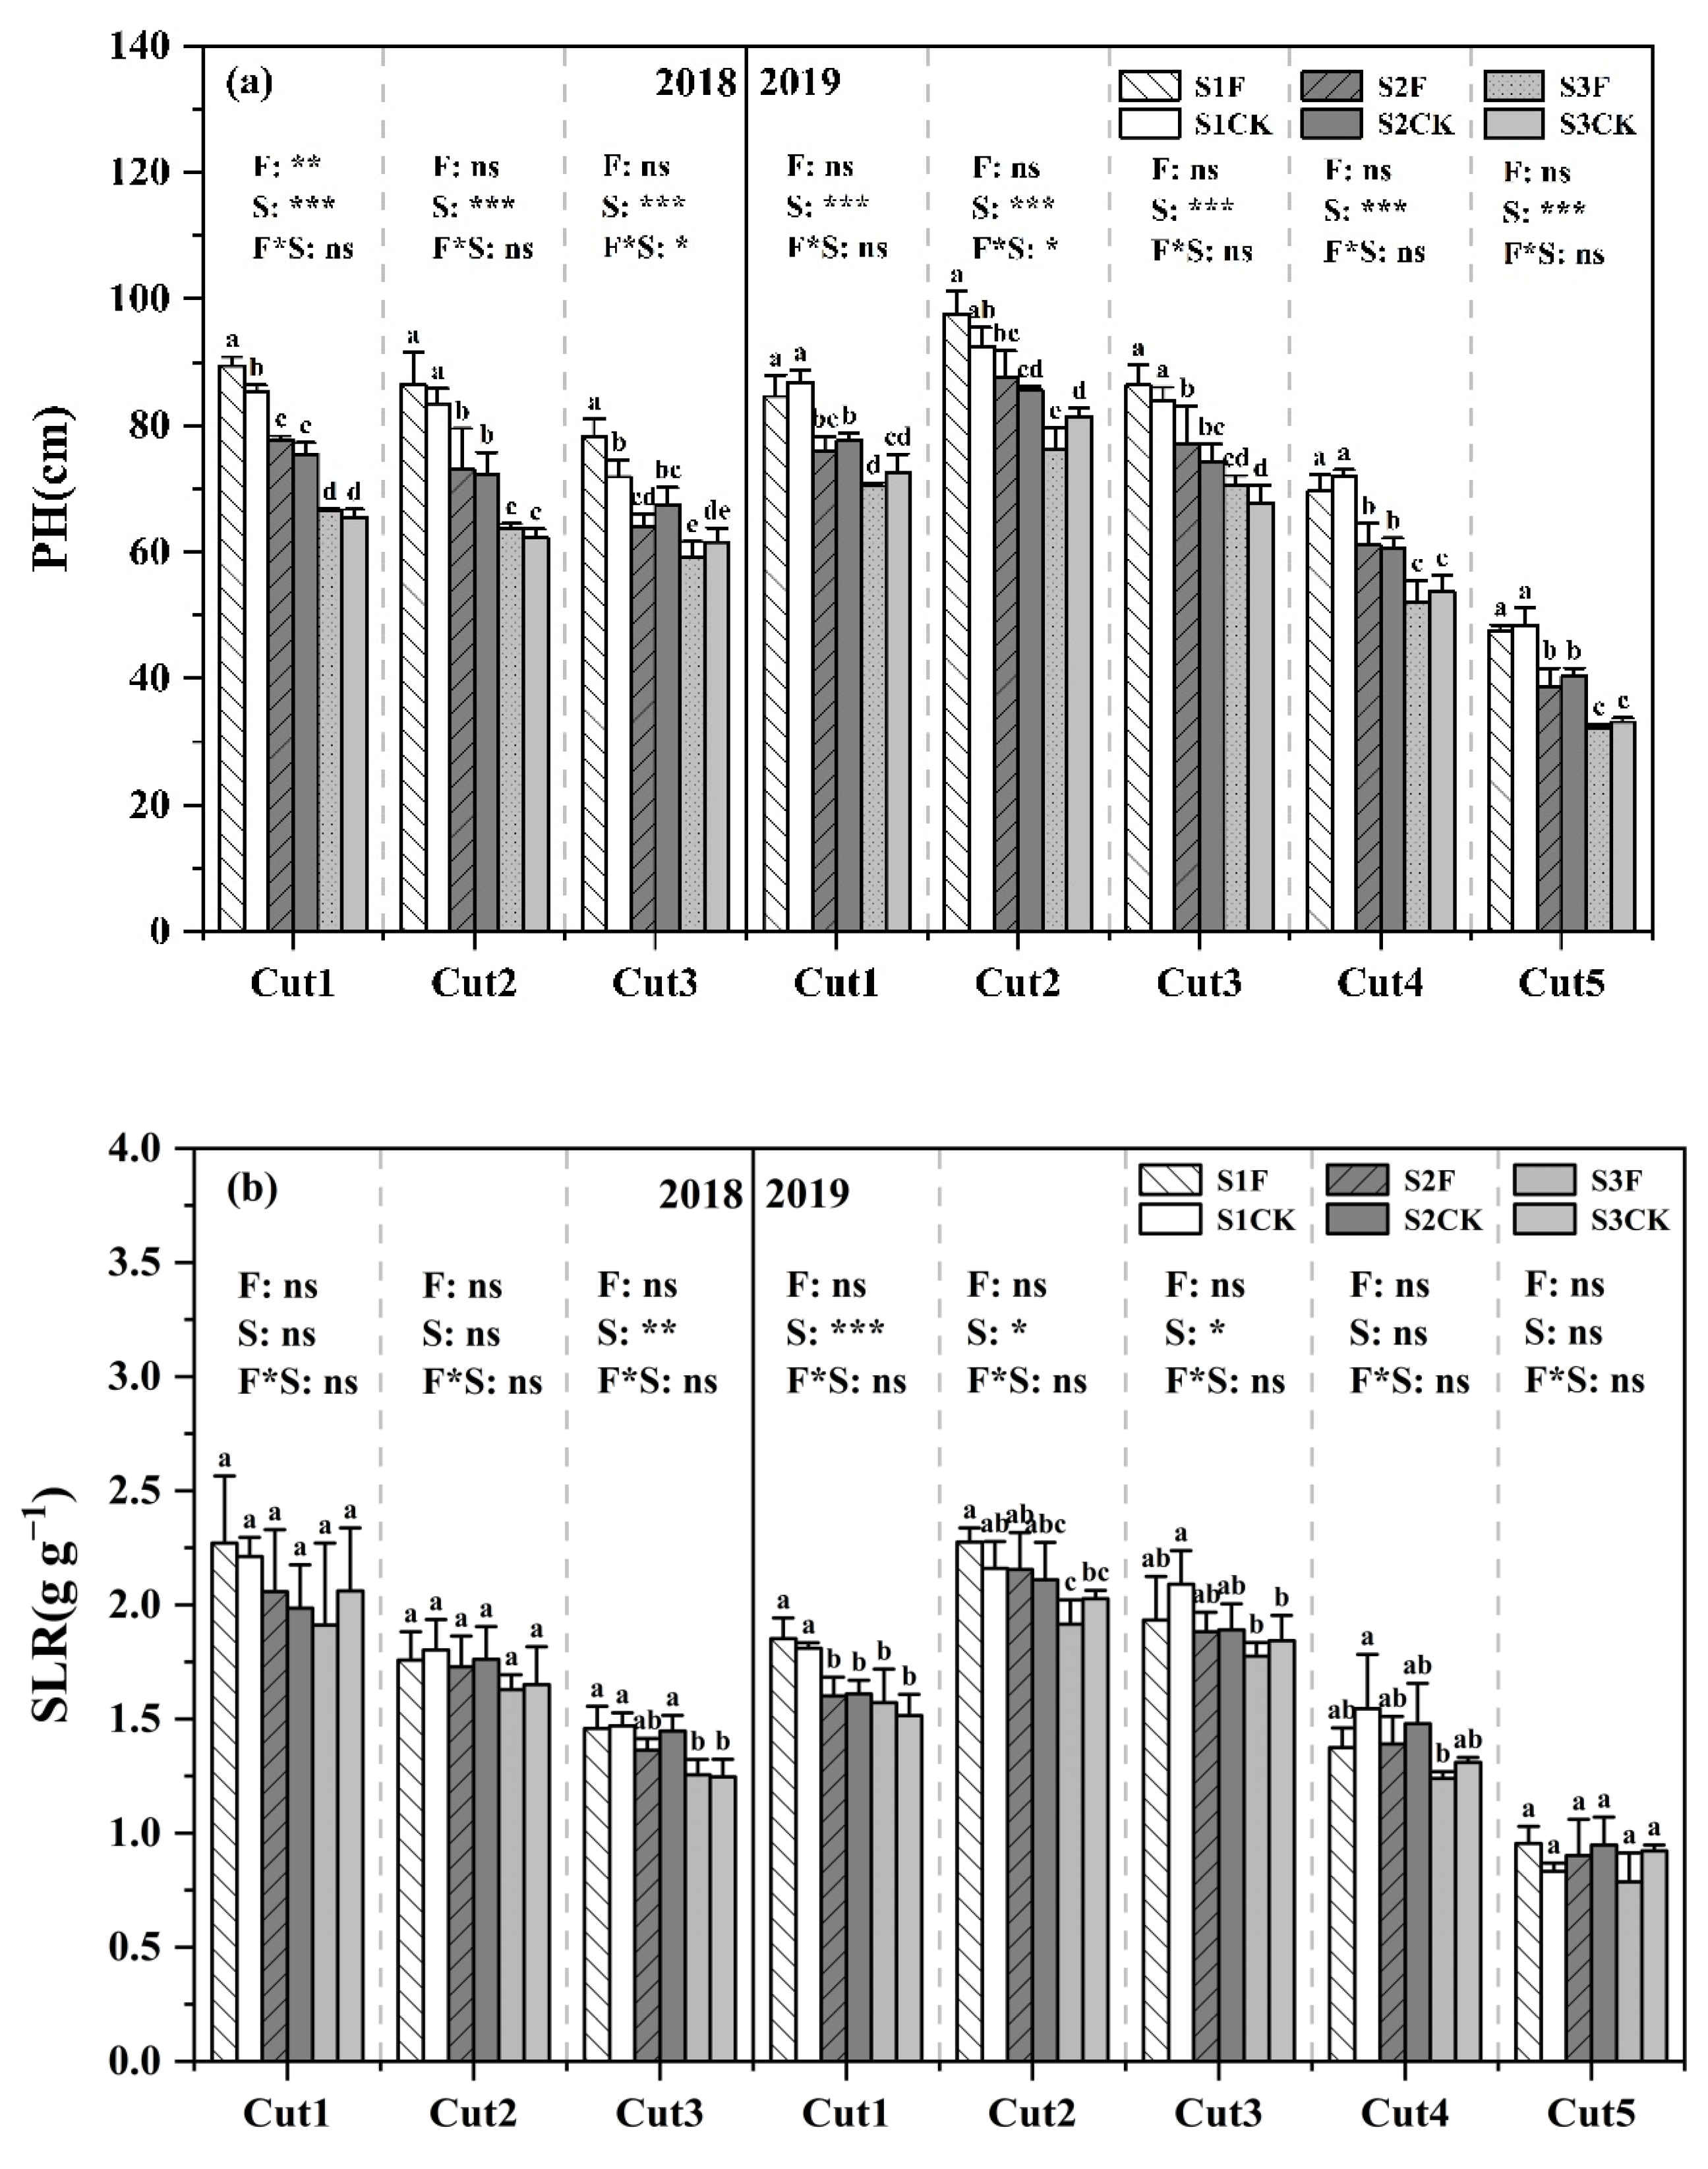
3.3. Plant Height, Stems-to-Leaves Ratio, and Biomass Yield

The comparisons of PH and SLR between different treatments for each cut in 2018 and 2019 are presented in Figure 2. In both years, salinity had consistently and negatively affected PH, while the biosolids fertilizer and the interactions between them were largely insignificant. For most cases, the PH for S1 was significantly (p < 0.05) higher than that of S2 and S3, and S2 had a significantly (p < 0.05) higher PH than S3. The average PH for S1 was 13.1%, 11.7% higher than that for S2, and 23.5%, 20.7% higher than that for S3 in 2018 and 2019, respectively. For most cuts, both salinity and biosolids fertilizer did not have significant effect on SLR, except that S3 led to significantly (p < 0.05) lower SLR than S1 for the last cut in 2018 and the earlier three cuts in 2019.
Similar to the results on PH, salinity had a significant effect on DM for each cut in the two years, except for cut 3 in 2018, while biosolids fertilizer and the interaction between biosolids and salinity were largely insignificant (Figure 3). For most cases, the DM for S1 and S2 was significantly (p < 0.05) greater than S3, while there was no significant difference between S1 and S2. Averagely, S1 led to 24% and 15% higher DM than S3 in 2018 and 2019, respectively. The DM difference between treatments was smaller for the last cut in both years. There was no significant difference in DM between S1, S2, and S3 for the last cut in 2018, and the difference was less than 0.3 Mg ha−1 for the last cut in 2019.
Figure 4 presents the relationship between DM and the average soil salt content over the respective growth period for each cut in 2018 and 2019, as well as the relative total yield of each year. Apparently, yield decreased linearly with the increase in soil salt content for each cut of the both years. The absolute value of the slopes from the linear regression was found decreasing with later cuts in both years. Specifically, the slope changed from −0.59 to −0.21 Mg·ha−1 per 1‰ soil salt content from cut 1 to cut 3 in 2018 and from −0.82 to −0.27 Mg·ha−1 per 1‰ soil salt content from cut 1 to cut 5 in 2019. The absolute value of the slope from the regression between relative total yield and average soil salt content was found to be similar between the two years (p > 0.05).

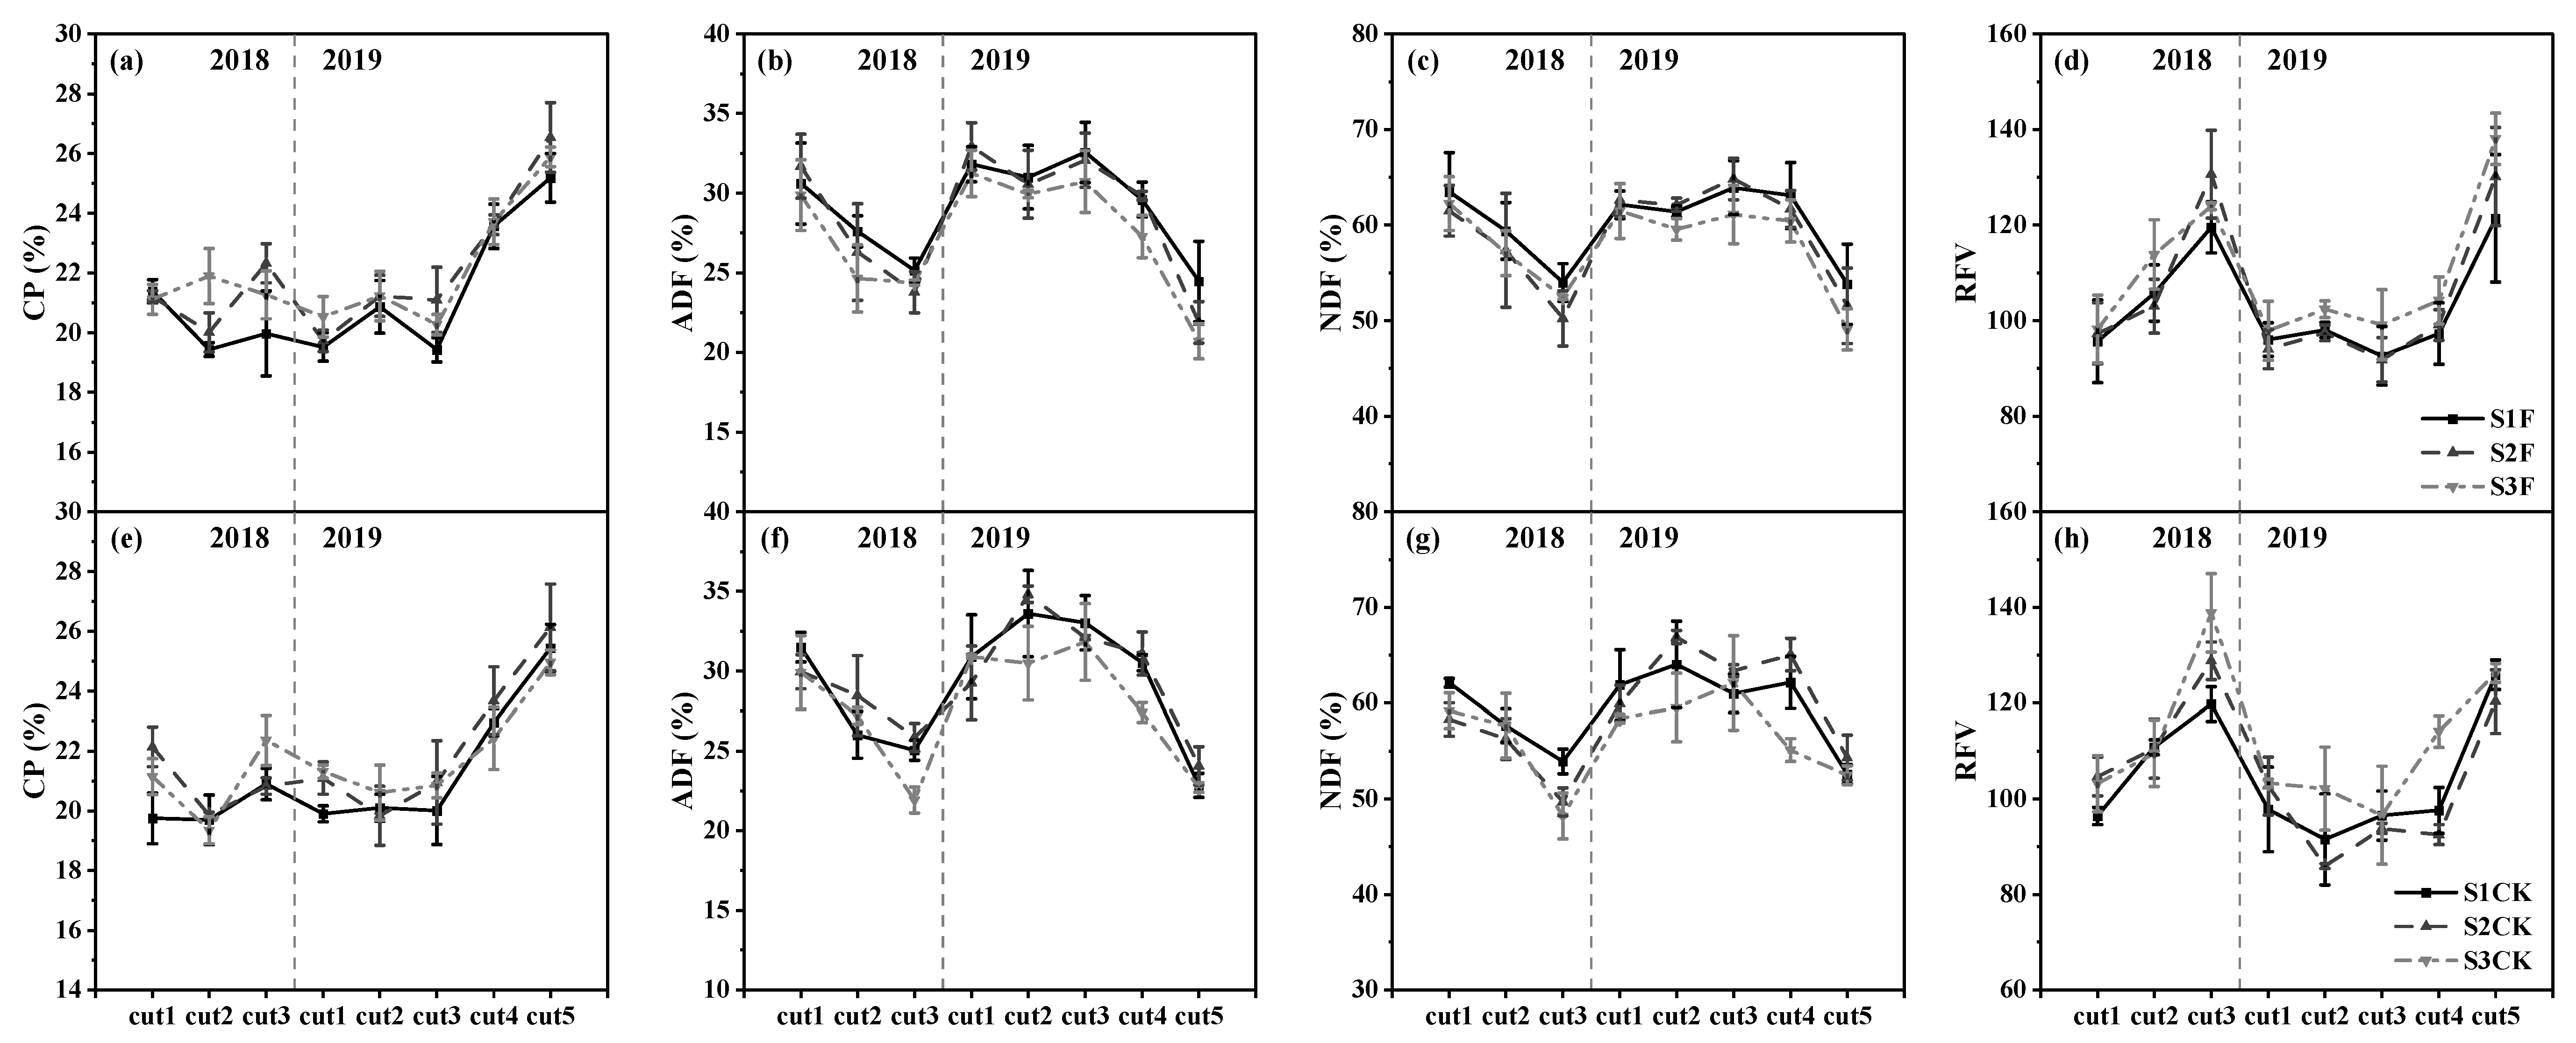
3.4. Alfalfa Quality Parameters

The quality parameters of CP, ADF, NDF, and RFV were within a similar range in the two years, and the change pattern of the parameters with different cuts was also similar for the different treatments in the two years (Figure 5). No apparent trend was found for CP for the three cuts, while ADF and NDF decreased steadily, and RFV increased steadily from cut 1 to cut 3 in 2018. In 2019, there was little variation between the first three cuts for all four parameters, and a greater change occurred for the later cuts. In general, CP and RFV were higher, and ADF and NDF were much lower at cut 5 in 2019 than the other cuts. Overall, increasing the salinity level was beneficial to reduce the content of ADF and NDF and increase CP and RFV.
The annual mean content of the four quality parameters was significantly (p < 0.05) affected by salinity levels but not affected by either biosolids fertilizer or the interaction between the biosolids fertilizer and salinity in 2018 and 2019 (Figure 6). CP content for S1 was significantly (p < 0.05) lower than S2 and S3, while there was no significant difference between S2 and S3. Averagely, S3 led to 4.9% and 2.2% higher CP contents than S1 in 2018 and 2019, respectively. Relative to S1, S3 reduced ADF by 4.8% and NDF by 3.9% in 2018, and ADF, NDF, and ADL were 5.7% and 4.4% lower for S3 in 2019, respectively. The average RFV of S3 was 6.1%, and was 6.8% higher than that of S1 in 2018 and 2019, respectively.

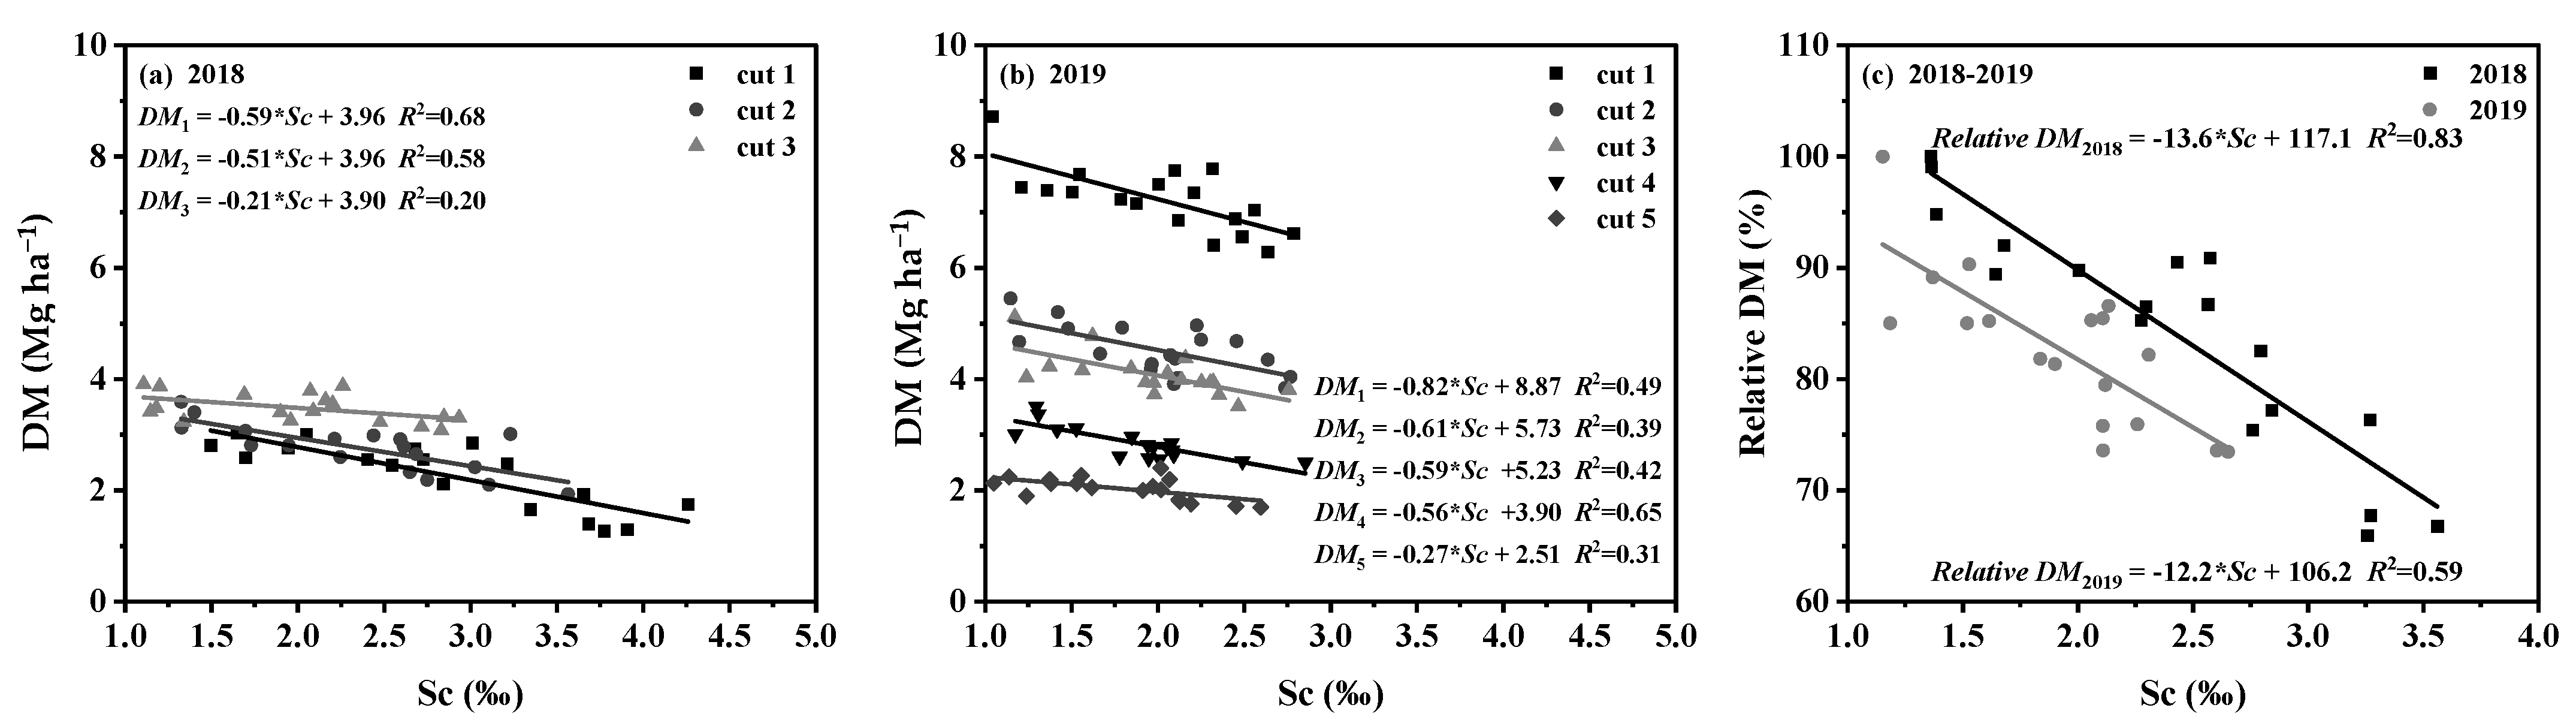
3.5. Relationships between Soil Salt Content, Root, and Aboveground Growth Parameters

Correlations between soil salt content, alfalfa root, and growth parameters for 2018 and 2019 are presented in Table 3 and Table 4, respectively. Soil salt content was found negatively correlated with all alfalfa growth and root parameters. It seems that the correlations of soil salt content with the growth parameters of PH, SLR, and DM were similar between the two years, with growth parameters having stronger correlations than the root parameters. The correlation coefficients between soil salt content with PH, SLR, and DM were 0.93, −0.78, and −0.85, averaged over the two years. On the contrary, the correlations between soil salt content with root parameters were found variable between the two years, with much weaker correlations in 2019 than in 2018. Correlations of soil salt content with root parameters were all significant, except for RL, with an average correlation coefficient of −0.68 in 2018, while the correlations became all insignificant in 2019.
Among all of the plant parameters, RL was found not significantly correlated with all other parameters, except for RSA in both years, while the other root parameters of RSA, AD, RV, and RDM were significantly (p < 0.05) correlated with each other and also with plant growth parameters in 2018.

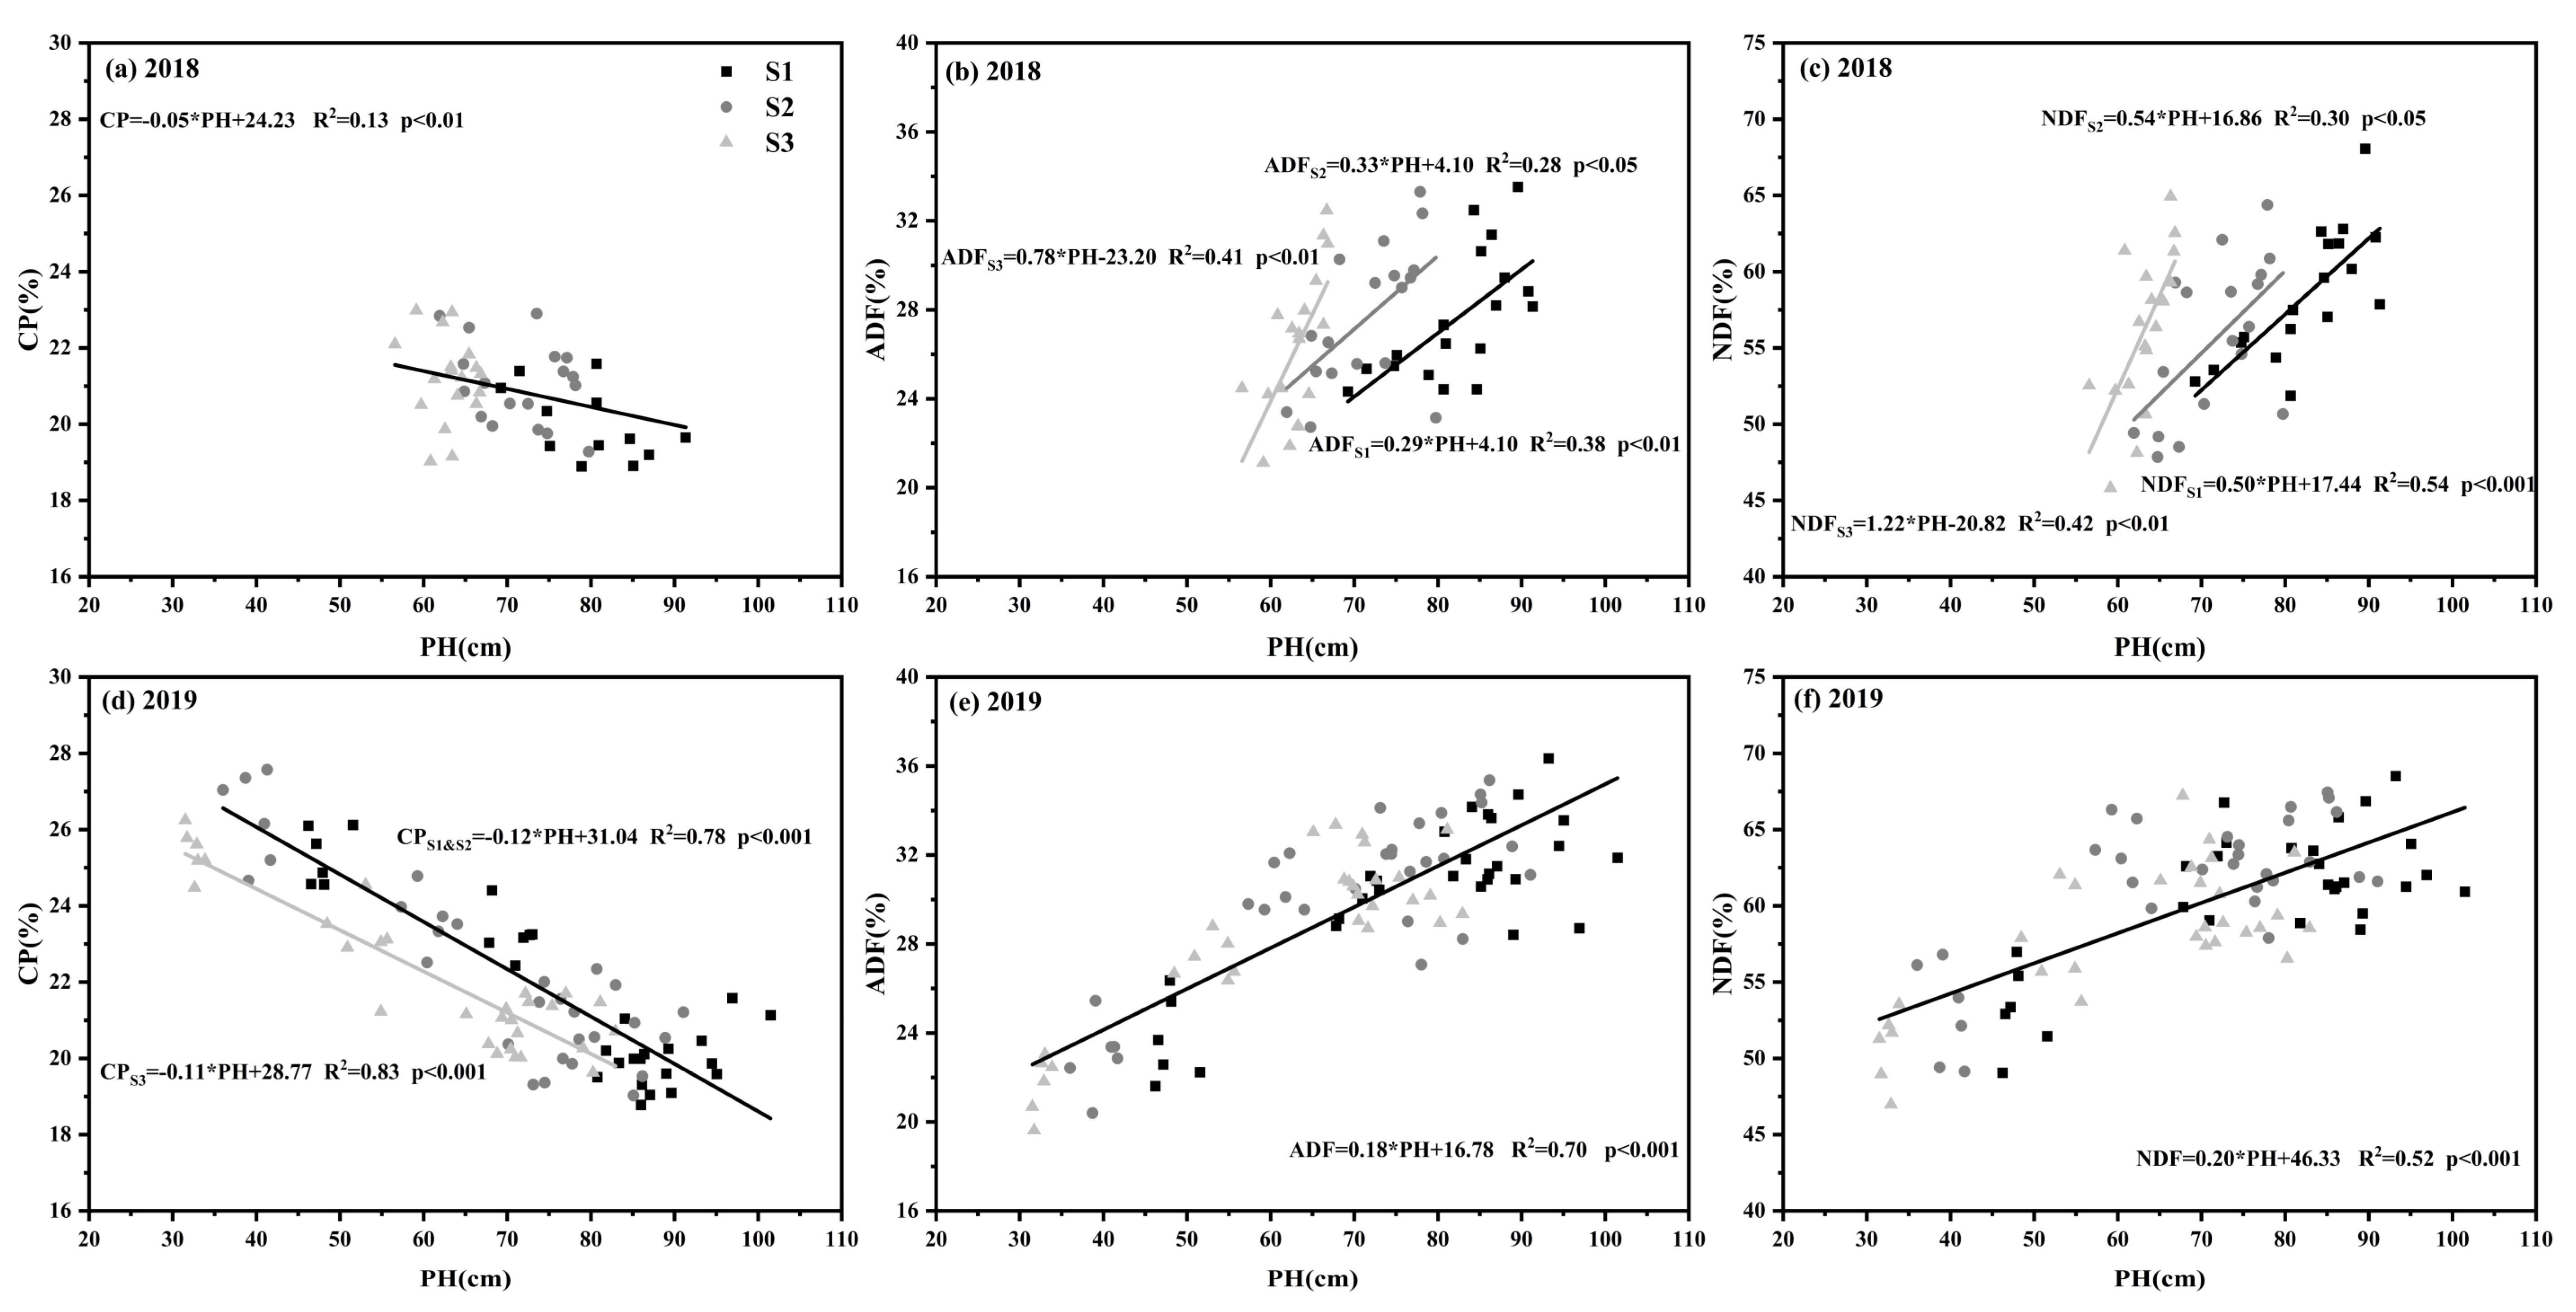
3.6. The Relationship between Plant Height Quality Parameters

In both years, CP decreased, while ADF and NDF increased with the increase in PH (Figure 7). For CP, the regression with PH was similar for the three salinity levels in 2018, while the regression for S3 had a significantly smaller intercept with a similar slope with the lower salinity treatments of S1 and S2 in 2019. The regression of CP with PH in 2018 had a much smaller slope and lower R2 than in 2019. Specifically, the slope was 0.05% cm−1 and 0.11% cm−1, and R2 was 0.13 and about 0.80 in 2018 and 2019, respectively. Relative to S1 and S2, the regression equation between PH and both ADF and NDF for S3 varied considerably in 2018, with a much larger slope than the other two salinity treatments. There was no significant difference in the equation for ADF and NDF between S1 and S2 in 2018. In 2019, the linear equations were found to be similar between the three salinity treatments for both ADF and NDF.

4. Discussion

Most results from previous pot studies have indicated that root development was enhanced when salinity stress was relatively light while being inhibited with greater salinity stress [25,29,30]. Bertrand et al. [31] reported that alfalfa RDM increased with the increase in NaCl concentration from 0 to 40 mM NaCl, while it reduced with the increase in NaCl concentration from 40 to 120 mM in a pot study. Xiong et al. [23] reported that the RDM of alfalfa under the NaCl level within the range of 0–50 mM was significantly higher than that under 200 mM NaCl in a pot experiment. In addition to RDM, the other root morphological parameters such as RSA and AD displayed similar trend with the increase in salinity, i.e., promoted by light salinity stress and inhibited by severe salinity stress [32]. Our results in general agreed with the previous findings, confirming that alfalfa is moderately salt-tolerant, and its root development is enhanced or not affected by certain low levels of salinity stress. Nevertheless, when the soil salt content further increases, the root growth will decrease substantially. Noticeably, there were no significant differences in all root parameters, except for RV, between different salinity treatments in 2019, suggesting that alfalfa root morphological parameters under higher salinity treatments could recover and achieve the same level of growth as those of no or low salinity stress treatments in the later years after suffering significant hindrance from salinity stress in the earlier year. We reasoned that the much lower soil salt content and the increased salinity tolerance for alfalfa in 2019 than in 2018 could be the two primary factors contributing to the results. The average soil salt contents in 0–100 cm in 2019 were 1.39‰, 2.03‰, and 2.38‰, i.e., 11%, 19%, and 25% lower than 2018 for S1, S2, and S3, respectively. Meanwhile, stress tolerance of perennial plants is likely to grow with the older age. Some studies have shown that drought tolerance of alfalfa roots increased with the increasing age [33,34]. Cornacchione et al. [35] indicated that older plants of perennials might have greater abiotic stress tolerances than younger plants in accordance with their optimal evolutionary strategy. Therefore, salinity tolerance threshold for the third-year alfalfa roots might be greater than 2.38‰, i.e., the salinity level of S3 in 2019, and the salinity level in S3 enhanced the root growth in 2019, contrary to the significant negative effect from the treatment in 2018.
In this study, greater salinity stress consistently led to lower growth parameters (PH, SLR, and DM) and better quality in both years, which was consistent with the results from previous studies. Su et al. [36] found that the alfalfa PH and DM decreased as the NaCl concentration increased from 0 to 100 mM in a pot study. Wang et al. [37] pointed out that water stress increased the CP and decreased the content of fiber in alfalfa. Moreover, Ferreira et al. [9] indicated that salinity stress improved alfalfa quality by increasing CP content and decreasing ADF and NDF. The negative effect of salinity stress on alfalfa growth and yield was often attributed to the decline of photosynthesis rate when alfalfa had undergone a certain level of salinity stress by reducing leaf chlorophyll content and stomatal conductance [38]. Previous studies have pointed out that the improvement in quality of alfalfa under salinity stress may be related to the changes in proline content and enzyme activities in the leaves [39,40]. Alfalfa responded to salinity stress by increasing proline content and up-regulating the enzyme activity in leaves, thereby removing the reactive oxygen species that caused irreversible damage to plant cells [40]. In addition, salinity stress could reduce photoassimilates [41] and decrease cellulase activity [42], which would lead to a decrease in ADF and NDF and an increase in RFV [15,17]. As a result, salinity stress improves the quality of alfalfa by changing both morphological and physiological parameters, specifically by decreasing PH and DM, increasing SLR, and regulating proline and enzyme activities in leaves.
Many studies have shown that cutting times were one of the important factors affecting alfalfa yield and quality [43]. Different cutting times could change the growth process of alfalfa, leading to varied yield and quality among cuttings. Similar to the findings of many earlier studies, alfalfa PH and SLR had a consistent decreasing trend with the cutting times in this study [37,44]. In terms of yield, our result in 2019 was consistent with those results, while alfalfa yield was found slightly increasing with cutting times in 2018. This discrepancy might be related to considerably higher soil salinity during early growth periods in 2018. In 2018, soil salinities during first cut period were 1.9‰, 2.8‰, and 3.8‰ for S1, S2, and S3, respectively, and declined rapidly to 1.3‰, 2.1‰, and 2.6‰ during the cut 3 period. Therefore, alfalfa growth was severely inhibited during the cut 1 period in 2018, probably leading to much lower yield than that with less salinity stress during the cut 3 period in 2018. In contrast, the soil salt content was kept relatively stable and low, around 2.5‰, during entire growing season in 2019, and salinity stress was similar between the five cut periods. Therefore, the change pattern of yield with cutting times in 2019 was found to be consistent with the results from other studies, with no evident change in stresses during different cut periods. On the other hand, the sensitivity of alfalfa yield to soil salinity was found to decrease with the aging of the plants in this study, evidenced by the declining slope from the regression of yield and soil salt content with the increasing cuts of in both years (Figure 4). The result was consistent with those from previous studies. Cornacchione et al. [35] reported that the alfalfa yield of cuts 1, 4, and 7 were reduced by 100%, 58%, and 22%, on average, for different soil salinity treatments.
In this study, the effect of salinity stress on most root morphological parameters became insignificant in 2019 after a significantly negative effect in 2018. Meanwhile, the correlation between root and aboveground growth parameters (PH, SLR, and DM) was found to be insignificant in 2019 from significant correlations in 2018. We reason that the difference could be attributed to the different sensitivity level to salinity stress between the aboveground growth parameters and root parameters. Previous studies have reported that alfalfa aboveground parameters were more sensitive to salinity stress than root parameters [13,45]. Cornacchione et al. [11] found that the root biomass of each alfalfa plant decreased by 18% and 49%, while the aboveground biomass decreased by 50% and 73%, respectively, when the plant was irrigated with saline water with 18.3 dS m −1 and 24.5 dS m −1. Bertrand et al. [31] found that the salinity threshold value, at which the plant growth began to significantly decrease, was different for aboveground alfalfa and root biomass, i.e., 40 mM and 120 mM NaCl treatments for above- and below-ground biomass, respectively. Given that root growth parameters changed little while yield declined significantly with the increase in soil salinity in 2019, the threshold value of soil salt content for alfalfa root growth was probably larger than 2.5‰ (roughly the level of S3 in 2019), while the threshold value was much lower than that for the yield.
Linking plant phenology to alfalfa yield and quality helps to determine the optimal harvest date to maximize the combined yield and nutritional value of forage [46]. Plant height has long been used as a reliable predictor for alfalfa quality parameters, such as CP, NDF, and ADF [47,48]. Our results suggested that the relationship between alfalfa plant height with quality varied depending on soil salinity level, as well as the quality parameters and the age of alfalfa. The good relationship between plant height and CP might not be applicable when alfalfa has experienced severe salt stress, as the results in the study showed that the regression between PH and CP was barely significant and had a very small R2. The good linear relationships between plant height with CDF and NDF were largely maintained even for soils with relatively higher salinity levels. Our results also suggested that the relationship would not be altered by soil salinity levels below a certain threshold, such as those in 2019.

5. Conclusions

In general, root parameters were significantly and negatively affected by salinity stress in 2018, but they were not significantly different between the treatments in 2019, resulting from the decreased soil salt content and increased root salt tolerance in 2019, relative to 2018. Soil salinity treatments had significant effect on alfalfa yield and quality, with higher salinity leading to lower yield and better quality in both years. Salinity tolerance of alfalfa tended to be greater with the later cuts, as the absolute value of the regression slope was smaller for later cuts in both years. Alfalfa aboveground biomass was more sensitive to soil salinity than root morphological parameters with an apparent lower salinity threshold value, beyond which biomasses begin to decline considerably. There was no apparent correlation between morphology with quality when alfalfa suffered severe salt stress, while plant height was a good predictor for alfalfa quality and the prediction equation was similar for soils with different salinity levels when soil salinity was within a certain range lower than a certain threshold.

Author Contributions

Conceptualization, X.H. and S.K.; methodology, Y.Q., Y.F. and S.L.; software, Y.W. and Y.F. All authors have read and agreed to the published version of the manuscript.

Funding

The study was supported by the National Natural Science Foundation of China (No. 51790534) and the 2115 Talent Development Program of China Agricultural University.

Institutional Review Board Statement

Not applicable.

Data Availability Statement

The data presented in this study are available on request from the corresponding author. The data are not publicly available due to privacy concerns.

Conflicts of Interest

The authors declare no conflict of interest.

References

  1. Rengasamy, P. World salinization with emphasis on Australia. J. Exp. Bot. 2006, 57, 1017–1023. [Google Scholar] [CrossRef] [PubMed] [Green Version]
  2. Peng, Y.L.; Gao, Z.W.; Gao, Y.; Liu, G.F.; Sheng, L.X.; Wang, D.L. Eco-physiological characteristics of alfalfa seedlings in response to various mixed salt-alkaline stresses. J. Integr. Plant Biol. 2008, 50, 29–39. [Google Scholar] [CrossRef] [PubMed]
  3. Egamberdieva, D.; Garfurova, I.; Islam, R. Salinity effects on irrigated soil chemical and biological properties in the Aral Sea basin of Uzbekistan. In Climate Change and Errestrial Carbon Sequestration in Central Asia; CRC Press: Boca Raton, FL, USA, 2007; pp. 147–162. [Google Scholar]
  4. Manchanda, G.; Garg, N. Salinity and its effects on the functional biology of legumes. Acta Physiol. Plant. 2008, 30, 595–618. [Google Scholar] [CrossRef]
  5. Qadir, M.; Quillerou, E.; Nangia, V.; Murtaza, G.; Singh, M.; Thomas, R.J.; Drechsel, P.; Noble, A.D. Economics of salt-induced land degradation and restoration. Nat. Resour. Forum 2014, 38, 282–295. [Google Scholar] [CrossRef]
  6. Endo, T.; Kubo-Nakano, Y.; Lopez, R.A.; Serrano, R.R.; Larrinaga, J.A.; Yamamoto, S.; Honna, T. Growth characteristics of kochia (Kochia scoparia L.) and alfalfa (Medicago sativa L.) in saline environments. Grassland Sci. 2014, 60, 225–232. [Google Scholar] [CrossRef]
  7. Lambin, E.F.; Meyfroidt, P. Global land use change, economic globalization, and the looming land scarcity. Proc. Natl. Acad. Sci. USA 2011, 108, 3465–3472. [Google Scholar] [CrossRef] [Green Version]
  8. Scasta, J.D.; Trostle, C.; Foster, M. Evaluating Alfalfa (Medicago sativa L.) Cultivars for Salt Tolerance Using Laboratory, Greenhouse and Field Methods. J. Agric. Sci. 2012, 4, 90. [Google Scholar] [CrossRef] [Green Version]
  9. Ferreira, J.F.S.; Cornacchione, M.V.; Liu, X.; Suarez, D.L. Nutrient Composition, Forage Parameters, and Antioxidant Capacity of Alfalfa (Medicago sativa L.) in Response to Saline Irrigation Water. Agriculture 2015, 5, 577–597. [Google Scholar] [CrossRef] [Green Version]
  10. Bao, A.K.; Du, B.Q.; Touil, L.; Kang, P.; Wang, Q.L.; Wang, S.M. Co-expression of tonoplast Cation/H+ antiporter and H+-pyrophosphatase from xerophyte Zygophyllum xanthoxylum improves alfalfa plant growth under salinity, drought and field conditions. Plant Biotechnol. J. 2016, 14, 964–975. [Google Scholar] [CrossRef]
  11. Cornacchione, M.V.; Suarez, D.L. Evaluation of Alfalfa (Medicago sativa L.) Populations’ Response to Salinity Stress. Crop Sci. 2017, 57, 137–150. [Google Scholar] [CrossRef] [Green Version]
  12. Monirifar, H. Tolerance of Five Azarbaijan Alfalfa Ecotypes to Salinity. In Proceedings of the International Meeting on Soil Fertility Land Management and Agroclimatology, Kusdasi, Turkey, 29–31 October 2008; pp. 709–713. [Google Scholar]
  13. Torabi, M.; Halim, M.R.A. Variation of root and shoot growth and free proline accumulation in Iranian alfalfa ecotypes under salt stress. J. Food Agric. Environ. 2010, 8, 323–327. [Google Scholar]
  14. Qiu, Y.; Fan, Y.Q.; Chen, Y.; Hao, X.M.; Li, S.E.; Kang, S.Z. Response of dry matter and water use efficiency of alfalfa to water and salinity stress in arid and semiarid regions of Northwest China. Agric. Water Manag. 2021, 254, 106934. [Google Scholar] [CrossRef]
  15. Suyama, H.; Benes, S.E.; Robinson, P.H.; Grattan, S.R.; Grieve, C.M.; Getachew, G. Forage yield and quality under irrigation with saline-sodic drainage water: Greenhouse evaluation. Agric. Water Manag. 2007, 88, 159–172. [Google Scholar] [CrossRef]
  16. Arshad, M.; Gruber, M.Y.; Wall, K.; Hannoufa, A. An Insight into microRNA156 Role in Salinity Stress Responses of Alfalfa. Front. Plant Sci. 2017, 8, 356. [Google Scholar] [CrossRef] [Green Version]
  17. Robinson, P.H.; Grattan, S.R.; Getachew, G.; Grieve, C.M.; Poss, J.A.; Suarez, D.L.; Benes, S.E. Biomass accumulation and potential nutritive value of some forages irrigated with saline-sodic drainage water. Anim. Feed Sci. Technol. 2004, 111, 175–189. [Google Scholar] [CrossRef]
  18. Acosta-Motos, J.R.; Ortuno, M.F.; Bernal-Vicente, A.; Diaz-Vivancos, P.; Sanchez-Blanco, M.J.; Hernandez, J.A. Plant Responses to Salt Stress: Adaptive Mechanisms. Agronomy 2017, 7, 38. [Google Scholar] [CrossRef] [Green Version]
  19. Neves, G.Y.S.; Marchiosi, R.; Ferrarese, M.L.L.; Siqueira-Soares, R.C.; Ferrarese, O. Root Growth Inhibition and Lignification Induced by Salt Stress in Soybean. J. Agron. Crop Sci. 2010, 196, 467–473. [Google Scholar] [CrossRef]
  20. Yang, Y.Q.; Guo, Y. Elucidating the molecular mechanisms mediating plant salt-stress responses. New Phytol. 2018, 217, 523–539. [Google Scholar] [CrossRef] [Green Version]
  21. Mao, P.L.; Zhang, Y.J.; Cao, B.H.; Guo, L.M.; Shao, H.B.; Cao, Z.Y.; Jiang, Q.K.; Wang, X. Effects of salt stress on eco-physiological characteristics in Robinia pseudoacacia based on salt-soil rhizosphere. Sci. Total Environ. 2016, 568, 118–123. [Google Scholar] [CrossRef]
  22. Alvarez, S.; Sanchez-Blanco, M.J. Long-term effect of salinity on plant quality, water relations, photosynthetic parameters and ion distribution in Callistemon citrinus. Plant Biol. 2014, 16, 757–764. [Google Scholar] [CrossRef] [Green Version]
  23. Xiong, X.; Liu, N.; Wei, Y.Q.; Bi, Y.X.; Luo, J.C.; Xu, R.X.; Zhou, J.Q.; Zhang, Y.J. Effects of non-uniform root zone salinity on growth, ion regulation, and antioxidant defense system in two alfalfa cultivars. Plant Physiol. Biochem. 2018, 132, 434–444. [Google Scholar] [CrossRef] [PubMed]
  24. Wang, X.; Chen, W.; Zhou, Y.; Han, J.; Zhao, J.; Shi, D.; Yang, C. Comparison of adaptive strategies of alfalfa (Medicago sativa L.) to salt and alkali stresses. Aust. J. Crop Sci. 2012, 6, 309–315. [Google Scholar]
  25. Feng, X.H.; An, P.; Guo, K.; Li, X.G.; Liu, X.J.; Zhang, X.M. Growth, root compensation and ion distribution in Lycium chinense under heterogeneous salinity stress. Sci. Hortic. 2017, 226, 24–32. [Google Scholar] [CrossRef]
  26. Jiang, J.; Huo, Z.L.; Feng, S.Y.; Zhang, C.B. Effect of irrigation amount and water salinity on water consumption and water productivity of spring wheat in Northwest China. Field Crops Res. 2012, 137, 78–88. [Google Scholar] [CrossRef]
  27. Hu, Y.Z.; Kang, S.Z.; Ding, R.S.; Du, T.S.; Tong, L.; Li, S.E. The Dynamic Yield Response Factor of Alfalfa Improves the Accuracy of Dual Crop Coefficient Approach under Water and Salt Stress. Water 2020, 12, 1224. [Google Scholar] [CrossRef]
  28. Putnam, D.; Robinson, P.; DePeters, E. Forage quality and testing. In Irrigated Alfalfa Management in Mediterranean and Desert Zones; University of California, Division of Agriculture and Natural Resources Publication: Davis, CA, USA, 2008; p. 25. [Google Scholar]
  29. Bazihizina, N.; Barrett-Lennard, E.G.; Colmer, T.D. Plant responses to heterogeneous salinity: Growth of the halophyte Atriplex nummularia is determined by the root-weighted mean salinity of the root zone. J. Exp. Bot. 2012, 63, 6347–6358. [Google Scholar] [CrossRef] [Green Version]
  30. Fernandez-Garcia, N.; Olmos, E.; Bardisi, E.; Garcia-De la Garma, J.; Lopez-Berenguer, C.; Rubio-Asensio, J.S. Intrinsic water use efficiency controls the adaptation to high salinity in a semi-arid adapted plant, henna (Lawsonia inermis L.). J. Plant Physiol. 2014, 171, 64–75. [Google Scholar] [CrossRef]
  31. Bertrand, A.; Gatzke, C.; Bipfubusa, M.; Levesque, V.; Chalifour, F.P.; Claessens, A.; Rocher, S.; Tremblay, G.F.; Beauchamp, C.J. Physiological and Biochemical Responses to Salt Stress of Alfalfa Populations Selected for Salinity Tolerance and Grown in Symbiosis with Salt-Tolerant Rhizobium. Agronomy 2020, 10, 569. [Google Scholar] [CrossRef]
  32. Guo, P.; Jin, H.; Wei, H.X.; Li, L.L.; Bao, Y.J. Fine root growth and water use efficiency in alfalfa (Medicago sativa L. cv. Gongong No. 1) planted along a salinity gradient in coastal area of Dalian, Northeast China. Soil Sci. Plant Nutr. 2016, 62, 164–172. [Google Scholar] [CrossRef] [Green Version]
  33. Huang, Z.; Liu, Y.; Cui, Z.; Fang, Y.; He, H.H.; Liu, B.R.; Wu, G.L. Soil water storage deficit of alfalfa (Medicago sativa) grasslands along ages in arid area (China). Field Crops Res. 2018, 221, 1–6. [Google Scholar] [CrossRef]
  34. Peralta-Videa, J.R.; de la Rosa, G.; Gonzalez, J.H.; Gardea-Torresdey, J.L. Effects of the growth stage on the heavy metal tolerance of alfalfa plants. Adv. Environ. Res. 2004, 8, 679–685. [Google Scholar] [CrossRef]
  35. Cornacchione, M.V.; Suarez, D.L. Emergence, Forage Production, and Ion Relations of Alfalfa in Response to Saline Waters. Crop Sci. 2015, 55, 444–457. [Google Scholar] [CrossRef] [Green Version]
  36. Su, J.H.; Bai, T.H.; Wang, F.; Bao, A.K. Overexpression of Arabidopsis H+-pyrophosphatase improves the growth of alfalfa under long-term salinity, drought conditions and phosphate deficiency. Czech J. Genet. Plant Breed. 2019, 55, 156–161. [Google Scholar] [CrossRef]
  37. Wang, Y.D.; Liu, C.; Cui, P.F.; Su, D.R. Effects of partial root-zone drying on alfalfa growth, yield and quality under subsurface drip irrigation. Agric. Water Manag. 2021, 245, 106608. [Google Scholar] [CrossRef]
  38. Farissi, M.; Mouradi, M.; Farssi, O.; Bouizgaren, A.; Ghoulam, C. Variations in leaf gas exchange, chlorophyll fluorescence and membrane potential of Medicago sativa root cortex cells exposed to increased salinity: The role of the antioxidant potential in salt tolerance. Arch. Biol. Sci. 2018, 70, 413–423. [Google Scholar] [CrossRef]
  39. Ashrafi, E.; Razmjoo, J.; Zahedi, M.; Pessarakli, M. Selecting Alfalfa Cultivars for Salt Tolerance Based on Some Physiochemical Traits. Agron. J. 2014, 106, 1758–1764. [Google Scholar] [CrossRef]
  40. Xiong, J.B.; Sun, Y.; Yang, Q.C.; Tian, H.; Zhang, H.S.; Liu, Y.; Chen, M.X. Proteomic analysis of early salt stress responsive proteins in alfalfa roots and shoots. Proteome Sci. 2017, 15, 19. [Google Scholar] [CrossRef] [Green Version]
  41. Radanielson, A.M.; Angeles, O.; Li, T.; Ismail, A.M.; Gaydon, D.S. Describing the physiological responses of different rice genotypes to salt stress using sigmoid and piecewise linear functions. Field Crop. Res. 2018, 220, 46–56. [Google Scholar] [CrossRef]
  42. Sheaffer, C.C.; Peterson, P.R.; Hall, M.H.; Stordahl, J.B. Drought Effects on Yield and Quality of Perennial Grasses in the North Central United-States. J. Prod. Agric. 1992, 5, 556–561. [Google Scholar] [CrossRef]
  43. Hu, Y.Z.; Kang, S.Z.; Ding, R.S.; Zhao, Q. A crude protein and fiber model of alfalfa incorporating growth age under water and salt stress. Agric. Water Manag. 2021, 255, 107037. [Google Scholar] [CrossRef]
  44. Fan, J.W.; Du, Y.L.; Wang, B.R.; Turner, N.C.; Wang, T.; Abbott, L.K.; Stefanova, K.; Siddique, K.H.M.; Li, F.M. Forage yield, soil water depletion, shoot nitrogen and phosphorus uptake and concentration, of young and old stands of alfalfa in response to nitrogen and phosphorus fertilisation in a semiarid environment. Field Crops Res. 2016, 198, 247–257. [Google Scholar] [CrossRef]
  45. Ashrafi, E.; Razmjoo, J.; Zahedi, M. Effect of salt stress on Growth and Ion accumulation of alfalfa (Medicago sativa L.) cultivars. J. Plant Nutr. 2018, 41, 818–831. [Google Scholar] [CrossRef]
  46. Lemaire, G.; Belanger, G. Allometries in Plants as Drivers of Forage Nutritive Value: A Review. Agriculture 2020, 10, 5. [Google Scholar] [CrossRef] [Green Version]
  47. Hintz, R.W.; Albrecht, K.A. Prediction of Alfalfa Chemical-Composition from Maturity and Plant Morphology. Crop Sci. 1991, 31, 1561–1565. [Google Scholar] [CrossRef]
  48. Parsons, D.; Cherney, J.H.; Peterson, P.R. Preharvest Neutral Detergent Fiber Concentration of Alfalfa as Influenced by Stubble Height. Agron. J. 2009, 101, 769–774. [Google Scholar] [CrossRef]
Figure 1. Seasonal variations of average soil salt content (Sc) of 0–100 cm for different treatments (S1f, S2f and S3F for (a) and S1CK, S2CK and S3Ck for (b)) in 2018 and 2019. The error bars represent the standard deviation (n = 3). S1F, S2F, and S3F indicate soil salt contents (wt/wt) 2‰, 4‰, and 6‰, respectively, with biosolids fertilizer; S1CK, S2CK, and S3CK indicate soil salt contents (wt/wt) 2‰, 4‰, and 6‰, respectively, with no biosolids fertilizer.
Agriculture 13 00750 g001
Figure 2. Alfalfa plant height (PH, (a)) and stem-leaf ratio (SLR, (b)) of each cut under different treatments in 2018 and 2019, along with their ANOVA results. The error bars represent the standard deviation (n = 3), and columns with different letters significantly differed at p < 0.05. F: biosolids fertilizer treatment; S: salinity treatment; F∗S: the interaction of biosolids fertilizer and salinity. ns, non-significant; *, **, and *** indicate significances at p < 0.05, p < 0.01, and p < 0.001 levels of ANOVA analysis, respectively.
Agriculture 13 00750 g002
Figure 3. Alfalfa dry matter (DM) of each cut under different treatments in 2018 and 2019, along with their ANOVA results. The error bars represent the standard deviation (n = 3), and columns with different letters significantly differed at p < 0.05. F: biosolids fertilizer treatment; S: salinity treatment; F∗S: the interaction of biosolids fertilizer and salinity. ns, non-significant; *, **, and *** indicate significances at p < 0.05, p < 0.01, and p < 0.001 levels of ANOVA analysis, respectively.
Agriculture 13 00750 g003
Figure 4. Linear regression between dry matter (DM) of each cut with the average soil salt content during the respective cut period for 2018 (a) and 2019 (b) and between the relative total yield with the average soil salt content during the whole growing period in 2018 and 2019 (c).
Agriculture 13 00750 g004
Figure 5. The change in alfalfa quality characteristics for each cut under different treatments in 2018 and 2019 for CP (a,e), ADF (b,f), NDF (c,g), and RFV (d,h). CP: crud protein; ADF: acid detergent fiber; NDF: neutral detergent fiber; RFV: relative feeding value. S1F, S2F, and S3F indicate soil salt contents (wt/wt) 2‰, 4‰, and 6‰, respectively, with biosolids fertilizer; S1CK, S2CK, and S3CK indicate soil salt contents (wt/wt) 2‰, 4‰, and 6‰, respectively, with no biosolids fertilizer.
Agriculture 13 00750 g005
Figure 6. The quality parameters of alfalfa averaged over different cuts for different treatments in 2018 (ad) and 2019 (eh). CP: crud protein; ADF: acid detergent fiber; NDF: neutral detergent fiber; RFV: relative feeding value. The error bars represent the standard deviation, and columns with different letters significantly differed at p < 0.05. F: biosolids fertilizer treatment; S: salinity treatment; F∗S: the interaction of biosolids fertilizer and salinity. ns, non-significant; * and ** indicate significances at p < 0.05 and p < 0.01 levels of ANOVA analysis, respectively.
Agriculture 13 00750 g006
Figure 7. Linear regression between alfalfa plant height (PH) and quality parameters under different salinity treatments in 2018 (ac) and 2019 (df). CP: crud protein; ADF: acid detergent fiber; NDF: neutral detergent fiber.
Agriculture 13 00750 g007
Table 1. Harvest date and the during of each cut for 2018 and 2019.
YearCutHarvest Date (D/M)Regrowth Duration (Days)
14/July28
201825/August31
310/September35
128/May50
229/June31
2019330/July30
429/August30
58/October39
Table 2. Parameters of the roots collected in the depth of 0–120 cm after the last cut under different treatments in both 2018 and 2019.
Treatment §20182019
RL (cm)RSA (cm2)AD (mm)RV (cm3)RDM (g)RL (cm)RSA (cm2)AD (mm)RV (cm3)RDM (g)
S1F1803 ± 396 a †780 ± 112 a1.4 ± 0.2 ab27.2 ± 5.0 a12.9 ± 2.1 a1463 ± 225 a789 ± 26 a1.7 ± 0.2 a34.3 ± 4.62 a12.6 ± 1.4 a
S1CK1675 ± 480 a697 ± 45 ab1.4 ± 0.3 ab23.8 ± 3.9 a11.1 ± 2.2 abc1385 ± 202 a742 ± 101 a1.7 ± 0.0 ab31.7 ± 4.0 ab14.3 ± 2.4 a
S2F1779 ± 104 a683 ± 123 ab1.2 ± 0.2 abc21.1 ± 6.2 ab10 ± 1.1 bcd1526 ± 196 a701 ± 120 a1.5 ± 0.1 b25.7 ± 5.5 ab12.2 ± 0.8 a
S2CK1439 ± 233 a649 ± 27 ab1.5 ± 0.2 a23.5 ± 1.7 a12.3 ± 1.0 ab1291 ± 214 a676 ± 79 a1.7 ± 0.2 ab28.4 ± 4.3 ab12.9 ± 2.4 a
S3F1402 ± 157 a438 ± 47 c1.0 ± 0.1 c10.9 ± 1.6 c8.2 ± 0.3 d1234 ± 85 a667 ± 69 a1.7 ± 0.1 a28.8 ± 4.1 ab11.3 ± 1.6 a
S3CK1650 ± 206 a571 ± 98 bc1.1 ± 0.1 bc15.8 ± 3.7 bc9.2 ± 0.5 cd1317 ± 236 a629 ± 114 a1.5 ± 0.0 ab23.9 ± 4.4 b12.4 ± 1.5 a
ANOVA testRLRSAADRVRDMRLRSAADRVRDM
Fns ‡nsnsnsnsnsnsnsnsns
Sns********nsnsns*ns
F∗Snsnsnsnsnsnsnsnsnsns
§ S1F, S2F, and S3F indicate the treatment of soil salt content 2‰, 4‰, and 6‰, respectively, with biosolids fertilizer added; S1CK, S2CK, and S3CK indicate the treatment of soil salt contents 2‰, 4‰, and 6‰, respectively, without biosolids fertilizer; F, biosolid fertilizer treatment; S, soil salinity treatments; F∗S, the interaction between salinity and biosolids fertilizer. RL, total root length; RSA, total root surface area; AD: average root diameter; RV, total root volume; RDM, total root dry matter. † Different letters in each column indicate significant differences at 0.05 level. ‡ * and *** indicate significances at p < 0.05 and p < 0.001 levels, respectively; ns, non-significant.
Table 3. Pearson’s correlations coefficients between soil salt content with root and aboveground growth parameters in 2018.
Variables §ScRLRSAADRVRDMPHSLRDM
Sc1−0.34−0.75 **−0.59 *−0.76 **−0.62 **−0.93 **−0.73 **−0.92 **
RL−0.3410.64 **−0.270.22−0.060.270.330.25
RSA−0.75 **†0.64 **10.55 *0.89 **0.66 **0.74 **0.64 **0.73 **
AD−0.59 *−0.270.55 *10.87 **0.89 **0.64 **0.50 *0.70 **
RV−0.76 **0.220.89 **0.87 **10.89 **0.78 **0.62 **0.79 **
RDM−0.62 **−0.060.66 **0.89 **0.89 **10.69 **0.48 *0.69 **
PH−0.93 **0.270.74 **0.64 **0.78 **0.69 **10.76 **0.88 *
SLR−0.73 **0.330.64 **0.50 *0.62 **0.48 *0.76 **10.73 **
DM−0.92 **0.250.73 **0.70 **0.79 **0.69 **0.88 **0.73 **1
CP0.79 **−0.31−0.61 **−0.44−0.61 *−0.51 *−0.71 **−0.57 *−0.67 **
ADF−0.55 *0.360.440.210.350.320.55 *0.370.69 **
NDF−0.450.350.22−0.110.090.010.440.230.31
RFV0.54 *−0.33−0.280−0.17−0.13−0.53 *−0.26−0.46
§ Sc: soil salt content; RL, total root length; RSA, total root surface area; AD: average root diameter; RV, total root volume; RDM, total root dry matter. All the aboveground growth and quality measured factors were the average value of each cut of the year. PH: plant height; SLR: stem-leaf ratio; DM: alfalfa dry matter. † * and ** indicate significances at p < 0.05 and p < 0.01 levels, respectively.
Table 4. Pearson’s correlations coefficients between soil salt content with root and aboveground growth parameters in 2019.
Variables §ScRLRSAADRVRDMPHSLRDM
Sc1−0.21−0.42−0.28−0.45−0.37−0.92 **−0.83 **−0.78 **
RL−0.2110.77 **−0.420.330.180.210.360
RSA−0.420.77 **10.250.85 **0.30.40.430.18
AD−0.28−0.420.2510.72 **0.160.240.100.26
RV−0.450.330.85 **0.72 **10.290.430.350.27
RDM−0.370.180.300.160.2910.350.440.32
PH−0.92 **†0.210.400.240.430.3510.82 **0.83 **
SLR−0.83 **0.360.430.100.350.440.82 **10.76 **
DM−0.78 **00.180.260.270.320.83 **0.76 **1
CP0.58 *−0.02−0.23−0.29−0.33−0.19−0.62 **−0.62 **−0.49 *
ADF−0.51 *0.370.36−0.030.250.460.63 **0.68 **0.55 *
NDF−0.430.460.48 *0.040.350.350.50 *0.59 **0.48 *
RFV0.48 *−0.45−0.47 *−0.03−0.34−0.38−0.58 *−0.66 **−0.54 *
§ Sc: soil salt content; RL, total root length; RSA, total root surface area; AD: average root diameter; RV, total root volume; RDM, total root dry matter. All the aboveground growth and quality measured factors were the average value of each cut of the year. PH: plant height; SLR: stem-leaf ratio; DM: alfalfa dry matter. † * and ** indicate significances at p < 0.05 and p < 0.01 levels, respectively.
Disclaimer/Publisher’s Note: The statements, opinions and data contained in all publications are solely those of the individual author(s) and contributor(s) and not of MDPI and/or the editor(s). MDPI and/or the editor(s) disclaim responsibility for any injury to people or property resulting from any ideas, methods, instructions or products referred to in the content.

