Article

Development of a Low-Power Automatic Monitoring System for Spodoptera frugiperda (J. E. Smith)

1
National Research Center of Intelligent Equipment for Agriculture, Beijing Academy of Agricultural and Forestry Sciences, Beijing 100097, China
2
Research Center for Intelligent Equipment, Beijing Academy of Agricultural and Forestry Sciences, Beijing 100097, China
3
National Center for International Research on Agricultural Aerial Application Technology, Beijing 100097, China
4
Institute of Plant Protection, Beijing Academy of Agriculture and Forestry Sciences, Beijing 100097, China
*
Author to whom correspondence should be addressed.
Agriculture 2023, 13(4), 843; https://doi.org/10.3390/agriculture13040843
Submission received: 9 March 2023 / Revised: 1 April 2023 / Accepted: 7 April 2023 / Published: 9 April 2023
(This article belongs to the Section Crop Protection, Diseases, Pests and Weeds)

Abstract

:
Traditional traps for Spodoptera frugiperda (J. E. Smith) monitoring require manual counting, which is time-consuming and laborious. Automatic monitoring devices based on machine vision for pests captured by sex pheromone lures have the problems of large size, high power consumption, and high cost. In this study, we developed a micro- and low-power pest monitoring device based on machine vision, in which the pest image was acquired timely and processed using the MATLAB algorithm. The minimum and maximum power consumption of an image was 6.68 mWh and 78.93 mWh, respectively. The minimum and maximum days of monitoring device captured image at different resolutions were 7 and 1486, respectively. The optimal image resolutions and capture periods could be determined according to field application requirements, and a micro-solar panel for battery charging was added to further extend the field life of the device. The results of the automatic counting showed that the counting accuracy of S. frugiperda was 94.10%. The automatic monitoring device had the advantages of low-power consumption and high recognition accuracy, and real-time information on S. frugiperda could be obtained. It is suitable for large-scale and long-term pest monitoring and provides an important reference for pest control.

1. Introduction

The fall armyworm Spodoptera frugiperda (J. E. Smith) (Lepidoptera: Noctuidae), a notorious migratory pest native to tropical and subtropical America [1], is difficult to control because it is characterized by high spreading performance, polyphagosity, a short life cycle, and a large reproductive capacity [2,3]. In early 2016, S. frugiperda invaded Africa, swept across almost all sub-Saharan African countries in the following two years [4,5,6], migrated into India in May 2018 [7], and invaded China in December 2018, spreading through 27 provinces (autonomous regions, municipalities) in 2020 [1,8,9]. S. frugiperda is one of the most damaging crop pests, attacking over 350 hosts and severely impacting the yields of several agricultural crops. Maize is the most severely affected crop, and S. frugiperda has become a huge threat to the food security of many countries [10,11]. S. frugiperda has spread rapidly in the croplands of many countries, highlighting the crucial need for large-scale monitoring for early and timely pest control.
Determining pest species and quantities is an important foundation for accurate pest prediction and has great significance for developing sustainable integrated pest management programs to decrease the impact of pests [12,13,14]. Sex pheromone lures are widely used to obtain pest quantities as they present several advantages, such as nontoxicity, high specificity, no killing of natural enemies, and the ability to apply minimal dosages [15,16]. Sexual attraction is the main monitoring method for S. frugiperda [17], and unitraps are the main method used to monitor S. frugiperda in the field [6,12]. Pest numbers in these traditional traps should be counted manually; this is time-consuming and laborious, its accuracy is not guaranteed, and it cannot meet the practical needs of modern plant protection.
To solve the problem of time-consuming and laborious counting in pest monitoring, new pest monitoring techniques are being explored. Currently, the automatic identification and counting technology for pests include sound signals [18], infrared sensors [19], and image technology [20,21,22,23]. The advantages of automatic identification and counting for pests based on machine vision are high speed and intelligence, which are popular topics in the field of pest monitoring [24,25,26,27,28,29,30]. Guarnieri et al. [31] improved the traditional monitoring device, and the images were obtained through a mobile phone; however, the battery that should be replaced regularly was used as power for the monitoring device. Fukatsu et al. [32] combined the sticky and sex pheromone lures to capture Leptocorisa chinensis Dallas; the images were photographed based on machine vision and transferred to a server. The automatic counting accuracy was 89.1% based on background difference technology, but an open-style trap would have reduced insect capture efficiency. Ding et al. [33] studied the recognition and counting method of pests captured using sex pheromone lures based on deep learning and achieved better recognition results. López et al. [34] proposed an autonomous monitoring system based on a low-cost image sensor. A CC1110F32 SoC, 3.6 V battery (1200 mAh), and low-cost camera were used in the monitoring system. The power consumption of the system was low. However, the maximum image was 640 × 480 pixels, and a short-range wireless communication module was used to transmit images. It was suitable to monitor large pests in the field near the farmer’s house. Zhao et al. [35] used a triangle trap to capture G. molesta; pest images were taken manually, G. molesta were counted using MATLAB software, and the results of automatic counting were used for fitting a logistic model to forecast the control threshold and key control period. Doitsidis et al. [36] presented a novel automated McPhail e-trap in which a 2 MP digital camera was connected to a 16-bit low-power microcontroller, and a 12 V battery (7000 mAh) was used to power the trap throughout the summer period. The image of Bactrocera oleae (Gmelin) was captured based on machine vision, and the automatic counting accuracy of B. oleae was almost 75%. But the power consumption of the McPhail trap was not analyzed. Chen et al. [37] designed a new automatic monitoring system for G. molesta captured using sex pheromones, and the identification accuracy of G. molesta reached more than 90%. However, the battery of the monitoring system should be replaced regularly. Ünlü et al. [38] developed a camera-based delta trap. A high-definition camera, 12 V battery (7000 mAh), and solar cell were used; the image of Lobesia botrana was captured via mobile phone or computer once a day, and dynamic data on L. botrana was obtained. However, the trap should be constructed near a farmer’s house with a good network signal. Hong et al. [39] developed algorithms to count Matsucoccus thunbergianae using a deep learning object detector, and the sticky images were captured by a Sony camera in a dark room. The detection and counting performances were evaluated for eight model conditions and two cropping conditions, and a counting accuracy of 95% or more was obtained in most models. Preti [40] used camera-equipped green smart traps (GST) and orange delta-shaped traps to monitor Cydia pomonella (L.) adults. Four high-definition cameras, two 3.7 V batteries (2200 mAh), and a solar panel were used, and three images of C. pomonella were captured per day. The power consumption of GST was relatively high. C. pomonella captures did not differ between the smart trap and orange delta-shaped trap when both were checked manually, but automatic counting results were inflated in some orchards due to misidentification of primarily similar-sized nontarget moths. Schrader et al. [41] developed a plug-in imaging system for pest delta traps. An MCU with camera module OV2640 and a 3.7 V DC power source (350 mAh) were used, and images with 320 × 240 pixels were captured at daily intervals over the course of two weeks. The power consumption of an image was about 90 mWh. The captured images were stored on a microSD card; the pest population was not obtained timely, and the SD card should be replaced manually for picture copy. The codling moth (C. pomonella) was monitored using the system. Qiu et al. [42,43] designed a monitoring device based on a sex pheromone lure to collect images of S. frugiperda male adults. The identification precision, recall, and Fl-measure of Yolov5s-AB trained by images of added high-similarity S. litura adult samples reached 96.23%, 91.85%, and 93.99%, respectively. However, the monitoring device was large in size and had high power consumption. Trapping using a sex pheromone lure provides a cost-effective method to detect S. frugiperda and is essential for large-scale field monitoring of populations to determine its geographical distribution and migration behavior as the species equilibrates to its new environment [44].
Traditional traps require manual investigation, which is time-consuming and laborious. An automatic monitoring device based on machine vision helps improve the efficiency of pest monitoring. However, large-size automatic monitoring devices have the problems of high cost, high power consumption, and low stability. While small-sized pest monitoring devices have the problems of limited battery capacity, low image resolution, and a short distance of image transmission, they cannot meet the requirements of automatic pest monitoring and timely prevention and control. In this study, we aimed to develop an automatic pest monitoring device that addresses the problems of high energy consumption, high cost, and large volume of traditional automatic pest monitoring devices. It could be used to monitor S. frugiperda, and the images were transmitted by a long-range wireless module with a low-power consumption strategy. Simultaneously, an image processing system was constructed to count S. frugiperda, which provides an important reference for the comprehensive management of S. frugiperda.

2. Materials and Methods

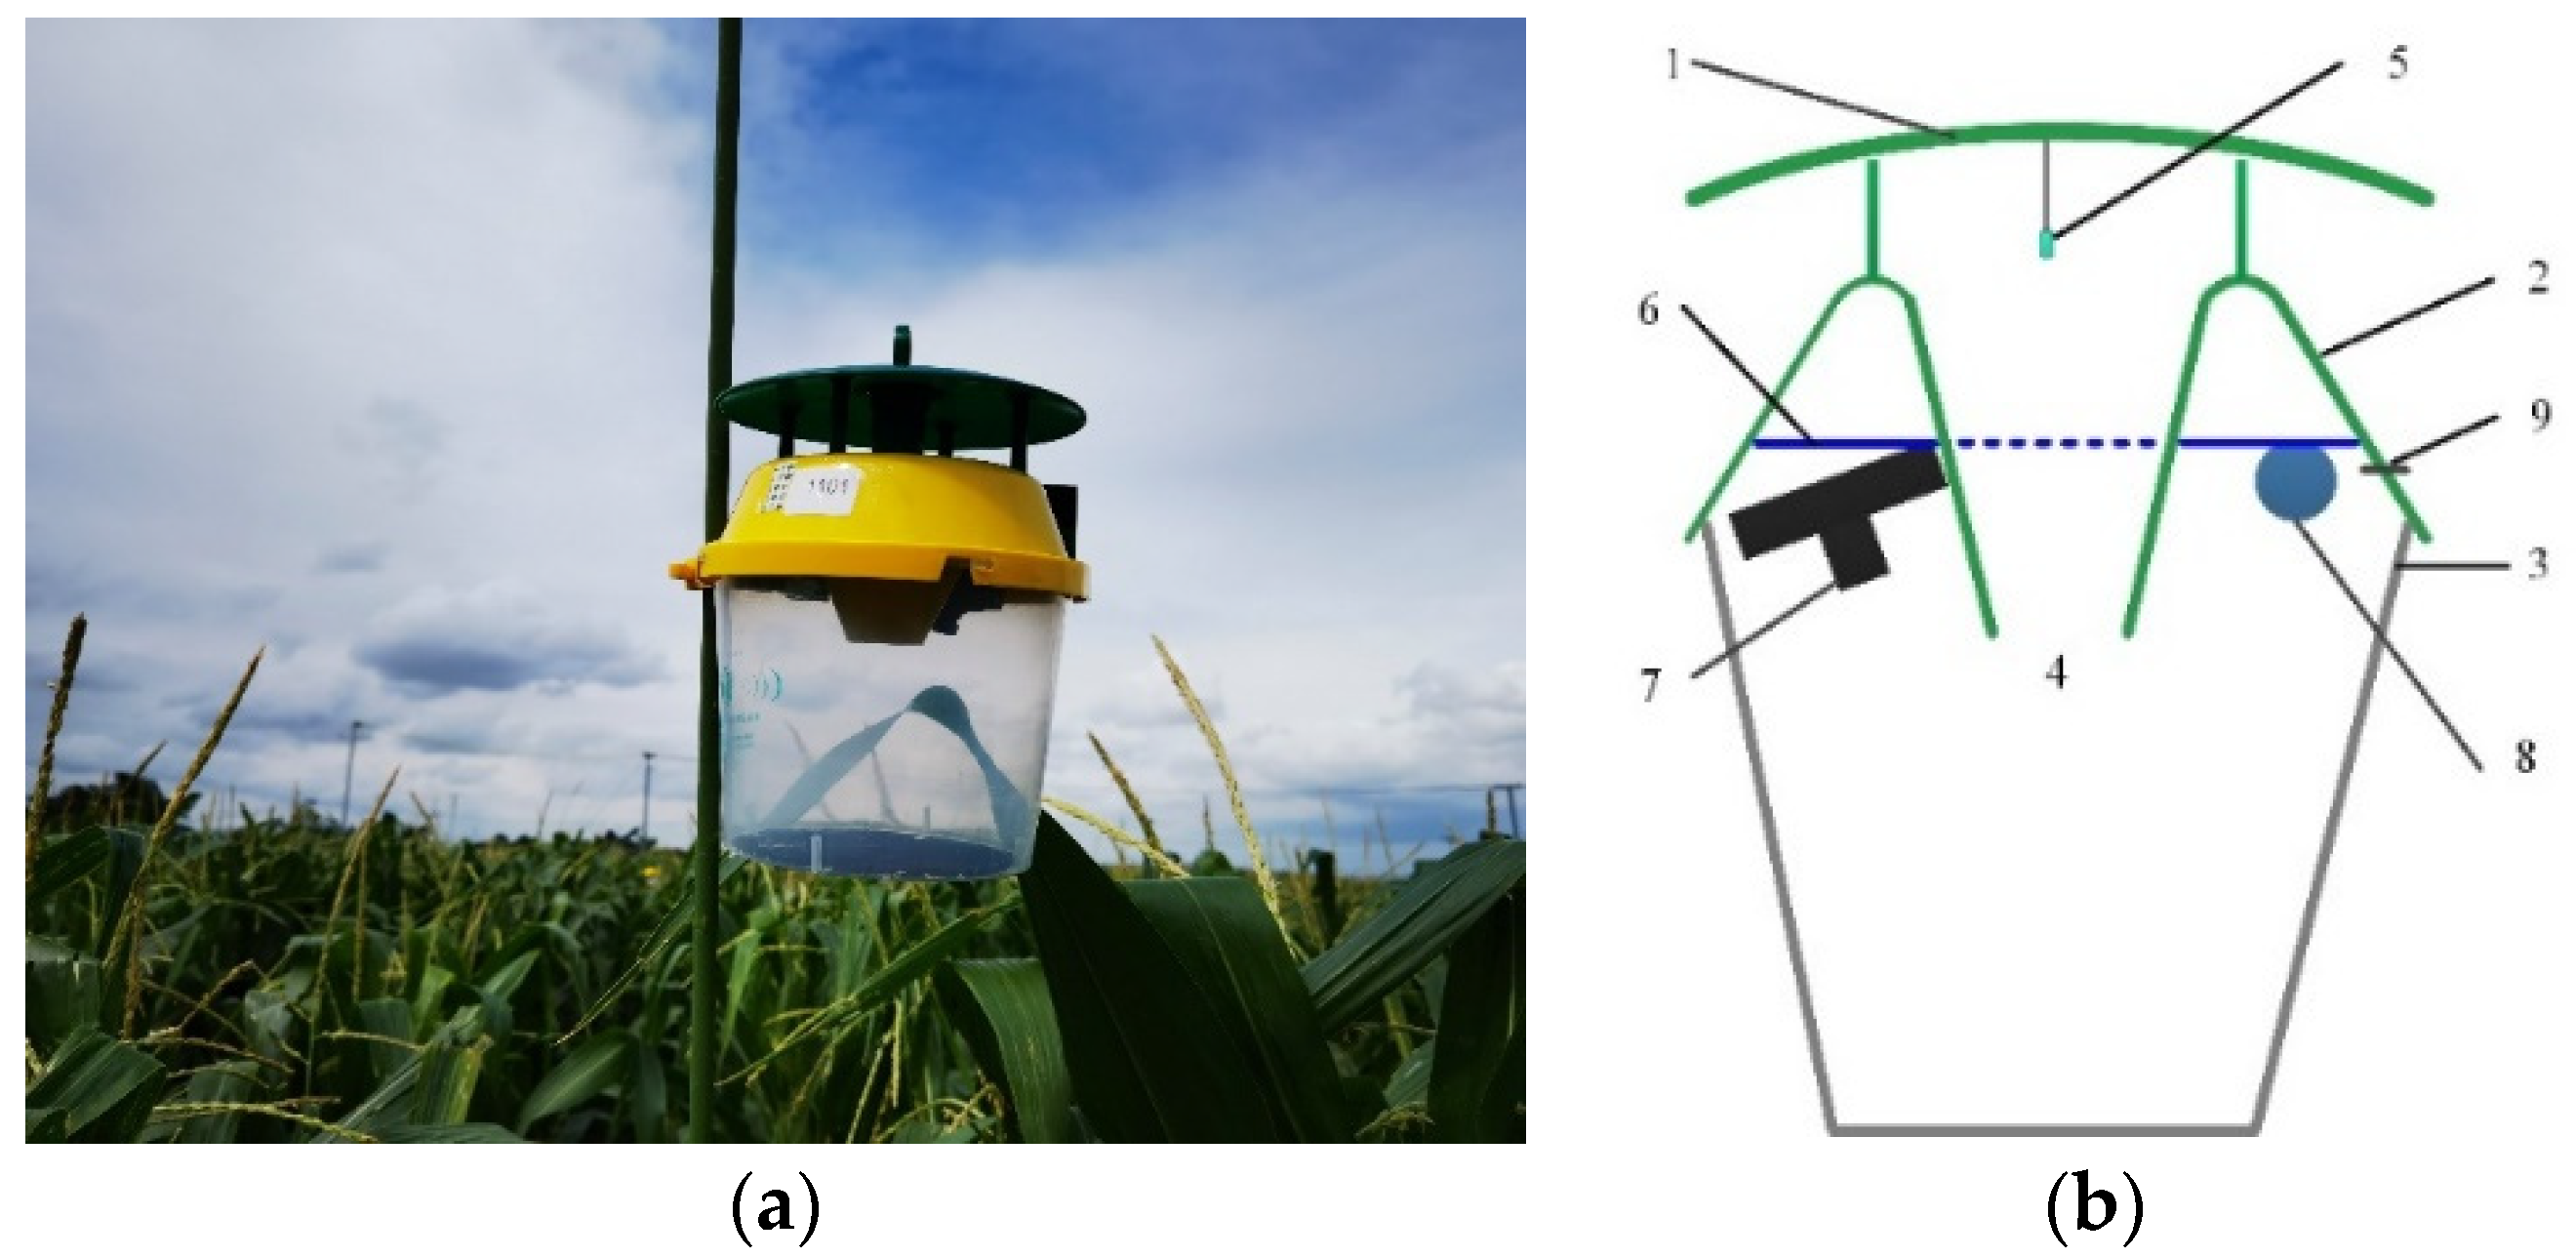
2.1. Traditional Monitoring Methods for S. frugiperda

The traditional unitraps are usually used to monitor male moths of S. frugiperda captured using sex pheromone lures, and the number of pests should be counted manually (Figure 1a). The forewings of the male moth are grayish-brown with white, tan, and black markings. The yellow-brown ring pattern and grayish-brown kidney pattern are obvious. There is a large white marking on the apical angle of the forewing, which is a typical feature of the male moth (Figure 1b). The forewings of the female moth are grayish-brown, with an obvious ring and kidney pattern. The inside of the ring pattern is grayish-brown, and the edge is yellowish-brown. The kidney pattern is grayish brown with black and white scales, and the edge is yellowish-brown and discontinuous (Figure 1c).

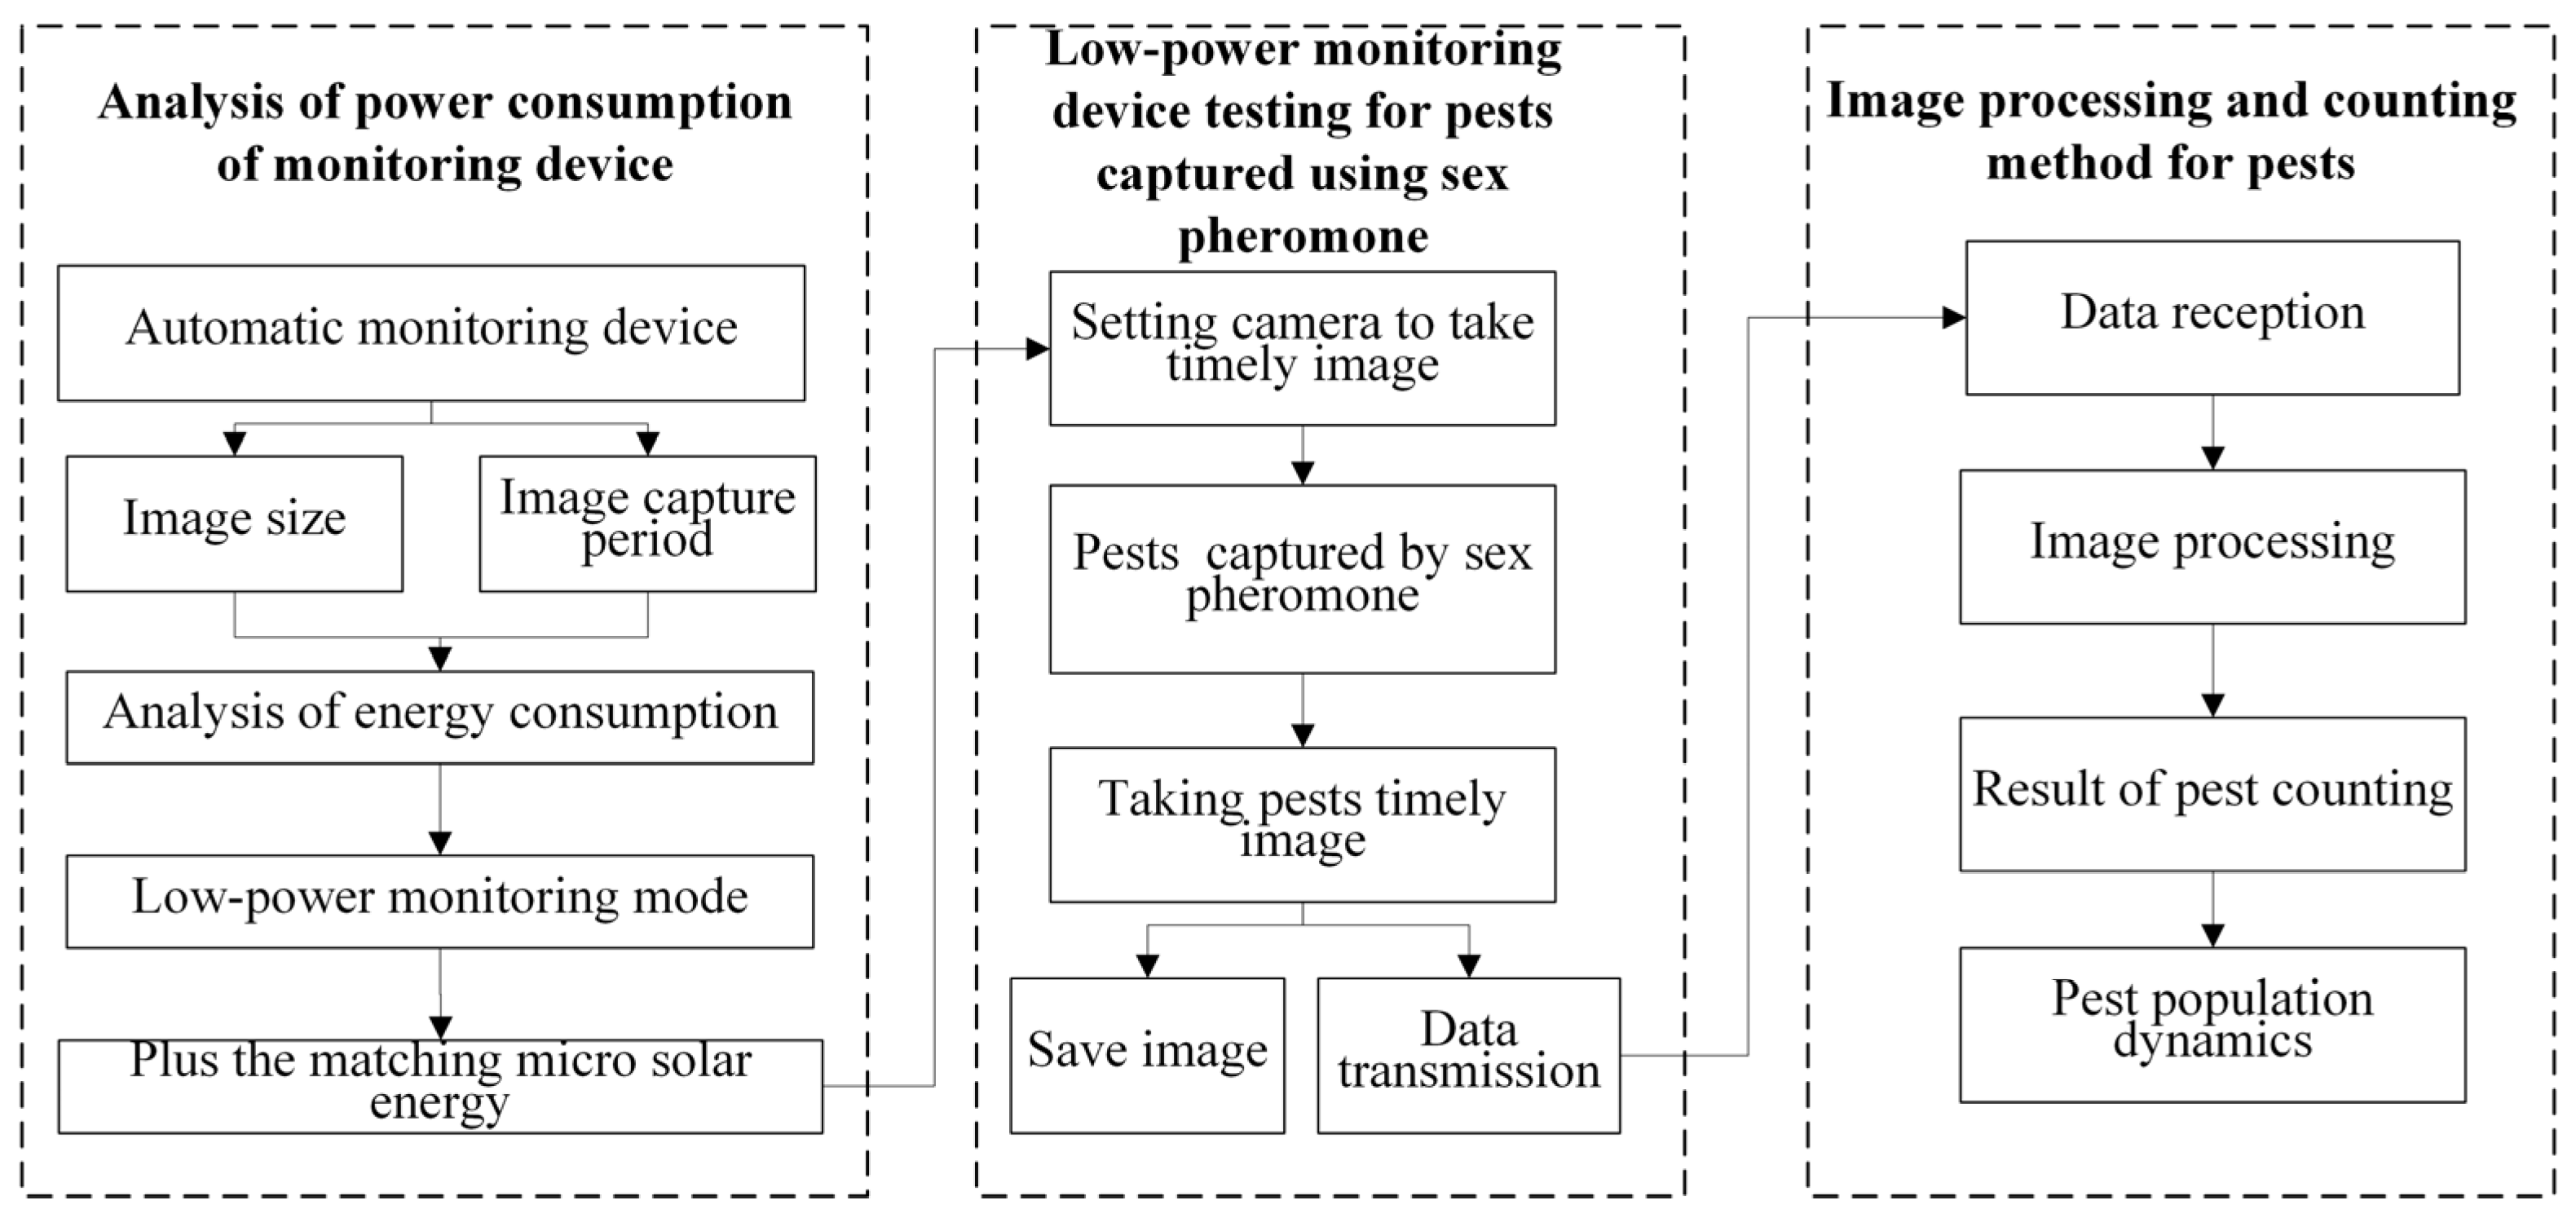
2.2. Architecture of Low-Power Monitoring and Counting System for Pests Captured Using a Sex Pheromone Lure

In order to improve the monitoring efficiency of S. frugiperda, a low-power automatic monitoring system for pests captured using sex pheromone lures was developed. We performed analyses of power consumption, field tests, and image processing of the system (Figure 2). The power consumption of the monitoring device under different image sizes and image capture periods was analyzed, and the low-power operation mode of the automatic monitoring device was determined. Field tests of monitoring devices mainly included pest trapping, periodic photography, and data transmission, and pest images were obtained and transmitted to the server regularly according to the requirements of pest monitoring. An automatic pest monitoring system ran on a server. The pest population was obtained through an image processing program, which provided a reference for the comprehensive management of pests.

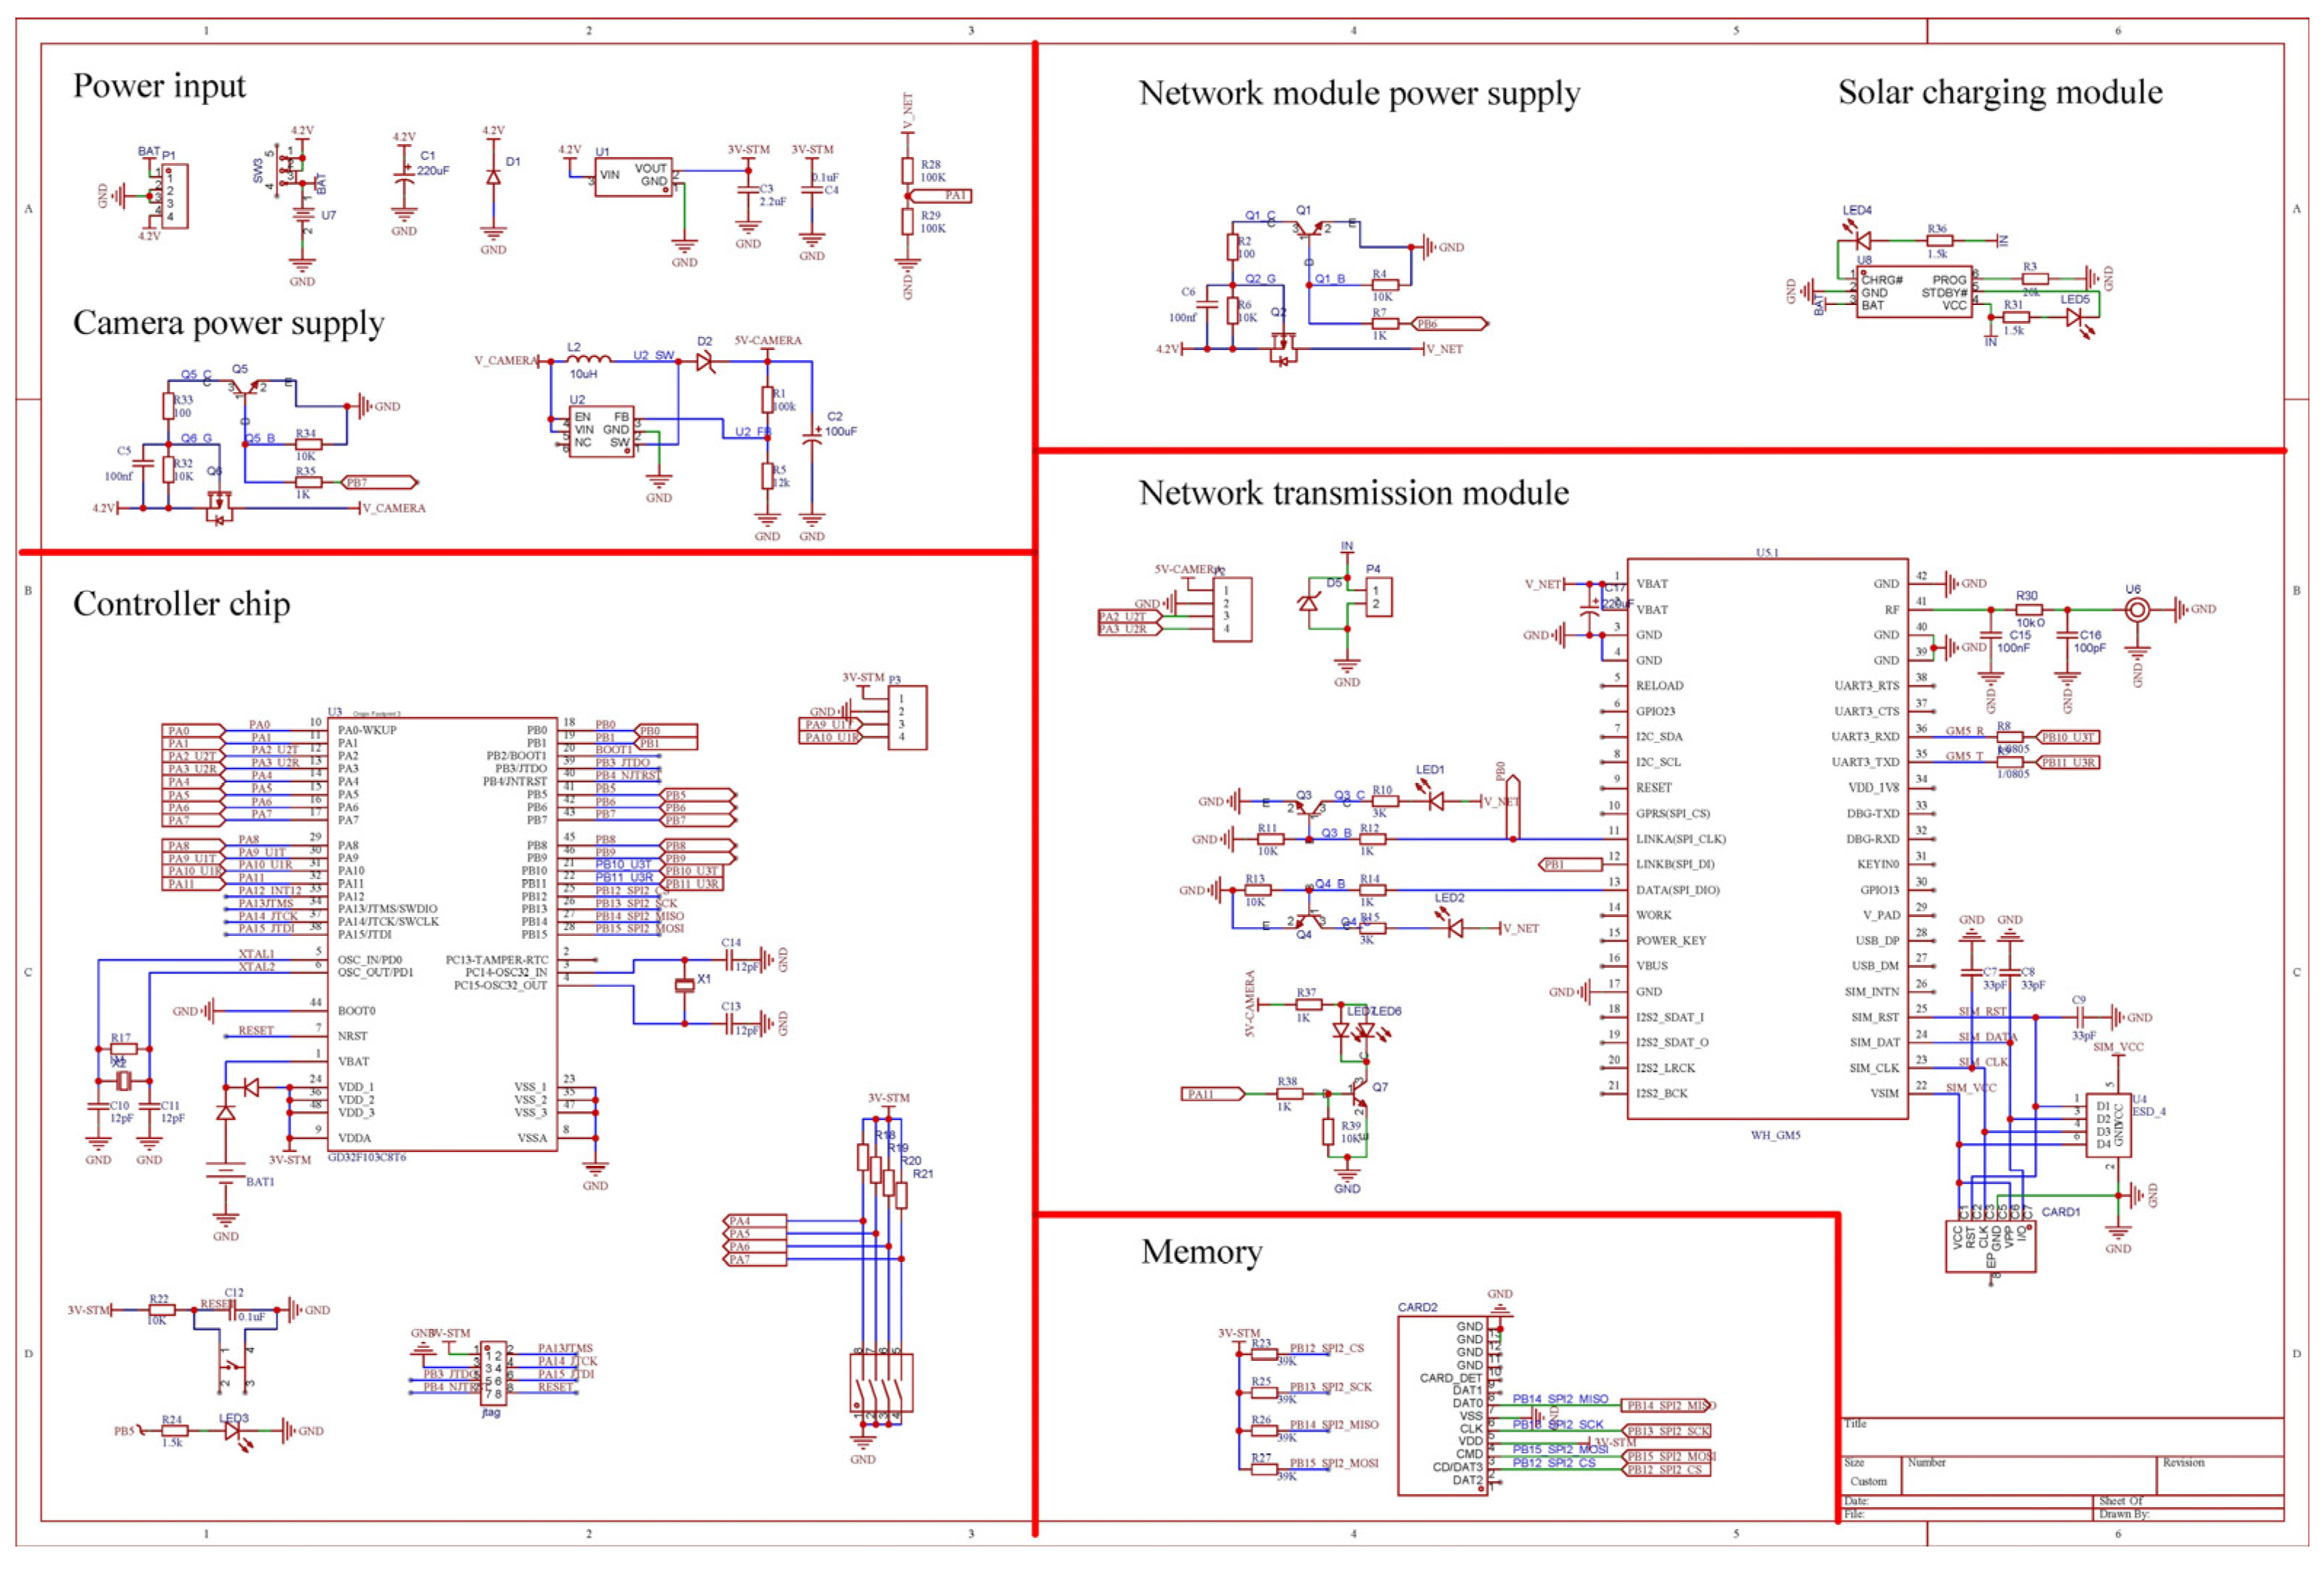
2.3. Software and Hardware Design of Low-Power Automatic Monitoring System for Pests Captured by a Sex Pheromone Lure

The low-power automatic monitoring device included a unitrap, sex pheromone lure, circuit board, camera, light, dial switch, power, and power switch (Figure 3). The unitrap included a small container for sex pheromones, a rain cover, funnel, and bucket for pest collection. The target pests were lured using sex pheromones, and the pests hit the wall of the funnel and fell into the collection bucket. The adjustable resolution PTC20B-200 camera with a 2.1 mm focal length lens (Guangzhou Putai Communication Technology Co., Ltd, Guangzhou) was used for image acquisition, and the lens direction was at a 70° angle with the bottom of the collection bucket; serial universal asynchronous receiver and transmitter (UART) communication was used to adapt the low-end chips, which helped to reduce costs; the image could be transmitted in segments without additional cache capacity. In addition, the camera had a mobile monitoring function. The camera supported four image resolutions: 320 × 240, 640 × 480, 1280 × 960, and 1920 × 1080 pixels, and the image was in JPEG format. A white light-emitting diode, which has the characteristic of low power consumption, was selected as the light source. The image capture period was set by a 4-bit dial switch. The working mode and working period of the monitoring device were configured based on different dial switch situations, and the camera was controlled to take the image in a timely manner. The WH-GM5 module was used for the communication network, which could connect to the 4G network using the UART port for communication, and the image was transferred to a server. STM32F103C8T6 was selected as the main chip (Figure 4), located inside the funnel of the trap. An STM32 chip was a 32-bit MCU with standby mode, and the current was lower than 10 uA. Except for the STM32 chip, all external devices were powered off using p-type metal oxide semiconductor (P-MOS) control. Compared to 16-bit and 8-bit MCU, the STM32 chip had stronger data processing ability, which could shorten image processing and transmission time and reduce power consumption. The PTC20B-200 camera and WH-GM5 communication module were connected to the main chip through the USART I/O ports; two P-MOS tubes were used to control the power supply of the camera and communication module, respectively. When the P-MOS was on, the communication module and camera were powered on for operation; when the P-MOS was in standby mode, the P-MOS tube was closed, and the communication module and camera were powered off. A 3000 mAh battery with 4.2 V was selected to power the monitoring device, and a solar cell with 200 mW, 5 V/40 mA was used to charge the battery. A TP4057ST26P chip was used to charge the battery automatically.

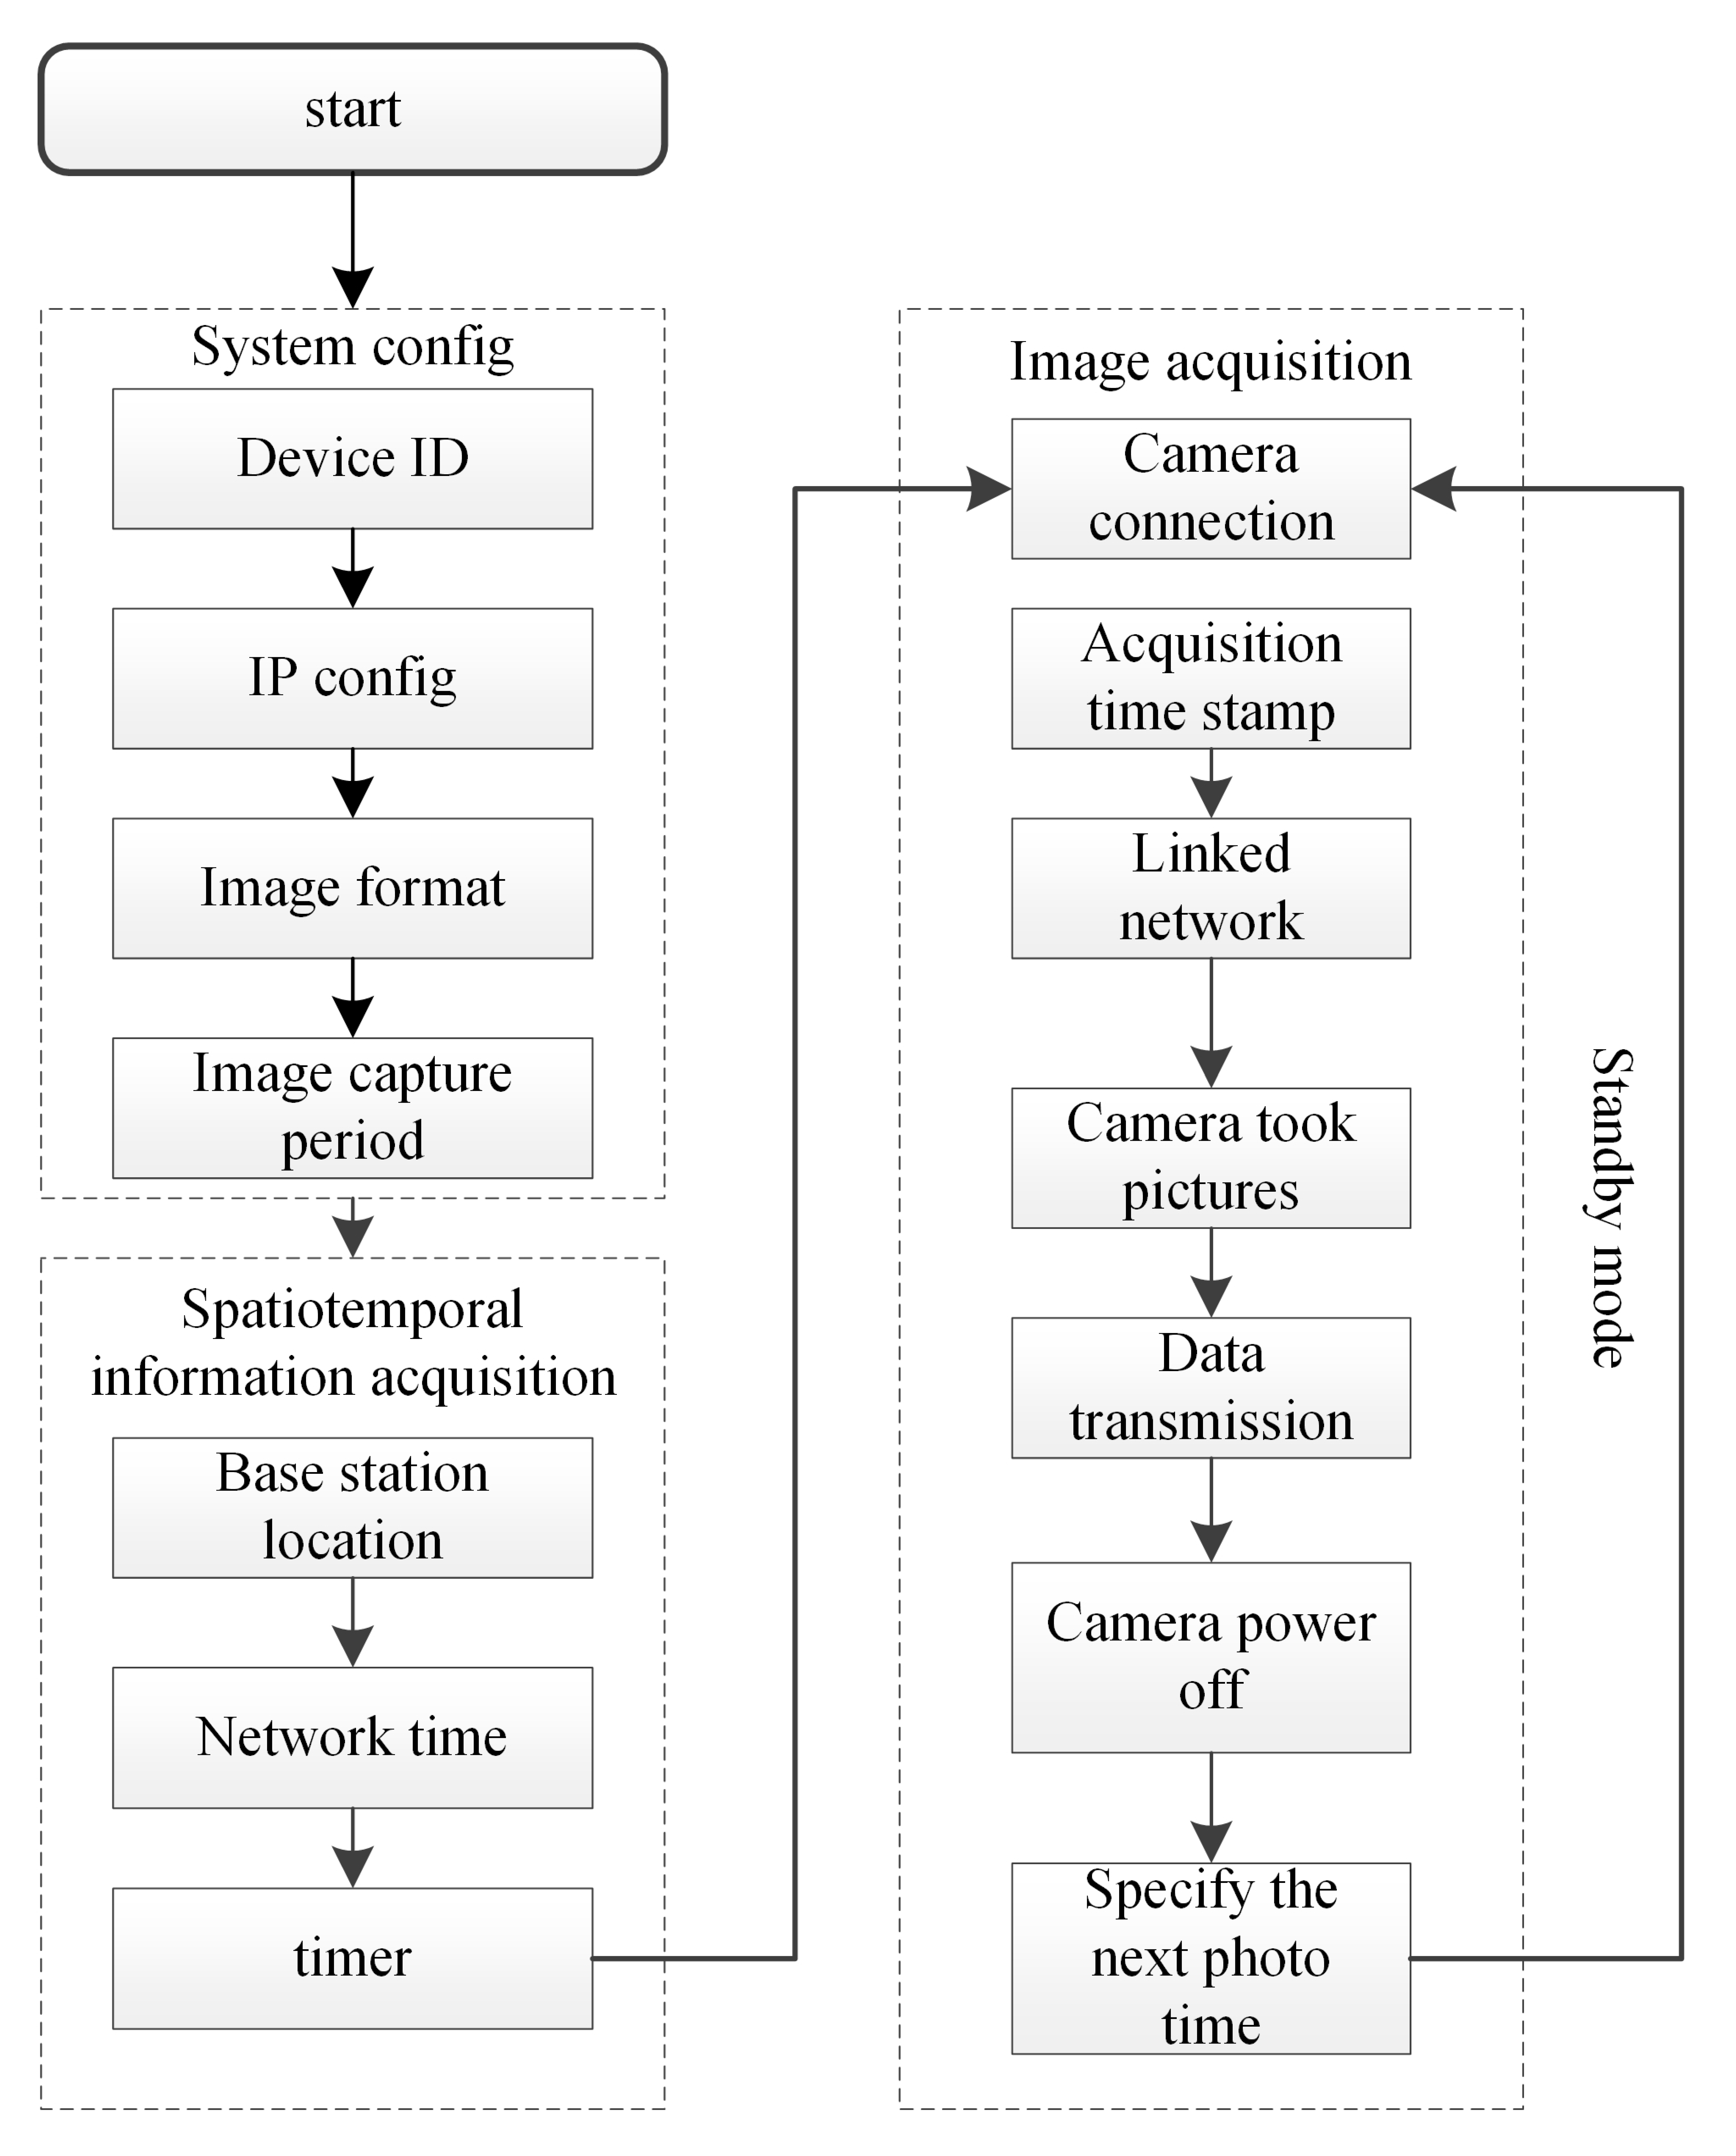
2.4. Working Principle

The working principle of the low-power automatic pest monitoring device included the start, system configuration, spatiotemporal information acquisition, image acquisition, and standby mode (Figure 5). The system configuration part mainly sets the device ID, IP address, image format, and image acquisition period. The spatiotemporal information mainly included the location of the base station, GPS information, and network time. GPS information was obtained through a mobile phone, and the network time was stored in the RTC clock. System configuration and spatiotemporal information acquisition needed to be performed only once. Image acquisition included camera connection, time stamp acquisition, network connection, image acquisition, data transmission, turning off the camera power, and specifying the next specific shooting time. After the monitoring device started to operate, the camera would acquire an image and transmit it to the server, and then the monitoring device would enter standby mode.
The working steps of the low-power automatic pest monitoring device were as follows:
(1)
Device initialization: The device entered working mode from standby mode and checked the time and external ports.
(2)
Waiting to connect the network: WH-GM5 started to connect the network and monitor the network connection port.
(3)
Image acquisition: When the network connection was successful, the camera began to take photos and read the image size.
(4)
Image transmission: The image was sliced by 0.5 KB, and the image data were read and transmitted to the network.
(5)
After the image was read, the device waited for the data buffer to empty and closed the network.
(6)
Specifying the next specific shooting time.
(7)
The device entered standby mode.

2.5. Power Consumption Analysis of Monitoring Device

Power consumption analysis is an important part of monitoring devices. The power consumption of the monitoring device comprised photography, network transmission, and standby, and the power consumption of each part was related to the voltage, current, and time of operation. First, the power consumption was tested according to the resolution, including 320 × 240, 640 × 480, 1280 × 960, and 1920 × 1080 pixels; second, the power consumption was tested according to the image capture period, including 1, 2, 4, 6, 8, 12, and 24 h. The voltage, current, and duration of operation of the monitoring device for photographing, transmitting, and standby were measured using the single-phase digital power meter TH3321 (Changzhou Tonghui Electronics Co., Ltd, Changzhou), and the power consumption of each image was calculated using Equations (1)–(4) [45]:
W I M = U × I 1 × T 1 3600 + U × I 2 × ( T 2 + 3 ) 3600 + U × I 3 × T 3 3600
T 1 = S   ×   0 . 49
T 2 25 + 3
T 3 = P c T 1 T 2
where W I M is the power consumption of an image in mWh units, U is the battery voltage (4.2 V) in V units, I 1 is the equipment current during photography (approximately 560 mA), I 2 is the device current during networking (approximately 110 mA), I 3 is the low-power standby current (approximately 0.02 mA), T 1 is the time taken to send image data in s units (when T 1 is equal to 0.49 s, 1 KB image data transmission is optimal), S is the image size in KB units, T 2 is the time required to connect to the network in s units [the network connection time was approximately 20–30 s (median of 25 s) and fluctuated with the strength of the network signal, taking 3 s for the network to stabilize and clear the data buffer], T 3 is the standby time in s units, and P c   is the image capture period.
The image sizes were measured separately according to the four resolutions. Four sets of monitoring device with different resolution were used outdoors for 4 weeks, the image capture period was 2 h, 336 images were obtained, and the image size was obtained by calculating the average value.
The calculation equation for image acquisition quantity of the monitoring device was:
N I = W W I M
where N I is the number of images available to the monitoring device, W is the total power of the battery in mWh units, the value of W is the battery capacity multiplied by the voltage, and W I M is the power consumption of an image.
The equation for calculating the number of days that the monitoring device could acquire images was:
N D = N I ( 24 / T C )
where N D is the number of days that the monitoring device can obtain images, N I is the number of images available to the monitoring device, and T C is the image capture period.

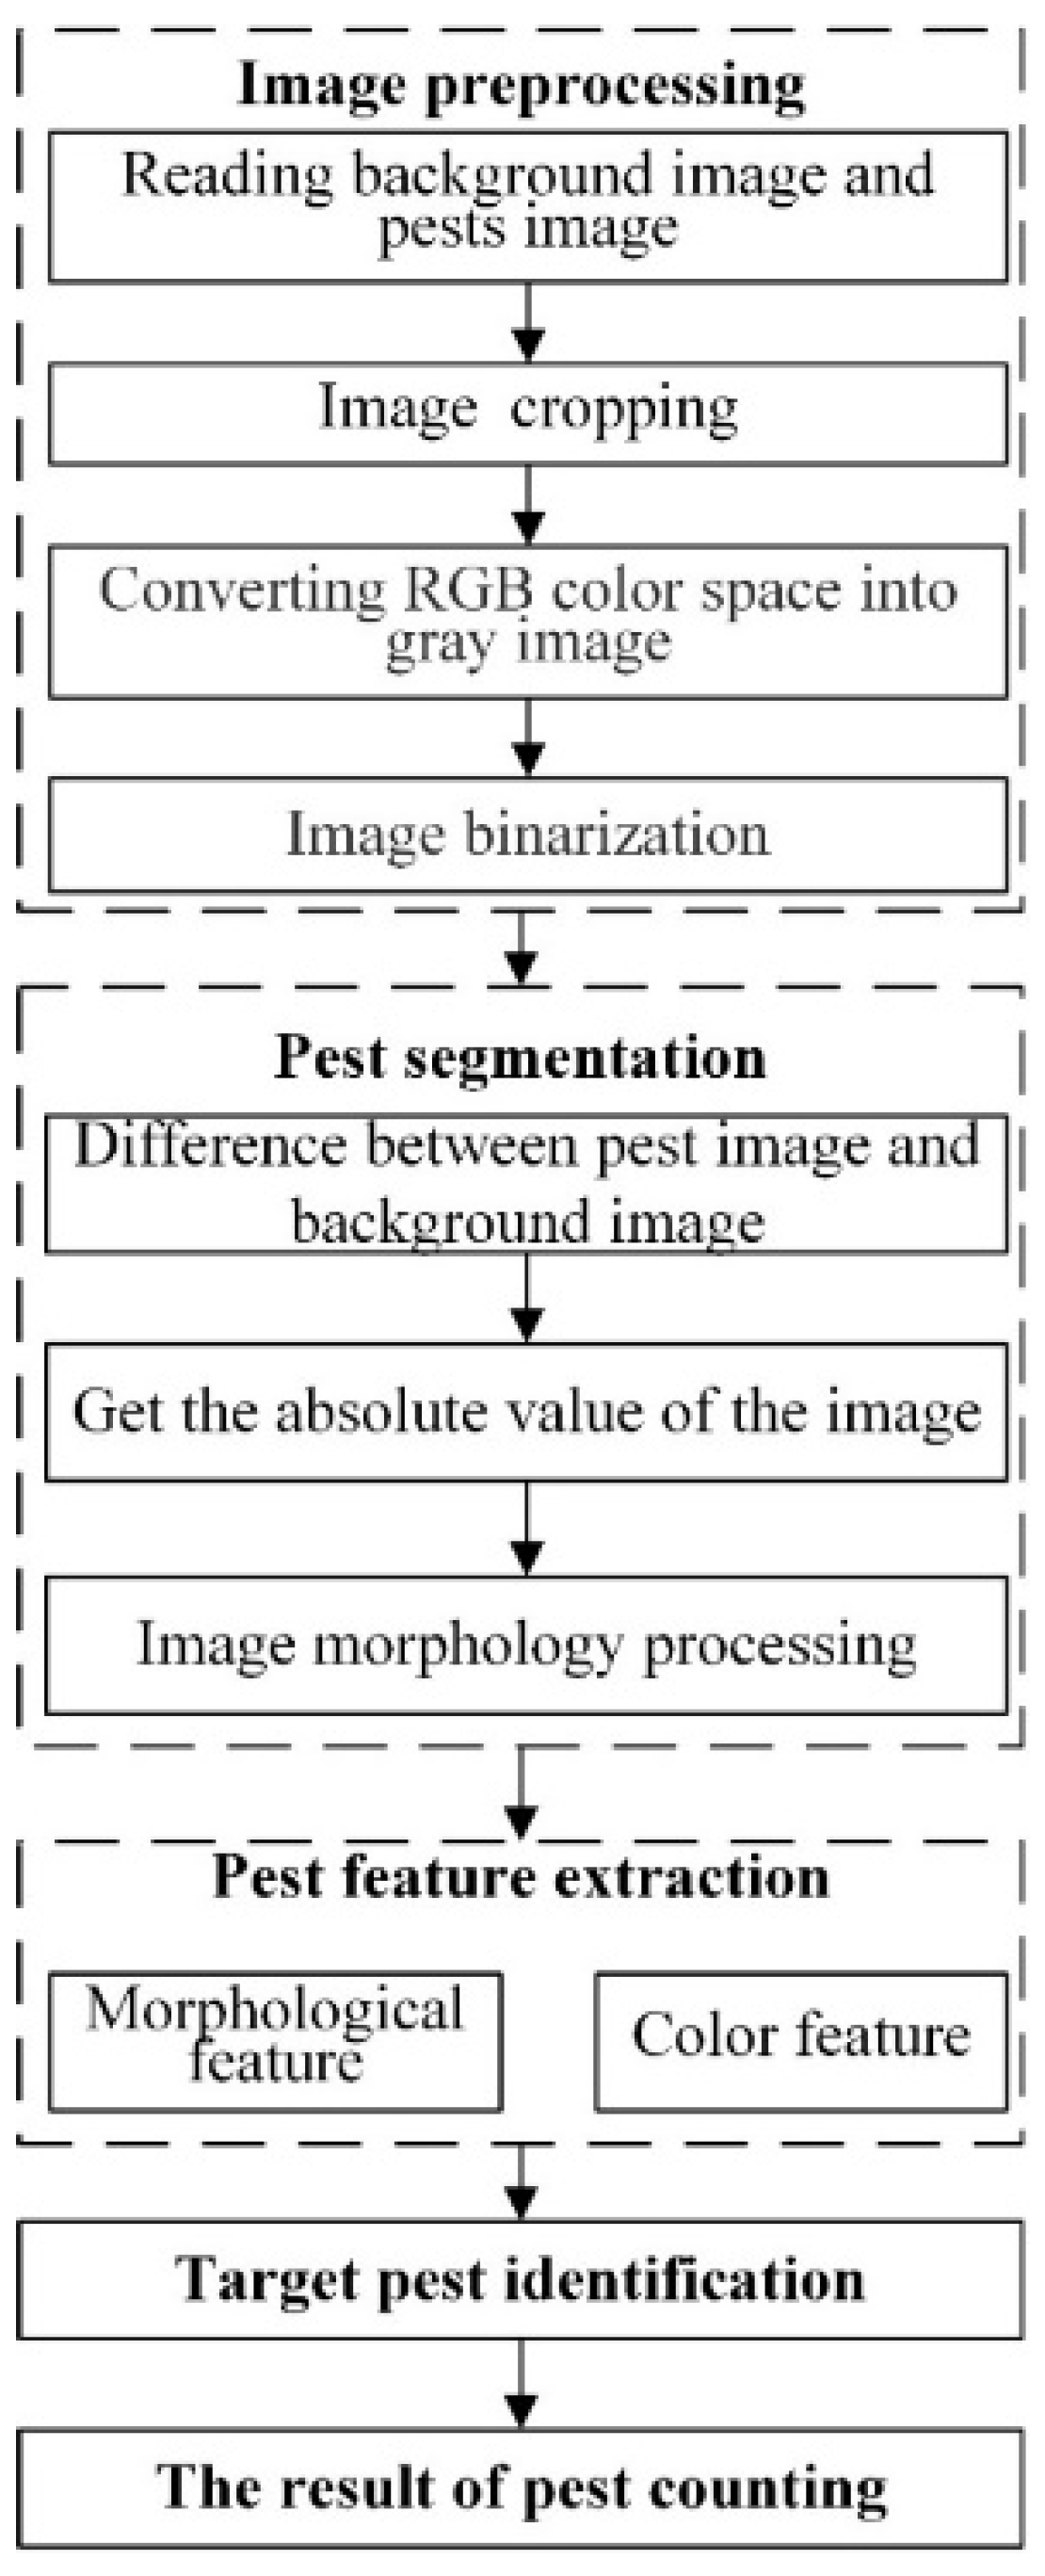
2.6. Image Preprocessing

The images of S. frugiperda were processed using the MATLAB program, including image preprocessing, pest segmentation, pest feature extraction, and target pest identification (Figure 6).

2.6.1. Image Preprocessing

Image preprocessing included image reading, cropping, color space conversion, and image binarization. First, background and S. frugiperda images were read for preprocessing. Second, to save processing time, the original image of 1280 × 960 was cropped to 990 × 890. Third, the RGB image was converted to a grayscale image (Equation (7)). Lastly, Otsu’s method (Equations (8) and (9)) was used to segment grayscale images [46], and the reflection of the background image was cleared by the bwareaopen function (Equation (10)):
g r a y _ i m a g e = r g b 2 g r a y   ( r g b _ i m a g e )
where r g b _ i m a g e is the image for inputting and g r a y _ i m a g e is the result after grayscale image transformation
[ T ,   S M ] = g r a y t h r e s h   ( f )
g = i m 2 b w   ( f , T )
where f is the image for inputting, T is the resulting threshold, normalized to the range [0, 1], S M is the separability measure, and g is the segmentation result of Otsu’s method.
B W 2 = b w a r e a o p e n ( B W ,   P , c o n n )  
where B W is the image to be processed and B W 2 is the result after the bwareaopen operation. C o n n used the default eight adjacent fields. The function deleted the object with an area under P in the binary BW image.

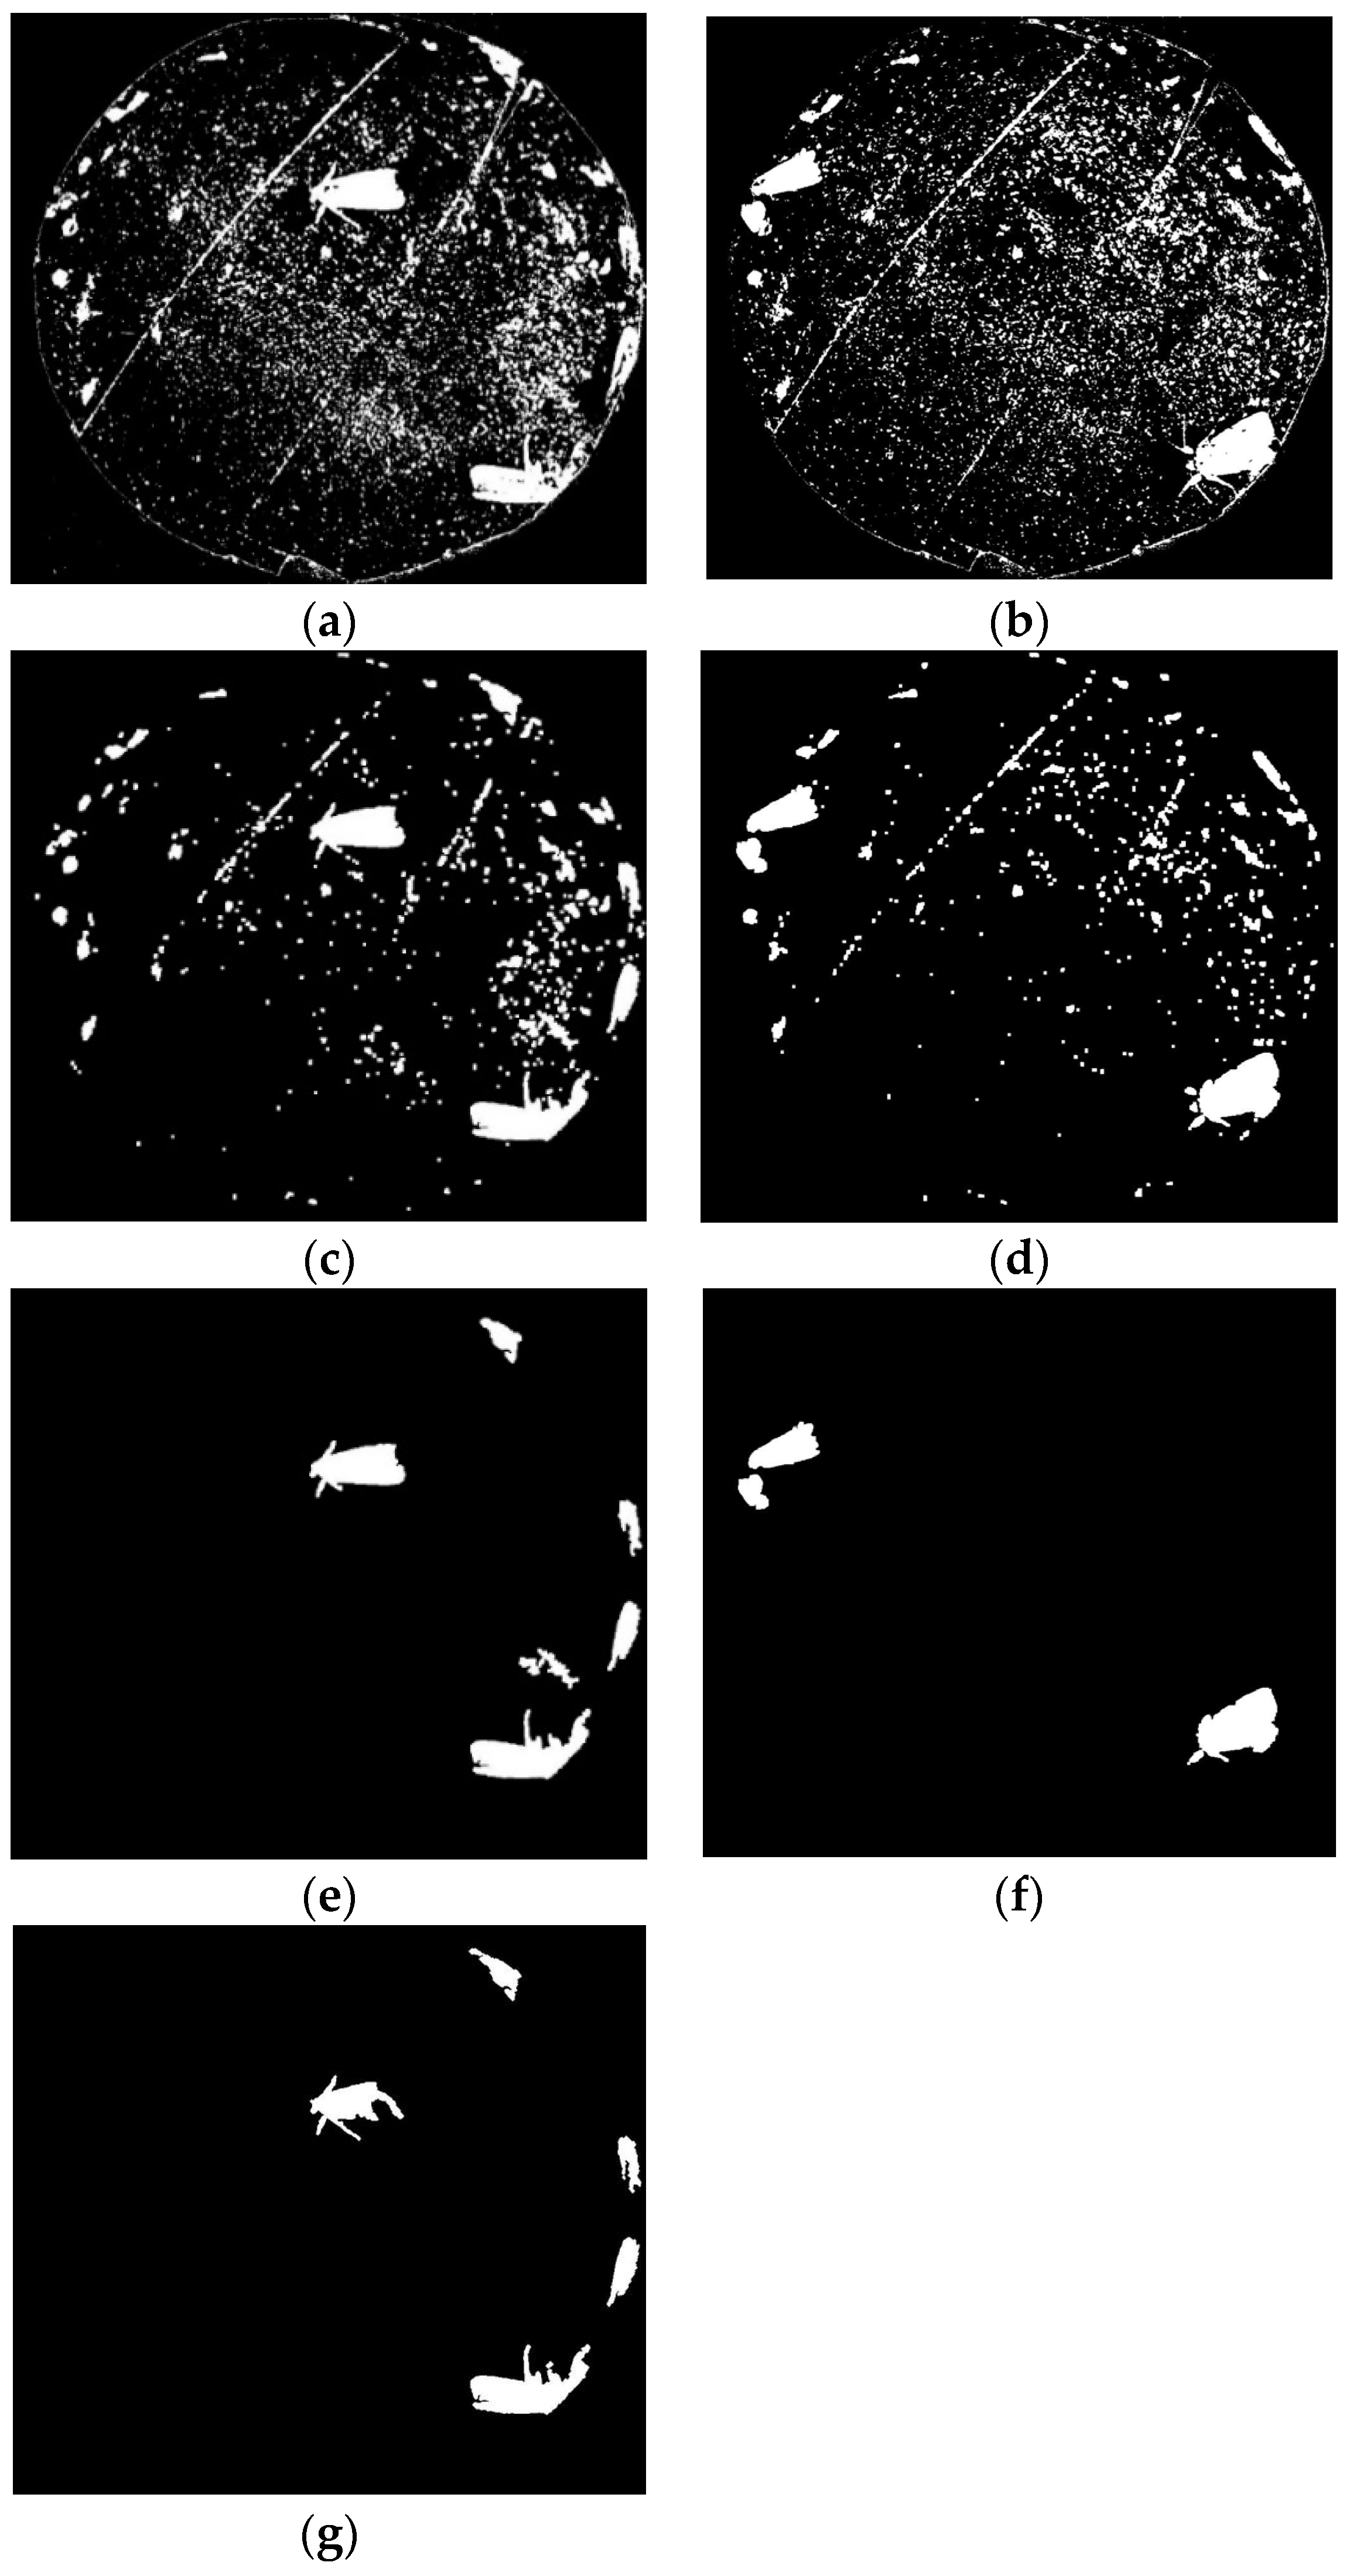
2.6.2. Pest Image Segmentation

Inside the monitoring device, the bottom part of the trap bucket was black. The image difference and morphological processing method were used for pest image segmentation. The image difference method was used to reduce the influence of the black background on pest counting. The Imsubtract function (Equation (11)) was applied to subtract the background image from the pest image, and the absolute value was taken to turn the background black. Then, morphological processing was carried out, including hole filling (Equation (12)), open operation (Equation (13)), and eliminating small-area interference. The shape factor and separation point location method were used to segment touching S. frugiperda images [47], and the image difference function was as follows:
Z = i m s u b t r a c t   ( X , Y )    
where X and Y are two images for inputting.
B W 2 = i m f i l l ( B W , h o l e s )
where B W is a binary image, and holes were provided to fill the hole in the binary image.
I M 2 = i m o p e n ( I M ,   S E )
where I M is the image to be processed, S E refers to the structural elements returned by the Strel function, and I M 2 is the result of the open operation of the image.

2.6.3. Feature Extraction

In this study, the pests captured by the sex pheromone lures were mainly S. frugiperda; however, there were a few light spots with an area close to the S. frugiperda, which would reduce the accuracy of pest counting. To eliminate light spots, the morphology and color feature parameters were extracted according to the difference between light spots and S. frugiperda. The feature parameters included the complexity (Equation (14)) and HSV color component (Equation (15)).
Complexity:
C = P 2 / ( 4 π A )
where C is the complexity, A is the area of the target in square pixel units, and P is the perimeter of the target in pixel units. The complexity represents the compactness of a target.
h s v _ i m a g e = r g b 2 h s v   ( r g b _ i m a g e )
where r g b _ i m a g e is the image for inputting and h s v _ i m a g e is the result after HSV color space transformation.

2.6.4. Target Pest Identification

Thirty samples of S. frugiperda and light spots were used to extract the features of complexity and HSV color component. SPSS software was used to analyze the threshold of complexity and H/V. The threshold of the features was used to eliminate light spots, and the target pests were counted using the connected region marker.
In this study, a hybrid programming method using MATLAB and Visual Studio was used to develop an automatic identification and counting system for pests captured using sex pheromone lures [37]. MATLAB was used to design the image processing algorithm, and the algorithm was compiled to generate a dynamic connection library. Then, the call to the dynamic connection library was made at the Visual Studio Net platform to develop the automatic counting system.

2.7. Field Test and Evaluation Method

After the power consumption analysis of the monitoring device, three sets of low-power pest monitoring devices with solar cells (Figure 2a) were used to monitor S. frugiperda in corn fields in Mengzi City, Yunnan Province, from 16 August to 16 November 2022. An image with 1280 × 960 pixels was taken every 4 h. S. frugiperda were captured by the sex pheromone lures that were changed monthly.
The automatic counting method was used for counting the images, and manual counting was used as the control [48]. The recognition efficiency rate (REFR; Equation (16)) was used to evaluate the results of the recognition.
R E F R = ( 1 - | N m N a | N m )   ×   100 %
where N a is the number of pests automatically counted and N m is the number of pests manually counted.

3. Results

3.1. Power Consumption Analysis

3.1.1. Analysis of Acquisition and Transmission Time of Images with Different Resolutions

There was a correlation between image size and light intensity. Images taken in the field showed that the image size varied during different periods of day and night. A total of 336 images taken every 2 h for 4 weeks with four resolutions were analyzed to obtain the average image sizes; according to Equation (2), the time for image acquisition and transmission of 320 × 240, 640 × 480, 1280 × 960, and 1920 × 1080 pixels was 5.46, 18.48, 83.13, and 121.58 s, respectively. The acquisition and transmission times of images with different resolutions varied greatly, and the time taken by the monitoring device to capture and transmit images was directly proportional to the image size, as shown in Table 1.

3.1.2. Image Acquisition and Transmission Power Consumption Analysis with Different Resolutions and Capture Periods

Image acquisition and transmission power at different resolutions and capture periods were analyzed according to Equation (1). The minimum power consumption of the four image resolutions was 6.68 mWh over a 1 h capture period of 320 × 240 pixels, and the maximum power consumption of the four image resolutions was 78.93 mWh over a 24 h capture period of 1920 × 1080 pixels, as shown in Table 2. Compared to the power consumption of image acquisition and transmission of 320 × 240 pixels, the power consumption of image acquisition and transmission of 640 × 480, 1280 × 960, and 1920 × 1080 pixels was 2.11, 7.53, and 10.73 times more, respectively. The results showed that the power consumption of image acquisition and transmission at different resolutions varied greatly, with the higher the image resolution, the higher the power consumption of image acquisition and transmission; the longer the interval between taking photos, the higher the power consumption of a single image.

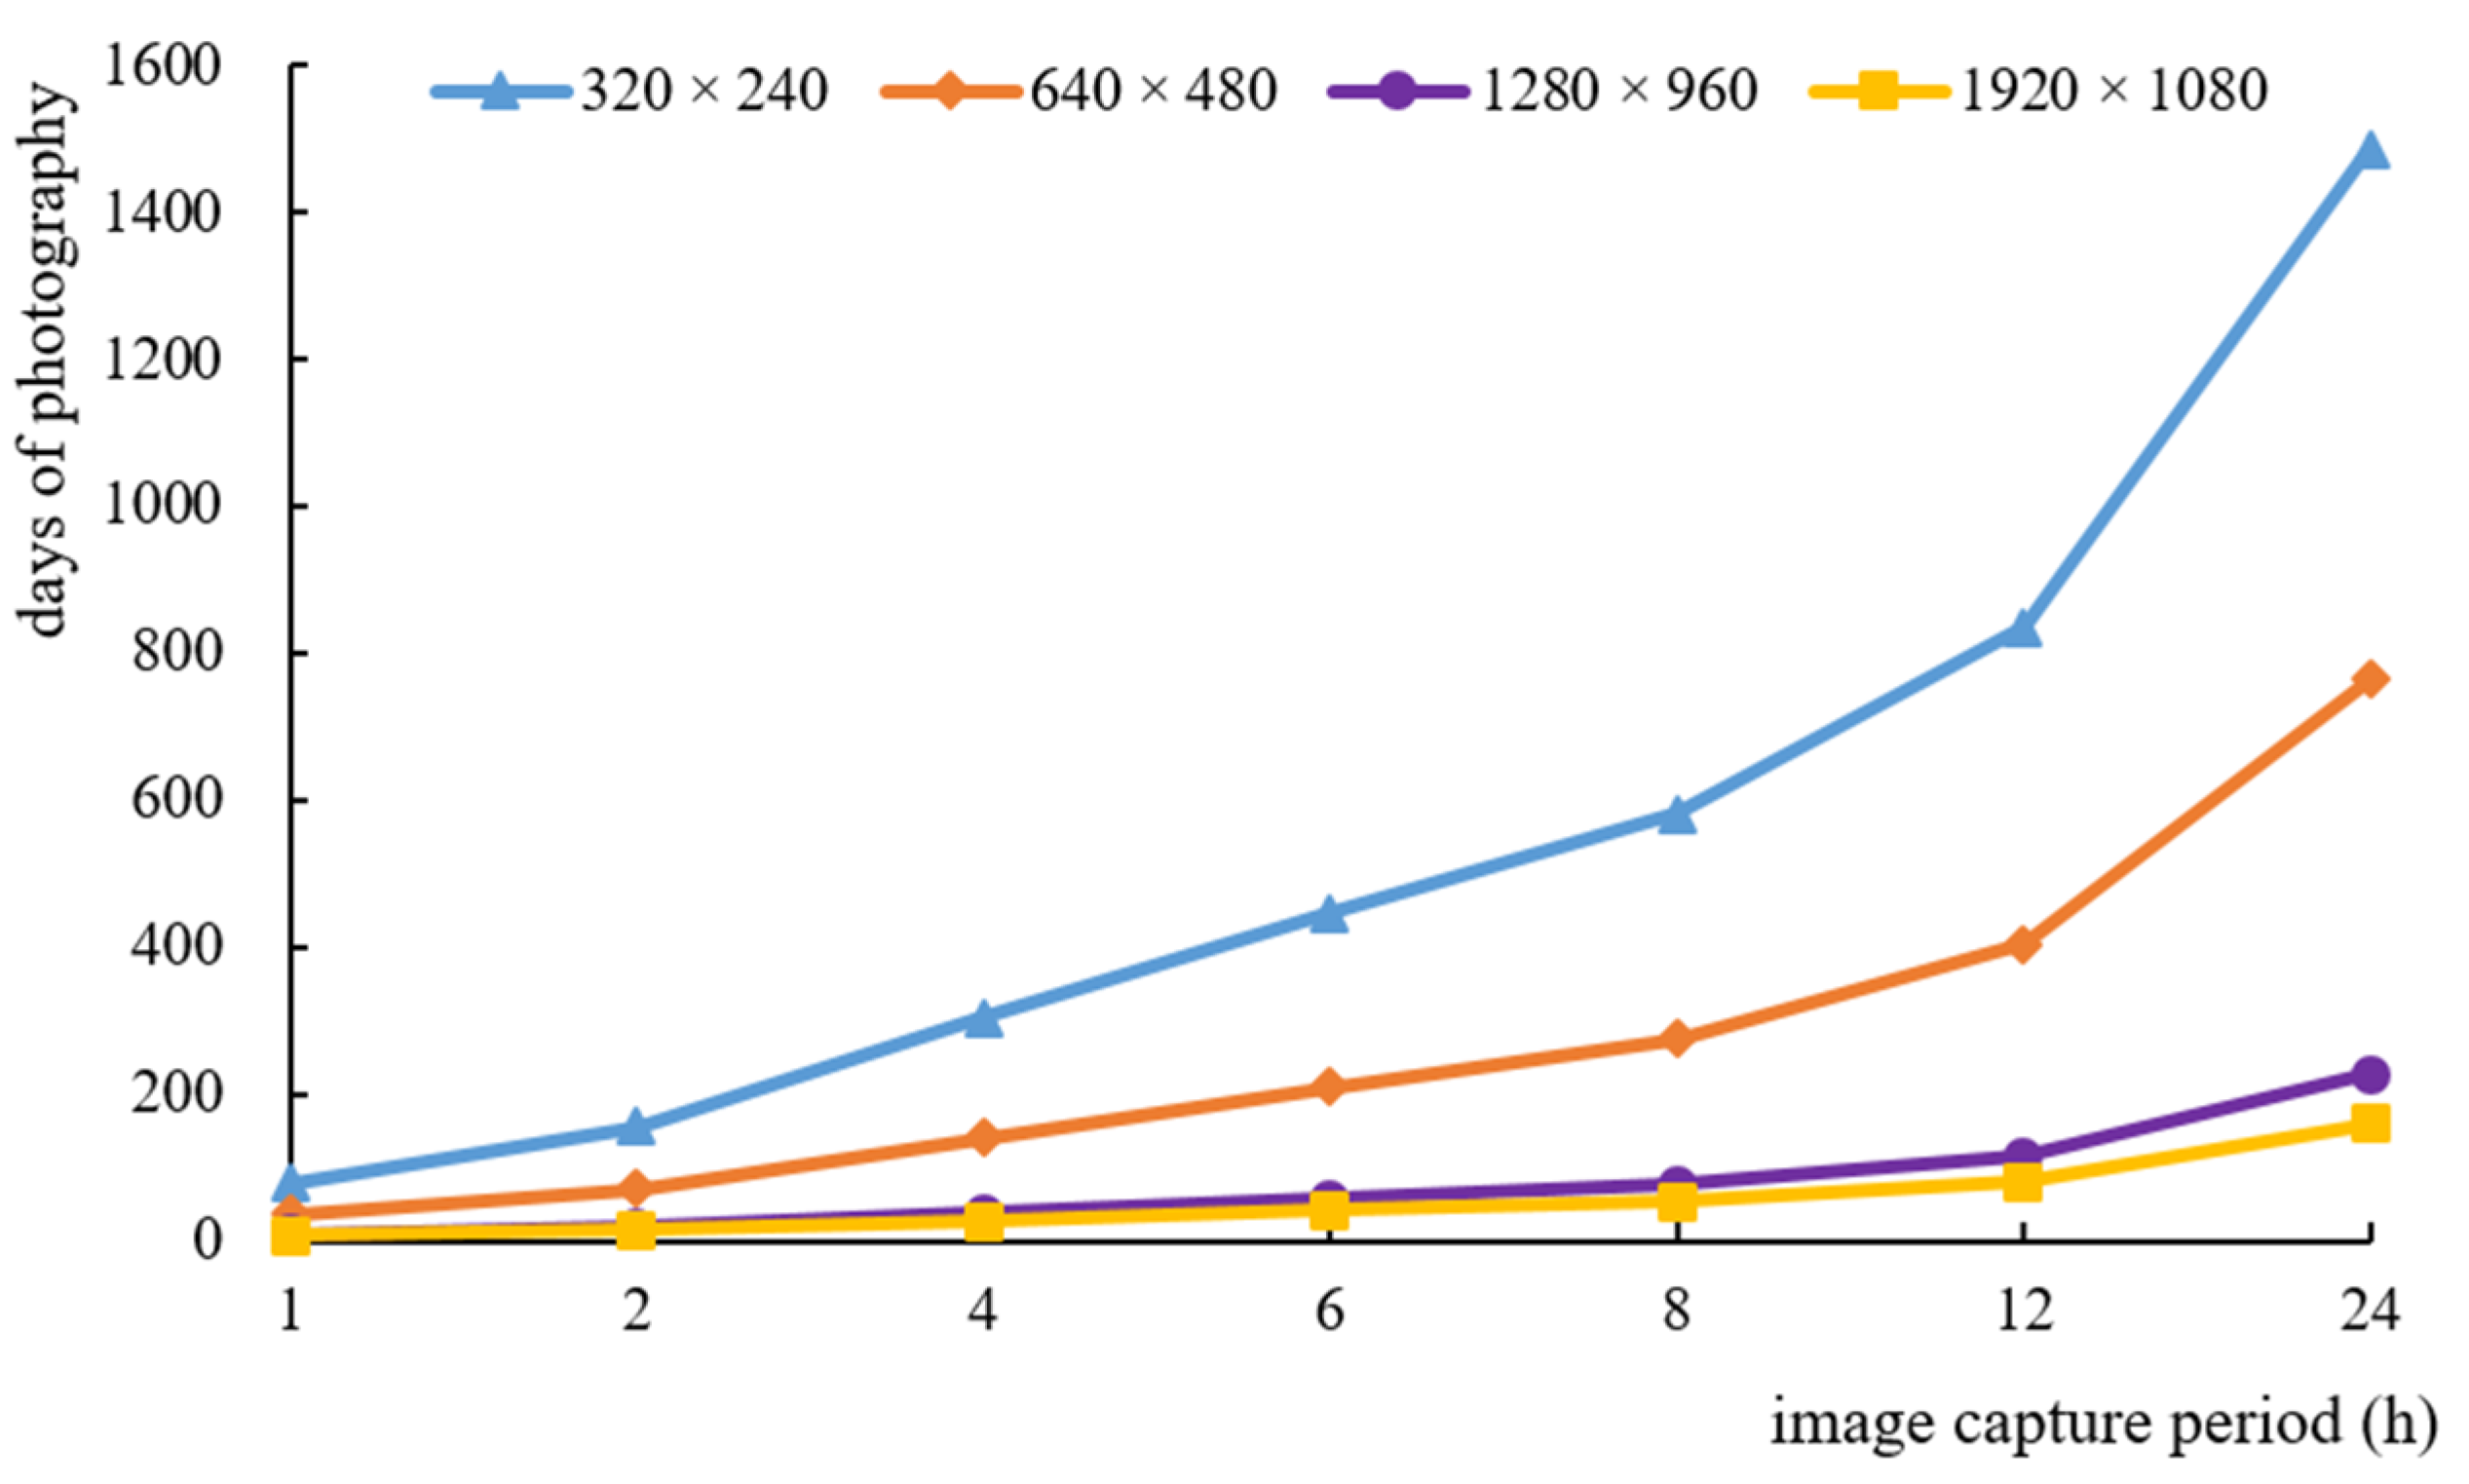
3.1.3. Analysis of Monitoring Duration with Different Image Resolutions

The total power of the 3000 mAh, 4.2 V battery used in this study was 12,600 mWh, and the total power was divided by the power consumption generated by each photo acquisition to obtain the number of images according to Equation (5). For images with 320 × 240 pixels, 1885 images with a 1 h capture period were obtained, which was the maximum image number that could be obtained among the four resolutions and seven capture periods. For images with 1920 × 1080 pixels, 160 images with a 24 h capture period were obtained, which was the minimum image number that could be obtained among the four resolutions and seven capture periods, as shown in Table 3. Compared to the number of 1920 × 1080-pixel images, the numbers of 320 × 240, 640 × 480, and 1280 × 960-pixel images were 10.79, 5.10, and 1.43 times more efficient, respectively. The results showed that the number of images with different resolutions and capture periods was significantly different: the lower the image resolution, the more images that could be obtained, and the shorter the photo interval, the more images that could be captured.
The monitoring duration was obtained by dividing the total number of images by the number of images taken per day according to Equation (6), and the results are shown in Figure 7. For images with 320 × 240 pixels, the minimum monitoring duration was up to 79 days with a 1 h capture period; the maximum monitoring duration was up to 1486 days with a 24 h capture period, which was the maximum monitoring duration that could be obtained among the four resolutions and seven capture periods. For images with 1920 × 1080 pixels, the minimum monitoring duration was up to 7 days with a 1 h capture period, and the maximum monitoring duration was up to 160 days with a 24 h capture period. Compared to the maximum monitoring duration of 1920 × 1080 pixels, the maximum monitoring durations of 320 × 240, 640 × 480, and 1280 × 960 pixels were 9.29, 4.77, and 1.41 times longer, respectively. The results showed that the image-capturing days of the monitoring device with four resolutions differed greatly, and the number of days was inversely proportional to the image resolution and capture frequency.
The power consumption of the developed monitoring device for acquiring a 320 × 240 image per hour was about 6.68 mWh. Compared to the reference of [34], the power consumption of a same-size image was less than 1 mWh. The power consumption of the monitoring trap was lower than the developed monitoring device. However, the power consumption in standby mode was not considered; a wireless communication module was used to transmit images, and it should be constructed near a farmer’s house with a wireless network. Compared to the reference of [41], the power consumption of a same-size image was about 90 mWh, and the power consumption of a plug-in imaging system was high. In this study, power consumption, image resolution, and remote transmission were considered for the monitoring device, and a solar cell with 200 mW, 5 V/40 mA was selected to charge the battery based on a power analysis; high-resolution images were obtained to realize the remote and large-scale monitoring of S. frugiperda.

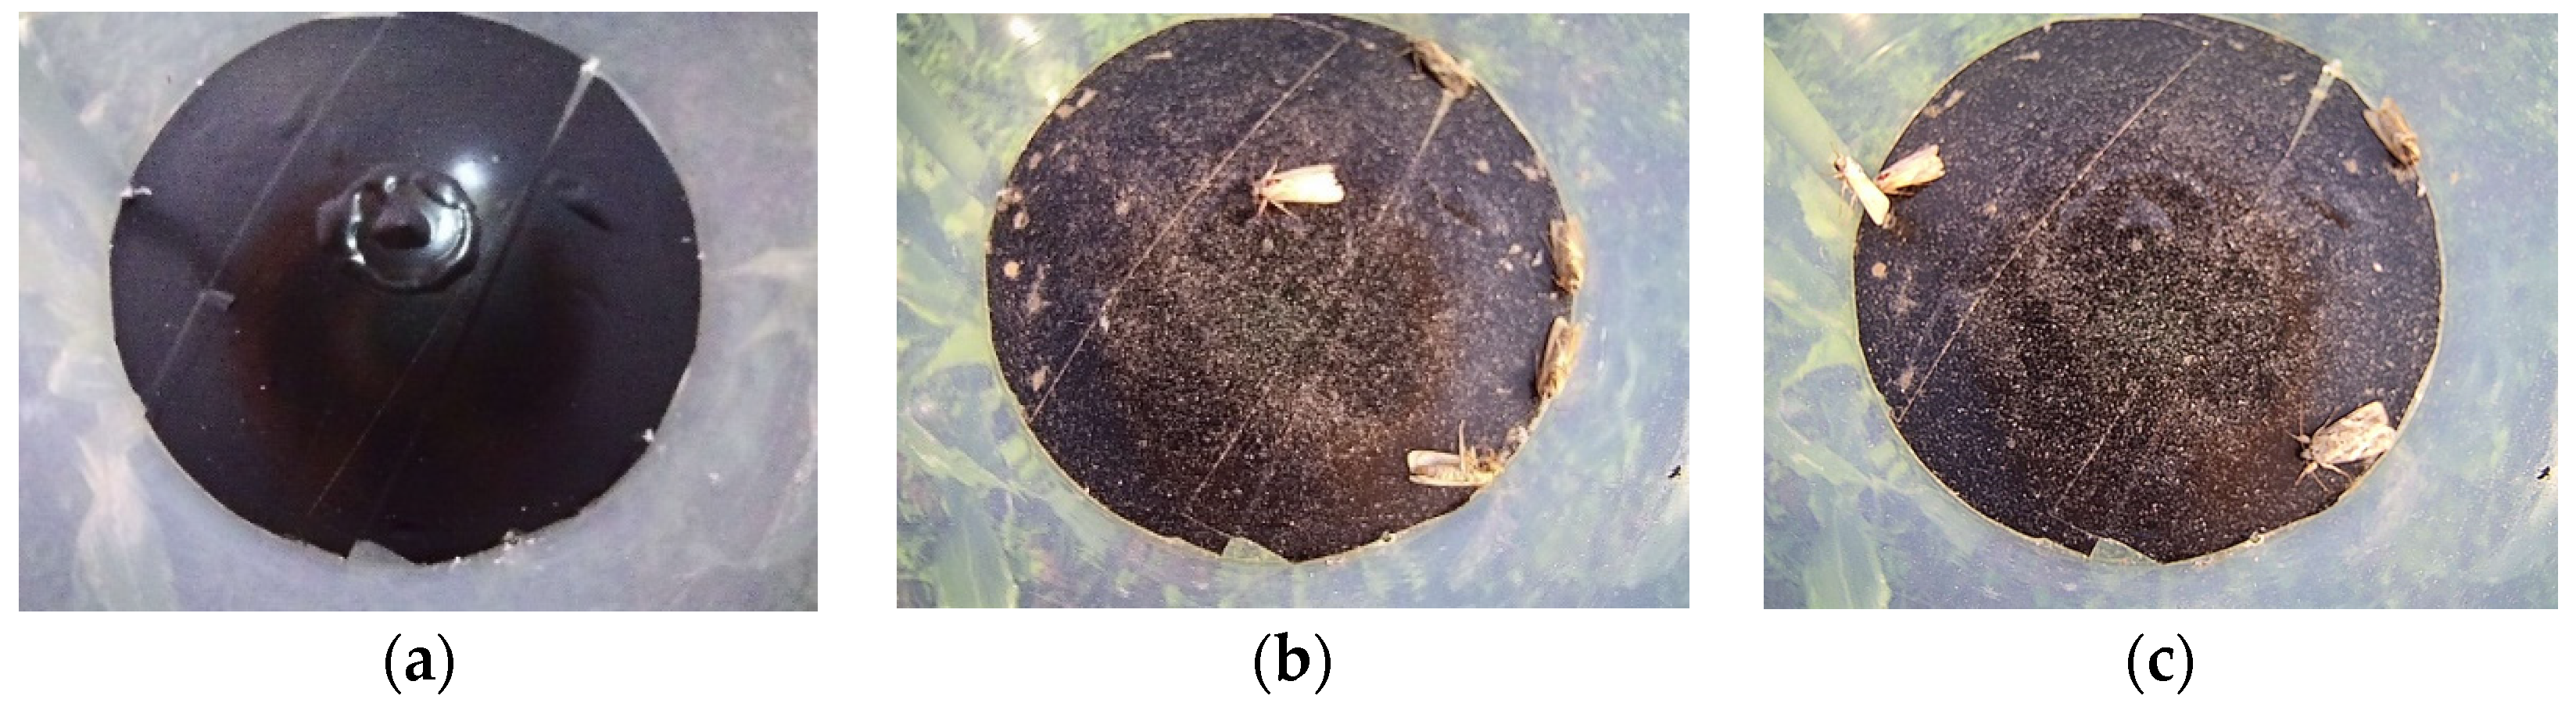
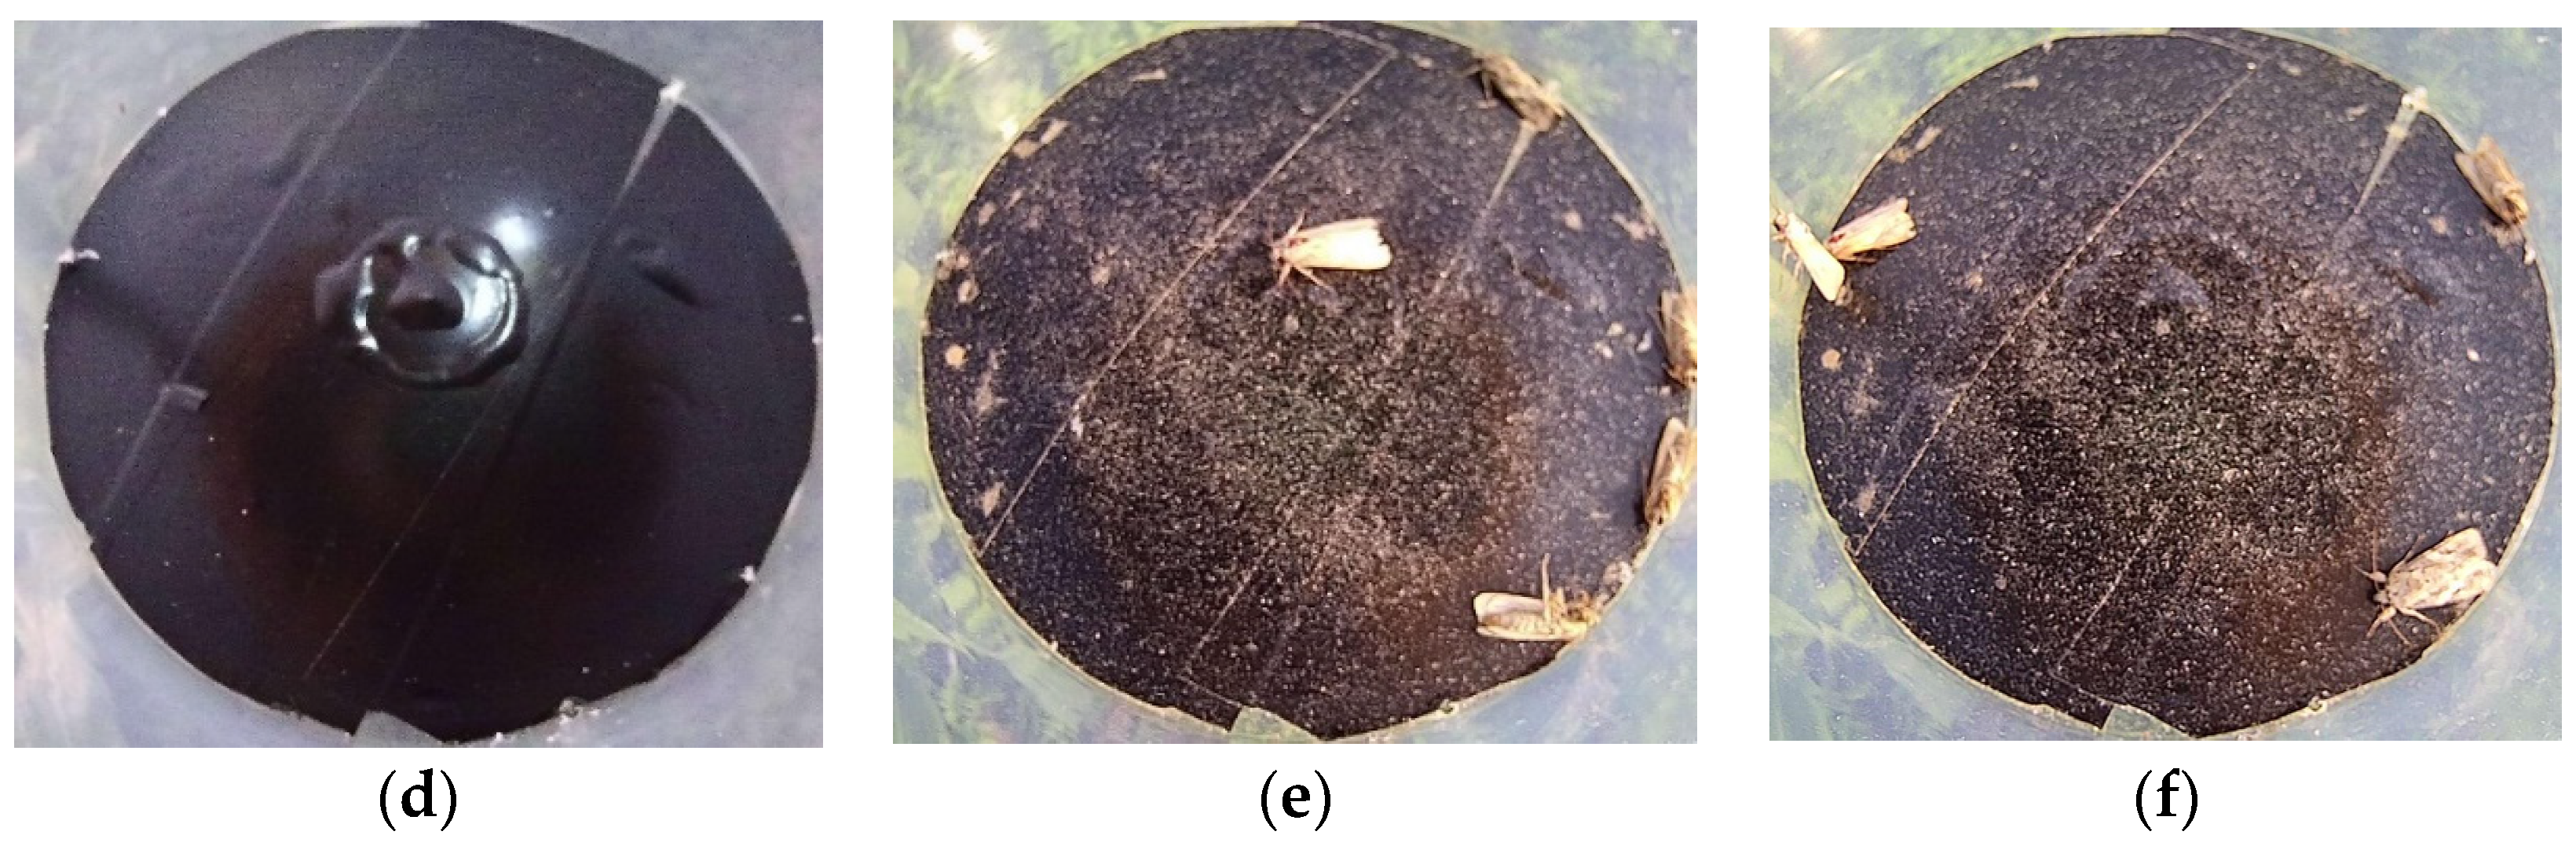
3.2. Image Processing

3.2.1. Image Preprocessing

The resolution of the original background and S. frugiperda images was 1280 × 960 (Figure 8a–c) and the bottom of the trap basin was taken as the research object. The original image was cropped to 990 × 890 (Figure 8d–f), and the cropped RGB image was converted to a grayscale image (Figure 9a–c). The difference between the insect and background was obvious in the grayscale image, and the binarization image was obtained using Otsu’s method (Figure 9d–f). There were several light spots in the background binarization image, and the bwareaopen function was used to delete the light spots.

3.2.2. Image Segmentation

The S. frugiperda binarization and background images were subtracted to obtain a difference image; the background of the difference image was black, and the pests were white, as shown in Figure 10a,b. The target pests were segmented by eliminating the non-target object by an open operation and the bwareaopen function, as shown in Figure 10c–f.

3.2.3. Feature Extraction and Target Pest Identification

The threshold of complexity and H/V were obtained using SPSS software, and the threshold ranges of complexity and H/V were [1.35, 8.36] and [0.06, 0.22], respectively, as shown in Table 4. The non-target reflective material was eliminated, and S. frugiperda was counted by applying a threshold of complexity and H/V, as shown in Figure 10g. Thirty images were selected for image processing, and the accuracy of counting S. frugiperda was 94.10% and the coefficient of determination R2 was 0.9799 (Figure 11). The counting accuracy of S. frugiperda was high, which could provide an important reference for the timely prevention and control of S. frugiperda. The low-power monitoring device was suitable for trapping and counting pests lured by sex pheromones.
The inaccurate pest counting was mainly affected by the background interference, the light spot of the collection bucket, and the adhesion of the pests. The pest collection bucket was originally a transparent bucket, which made it difficult to segment pests. In this study, the bottom of the bucket was turned black to enhance the contrast between the pests and the background, and the segmentation of the pests was well improved. However, when some pests were located at the edge of the collection bucket, as shown in Figure 8c, the segmentation of the pests was confused by the mixing of black and white backgrounds, and some part of the pest area was missing, which led to inaccurate pest counting. The image segmentation was affected by the light spots, and sometimes light spots occurred, as shown in Figure 8a,b. When the features of the light spots were different from those of the pests, the light spots could be removed (Figure 10g), otherwise it would affect the accuracy of the pest counting. In addition, when the adhesion pest was not accurately segmented, the accuracy of pest counting was also decreased. In the future, a more robust image segmentation algorithm could be developed to improve the accuracy of pest identification and counting.
Furthermore, the quality of the pest image had impacts on pest identification and counting. The light source with different intensities and the material of the trap barrel both had impacts on the quality of the pest images. The power consumption should be considered when selecting the light source intensity. The selection of trapping bucket materials should not only consider the quality of image acquisition but also fully consider the pests trapping efficiency based on their biological characteristics. In the future, it will be necessary to further study the impact factors of image quality.
The developed monitoring device had the characteristics of low cost, low power consumption, small size, and easy installation, and it could be used to monitor S. frugiperda and other pests captured using sex pheromone lures in large-scale fields. Pests could be automatically counted based on an image processing system, and the efficiency of pest monitoring was improved. Moreover, the image transmission strategy and system structure were optimized to form a low-power consumption and low-cost pest monitoring device.

4. Discussion

Acquisition of dynamic pest quantities is an important prerequisite for integrated pest management. The traditional unitrap is widely used in field pest monitoring, which requires manual counting and cannot meet the production demand of modern agriculture. Currently, automatic monitoring devices use sex pheromone lures and high-voltage power grids to trap and kill S. frugiperda. The images of S. frugiperda were obtained based on machine vision, and the monitoring devices were large in size and had high power consumption [42,43]. Twelve-volt (7 Ah) batteries were commonly used in pest monitoring devices [36,38], and the large battery size led to the large volume of the monitoring device. Monitoring devices with high power consumption, large volume, and high cost are easily restricted when widely used. In this study, a low-power automatic monitoring device was developed that is suitable for monitoring S. frugiperda in large-scale areas.
According to the characteristics of the unitrap, low-power chip, camera, and small-size batteries were selected for integration on the inside of the funnel of the unitrap. It was helpful to reduce the cost of pest monitoring by installing automatic monitoring parts directly on the original unitraps. Based on the power consumption test of the monitoring device, a small size solar cell was installed outside the unitrap to charge the monitoring device. Schrader et al. [41] proposed a low-cost image sensor for an autonomous pest monitoring system, with a power consumption of 90 mWh for an image with 320 × 240 pixels. The main power consumption of the monitoring device in this study is similar to that of López et al. [34], which is mainly consumed in the process of image acquisition and transmission. A C328-7640 color camera was selected to monitor the large weevil Rhynchophorus ferrugineus (Olivier) [49]. The power consumption for an image with 320 × 240 pixels was less than 1 mWh. However, the power consumption in standby mode was not considered, and the wireless LAN should be used to transmit images. As S. frugiperda is a medium-sized pest, a higher resolution camera is required, and a PTC20B-200 camera was selected. The battery with 3000 mAh was sufficiently small to be integrated directly inside the unitrap, and the monitoring device was small and convenient for field installation and application.
Low-power monitoring devices are suitable for trapping and counting pests lured by sex pheromones. The monitoring system had the following five advantages: (1) Different image resolutions could be set according to the size of pests to achieve economic pest monitoring; (2) the setting of the image capture period was flexible, and the image capture period could be selected according to the actual monitoring requirements; (3) the power consumption of the monitoring device was low, and it could be used to monitor pests automatically for a long time in the field; (4) the micro- and low-power automatic monitoring device was portable and easy to install in the field; (5) the accuracy of automatic insect identification was high, and the monitoring results could provide an important reference for pest control. Our low-power pest monitoring device solved the problems of large volume, high power consumption, and high cost of previous automatic monitoring devices, and the monitoring level and work efficiency of counting pests were improved.
Segmentation methods and the quality of images had an impact on the accuracy of pest counting. Background interference, the light spot of the collection bucket, and the adhesion of pests were the main impact factors for pest segmentation. The light source with different intensities, the material, and the size of the trap barrel all had an impact on the quality of the pest images. The bottom area of the insect collection bucket was small, and when the number of captured pests was large and stacked, this was not conducive to automatic counting. In the future, a more robust image segmentation algorithm could be developed to improve the count accuracy of pests; a low-power light source would be selected to obtain high-quality images; and a larger bottom pest collection bucket would be connected to the monitoring device.

5. Conclusions

In this study, a micro- and low-power automatic monitoring system based on machine vision was developed, the pests were captured using sex pheromones, and the images were taken and sent to the server in a timely manner. The power consumption at different resolutions and image acquisition periods was analyzed to determine the monitoring duration of the device. The images of S. frugiperda obtained by the monitoring device were analyzed and processed using the MATLAB program, and the counting accuracy of S. frugiperda was obtained. Three results were as follows.
(1)
The time taken by the monitoring device to capture and transmit images was directly proportional to the image size. The average power consumption of 320 × 240, 640 × 480, 1280 × 960, and 1920 × 1080-pixel images with seven capture periods was 7.24 mWh, 15.27 mWh, 54.50 mWh, and 77.69 mWh, respectively. The higher the image resolution, the higher the power consumption of image acquisition and transmission; the longer the interval between photos, the higher the power consumption of a single image.
(2)
The image numbers with four resolutions and seven capture periods were significantly different; the lower the image resolution, the more images were obtained, and the shorter the photo interval, the more images could be taken. The monitoring device could capture 1280 × 960 and 1920 × 1080-pixel images for a minimum of 10 and 7 days, respectively, with a 1 h capture period, and it could capture 1280 × 960 and 1920 × 1080-pixel images for a maximum of 226 and 160 days, respectively, with a 24 h capture period. The number of image capture days was inversely proportional to the image resolution and capture frequency. Long-term acquisition of high-resolution images can be achieved by installing micro-solar panels in the field.
(3)
The images of S. frugiperda were processed using image preprocessing, segmentation, feature extraction, and target pest identification. The feature parameters of complexity and H/V were used to identify S. frugiperda; the accuracy of automatic counting of S. frugiperda was 94.10%, and the coefficient of determination R2 was 0.9799.

Author Contributions

Conceptualization, M.C., L.C. and R.Z.; methodology, M.C., R.Z. and T.Y.; software, M.C., T.Y. and L.X.; formal analysis, T.Y., L.X., C.Q., G.X., W.W., C.D., Q.T. and M.W.; resources, L.C. and R.Z.; data curation, T.Y. and L.X.; writing—original draft preparation, M.C.; writing—review and editing, M.C.; validation, M.C., L.C., T.Y., R.Z., G.X., W.W., C.D., Q.T. and M.W.; project administration, R.Z. and L.C.; funding acquisition, M.C. and R.Z. All authors have read and agreed to the published version of the manuscript.

Funding

The authors are grateful to the National Natural Science Foundation of China (31971581), the Promotion and Innovation of Beijing Academy of Agriculture and Forestry Sciences (KJCX20230205), the Promotion and Innovation of Beijing Academy of Agriculture and Forestry Sciences (KJCX20230432), and research and application of the key technology research Project of Nanjing Enterprise Academist Workstation, the intelligent prevention system of forestry pine wilt disease.

Institutional Review Board Statement

Not applicable.

Data Availability Statement

Not applicable.

Acknowledgments

We would like to thank all contributors in this special issue and all reviewers who provided very constructive and helpful comments to improve the manuscripts.

Conflicts of Interest

The authors declare no conflict of interest. The funders had no role in the design of the study; in the collection, analyses, or interpretation of data; in the writing of the manuscript, or in the decision to publish the results.

References

  1. Zhou, Y.; Wu, Q.L.; Zhang, H.W.; Wu, K.M. Spread of invasive migratory pest Spodoptera frugiperda and management practices throughout China. J. Integr. Agric. 2021, 20, 637–645. [Google Scholar] [CrossRef]
  2. Matova, P.M.; Kamutando, C.N.; Magorokosho, C.; Kutywayo, D.; Gutsa, F.; Labuschagne, M. Fall-armyworm invasion, control practices and resistance breeding in Sub-Saharan Africa. Crop. Sci. 2020, 60, 2951–2970. [Google Scholar] [CrossRef] [PubMed]
  3. Murúa, G.; Virla, E. Population parameters of Spodoptera frugiperda (Smith) (Lep.: Noctuidae) fed on corn and two predominant grasess in Tucuman (Argentina). Acta Zool. Mex. 2004, 20, 199–210. [Google Scholar] [CrossRef]
  4. Goergen, G.; Kumar, P.L.; Sankung, S.B.; Togola, A.; Tamo, M. First Report of Outbreaks of the Fall Armyworm Spodoptera frugiperda (J E Smith) (Lepidoptera, Noctuidae), a New Alien Invasive Pest in West and Central Africa. PLoS ONE 2016, 11, e0165632. [Google Scholar] [CrossRef] [PubMed] [Green Version]
  5. Stokstad, E. FOOD SECURITY New crop pest takes Africa at lightning speed. Science 2017, 356, 473–474. [Google Scholar] [CrossRef]
  6. Prasanna, B.M.; Huesing, J.E.; Eddy, R.; Peschke, V.M. Fall Armyworm in Africa: A Guide for Integrated Pest Management; Cimmyt: CDMX, Mexico, 2018; pp. 1–28. [Google Scholar]
  7. Sharanabasappa; Kalleshwaraswamy, C.M.; Asokan, R.; Swamy, H.M.; Maruthi, M.S.; Pavithra, H.B.; Hegde, K.; Navi, S.; Prabhu, S.T.; Goergen, G. First report of the Fall armyworm, Spodoptera frugiperda (J E Smith) (Lepidoptera: Noctuidae), an alien invasive pest on maize in India. Pest Manag. Hortic. Ecosyst. 2018, 24, 23–29. [Google Scholar]
  8. Sun, X.X.; Hu, C.X.; Jia, H.R.; Wu, Q.L.; Shen, X.J.; Zhao, S.Y.; Jiang, Y.Y.; Wu, K.M. Case study on the first immigration of fall armyworm, Spodoptera frugiperda invading into China. J. Integr. Agric. 2021, 20, 664–672. [Google Scholar] [CrossRef]
  9. Yang, X.M.; Song, Y.F.; Sun, X.X.; Shen, X.J.; Wu, Q.L.; Zhang, H.W.; Zhang, D.D.; Zhao, S.Y.; Liang, G.M.; Wu, K.M. Population occurrence of the fall armyworm, Spodoptera frugiperda (Lepidoptera: Noctuidae), in the winter season of China. J. Integr. Agric. 2021, 20, 772–782. [Google Scholar] [CrossRef]
  10. Montezano, D.G.; Specht, A.; Sosa-Gómez, D.R.; Roque-Specht, V.F.; Sousa-Silva, J.C.; Paula-Moraes, S.V.; Peterson, J.A.; Hunt, T.E. Host Plants of Spodoptera frugiperda (Lepidoptera: Noctuidae) in the Americas. Afr. Entomol. 2018, 26, 286–300. [Google Scholar] [CrossRef] [Green Version]
  11. Overton, K.; Maino, J.L.; Day, R.; Umina, P.A.; Bett, B.; Carnovale, D.; Ekesi, S.; Meagher, R.; Reynolds, O.L. Global crop impacts, yield losses and action thresholds for fall armyworm (Spodoptera frugiperda): A review. Crop Prot. 2021, 145, 105641. [Google Scholar] [CrossRef]
  12. Tepa-Yotto, G.T.; Meagher, R.L.; Winsou, J.K.; Dahoueto, B.T.A.; Tamò, M.; Sæthre, M.-G.; Nagoshi, R.N. Monitoring Spodoptera frugiperda in Benin: Assessing the influence of trap type, pheromone blends, and habitat on pheromone trapping. Fla. Entomol. 2022, 105, 71–78. [Google Scholar] [CrossRef]
  13. Chen, M.X.; Yang, X.T.; Shi, B.C.; Li, W.Y.; Du, X.W.; Li, M.; Sun, C.H. Research progress and prospect of technologies for automatic identifying and counting of pests. J. Environ. Entomol. 2015, 37, 176–183. [Google Scholar]
  14. Meagher, R.L.; Agboka, K.; Tounou, A.K.; Koffi, D.; Agbevohia, K.A.; Amouze, T.R.; Adjevi, K.M.; Nagoshi, R.N. Comparison of pheromone trap design and lures for Spodoptera frugiperda in Togo and genetic characterization of moths caught. Entomol. Exp. Appl. 2019, 167, 507–516. [Google Scholar] [CrossRef]
  15. Zeng, J.; Du, Y.J.; Jiang, Y.Y.; Liu, W.C. Development and application of sex pheromone in population monitoring of crop insect pests in China. Plant Prot. 2015, 41, 9–15. [Google Scholar]
  16. Rizvi, S.A.H.; George, J.; Reddy, G.V.P.; Zeng, X.; Guerrero, A. Latest developments in insect sex pheromone research and its application in agricultural pest management. Insects 2021, 12, 484. [Google Scholar] [CrossRef]
  17. Muthukumar, M.; Kennedy, J.S. A review of the scientific literature on the use of reproductive pheromones in the management of Spodoptera frugiperda (Lepidoptera: Noctuidae). J. Entomol. Sci. 2021, 56, 475–486. [Google Scholar] [CrossRef]
  18. Eliopoulos, P.A.; Potamitis, I.; Kontodimas, D.C. Estimation of population density of stored grain pests via bioacoustic detection. Crop Prot. 2016, 85, 71–78. [Google Scholar] [CrossRef]
  19. Jiang, J.A.; Lin, T.S.; Yang, E.C.; Tseng, C.L.; Chen, C.P.; Yen, C.W.; Zheng, X.Y.; Liu, C.Y.; Liu, R.H.; Chen, Y.F.; et al. Application of a web-based remote agro-ecological monitoring system for observing spatial distribution and dynamics of Bactrocera dorsalis in fruit orchards. Precis Agric. 2013, 14, 323–342. [Google Scholar] [CrossRef]
  20. Han, R.Z.; He, Y. Remote automatic identification system of field pests based on computer vision. Trans. Chin. Soc. Agric. Eng. 2013, 29, 156–162. [Google Scholar]
  21. Ebrahimi, M.A.; Khoshtaghaz, M.H.; Minaei, S.; Jamshidi, B. Vision-based pest detection based on SVM classification method. Comput. Electron. Agric. 2017, 137, 52–58. [Google Scholar] [CrossRef]
  22. Suto, J. Codling moth monitoring with camera-equipped automated traps: A review. Agriculture 2022, 12, 1721. [Google Scholar] [CrossRef]
  23. Lima, M.C.F.; Leandro, M.E.D.D.; Valero, C.; Coronel, L.C.P.; Bazzo, C.O.G. Automatic detection and monitoring of insect pests—A review. Agriculture 2020, 10, 161. [Google Scholar] [CrossRef]
  24. Xue, D.X.; Zhang, R.R.; Chen, L.P.; Chen, L.P.; Chen, M.X.; Xu, G. Faster R-CNN based image recognition research of Hyphantria cunea. J. Environ. Entomol. 2020, 42, 1502–1509. [Google Scholar]
  25. Yao, Q.; Xian, D.; Liu, Q.; Yang, B.; Diao, G. Automated counting of rice planthoppers in paddy fields based on image processing. J. Integr. Agric. 2014, 13, 1736–1745. [Google Scholar] [CrossRef]
  26. Wen, C.; Guyer, D. Image-based orchard insect automated identification and classification method. Comput. Electron. Agric. 2012, 89, 110–115. [Google Scholar] [CrossRef]
  27. Li, W.Y.; Li, M.; Chen, M.X.; Qian, J.P.; Sun, C.H.; Du, S.F. Feature extraction and classification method of multi-pose pests using machine vision. Trans. Chin. Soc. Agric. Eng. 2014, 30, 154–162. [Google Scholar]
  28. Chen, J.; Fan, Y.Y.; Wang, T.; Zhang, C.; Qiu, Z.J.; He, Y. Automatic segmentation and counting of aphid nymphs on leaves using convolutional neural networks. Agronomy 2018, 8, 129. [Google Scholar] [CrossRef] [Green Version]
  29. Boniecki, P.; Koszela, K.; Piekarska-Boniecka, H.; Weres, J.; Zaborowicz, M.; Kujawa, S.; Majewski, A.; Raba, B. Neural identification of selected apple pests. Comput. Electron. Agric. 2015, 110, 9–16. [Google Scholar] [CrossRef]
  30. Wang, F.Y.; Wang, R.J.; Xie, C.J.; Yang, P.; Liu, L. Fusing multi-scale context-aware information representation for automatic in-field pest detection and recognition. Comput. Electron. Agric. 2020, 169, 10552. [Google Scholar] [CrossRef]
  31. Guarnieri, A.; Maini, S.; Molari, G.; Rondelli, V. Automatic trap for moth detection in integrated pest management. Bull. Insectology 2011, 64, 247–251. [Google Scholar]
  32. Fukatsu, T.; Watanabe, T.; Hu, H.; Yoichi, H.; Hirafuji, M. Field monitoring support system for the occurrence of Leptocorisa chinensis Dallas (Hemiptera: Alydidae) using synthetic attractants, Field Servers, and image analysis. Comput. Electron. Agric. 2012, 80, 8–16. [Google Scholar] [CrossRef]
  33. Ding, W.; Taylor, G. Automatic moth detection from trap images for pest management. Comput. Electron. Agric. 2016, 123, 17–28. [Google Scholar] [CrossRef] [Green Version]
  34. López, O.; Rach, M.M.; Migallon, H.; Malumbres, M.P.; Bonastre, A.; Serrano, J.J. Monitoring pest insect traps by means of low-power image sensor technologies. Sensors 2012, 12, 15801–15819. [Google Scholar] [CrossRef] [PubMed]
  35. Zhao, Z.; Rong, E.; Li, S.; Zhang, L.; Zhang, Z.; Guo, Y.; Ma, R. Potential application of digital image-processing method and fitted logistic model to the control of oriental fruit moths (Grapholita molesta Busck). Bull. Entomol. Res. 2016, 106, 457–463. [Google Scholar] [CrossRef]
  36. Doitsidis, L.; Fouskitakis, G.N.; Varikou, K.N.; Rigakis, I.I.; Chatzichristofis, S.A.; Papafilippaki, A.K.; Birouraki, A.E. Remote monitoring of the Bactrocera oleae (Gmelin) (Diptera: Tephritidae) population using an automated McPhail trap. Comput. Electron. Agric. 2017, 137, 69–78. [Google Scholar] [CrossRef]
  37. Chen, M.X.; Guo, J.Y.; Xu, J.P.; Zhao, L.; Li, W.Y.; Zhang, R.K.; Bi, L.L.; Wen, D.M.; Li, M. Research of automatic monitoring device and counting system for Grapholita molesta (Busck). J. Environ. Entomol. 2018, 40, 1164–1174. [Google Scholar]
  38. Ünlü, L.; Akdemir, B.; Ögür, E.; Şahin, İ. Remote monitoring of european grapevine moth, Lobesia botrana (Lepidoptera: Tortricidae) population using camera-based pheromone traps in vineyards. Turk. J. Agric.-Food Sci. Technol. 2019, 7, 652–657. [Google Scholar] [CrossRef] [Green Version]
  39. Hong, S.J.; Nam, I.; Kim, S.Y.; Kim, E.; Lee, C.H.; Ahn, S.; Park, I.K.; Kim, G. Automatic pest counting from pheromone trap images using deep learning object detectors for Matsucoccus thunbergianae Monitoring. Insects 2021, 12, 342. [Google Scholar] [CrossRef]
  40. Preti, M.; Favaro, R.; Knight, A.L.; Angeli, S. Remote monitoring of Cydia pomonella adults among an assemblage of nontargets in sex pheromone-kairomone-baited smart traps. Pest Manag. Sci. 2021, 77, 4084–4090. [Google Scholar] [CrossRef]
  41. Schrader, M.J.; Smytheman, P.; Beers, E.H.; Khot, L.R. An open-source low-cost imaging system plug-in for pheromone traps aiding remote insect pest population monitoring in fruit crops. Machines 2022, 10, 52. [Google Scholar] [CrossRef]
  42. ZL 201921202577.5; Qiu, R.Z.; Zhao, J.; Chi, M.X.; Weng, Q.Y.; Chen, S.X. An Automatic Pest Counting System Based on Image Recognition. Institute of Plant Protection, Fujian Academy of Agricultural Sciences: Fuzhou, China, 2020.
  43. Qiu, R.Z.; Zhao, J.; He, Y.X.; Chen, S.P.; Huang, M.L.; Chi, M.X.; Liang, Y.; Weng, Q.Y. An automatic identification and counting method of Spodoptera frugiperda (Lepidoptera:Noctuidae) adults based on sex pheromone trapping and deep learning. Acta Entomol. Sin. 2021, 64, 1444–1454. [Google Scholar]
  44. Koffi, D.; Agboka, K.; Adjevi, A.K.M.; Assogba, K.; Fening, K.O.; Osae, M.; Aboagye, E.; Meagher, R.L.; Nagoshi, R.N. Trapping Spodoptera frugiperda (Lepidoptera: Noctuidae) moths in different crop habitats in Togo and Ghana. J. Econ. Entomol. 2021, 114, 1138–1144. [Google Scholar] [CrossRef]
  45. Qiu, G.Y. Electrical Circuits, 5th ed.; Higher Education Press: Beijing, China, 2006. [Google Scholar]
  46. Gonzalez, R.; Woods, R.; Eddins, S. Digital Image Processing Using MATLAB; Publishing House of Electronics Industry: Beijing, China, 2013; pp. 515–519. [Google Scholar]
  47. Li, W.Y.; Li, M.; Qian, J.P.; Sun, C.H.; Du, D.S.; Chen, M.X. Segmentation method for touching pest images based on shape factor and separation points location. Trans. Chin. Soc. Agric. Eng. 2015, 31, 175–180. [Google Scholar]
  48. Wang, Z.B.; Wang, K.Y.; Zhang, S.F.; Liu, Z.Q.; Mu, C.X. Whiteflies counting with K-means clustering and ellipse fitting. Trans. Chin. Soc. Agric. Eng. 2014, 30, 105–112. [Google Scholar]
  49. Preti, M.; Verheggen, F.; Angeli, S. Insect pest monitoring with camera-equipped traps: Strengths and limitations. J. Pest Sci. 2020, 94, 203–217. [Google Scholar] [CrossRef]
Figure 1. Adults of S. frugiperda and the traditional monitoring trap. (a) The traditional unitrap. (b) Male moth of S. frugiperda. (c) Female moth of S. frugiperda.
Agriculture 13 00843 g001
Figure 2. Frame diagram of low-power automatic monitoring system for pests captured using sex pheromone lures.
Agriculture 13 00843 g002
Figure 3. Low-power monitoring device for pests captured using sex pheromone lures. (a) Low-power monitoring device for S. frugiperda. (b) Schematic diagram of the monitoring device. 1: rain cover; 2: funnel; 3: collecting bucket; 4; pest entrance; 5: sex pheromone lure; 6: circuit board; 7: camera; 8: battery; 9: solar panel.
Agriculture 13 00843 g003
Figure 4. Schematic diagram of circuit board.
Agriculture 13 00843 g004
Figure 5. Flow diagram of the working principle.
Agriculture 13 00843 g005
Figure 6. Processing flow of pest image.
Agriculture 13 00843 g006
Figure 7. Days of photography with different image resolutions and capture periods of low-power monitoring device.
Agriculture 13 00843 g007
Figure 8. Original background and S. frugiperda images. (a) Original background image. (b) Original S. frugiperda image with light spot. (c) Image with S. frugiperda at the bottom edge of bucket. (d) Cropping image of background. (e) Cropping image of S. frugiperda with light spot. (f) Cropping image with S. frugiperda at the bottom edge of bucket.
Agriculture 13 00843 g008aAgriculture 13 00843 g008b
Figure 9. Image preprocessing. (a) Background grayscale image. (b) S. frugiperda grayscale image with light spot. (c) Grayscale image with S. frugiperda at the bottom edge of bucket. (d) Background binarization image. (e) S. frugiperda binarization image. (f) Binarization image with S. frugiperda at the bottom edge of bucket.
Agriculture 13 00843 g009
Figure 10. Image segmentation of S. frugiperda (a) The difference image obtained by subtracting the S. frugiperda binarization and background images. (b) The difference image obtained by subtracting the binarization image with S. frugiperda at the bottom edge of bucket and background images. (c) Image obtained after applying the Imopen operation. (d) Image with S. frugiperda at the bottom edge of bucket obtained after applying the Imopen operation. (e) Final image with light spot after elimination of small area interference. (f) The counting image result for S. frugiperda at the bottom edge of bucket obtained. (g) The counting image result of S. frugiperda after light spot removal.
Agriculture 13 00843 g010
Figure 11. Linear regression between automatic and manual counting of S. frugiperda.
Agriculture 13 00843 g011
Table 1. Average image size and time of image transmission for different image resolutions.
Image Resolution (Pixel)Number of ImagesImage Capture Period (h)Average Image Sizes (KB)Time of Photo Transmission (s)
1920 × 10803362248121.58
1280 × 960336217083.13
640 × 48033623818.48
320 × 2403362115.46
Table 2. Power consumption at different image resolutions and capture periods (Unit: mWh).
Image Capture Period (h)Image Resolution (Pixel)
320 × 240640 × 4801280 × 9601920 × 1080
16.6814.7153.9577.13
26.7614.7954.0377.21
46.9214.9454.1877.37
67.0715.1054.3477.52
87.2315.2654.4977.68
127.5415.5754.8177.99
248.4816.5055.7478.93
Table 3. Number of images captured at different resolutions and capture periods.
Image Capture Period (h)Resolution (Pixel)
320 × 240640 × 4801280 × 9601920 × 1080
11885857234163
21863852233163
41821843233163
61781834232163
81743826231162
121671809230162
241486763226160
Table 4. Threshold range of feature parameters of S. frugiperda.
Feature ParametersThreshold Range
Lower LimitUpper Limit
H/V0.060.22
Complexity1.358.36
Disclaimer/Publisher’s Note: The statements, opinions and data contained in all publications are solely those of the individual author(s) and contributor(s) and not of MDPI and/or the editor(s). MDPI and/or the editor(s) disclaim responsibility for any injury to people or property resulting from any ideas, methods, instructions or products referred to in the content.

