Article

Multi-Year QTL Mapping and RNA-seq Reveal Candidate Genes for Early Floret-Opening Time in Japonica Rice

1
State Key Laboratory of Plant Physiology and Biochemistry, College of Life Sciences, Zhejiang University, Hangzhou 310058, China
2
China National Seed Group Co., Ltd., Beijing 100031, China
3
Institute of Food Crops, Jiangsu Academy of Agricultural Sciences, Nanjing 210014, China
4
Rice Research Institute, Anhui Academy of Agricultural Sciences, Hefei 230031, China
*
Author to whom correspondence should be addressed.
These authors contributed equally to this work.
Agriculture 2023, 13(4), 859; https://doi.org/10.3390/agriculture13040859
Submission received: 23 February 2023 / Revised: 3 April 2023 / Accepted: 5 April 2023 / Published: 13 April 2023
(This article belongs to the Special Issue Prospects and Challenges of Rice Breeding under Climate Change)

Abstract

:
Floret-opening time (FOT) refers to the time between florets opening and closing within a day, and is a crucial agricultural trait for reproductive development, thermal tolerance and hybrid breeding in rice. However, little is known about the genetic basis and genes controlling FOT in rice. Here, we report the genetic mapping and transcriptome analysis of FOT in the japonica rice cultivar G23. Combining the QTLseqr and GradedPool-seq (GPS) methods, we located a major quantitative trait locus (QTL), qFOT6, on chromosome 6 in multiple years and under different environments. Integrating RNA-seq analysis, we selected 13 potential candidate genes in the qFOT6 interval that might be associated with FOT in G23. Taken together, our work uncovers a major QTL and potential candidate genes for FOT in rice, thus providing invaluable clues for rice breeding.

1. Introduction

Rice (Oryza sativa) is one of the most vital crops in the world and plays an indispensable role in food production and consumption [1,2]. Thus, a high yield of rice, which guarantees global food security [2], has always been a primary goal in rice breeding. In rice, floret-opening time (FOT) is a pivotal trait in breeding [3,4]. It mainly refers to the moment when most florets open or the time span from florets opening to closing within a day in a paddy field [5,6]; it can be further divided into the beginning of FOT (BFOT), the peak of FOT (PFOT, when about 50% of the florets are open within a day), and the floret-closing time (FCT) [5,6,7,8]. For easy evaluation, PFOT is usually used to represent diurnal FOT in rice [9,10,11].
Studies have shown that FOT is essential for reproductive development, thermal tolerance and hybrid breeding in rice. First, during the period of FOT, rice reproductive development undergoes filament elongation, anther dehiscence and pollination [4]. Thus, proper FOT guarantees appropriate rice pollination, fertilization and seed development. Second, proper FOT protects rice reproductive development from environmental stresses [12]. Rising global temperature has led to extreme heat stress, which has seriously threatened the growth and production of rice [1,2,13,14,15,16,17,18]. Studies have showed that the rice spikelet is most susceptible to heat stress during FOT [19]. When FOT overlaps with diurnal extreme high temperature, this evidently leads to the inhibition of anther dehiscence and a reduction in pollen germination on the stigma, resulting in a reduction in seed setting [20,21,22]. To solve this challenge, bringing forward FOT to the early morning is a strategy used to avoid heat-induced spikelet sterility [12,23,24,25,26]. In 2010, Ishimaru et al. introgressed the early morning flowering (EMF) trait from wild rice (Oryza officinalis) into the rice cultivar ‘Koshihikari’, and improved its pollen fertility and seed production [27]. Therefore, understanding the mechanism of early FOT in rice will promote the breeding of high-temperature-resilient cultivars. Third, FOT also plays a key role in hybrid rice breeding. The utility of hybrid vigor in indica–japonica subspecies is a solution with great potential to increase yields of rice [28,29,30]. However, the FOT of japonica rice is usually much later than that of indica rice [12,31]. FOT asynchrony has become a major barrier, leading to poor F1 seed production, thus limiting the application of the indica–japonica subspecies hybrid in rice [32]. Therefore, it is important to understand the genetic and molecular mechanisms underlying FOT in rice.
During the early 1990s, biologists began to explore the genetic basis of FOT in rice, and several QTLs have been reported. Thus far, FOT QTLs have been identified on nearly all chromosomes. Among these loci, spikelet opening time 5 (SOT5), which was determined for both the BFOT and PFOT traits, and the QTL of early morning flowering 3 (qEMF3), respectively, were derived from the wild rice W630 (Oryza rufipogon) and Oryza officinalis Wall ex Watt [7,9]. Flowering time (FT) QTLs, including qFT-1a, qFT-1b, qFT-10 and qFT-12, were genetically dissected in an early flowering japonica rice WAB368-B-2-H2-HB [6]. In addition, qFT1a, a major QTL that explains more than 60% of total phenotypic variation, was mapped to chromosome 1 in the early flower opening time (eft) mutant [8]. Recently, an FOT controlling gene, diurnal flower opening time 1 (DFOT1)/early morning flowering 1 (EMF1), was identified in ZH11 and Yixiang 1A, respectively [10,11]. DFOT1/EMF1 regulates FOT by participating in the synthesis of cell wall components. Interacting with pectin methylesterases (PMEs) and glutamine synthetase (GLN2), DFOT1/EMF1 is involved in the pectin methyl ester process and cellulose formation, thus affecting the elasticity of the cell wall, regulating the process of water absorption and swelling in rice lodicule cells, and further controlling FOT. To date, FOT genes and their underlying mechanisms remain largely uncovered.
In this study, we report a novel FOT locus mapped on G23, which is a japonica rice cultivar with early FOT. With the F2, F4 and F6 populations, a major QTL, qFOT6, which is associated with the early FOT, was identified in multiple years and multiple environments using different analysis methods, including QTLseqr, GradedPool-seq (GPS) and traditional genetic linkage analysis. Furthermore, upon combining this with RNA-seq data, we further revealed several potential candidate genes that may be linked to early FOT in G23.

2. Materials and Methods

2.1. Plant Materials and Growth Conditions

The japonica rice cultivar G23 with early FOT was crossed with regular japonica rice Nangeng 9108 (NG9108) in 2019. The resulting 251 individual plants of the F2 population were kept for self-pollination, and to generate the F4 and F6 recombined inbred line (RIL) populations, using the single seed descent method.
To determine the FOT dynamics of parents, G23 and NG9108 were grown in a greenhouse, with a day-average-temperature (DAT) of 28 °C, at the China National Rice Research Institute (Hangzhou, Zhejiang Province, China), in the summer of 2020.
We investigated the FOT of the parents, and that of the F2, F4 and F6 RIL populations, in different environmental conditions. In the summer of 2020, the FOTs of the parents and the F2 population were evaluated in the greenhouse of the Zhejiang University campus (Hangzhou, Zhejiang Province, China). In 2021 and 2022, the parents and the F4 and F6 RIL populations were planted in paddy fields in Fuyang and Jingshan, respectively (Hangzhou, Zhejiang Province, China). Two parents and each line of 251 RILs were transplanted in rows, with eight plants per row. G23 and NG9108, as the controls, were repeatedly sowed and transplanted every 10 days from May to June.

2.2. Statistical Methods for FOT

To determine the dynamic statistics of the parents’ FOTs, the point spikelet method was used [31]. Considering the heading date (HD) difference between the two parents, we sowed and transplanted them every five days, and eventually chose the same-term heading plants to investigate their FOT trait in a thermostatic walk-in greenhouse. To reduce the influence of abnormal weather, we only kept the data on sunny days for statistical processing. The main or secondary tiller was chosen to record the FOT after it bloomed on the second or third day to reduce the background noise. From 8:00 to 14:00, the total number of opened florets was counted every 30 min. Three individual plants were selected every day, and the process was repeated over three days. Finally, nine sets of FOT data for each parent were selected to calculate the FOT curve.
For the investigation of the FOT trait in the NG9108/G23 F2 population, which was grown in the greenhouse, a method combining digital photographs and physical inspection was adopted. Briefly, each plant in the population was coded with a number on its flowering main or secondary tiller, and then, photographed at 30 min intervals using a digital camera (Canon 80D); this took place every day from 8:00 to 14:00. Meanwhile, the weather conditions during the experiment were recorded. Since the whole-panicle flowering tendency is better explained by PFOT (when nearly half of the florets are opened in the day) than other parameters, except for the FOT dynamics, and other places in the methods, it was picked to represent the FOT. Eventually, the digital data and the physical inspection data were combined to determine the FOT, and data under abnormal weather conditions were discarded. Moreover, at least two replicates of FOT in each line were kept to calculate the average value. For the FOT statistics in the F2 population, the FOT at every 30-min interval was set as a scale, and from 9:30 to 14:00 it was divided into nine grades.
For the FOT inspection of the F4 and F6 populations in the paddy field, visual observation was used to record the extremely early and late FOT plants, and only the data from sunny days were retained. Taking the parents’ PFOT as reference, the flowering state of individuals in F4 and F6 populations was recorded. From 10:00 to 10:30 (PFOT of G23), if the FOT of a RIL line was earlier or as early as G23, it was marked as “E” (i.e., early FOT) with a red label. From 11:30 to 12:00, if the FOT of a line was the same as NG9108 or even later, it was marked as “L” (i.e., late FOT) with a white label. Finally, individuals marked with at least three “E” or “L” labels were retained for subsequent experiments.

2.3. QTLseqr Analysis

Bulk segregant analysis (BSA) combined with next-generation sequencing was used to identify QTLs. Based on the phenotypic values of FOT for each population, two extreme bulks (BSA-E and BSA-L) were respectively pooled to detect QTLs in the F2, F4 and F6 RIL populations. For each pool, an equal amount of fresh leaves from individuals was mixed as the bulk, and its DNA was extracted using the CTAB method [33]. The integrity and the concentration of the bulked DNA were checked using 1% agarose gel and a Nanodrop 2000, respectively. The bulked DNA was fragmented via sonication to a size of 350 bp. The whole library preparation process was completed through the terminal repairing, adding an “A” tail and sequencing adapters, purification, PCR amplification and other steps, which were carried out using the NEB Next Ultra DNA Library Prep Kit for Illumina (New England Biolabs, Ipswich, MA, USA). Then, the DNA was submitted to illumine NovaSeq6000 for 150 paired-end sequencing (Novogene, Beijing, China).
The raw data were submitted to fastp (v0.20.0) for quality control analysis, with default parameters [34]. The generated clean data was used for analysis. The trimmed reads were then aligned to a japonica cultivar Nipponbare genome (MSU7, http://rice.plantbioogy.msu.edu/ (accessed on 25 December 2020)) with bwa (v0.7.17) using the default parameters. SAMtools (v1.16.1) was used to sort and index the bam files. Picard (v2.27.4) was used for duplicate marking. GATK (v4.2.6) was used to call the genetic variations. VCFtools (v0.1.16) was used to extract DNA variation information from the VCF files. SnpEff (v5.0) was used to annotate the single-nucleotide polymorphism (SNP) and insertion and deletion (InDel) variants. Eventually, QTLseqr was used to analyze and visualize the SNP frequencies, and the results were presented using G statistic (G′).

2.4. GradedPool-Seq (GPS) Analysis

GPS analysis is based on the whole-genome sequencing of graded-pool samples in F2 via BSA analysis (https://github.com/sctang1991/GPS-pipeline (accessed on 22 December 2020)). To this end, 229 individuals of the F2 populations were pooled into four graded groups: GPS1, GPS2, GPS3 and GPS4. Their FOTs ranged from 9:30 to 14:00, and their bulk sizes were 27, 85, 78 and 39, respectively. Bulk pooling, DNA extraction, library preparation and sequencing were performed in the same way as the QTLseqr part (see Materials and Methods Section 2.3). The sequencing data were trimmed and called variants as Materials and Methods Section 2.3. Subsequently, the generated VCF file was processed via Ridit analysis. The p-value of each variant was calculated. The ratio of statistically significant SNPs to total SNPs in a defined genomic interval (a 400 kb sliding window) was computed. The candidate genetic intervals that correlated with FOT were identified via a ratio plot.

2.5. Regional Linkage Mapping Analysis

Based on the QTLseqr and GPS analysis results of the NG9108/G23 F2 population, the 229 individuals with valid FOT data were further used to construct a regional linkage map on chromosome 6. The DNA of the individual plants and the two parents was extracted from fresh leaves using the CTAB method [33]. A total of 13 pairs of InDel primers were developed based on InDel polymorphisms between G23 and NG9108 (primers designed by https://www.ncbi.nlm.nih.gov/tools/primer-blast/index (accessed on 22 February 2023) and synthesized by Zhejiang Shangya Biotechnology), and a genetic linkage map was constructed using QTL Icimapping (v4.2.53) software. QTL analysis was carried out via inclusive composite interval mapping (ICIM) with a LOD threshold of 2.0. The variation rate and additive effect of the QTL were calculated. The primer sequences are listed in Table S4.

2.6. RNA-seq Analysis and Candidate Gene Prediction within Target Intervals

RNA-seq was conducted to find the candidate genes that responded to FOT in G23 and NG9108, and three time points (20:00, 8:00 and 10:00) for G23 and four time points (20:00, 8:00, 10:00 and 12:00) for NG9108 were designed for sampling. At each time point, three replicates of lodicules were collected using RNA-EZ Reagents (B644171, Sangon Biotech, Shanghai, China). According to the manufacturing instructions, the total RNA from the lodicules of G23 and 9108 was extracted using a ZYMO Quick-RNA Microprep Kit (R2062, Zymo Research, Orange County, CA, USA). A total of 1 μg RNA per sample was used as the input material for the RNA sample preparations. Sequencing libraries were generated using the NEB Next Ultra RNA Library Prep Kit for Illumina (New England Biolabs, Ipswich, MA, USA) following the manufacturer’s recommendations. The generated libraries were submitted to the Illumina Novaseq platform for sequencing (Novogene, Beijing, China).
The RNA-seq data were submitted to FastQC (v0.11.7) to examine sequencing quality, and to Trimmomatic (v.039) to remove low-quality reads. Reads with quality scores across all bases of more than 20 were retained for subsequent analysis. Clean reads were then mapped to the Nipponbare reference genome (MSU7, http://rice.uga.edu/downloads.shtml/ (accessed on 25 January 2021)) using HISAT2 (v2.2.1). The raw read counts and the normalized fragments per kilobase of exon model per million mapped reads (FPKM) value were calculated using FeatureCounts (v2.0.1). Then, the differentially expressed genes (DEGs) were identified (|log2Fold-Change| ≥ 1 and p ≤ 0.05) using DESeq2, and a heat map of gene expression level was created using R. A Venn diagram was plotted using an online tools jvenn in http://jvenn.toulouse.inra.fr/app/ (accessed on 22 February 2023). Gene Ontology (GO) and Kyoto Encyclopedia of Genes and Genomes (KEGG) annotations of the DEGs were performed using R (v4.2.2) based on the clusterProfiler package (https://bioconductor.org/pacages/rlea-se/bioc/html/clusterProfiler.html (accessed on 2 February 2021)). Finally, these DEGs were overlapped with the qFOT6 locus to narrow down the potential candidate genes.

3. Results

3.1. Floret-Opening Dynamics of G23 and NG9108

To investigate the dynamics of FOT in G23 and NG9108, these two parents were grown in the field and transferred to a walk-in chamber with a DAT of 28℃ in summer when they were heading at the same time. G23 started to blossom at around 9:00, and more and more florets gradually opened from 9:00 to 10:00. At around 10:30, most of the G23 florets had blossomed during the day, and it reached its PFOT (Figure 1A,B). During these 1.5 h, the lemma and palea of the G23 florets gradually opened, and filaments were elongated outwards to pollinate. After pollination, most florets began to close from 11:00 to 12:00 (Figure 1A,B, Table S1). However, in NG9108, almost no florets (fewer than five) opened before 11:30, and it reached its PFOT at around 12:30, which was nearly two hours after G23. Then, most of its florets closed from 13:30 to 14:00 (Figure 1A,B, Table S1). Together, our results indicate that the PFOT of G23 was 10:00–10:30, while NG9108 reached its PFOT at around 12:30. Based on the PFOT trait, G23 opens its lemma and palea two hours earlier than NG9108. Thus, G23 and NG9108 are ideal materials for investigating the FOT trait of japonica rice.

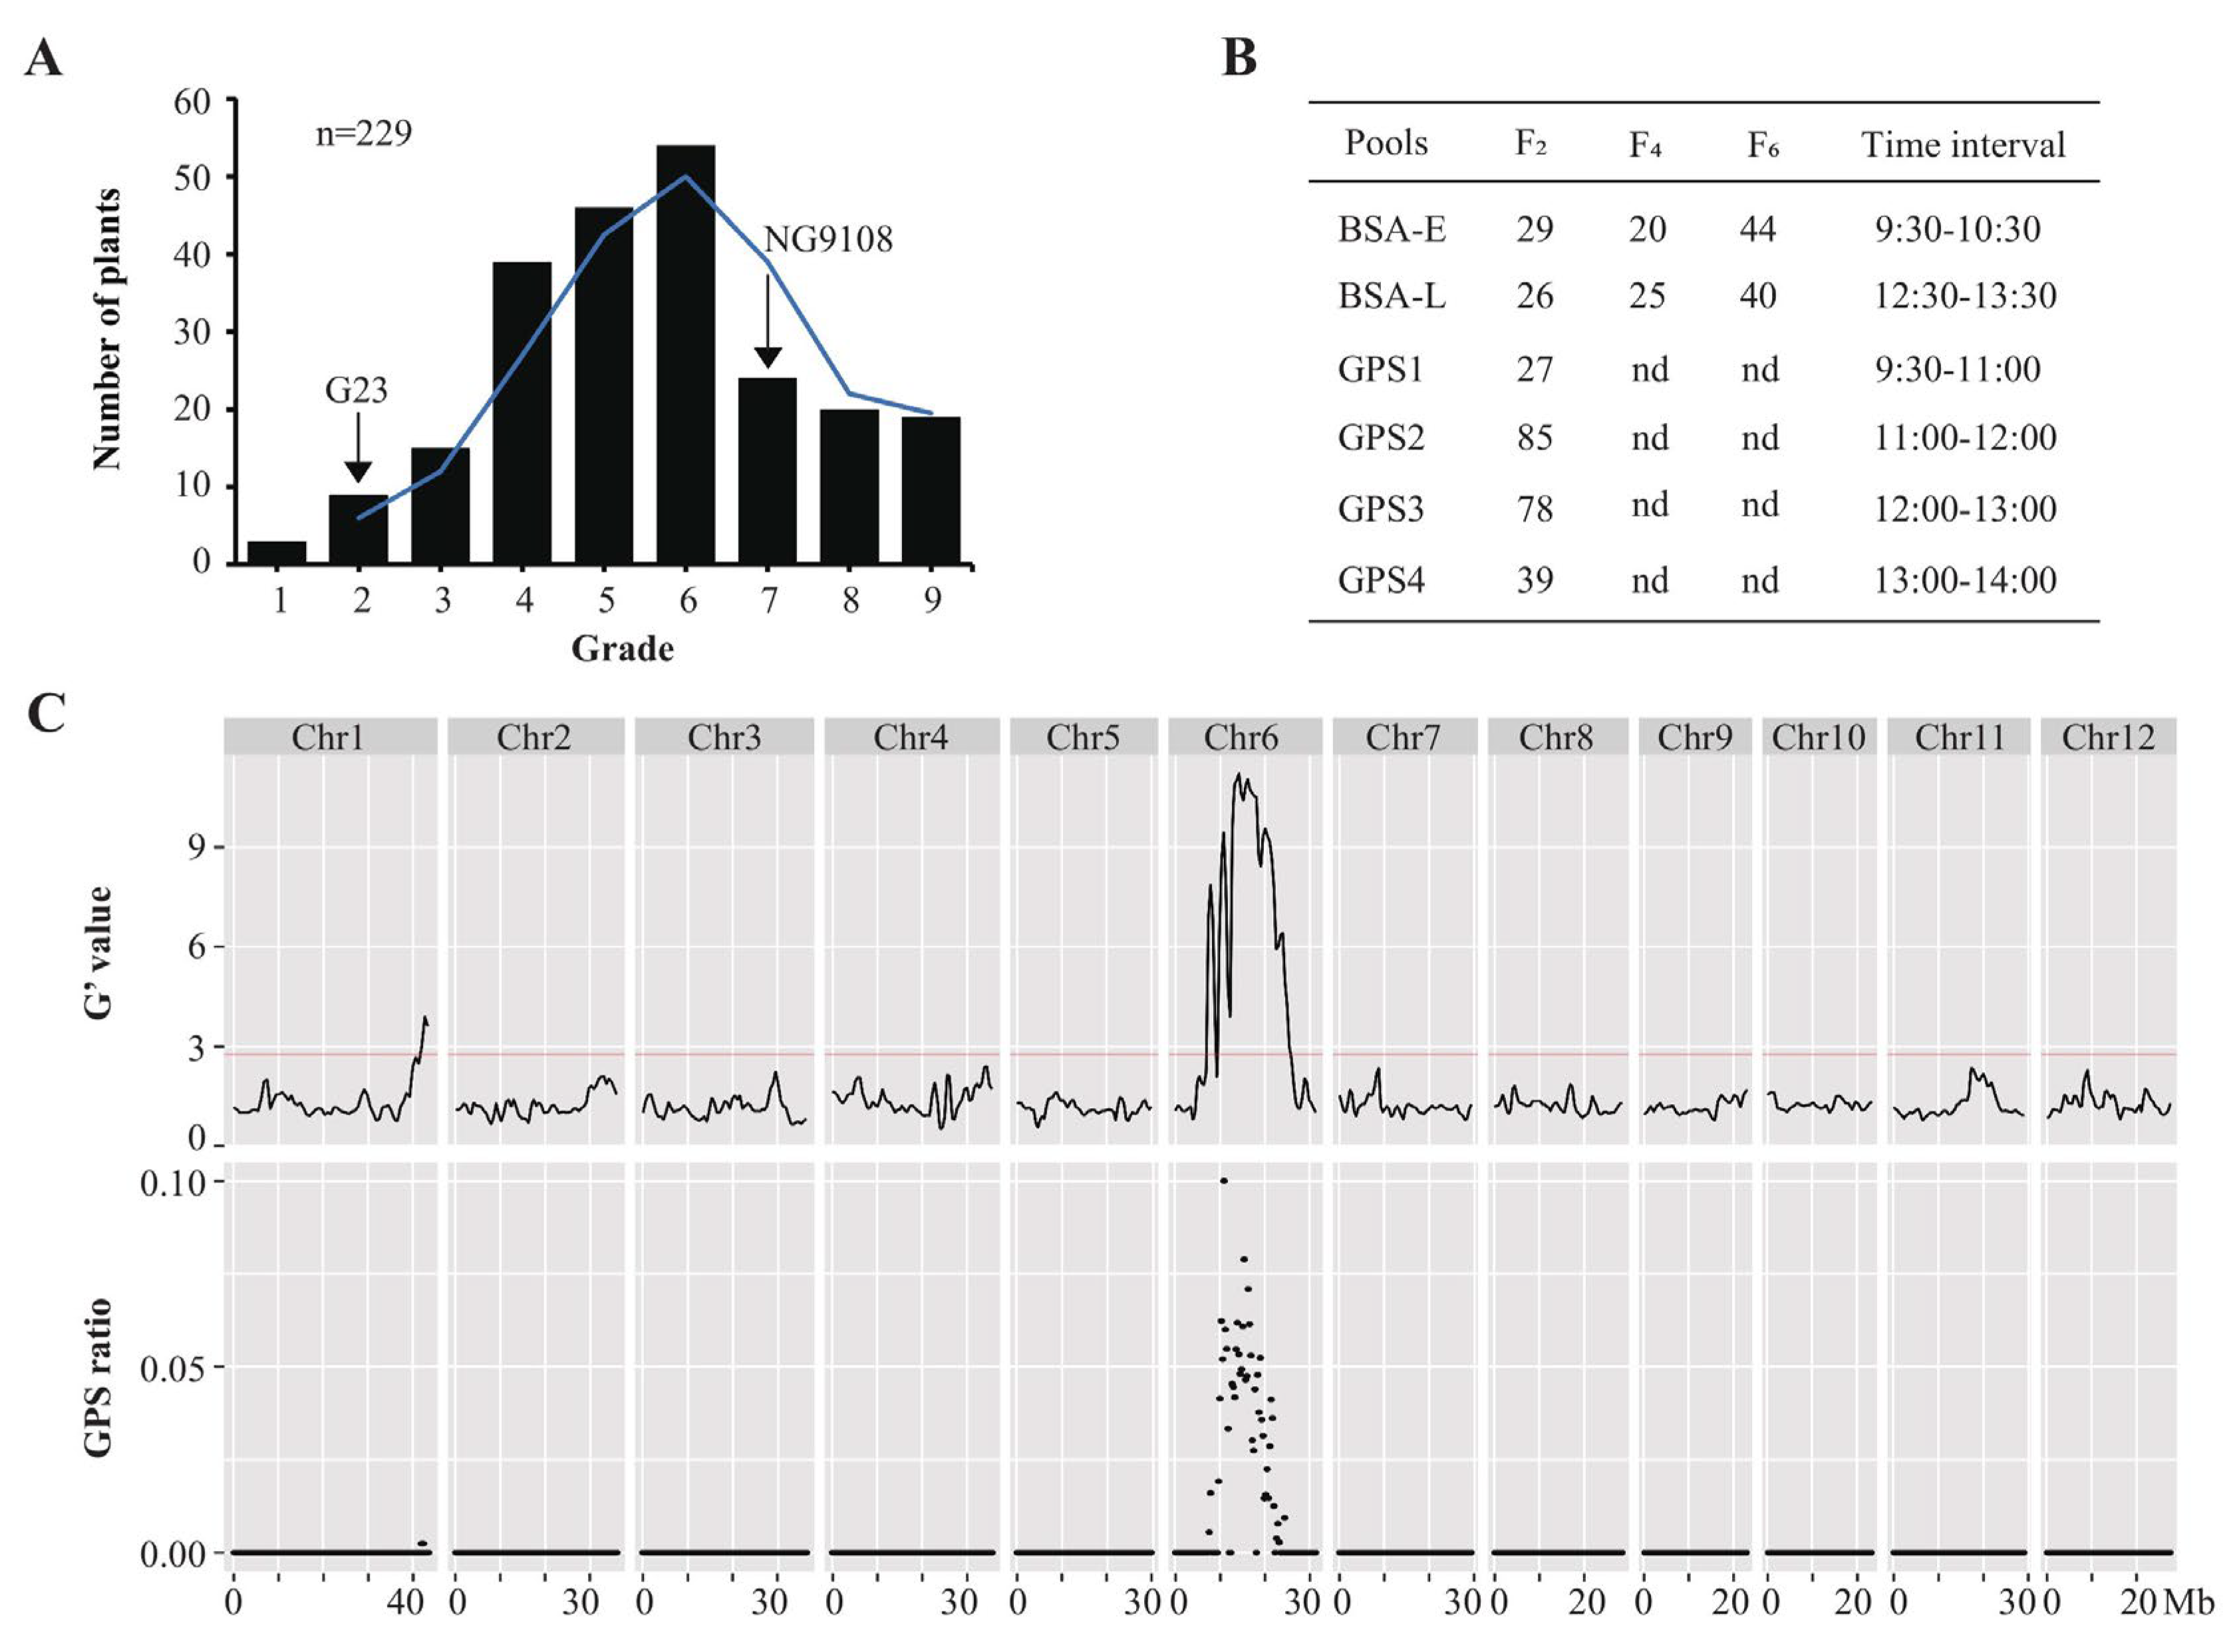
3.2. FOT QTL Detection in the F2 Population

To understand the genetic basis of early FOT in G23, we crossed G23 with NG9108 and generated an F2 population to investigate its FOT behaviors. Considering the influence of weather factors, the parents and F2 plants were grown in the greenhouse. The FOT phenotypes were evaluated from July to August in 2020 when the weather conditions were relatively stable in Hangzhou. Since the whole-panicle florets’ opening tendency was better explained by PFOT than other parameters [7,8], from here on, it will represent the daily FOT in this study. In addition, given that abnormal weather conditions greatly impact FOT [31], we only selected data collected on sunny days for further analysis and statistics.
Of the 251 F2 individuals, the FOT data of 22 individuals were discarded due to data deficiency caused by abnormal weather. Of the 229 retained individuals, variation in the FOTs of the F2 population was extensive, ranging from 9:30 to 14:00 (Figure 2A, Table S2). We set a 30 min interval as a grade to evaluate the FOT distribution in F2. From 9:30 to 14:00, the FOT trait in F2 was grouped into nine grades, including G23 in grade 2 and NG9108 in grade 7 (Figure 2A). We found that the FOT of G23 was relatively earlier than the majority of plants in the F2 population, but still, a few individuals blossomed even earlier. Meanwhile, a considerable number of individuals bloomed as late as 12:00, even later than NG9108. In the F2 population, we observed a continuous normal distribution of FOT among 229 individuals, indicating that the FOT trait in G23 and NG9108 was a complex, quantitative trait controlled by multiple genes or loci.
Subsequently, based on the FOT phenotypes in F2, we combined the BSA-seq data with the QTLseqr method to identify QTLs responding to FOT in G23 and NG9108. To this end, we selected 29 individuals with extremely early FOT and 26 individuals with extremely late FOT to pool into two bulks: BSA-E and BSA-L, respectively (Figure 2B). After sequencing, clean data were used for analysis. QTLseqr was used to identify DNA variations between the two pools and determine 99% credible intervals for QTL mapping. The distribution of the G′ value along 12 chromosomes revealed that two genomic regions, 6.9–9.0 Mb and 9.4–25.7 Mb on chromosome 6, were highly linked to early FOT in G23 (Figure 2C, Table S3).
At the same time, we further used GPS to verify the candidate regions. The whole population (229 F2 plants) was utilized and divided into four graded pools: GPS1 (grades 1–3), GPS2 (grades 4 and 5), GPS3 (grades 6 and 7) and GPS4 (grades 8 and 9) (Figure 2A,B). The Ridit analysis was used to calculate the p-value for the high-quality SNPs. Background noise reduction was implemented using the sliding window approach. The ratio plot showed that a single interval relating to FOT was mapped on chromosome 6 (Figure 2C), which was consistent with the result of the QTLseqr analysis. Thus, these results, supported by both the QTLseqr and GPS methods, provide strong evidence that a major QTL located in chromosome 6 controls early FOT in G23.

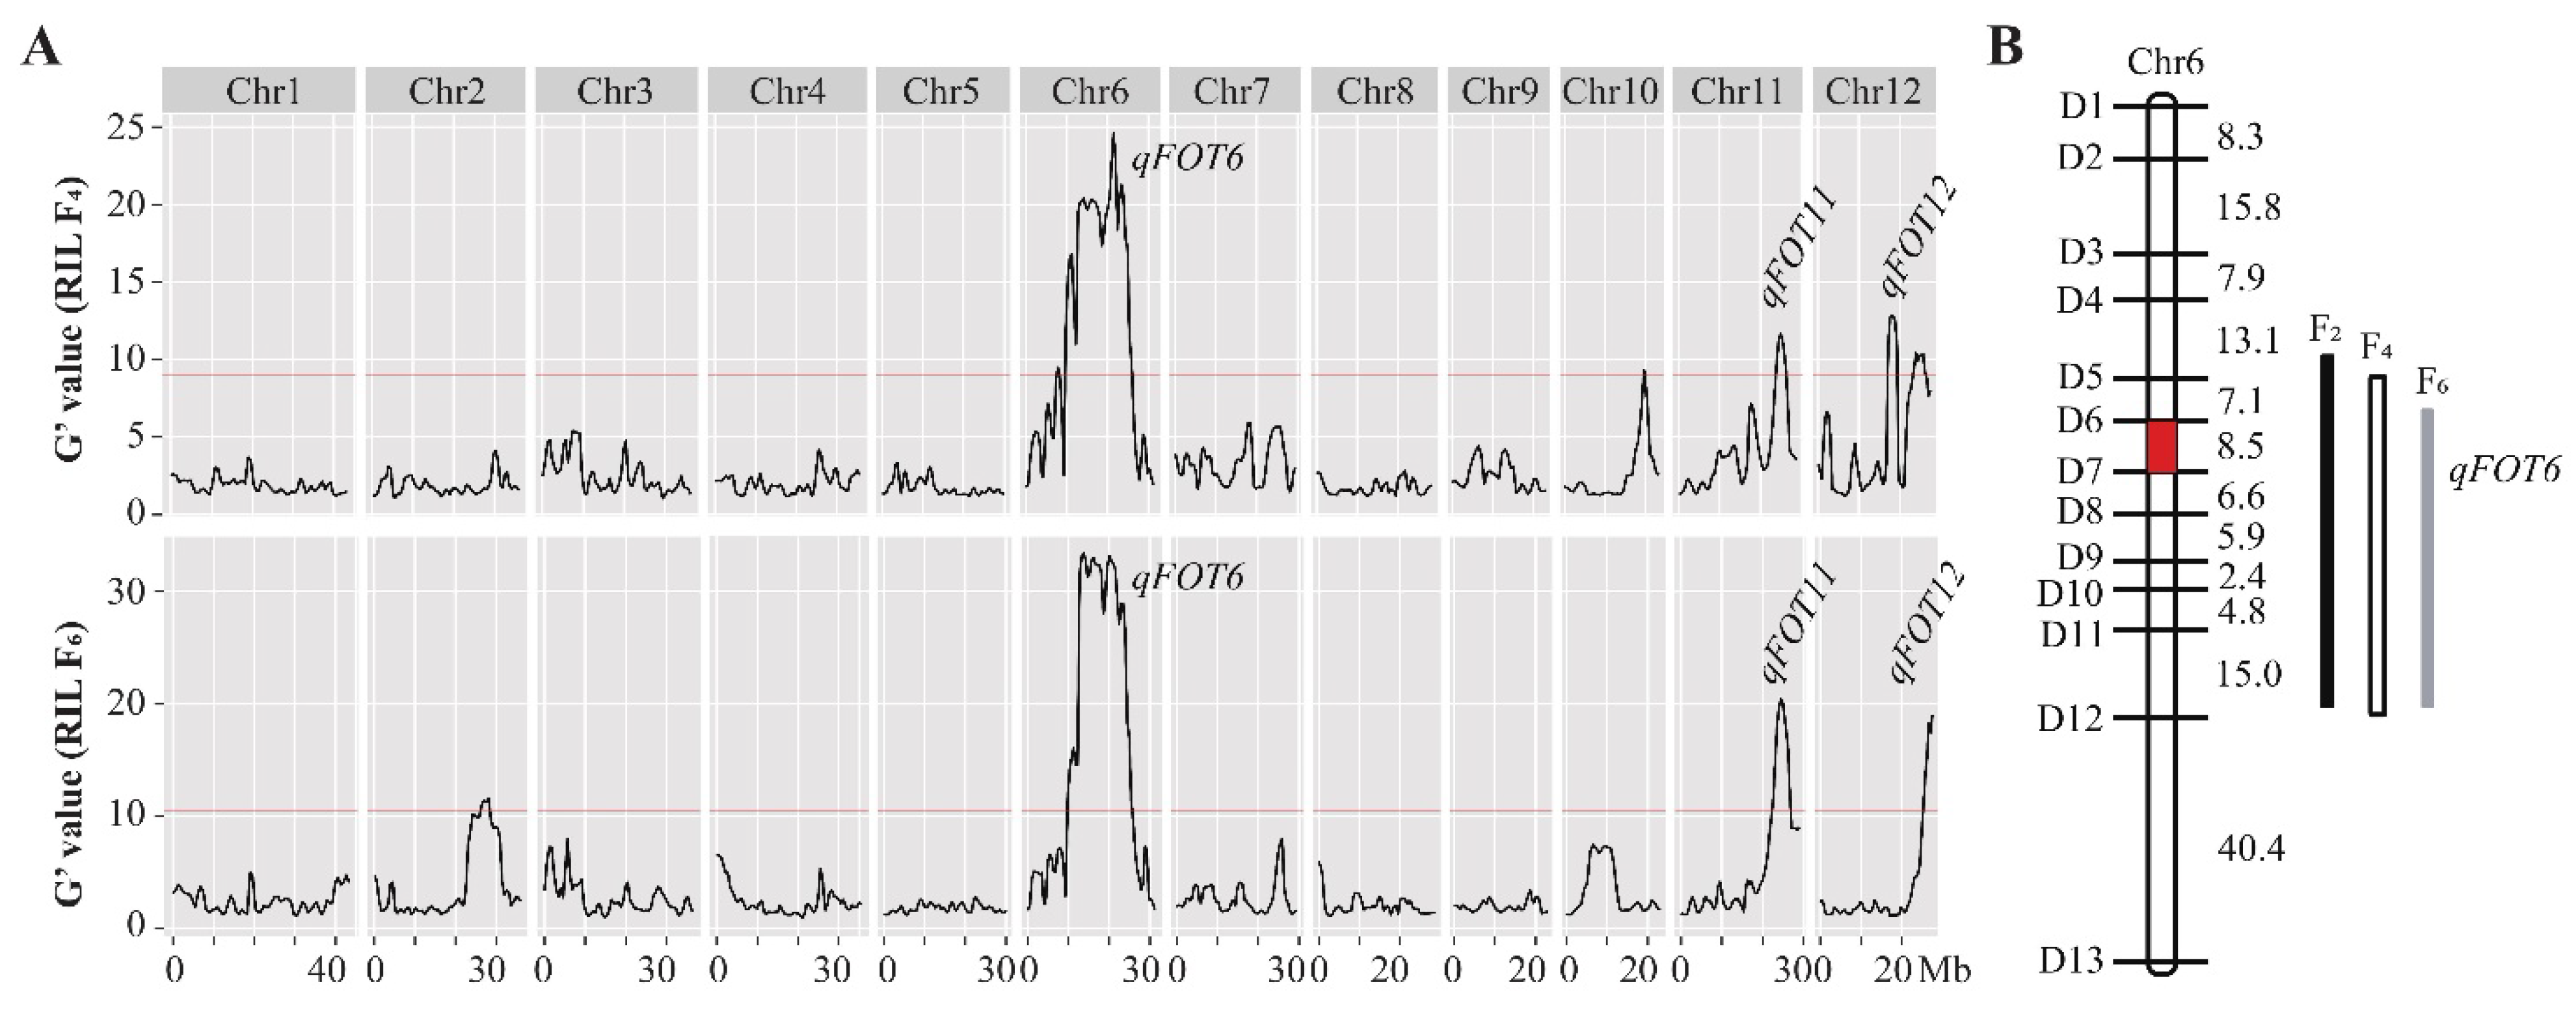
3.3. Multiple-Year Verification of qFOT6

To confirm the FOT QTL on chromosome 6, we further generated the F4 and F6 RIL populations by self-pollinating the F2 plants, and planted them in the paddy field to verify the region detected in F2. The FOT phenotypes of 251 lines in F4 and F6 were examined in the field in the summers of 2021 and 2022, respectively.
Due to the abnormal weather conditions (relatively low temperature compared to the historical average temperature) in the summer of 2021, we only observed 20 individuals with early FOT for the BSA-E bulk and 25 plants with late FOT for the BSA-L bulk, respectively, in the F4 population (Figure 2B). In the summer of 2022, continuously stable extreme high temperatures occurred when the F6 population flowered, from which 44 extremely early FOT plants and 40 extremely late FOT individuals were selected (Figure 2B). After sequencing these bulks, we also applied the QTLseqr method for data analysis. In the F4 population, the candidate region overlapped with that detected in F2 (Figure 3A, Table S3). For F6, the relative interval was narrowed to 9.7–25.6 Mb (Figure 3A, Table S3). Thus, both QTLseqr results from F4 and F6 confirmed the QTL detected in F2.
Furthermore, using the F2 population, we constructed a regional linkage map of chromosome 6. A total of 13 pairs of InDel primers among 40 pairs with polymorphism between parents were screened (Table S4). A QTL locus that controls the FOT on chromosome 6 was detected to have a LOD value of 23.6, which could explain 37.3% of the phenotypic variation (Table 1). The QTL was narrowed down to a region of 8.5 cM by markers D6 and D7 (Figure 3B), which was detected repeatedly in multiple generations and multiple environments using BSA-seq in G23 (Figure 2C and Figure 3A,B). Thus, we detected a major and stable QTL controlling FOT in japonica rice, termed qFOT6.

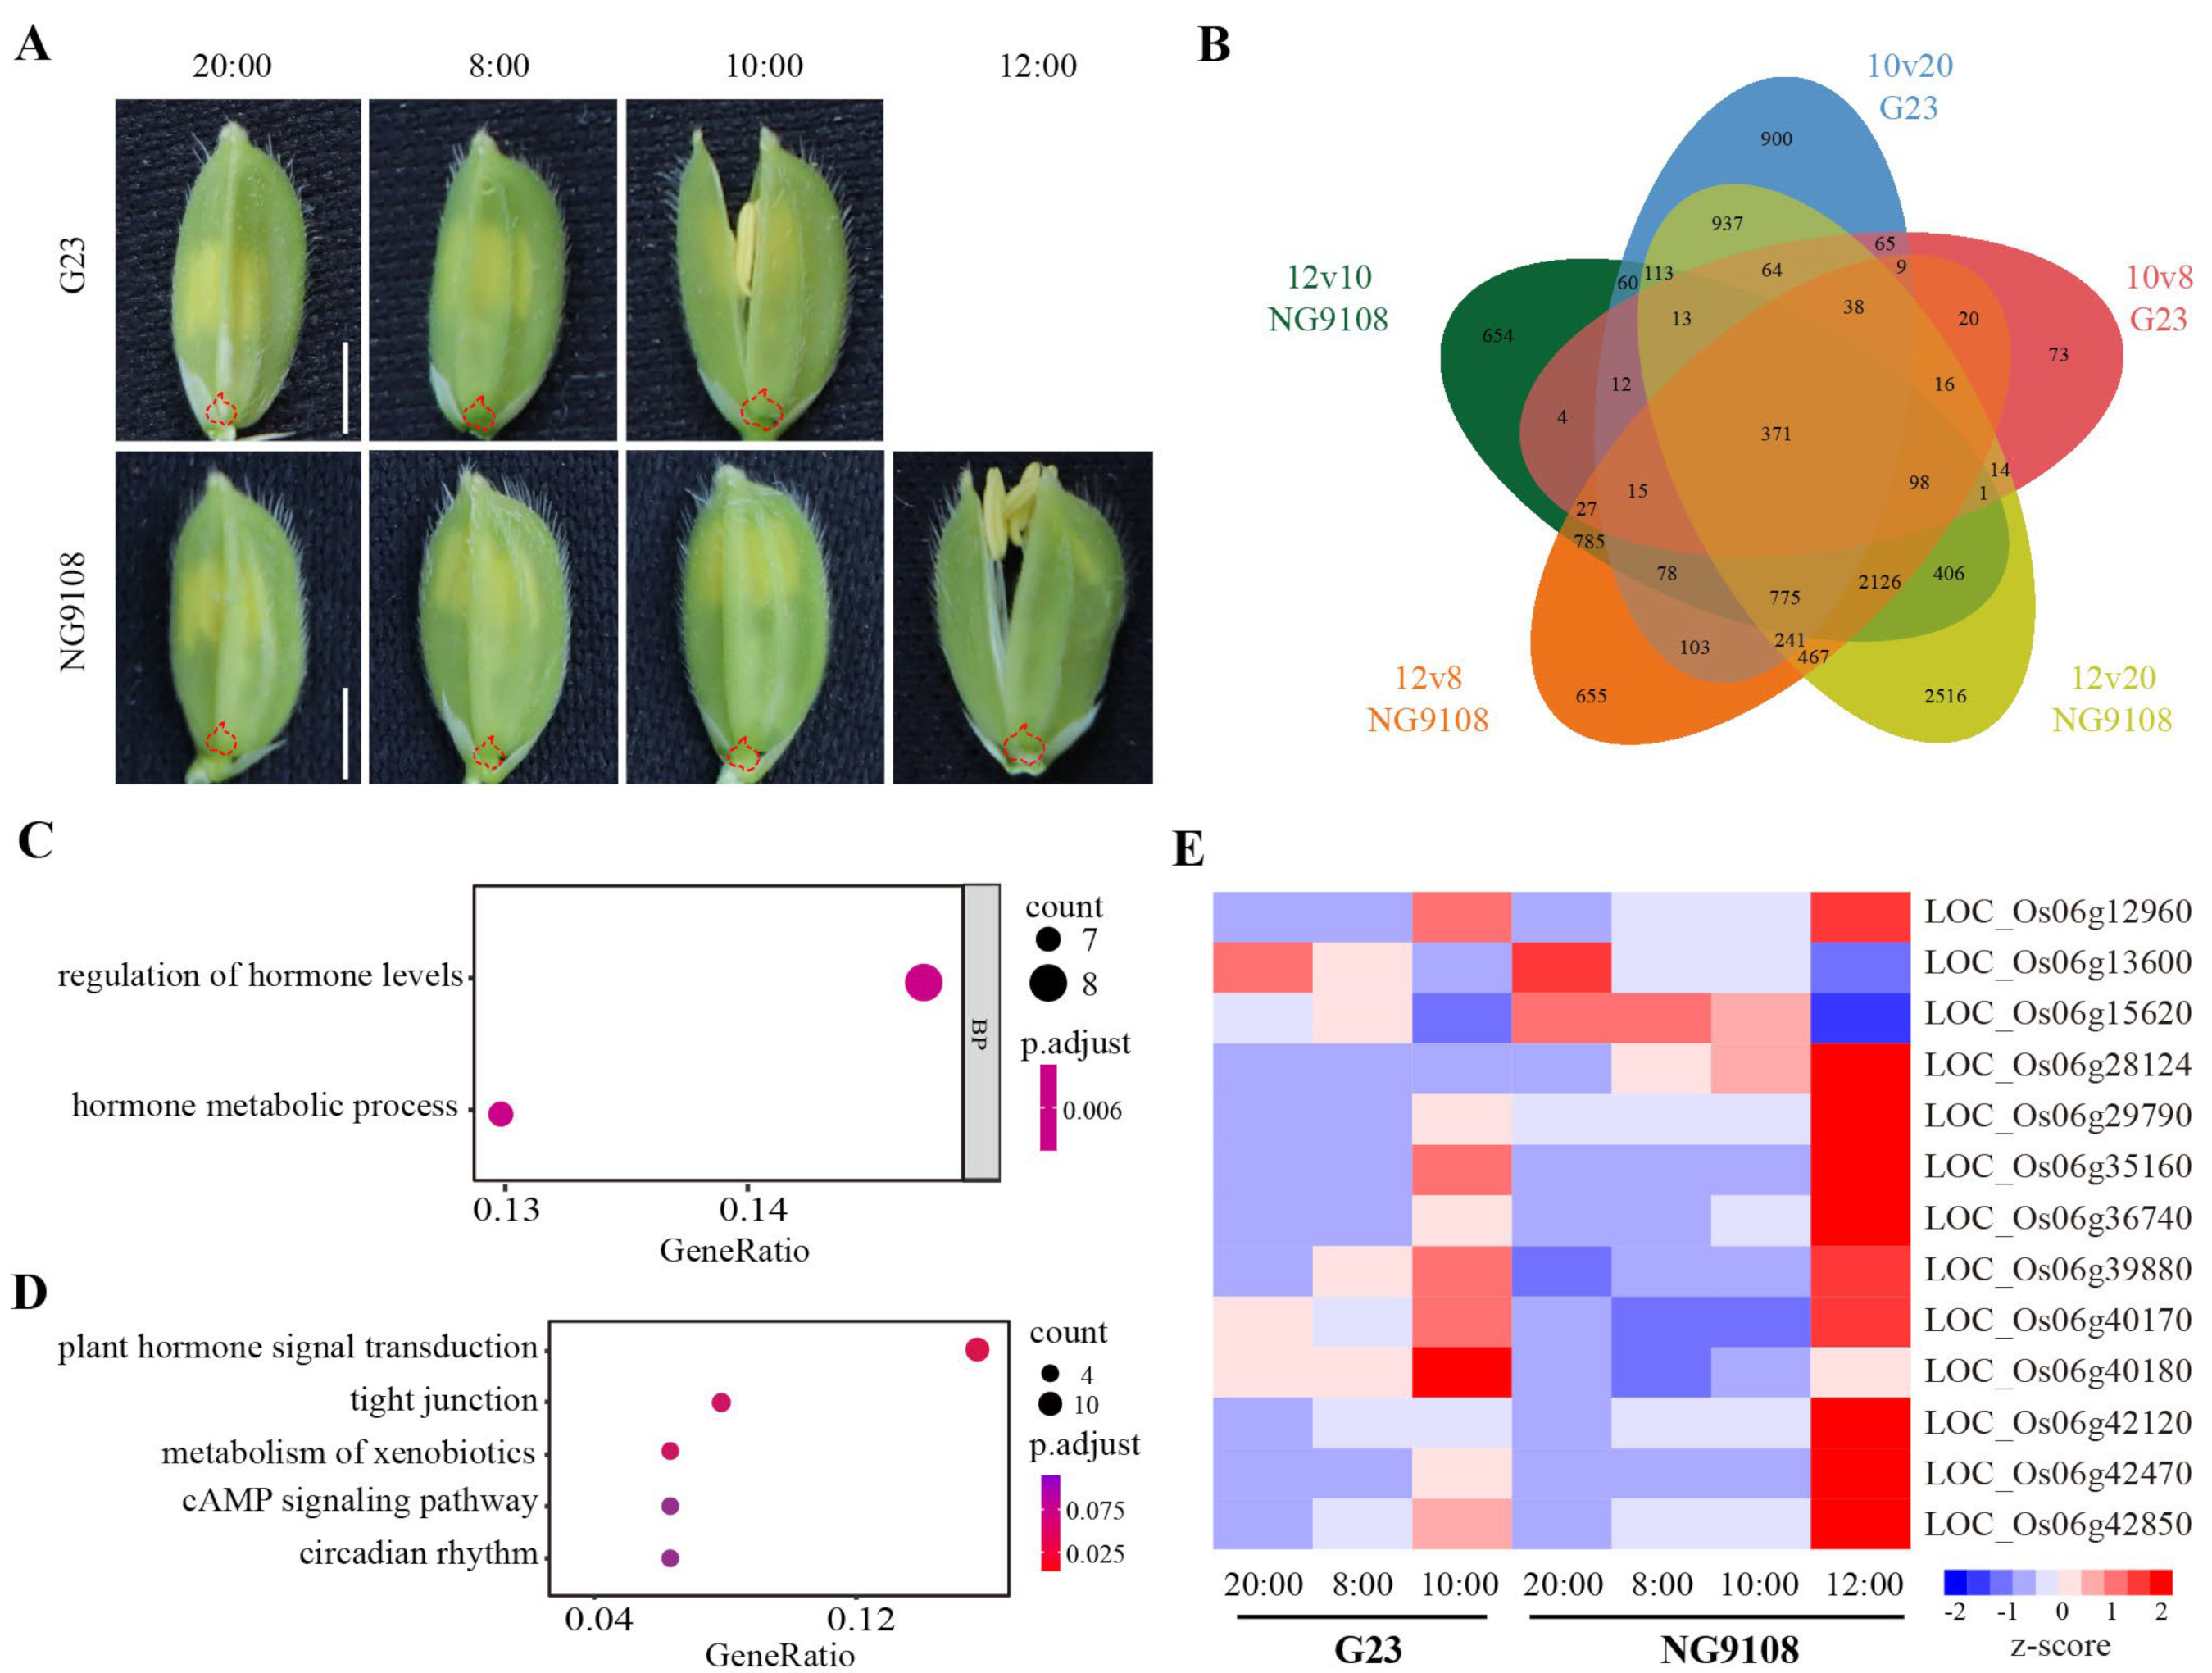
3.4. RNA-seq Analysis and Candidate Genes Selection

Previous studies have shown that the FOT trait is mainly controlled by the expansion and shrinkage of lodicules in rice [10,11,35]. To better understand the potential genes controlling FOT in G23, we thus dissected and collected lodicules of G23 and NG9108 at various time points (20:00, 8:00 and 10:00 for G23 and 20:00, 8:00, 10:00 and 12:00 for NG9108) for RNA-seq analysis. To reduce the background noise, among these time points, 20:00 (the day before flowering) and 8:00 (on the day before FOT) were set as controls to compare with their BFOTs (10:00 for G23 and 12:00 for NG9108) for DEG selection (Figure 4A).
In G23, 3794 genes (10:00 vs. 20:00) and 840 genes (10:00 vs. 8:00) were significantly differentially expressed in the lodicules (Table S5). Of the two comparisons, 587 DEGs were detected in both sections, suggesting that these genes possibly regulated floret opening in G23 (Figure 4B). Meanwhile, 8196 genes (12:00 vs. 20:00), 5824 genes (12:00 vs. 8:00) and 5538 genes (12:00 vs. 10:00) were significantly differentially expressed in NG9108 (Table S5). Integrating the above three comparisons, 3370 significant DEGs were speculated to control floret opening in NG9108 (Figure 4B). Eventually, we combined the 587 DEGs in G23 and the 3370 DEGs in NG9108, and revealed 371 common DEGs (Figure 4B), which were regarded potential candidate genes that regulate floret opening in rice.
To understand which biological processes were involved in floret opening, we performed GO term enrichment and KEGG analysis using the selected 371 DEGs (Figure 4C,D). The GO analysis showed that hormone regulation was most likely involved in regulating floret opening (Figure 4C, Table S6). Further, the KEGG analysis confirmed the role of plant hormone signal transduction in regulating FOT (Figure 4D, Table S7). Together, these data support that these 371 genes play crucial roles in controlling FOT in G23 and NG9108.
Based on the QTL mapping result, we detected a strong signal on chromosome 6 in three years; thus, in order to reveal the potential genes corresponding to early FOT in G23, we further filtered these 371 DEGs and retained only 31 genes located on chromosome 6. Among these 31 DEGs, we found a total of 13 DEGs located within the qFOT6 (6.5–26Mb, an interval combining the three years’ mapping results, Table S3) physical intervals. Nearly all of these genes were highly expressed during the PFOT, while LOC_Os06g13600 and LOC_Os06g15620 were down-regulated in the two parents (Figure 4E, Table S8). At 10:00, these genes were differentially expressed in G23 and NG9108 (Figure 4E). Thus, we speculated that these DEGs are potential candidate genes that regulate early FOT in G23.

4. Discussion

G23, as a japonica rice cultivar with an early FOT occurring at around 10:00–10:30, is an ideal genetic resource for rice breeding. In this study, we mapped a novel and major QTL locus, qFOT6, on chromosome 6, and it was confirmed through multi-year under multi-environment experiments. In addition to qFOT6, some weak signals were also detected on other chromosomes, such as qFOT11 on chromosome 11 and qFOT12 on chromosome 12 (Figure 3A), which were repeatedly detected in F4 and F6, respectively. Thus, we speculated that multiple QTLs, including the major QTL qFOT6 and some minor loci, including qFOT11 and qFOT12, orchestrate to regulate early FOT in G23. These loci do not overlap with the reported FOT loci and genes, indicating that G23 can serve as a novel germplasm for FOT improvement in japonica rice. Moreover, the locations of qFOT6, qFOT11 and qFOT12 also pave the path to clone these genes and excavate their functions. In the future, we will dissect qFOT6 via backcrossing G23 into NG9108 and create a near-isogenic line (NIL) to clone the gene that controls early FOT in G23.
With the RNA sequencing data, we selected 371 DEGs in both G23 and NG9108 by comparing various time points. Both GO and KEGG enrichment analysis of these 371 FOT-correlated DEGs revealed that hormone regulation is indispensable in FOT regulation. Furthermore, upon combining the multi-year QTL mapping results and the RNA-seq data, we found 13 potential candidate genes within the qFOT6 region. Among these genes, we found that two candidates, LOC_Os06g28124 and LOC_Os06g35160, had genetic variations compared to the two parents, suggesting that they likely regulate early FOT in G23. Of them, LOC_Os06g28124 encodes glycosyltransferase (GT). Studies showed that glycosylation is the last step in the biosynthesis of secondary metabolites, and sugar conjugation increases stability and water solubility [36]. Recent studies also revealed that GTs are involved in forming the plant cell wall [37,38] and in cell expansion [39]. Thus, this gene may control FOT by regulating the lodicules’ expansion and shrinkage. For LOC_Os06g35160, it encodes a Ca2+/calmodulin-dependent protein kinase (CaMK). Studies have shown that CaMK is a positive regulator of abscisic acid responses [40,41,42], indicating that this gene might be involved in regulating plant hormones. Although our RNA-seq data highlight these genes as potential candidates, we still cannot rule out the possibility that other genes might control early FOT in G23, and more studies should be carried out to prove these candidate genes’ functions in regulating FOT.
During the evaluation of FOT in our study, we found that various weather conditions, such as rain and cloud, which can considerably delay the normal FOT of the two parents and the populations, were big challenges for FOT phenotyping. Thus, we excluded FOT data under abnormal weather conditions and only kept data collected on sunny days in this study. In addition, we grew the parents every 10 days 5–7 times to ensure that whenever we evaluated FOT in genetic populations, the reference parents’ FOTs were available as controls. These considerations accelerated our genetic mapping of qFOT6 in G23. Moreover, during the FOT investigation, we noticed that the HDs of RIL individuals were different. However, we did not find that the HD interfered with FOT in our populations in the summer.
Interestingly, in the summer of 2022, the extremely high temperature lasted about 40 days, from mid-July to the end of August, in the Jingshan field. We found that the seed-setting rate of G23 was still over 70%, while that of NG9108 was only 30–40%. Although we cannot exclude other possibilities, the early FOT of G23 may enable it to escape high-temperature stress at mid-noon by completing flowering in the cooler morning. Therefore, we believe that the alleles from G23 can be used to produce early FOT rice cultivars to escape heat strikes at anthesis during the daytime, thus reducing yield loss. In addition, the japonica rice G23 starts to blossom at around 9:00 and reaches PFOT at around 10:00–10:30, which largely overlaps with the FOT of numerous indica varieties. Therefore, G23 could be an ideal genetic material to serve as a sterile japonica line with early FOT, and could solve the issue of FOT asynchrony in rice indica–japonica subspecies hybrid breeding.

5. Conclusions

Our work located and confirmed an FOT-dependent QTL, qFOT6, in the japonica rice G23, laying a solid foundation for subsequent fine mapping work. Furthermore, combining RNA-seq results with qFOT6 localization revealed several potential candidate genes associated with FOT. Although no direct evidence proved that these genes were qFOT6, they still might be involved in regulating FOT in G23. Taken together, our results shed light on the cloning of qFOT6 and provide valuable clues for breeding in rice.

Supplementary Materials

The following supporting information can be downloaded at: https://www.mdpi.com/article/10.3390/agriculture13040859/s1. Table S1: The number of new opened spikelets per panicle in the daytime in G23 and NG9108; Table S2: The number of individual plants with FOT in the F2 population during each time interval; Table S3: Mapping information predicted using QTLseqr in 2020, 2021 and 2022; Table S4: Primers used for Icimapping in this study; Table S5: DEGs of different comparisons in G23 and NG9108; Table S6: GO analysis of selected DEGs; Table S7: KEGG analysis of selected DEGs; Table S8: FPKM values of 13 DEGs in lodicule of G23 and NG9108 in chromosome 6.

Author Contributions

X.H. and R.Z. performed the experimental studies. G.C., L.Z., M.X., H.T. and J.N. generated the genetic materials. X.H., R.Z. and M.Z. analyzed the data and performed the computational analyses. X.H. and M.Z. wrote the manuscript with helpful comments and suggestions from all authors. All authors have read and agreed to the published version of the manuscript.

Funding

This work was supported by funding provided to Ming Zhou by the National Key R&D Program of China (2022YFF1001603) and the Hundred-Talent Program of Zhejiang University.

Institutional Review Board Statement

Not applicable.

Data Availability Statement

The datasets used and analyzed in the present study are available upon demand from the corresponding author.

Acknowledgments

We thank Lilan Hong, members of Ming Zhou’s lab and all the authors for their helpful comments and discussions.

Conflicts of Interest

The authors declare no conflict of interest.

References

  1. Li, G.M.; Tang, J.Y.; Zheng, J.K.; Chu, C.C. Exploration of rice yield potential: Decoding agronomic and physiological traits. Crop. J. 2021, 9, 577–589. [Google Scholar] [CrossRef]
  2. Zeng, D.L.; Tian, Z.X.; Rao, Y.C.; Dong, G.J.; Yang, Y.L.; Huang, L.C.; Leng, Y.J.; Xu, J.; Sun, C.; Zhang, G.H.; et al. Rational design of high-yield and superior-quality rice. Nat. Plants 2017, 3, 17031. [Google Scholar] [CrossRef] [PubMed]
  3. Van Doorn, W.G.; Van Meeteren, U. Flower opening and closure: A review. J. Exp. Bot. 2003, 54, 1801–1812. [Google Scholar] [CrossRef] [PubMed]
  4. Yoshida, H.; Nagato, Y. Flower development in rice. J. Exp. Bot. 2011, 62, 4719–4730. [Google Scholar] [CrossRef] [PubMed] [Green Version]
  5. Baliuag, N.N.A.; Redona, E.D.; Hernandez, J.E.; Cruz, P.C.S.; Ye, C.R. Genetic analysis for heat tolerance and early morning flowering traits at flowering stage in rice (Oryza sativa L.). Philipp. J. Crop. Sci. 2015, 40, 62–72. [Google Scholar] [CrossRef] [Green Version]
  6. Wan, G.; Feng, Y.; Zhang, F.J.; Xu, Q.; Wang, Y.P.; Yuan, X.P.; Yu, H.Y.; Peng, S.T. Mapping QTLs for flowering time in rice. Acta Agric. Nucleatae Sin. 2013, 27, 562–567. [Google Scholar] [CrossRef]
  7. Thanh, P.T.; Phan, P.D.T.; Ishikawa, R.; Ishii, T. QTL analysis for flowering time using backcross population between Oryza sativa Nipponbare and O. rufipogon. Genes Genet. Syst. 2010, 85, 273–279. [Google Scholar] [CrossRef] [PubMed] [Green Version]
  8. Zhang, M.; Zhang, H.L.; Dai, D.Q.; Li, X.M.; Chen, J.Y.; Bao, J.S.; Ma, L.Y. Identification of QTLs for rice flower opening time in two environments. Euphytica 2017, 213, 181. [Google Scholar] [CrossRef]
  9. Hirabayashi, H.; Sasaki, K.; Kambe, T.; Gannaban, R.B.; Miras, M.A.; Mendioro, M.S.; Simon, E.V.; Lumanglas, P.D.; Fujita, D.; Takemoto-Kuno, Y.; et al. qEMF3, a novel QTL for the early-morning flowering trait from wild rice, Oryza officinalis, to mitigate heat stress damage at flowering in rice, O. sativa. J. Exp. Bot. 2015, 66, 1227–1236. [Google Scholar] [CrossRef]
  10. Xu, P.Z.; Wu, T.K.; Ali, A.; Zhang, H.Y.; Liao, Y.X.; Chen, X.Q.; Tian, Y.H.; Wang, W.M.; Fu, X.D.; Li, Y.; et al. EARLY MORNING FLOWERING1 (EMF1) regulates the floret opening time by mediating lodicule cell wall formation in rice. Plant Biotechnol. J. 2022, 20, 1441–1443. [Google Scholar] [CrossRef]
  11. Wang, M.M.; Zhu, X.P.; Peng, G.Q.; Liu, M.L.; Zhang, S.Q.; Chen, M.H.; Liao, S.T.; Wei, X.Y.; Xu, P.; Tan, X.Y.; et al. Methylesterification of cell-wall pectin controls the diurnal flower-opening times in rice. Mol. Plant 2022, 15, 956–972. [Google Scholar] [CrossRef] [PubMed]
  12. Bheemanahalli, R.; Sathishraj, R.; Manoharan, M.; Sumanth, H.; Muthurajan, R.; Ishimaru, T.; Krishna, J.S.V. Is early morning flowering an effective trait to minimize heat stress damage during flowering in rice? Field Crop. Res. 2017, 203, 238–242. [Google Scholar] [CrossRef] [PubMed]
  13. Habib-Ur-Rahman, M.; Ahmad, A.; Raza, A.; Hasnain, M.U.; Alharby, H.F.; Alzahrani, Y.M.; Bamagoos, A.A.; Hakeem, K.R.; Ahmad, S.; Nasim, W.; et al. Impact of climate change on agricultural production; issues, challenges, and opportunities in Asia. Front. Plant Sci. 2022, 13, 925548. [Google Scholar] [CrossRef]
  14. Ishimaru, T.; Sasaki, K.; Lumanglas, P.D.; Cabral, C.L.U.; Ye, C.; Yoshimoto, M.; Kumar, A.; Henry, A. Effect of drought stress on flowering characteristics in rice (Oryza sativa L.): A study using genotypes contrasting in drought tolerance and flower opening time. Plant Prod. Sci. 2022, 25, 359–370. [Google Scholar] [CrossRef]
  15. Sun, Q.; Zhao, Y.X.; Zhang, Y.; Chen, S.N.; Ying, Q.; Lv, Z.F.; Che, X.H.; Wang, D.L. Heat stress may cause a significant reduction of rice yield in China under future climate scenarios. Sci. Total. Environ. 2022, 818, 151746. [Google Scholar] [CrossRef] [PubMed]
  16. Wang, Y.L.; Wang, L.; Zhou, J.X.; Hu, S.B.; Chen, H.Z.; Xiang, J.; Zhang, Y.K.; Zeng, Y.J.; Shi, Q.H.; Zhu, D.F.; et al. Research progress on heat stress of rice at flowering stage. Rice Sci. 2019, 26, 1–10. [Google Scholar] [CrossRef]
  17. Song, Y.L.; Wang, C.Y.; Linderholm, H.W.; Fu, Y.; Cai, W.Y.; Xu, J.X.; Zhuang, L.W.; Wu, M.X.; Shi, Y.X.; Wang, G.F.; et al. The negative impact of increasing temperatures on rice yields in southern China. Sci. Total. Environ. 2022, 820, 153262. [Google Scholar] [CrossRef]
  18. Bheemanahalli, R.; Sathishraj, R.; Tack, J.; Nalley, L.L.; Muthurajan, R.; Jagadish, K.S.V. Temperature thresholds for spikelet sterility and associated warming impacts for subtropical rice. Agric. For. Meteorol. 2016, 221, 122–130. [Google Scholar] [CrossRef]
  19. Xu, Y.F.; Chu, C.C.; Yao, S.G. The impact of high-temperature stress on rice: Challenges and solutions. Crop. J. 2021, 9, 963–976. [Google Scholar] [CrossRef]
  20. Jagadish, S.V.K.; Craufurd, P.Q.; Wheeler, T.R. High temperature stress and spikelet fertility in rice (Oryza sativa L.). J. Exp. Bot. 2007, 58, 1627–1635. [Google Scholar] [CrossRef] [Green Version]
  21. Matsui, T.; Omasa, K.; Horie, T. High temperature at flowering inhibits swelling of pollen grains, a driving force for thecae dehiscence in rice (Oryza sativa L.). Plant Prod. Sci. 2000, 3, 430–434. [Google Scholar] [CrossRef]
  22. Rang, Z.W.; Jagadish, S.V.K.; Zhou, Q.M.; Craufurd, P.Q.; Heuer, S. Effect of high temperature and water stress on pollen germination and spikelet fertility in rice. Environ. Exp. Bot. 2011, 70, 58–65. [Google Scholar] [CrossRef] [Green Version]
  23. Ishimaru, T.; Hirabayashi, H.; Kuwagata, T.; Ogawa, T.; Kondo, M. The early-morning flowering trait of rice reduces spikelet sterility under windy and elevated temperature conditions at anthesis. Plant Prod. Sci. 2012, 15, 19–22. [Google Scholar] [CrossRef] [Green Version]
  24. Jagadish, S.V.K.; Murty, M.V.R.; Quick, W.P. Rice responses to rising temperatures—Challenges, perspectives and future directions. Plant Cell Environ. 2015, 38, 1686–1698. [Google Scholar] [CrossRef] [PubMed]
  25. Ishimaru, T.; Hirabayashi, H.; Sasaki, K.; Ye, C.R.; Kobayashi, A. Breeding efforts to mitigate damage by heat stress to spikelet sterility and grain quality. Plant Prod. Sci. 2016, 19, 12–21. [Google Scholar] [CrossRef] [Green Version]
  26. Ishimaru, T.; Hlaing, K.T.; Oo, Y.M.; Lwin, T.M.; Sasaki, K.; Lumanglas, P.D.; Simon, E.V.M.; Myint, T.T.; Hairmansis, A.; Susanto, U.; et al. An early-morning flowering trait in rice can enhance grain yield under heat stress field conditions at flowering stage. Field Crop. Res. 2022, 277, 108400. [Google Scholar] [CrossRef]
  27. Ishimaru, T.; Hirabayashi, H.; Ida, M.; Takai, T.; San-Oh, Y.A.; Yoshinaga, S.; Ando, I.; Ogawa, T.; Kondo, M. A genetic resource for early-morning flowering trait of wild rice Oryza officinalis to mitigate high temperature-induced spikelet sterility at anthesis. Ann. Bot. 2010, 106, 515–520. [Google Scholar] [CrossRef] [Green Version]
  28. Zhang, H.; Xu, C.X.; He, Y.; Zong, J.; Yang, X.J.; Si, H.M.; Sun, Z.X.; Hu, J.P.; Liang, W.Q.; Zhang, D.B. Mutation in CSA creates a new photoperiod-sensitive genic male sterile line applicable for hybrid rice seed production. Proc. Natl. Acad. Sci. USA 2013, 110, 76–81. [Google Scholar] [CrossRef] [Green Version]
  29. Lei, Y.Q.; Song, S.F.; Li, X.Q. Development of technologies for heterosis utilization in rice. Hybrid Rice. 2017, 32, 1–4. [Google Scholar] [CrossRef]
  30. Chu, S.H.; Jiang, W.Z.; Lee, J.; Chin, J.H.; Koh, H.J. QTL analyses of heterosis for grain yield and yield-related traits in indica-japonica crosses of rice (Oryza sativa L.). Genes Genom. 2012, 34, 367–377. [Google Scholar] [CrossRef]
  31. Hu, N.; Cao, M.H.; Jiang, X.D.; Hu, J.C.; Yao, K.M. Estimating model for rice flowering habit with different rice varieties. Chin. J. Agrometeorol. 2013, 34, 440–446. [Google Scholar] [CrossRef]
  32. Liu, L.; Zou, Z.S.; Qian, K.; Xia, C.; He, Y.; Zeng, H.L.; Zhou, X.; Riemann, M.; Yin, C.X. Jasmonic acid deficiency leads to scattered floret opening time in cytoplasmic male sterile rice Zhenshan 97A. J. Exp. Bot. 2017, 68, 4613–4625. [Google Scholar] [CrossRef] [Green Version]
  33. Rani, B.; Sharma, V.K. A modified CTAB method for quick extraction of genomic DNA from rice seed/grain/leaves for PCR analysis. Int. J. Sci. Res. Methodol. 2016, 4, 254–260. [Google Scholar]
  34. Chen, S.F.; Zhou, Y.Q.; Chen, Y.R.; Gu, J. fastp: An ultra-fast all-in-one FASTQ preprocessor. Bioinformatics 2018, 34, i884–i890. [Google Scholar] [CrossRef] [PubMed]
  35. Heslop-Harrison, Y.H.; Heslop-Harrison, J.S. Lodicule function and filament extension in the grasses: Potassium ion movement and tissue specialization. Ann. Bot. 1996, 77, 573–582. [Google Scholar] [CrossRef]
  36. Lairson, L.L.; Henrissat, B.; Davies, G.J.; Withers, S.G. Glycosyltransferases: Structures, functions, and mechanisms. Annu. Rev. Biochem. 2008, 77, 521–555. [Google Scholar] [CrossRef] [Green Version]
  37. Kong, W.L.; Gong, Z.Y.; Zhong, H.; Zhang, Y.; Zhao, G.Q.; Gautam, M.; Deng, X.X.; Liu, C.; Zhang, C.H.; Li, Y.S. Expansion and evolutionary patterns of glycosyltransferase family 8 in gramineae crop genomes and their expression under salt and cold stresses in Oryza sativa ssp. japonica. Biomolecules 2019, 9, 188. [Google Scholar] [CrossRef] [Green Version]
  38. Hirano, K.; Aya, K.; Morinaka, Y.; Nagamatsu, S.; Sato, Y.; Antonio, B.A.; Namiki, N.; Nagamura, Y.; Matsuoka, M. Survey of genes involved in rice secondary cell wall formation through a co-expression network. Plant Cell Physiol. 2013, 54, 1803–1821. [Google Scholar] [CrossRef] [Green Version]
  39. Dong, N.Q.; Sun, Y.W.; Guo, T.; Shi, C.L.; Zhang, Y.M.; Kan, Y.; Xiang, Y.H.; Zhang, H.; Yang, Y.B.; Li, Y.C.; et al. UDP-glucosyltransferase regulates grain size and abiotic stress tolerance associated with metabolic flux redirection in rice. Nat. Commun. 2020, 11, 2629. [Google Scholar] [CrossRef]
  40. Ma, F.F.; Lu, R.; Liu, H.Y.; Shi, B.; Zhang, J.H.; Tan, M.P.; Zhang, A.Y.; Jiang, M.Y. Nitric oxide-activated calcium/calmodulin-dependent protein kinase regulates the abscisic acid-induced antioxidant defence in maize. J. Exp. Bot. 2012, 63, 4835–4847. [Google Scholar] [CrossRef]
  41. Chen, M.; Ni, L.; Chen, J.; Sun, M.; Qin, C.H.; Zhang, G.; Zhang, A.Y.; Jiang, M.Y. Rice calcium/calmodulin-dependent protein kinase directly phosphorylates a mitogen-activated protein kinase kinase to regulate abscisic acid responses. Plant Cell 2021, 33, 1790–1812. [Google Scholar] [CrossRef] [PubMed]
  42. Ni, L.; Fu, X.P.; Zhang, H.; Li, X.; Cai, X.; Zhang, P.P.; Liu, L.; Wang, Q.W.; Sun, M.M.; Wang, Q.W.; et al. Abscisic acid inhibits rice protein phosphatase PP45 via H2O2 and relieves repression of the Ca2+/CaM-dependent protein kinase DMI3. Plant Cell 2019, 31, 128–152. [Google Scholar] [CrossRef] [PubMed] [Green Version]
Figure 1. Dynamics of FOT in both G23 and NG9108. (A) Characteristics of FOT in G23 (top) and NG9108 (bottom) during the daytime. The scale bar of the panicles equals 5 cm. The bar for single florets is 2 mm. (B) Statistics of the newly opened florets in a 30 min interval from 8:00 to 14:00 in G23 and NG9108. Bars indicate the mean ± standard deviation.
Agriculture 13 00859 g001
Figure 2. Genetic analysis and QTL mapping of FOT in G23. (A) Frequency distribution of FOT in the F2 population derived from a cross between G23 and NG9108. For X-axis value: grade 1: 9:30–10:00, grade 2: 10:00–10:30, grade 3: 10:30–11:00, grade 4: 11:00–11:30, grade 5: 11:30–12:00, grade 6: 12:00–12:30, grade 7: 12:30–13:00, grade 8: 13:00–13:30, and grade 9: 13:30–14:00. Arrows indicate the corresponding grades of the parents’ FOT. (B) The number of mixed pools in each population. BSA-E: the early FOT mixed pool for QTLseqr analysis, BSA-L: the late FOT mixed pool for QTLseqr analysis, GPS1-4: four grade pools for GPS analysis. “nd” means no data. (C) QTL mapping of FOT in G23 identified using QTLseqr (top). Plots were produced via the plotQTLStats function with a l Mb sliding window. Y-axis represents the G’ value. The red line represents the threshold line with a confidence level of 0.99. QTL mapping of FOT in G23 was performed via GPS (bottom). After reducing background noise, the results were obtained and were presented as ratio plots. Y-axis value corresponds to ratio. A value of 400 kb was set as the defined genomic interval, and 20 was set as the threshold for highly significant variants. X-axis represents the chromosome interval.
Agriculture 13 00859 g002
Figure 3. The multi-year verification of qFOT6. (A) The QTL mapping of FOT in G23 was performed using the QTLseqr method in the F4 (top) and F6 (bottom) RIL populations. Plots were produced using the plotQTLStats function with a l Mb sliding window. Y-axis represents G′ value. The red lines represent the threshold line with a confidence level of 0.99. X-axis represents the chromosome interval. (B) Genetic linkage map and the location of qFOT6 detected in different populations. The names and positions of markers in centimorgans (cM) are given on the left and right sides separately.
Agriculture 13 00859 g003
Figure 4. RNA-seq analysis of lodicules to screen candidates regulating early FOT in G23. (A) Schematic diagrams of the spikelet opening states at various time points for lodicule collection and RNA extraction. The red dotted lines showed the positions and possible sizes of lodicules inside lemma and palea. (B) Venn diagram of overlapped DEGs in lodicules at various time points between G23 and NG9108. (C) GO analysis of potential 371 FOT-regulating genes. The circle size represents the gene number, while the circle color represents the value of p.adjust. (D) KEGG analysis of 371 potential FOT-regulating genes. Circle size represents the gene number, while circle color represents the value of p.adjust. (E) Heat map of 13 potential candidate genes within qFOT6 region. Changes in expression levels are displayed from blue (down-regulated) to red (up-regulated). The numbers of the color scales are the z-score transformed from the average fragments per kilobase of transcript per million mapped reads (FPKM) value of three repeated experiments.
Agriculture 13 00859 g004
Table 1. Identification of qFOT6 using composite interval mapping in F2.
Chr aLocusLeft MarkerRight MarkerLOD b ValuePVE (%) cAdd dDom e
6qFOT6D6D723.6237.03−0.0329−0.0075
a chromosome; b likelihood of odd; c phenotypic variation; d additive effects; e dominance effects.
Disclaimer/Publisher’s Note: The statements, opinions and data contained in all publications are solely those of the individual author(s) and contributor(s) and not of MDPI and/or the editor(s). MDPI and/or the editor(s) disclaim responsibility for any injury to people or property resulting from any ideas, methods, instructions or products referred to in the content.

