Article

Mind the Market Opportunity: Digital Energy Management Services for German Dairy Farmers

Agricultural System Engineering, Technical University of Munich, Duernast 10, 85354 Freising, Germany
*
Author to whom correspondence should be addressed.
Agriculture 2023, 13(4), 861; https://doi.org/10.3390/agriculture13040861
Submission received: 12 March 2023 / Revised: 5 April 2023 / Accepted: 11 April 2023 / Published: 13 April 2023
(This article belongs to the Section Agricultural Economics, Policies and Rural Management)

Abstract

:
The adoption of farm management information systems (FMIS) is on the rise at German dairy farms given their benefits in supporting and automating decision-making processes. However, the offering scope of FMIS for dairy farmers is limited, with digital services mostly focusing on animal-related data and overall economic insights. By contrast, digital energy management services (DEMS) are not yet established as an integral part of FMIS despite their expected positive contribution to a dairy farm’s ecological sustainability and profitability. Against this background, the aim of this study was to find out if there is a hitherto undetected market opportunity for FMIS providers offering DEMS to German dairy farmers. To achieve this aim, the as-is market offering was screened looking at seven pre-defined DEMS, and customer preferences were investigated based on online survey responses from 74 German dairy farmers. Results of the survey indicate a high relevance of DEMS, which especially applies for optimization-oriented energy data analyses. The market coverage of such digital services, on the other hand, is not yet adequate. Hence, for providers of FMIS, we see a promising market opportunity to expand their offering by starting to deploy selected DEMS to German dairy farmers.

1. Introduction

“The German dairy industry is the most important branch of the German agricultural and food industry and occupies a leading position within the EU.” [1]. That is why dairy farmers are in special focus among the public, e.g., with regard to ecological sustainability and animal welfare aspects. To manage this responsibility, German dairy farmers increasingly rely on technology and value the benefits of automation and digitalization [1]. In this context, the highest adoption at German dairy farms is shown for so-called Farm Management Information Systems (FMIS), which provide digital services to farmers and other relevant stakeholders via multi-functional online platforms [2,3,4,5]. Today, in practice, FMIS for dairy farms typically include digital herd management and health monitoring services focusing on animal-related data (e.g., weight, milk yield, and first calving age) [1,6]. Demand for this kind of digital service is high given their direct impact on a herd’s animal welfare and health [1], leading to measurable improvements in dairy farms’ most relevant income streams (milk and animal sales) [7]. Furthermore, the data basis enabling such digital services is retrievable from a variety of embedded systems (e.g., cow transponders) and cyber-physical systems (e.g., automatic milking systems), whose adoption is on the rise at German dairy barns [3,5,8]. Furthermore, although data transfer among those systems often still requires manual effort from the farmer [8], the functionality of digital herd management and health monitoring services is already very advanced, including the application of artificial intelligence (AI) data analytics [9].
By contrast, digital services on ecological sustainability for dairy farmers, comprising Greenhouse Gas (GHG) emission calculators and digital energy management services (DEMS), are not yet even in the scope of most FMIS [6,8]. However, the necessity of having such services is high given their expected contribution to achieving global sustainability goals [10]. In this context, especially for DEMS, technical prerequisites and economic incentives preexist. While input data for GHG emission calculators typically have to be collected manually by the farmer [11], the data basis for DEMS can be gathered automatically via a central control unit from on-farm energy production systems (e.g., photovoltaic systems), energy storage solutions (e.g., electric batteries), and energy consuming technology (e.g., lightning and automatic feeding systems) [12]. Furthermore, DEMS can have a positive impact on the economic situation of a farm, e.g., by increasing revenues through electricity sales and energy data sharing [13] or by reducing costs through energy savings [14]. For example, since the spot market price for electricity in Germany rose from 4.87 cent kWh−1 in February 2021 to almost 13 cent kWh−1 in February 2023 [15], farms were able to significantly increase their revenues when selling energy directly to others [13]. Moreover, findings from [16] show that the electricity consumption at dairy farms ranges from 0.039 to 0.073 kWh per kg of milk produced, which reveals a savings potential of almost 47% for high-consuming farms, that at least can be partially realized through the application of DEMS (e.g., with the help of data analyses on energy consumption patterns [17]). Next to such economic benefits, an application of DEMS is also supposed to support a farmer in his day-to-day business, e.g., by predicting outages of farm equipment [14] or by visually processing on-farm energy data [18] and comparing it to peer and industry benchmarks [17].
Against this background, offering DEMS to German dairy farmers might be a promising market opportunity for providers of FMIS. However, in the literature, no comprehensive study on this hypothesis could be found. Instead, the state of the art on energy management at dairy farms is primarily looking at physical systems (such as energy consuming farm equipment and energy generation technology) and, e.g., their impact on a farm’s total energy consumption, energy generation capacity, and environmental footprint [19]. Research on digital farming solutions for energy management in the dairy sector, however, is rare [13,20]. With this in mind, the present study aims to evaluate the market opportunity for offering DEMS to German dairy farmers by scanning customer needs and analyzing the competitor landscape [21], in order to test the following three hypotheses: (1) The relevance of DEMS for German dairy farms is high; (2) it varies significantly across farms; and (3) the market offering (maturity, function scope, and quantity) of DEMS for German dairy farmers is low. To test these hypotheses, we conducted a German-wide online survey for dairy farmers to receive insights on the target market and reviewed the DEMS offering for German dairy farmers from both academia and industry.

2. Materials and Methods

2.1. Selection of DEMS and Set-Up of Our Online Survey for German Dairy Farmers

To address the research target of this study, we considered seven DEMS from [20] in the scope of our analysis (Table 1), which were selected due to their already high adoption in other industries [18], high attention from academia [14,17], or due to a proven economic relevance for the dairy sector [13]. The market interest in these DEMS was analyzed with the help of online survey responses collected in the period from September 2022 to January 2023. In this survey, farmers were asked to share: (1) personal data (e.g., age) and general insights on the farm itself (e.g., location, herd size); (2) information on the as-is status of the farm’s energy management (e.g., installed electricity generation systems) and its adoption of digital services; (3) insights on the farm’s strategic goals with regard to its energy management (e.g., investment plans); (4) an evaluation of the seven pre-defined DEMS with respect to their relevance for the farm; and (5) concerns regarding the application of DEMS. Farmers were approached either directly (using publicly available contact data from the German Chambers of Agriculture), via social media (Instagram, Facebook, WhatsApp), or through partner companies of our Chair (three agri-service firms and one dairy factory)—all located in Bavaria or North Rhine-Westphalia (NRW). During the course of this data gathering, we strived to collect responses from farms with different characteristics (e.g., dairy herd size, milking yield) and did not specifically contact farms with an outstanding interest in energy management. In total, 237 responses from German dairy farmers were collected, of which 74 data sets—hereafter referred to as our sample—contained comprehensive and causally reasonable responses regarding the five survey blocks listed above. Hence, a relatively high share of questionnaires (69%) was not usable to test this study’s hypotheses, which comes from the set-up of the survey (participants had the option to skip questions) and the novelty of the topic (38% of our survey participants did not provide a complete evaluation on the relevance of DEMS).

2.2. Characteristics of the Survey Sample

In the sample, respondents are between 23 and 63 years old, with a majority having the farm located in Bavaria (61%) or NRW (32%). In 2021, the sample farms’ herd size averaged 115 dairy cows with an annual milking yield of 8877 kg per cow. On average, 143 ha of land are cultivated per farm. A comparison of these farm characteristics with insights from the European Farm Accountancy Data Network (FADN) reveals that the mean farm size of the sample is almost 62% bigger compared with the German dairy farm population, while showing a comparable milk yield (Figure 1) [23]. Beyond that, the sample includes a disproportionately high number of farms from NRW [23], which might come from our selected way of distributing the survey. Looking at additional measures to characterize the sample, 18% stated to not only distribute their milk via a dairy factory but also to have a direct marketing channel. On top of that, 22% of the sample identified as organic farms, and 88% of the respondents are convinced that their farms will remain in existence for at least the next 15 years. Furthermore, most survey participants (91%) claimed to not only do dairy farming but to also be active in other agri-business segments, such as crop farming (70%), forestry (57%) and cattle breeding/fattening (46%). Moreover, all sample farms have renewable energy generation systems on site. All respondents in the sample stated to have photovoltaic (PV) systems installed, while 41% of them indicated to also operate other renewable energy generation systems such as biogas or wind. In this context, it is relevant to know that findings from the Arla Climate Check Report with 1309 responses from German dairy farmers indicate that the share of German farms generating energy is significantly smaller compared with the sample (Figure 1) [24].
The total amount of electricity produced per farm ranged from 2 to 7150 MWh in 2021, whereas those farms with multiple energy generation systems showed an above-average electricity yield (Figure 2). The highest output is generated by farms with wind turbines (3051 MWh per farm). Sample farms with solely PV systems produced on average 64 MWh of electricity in 2021. Furthermore, the sample’s mean electricity consumption (0.074 kWh per kg of milk produced; 644 kWh per cow) fits with the current state-of-the-art [16,25]. To calculate these values, we asked the survey participants to claim if private electricity use was considered part of the farm’s total power consumption and excluded such private electricity use, by taking into account the number of household members (1–2; >3) per farm and data from [26]. In the end, as expected [12], there is an overall electricity surplus among the sample farms, with an average electricity generation of 462 MWh and a mean electricity consumption of 76 MWh per farm (Figure 2).
However, not all sample farms but around three quarters (72%) generated more electricity than they consumed in 2021. Moreover, the generated electricity was not fully utilized by the farm itself but was partly distributed to the grid (Figure 3a). This on-farm power utilization rate significantly varied among the sample farms: While 38% distributed all of their electricity, 7% specified their on-farm power utilization rate as being above 60%. An on-farm electricity use of at least 80% was not reached by any of the sample farms. However, farms with an electric storage system installed (20%) showed, on average, a higher on-farm utilization of the self-generated electricity: 47% of those sample farms achieved an on-farm power utilization above 40%. Even though comparable effects were not observable for other storage systems, most of the respondents within the sample relied on thermal storage solutions (65%), followed by cold (15%) and gas (11%), respectively (Figure 3b). In this context, 26% of the sample farms stated that they had multiple energy storage systems, while 19% did not have any at all.

2.3. Approach for Screening the as-is Market Offering

In order to evaluate the market opportunity for DEMS offered to German dairy farmers and hence test the third hypothesis of this study, next to analyzing customer needs, we also had to look at the as-is market offering. To do so, we loosely followed the method of [27], i.e., (1) searched for DEMS provided to German dairy farmers; (2) collected and documented insights on the as-is market offering; and (3) analyzed the compiled dataset. In this context, search results were generated by screening both white and gray literature, including online articles, websites, and agri-magazines, as well as products presented at agri-exhibitions. In the style of ref. [27], a data collection template was used in order to document results from our market screening in a structured manner. In this context, we determined which DEMS are associated with the found market solutions and analyzed the as-is market offering with a focus on the maturity, function scope, and quantitative availability of DEMS tailor-made for German dairy farmers.

3. Results

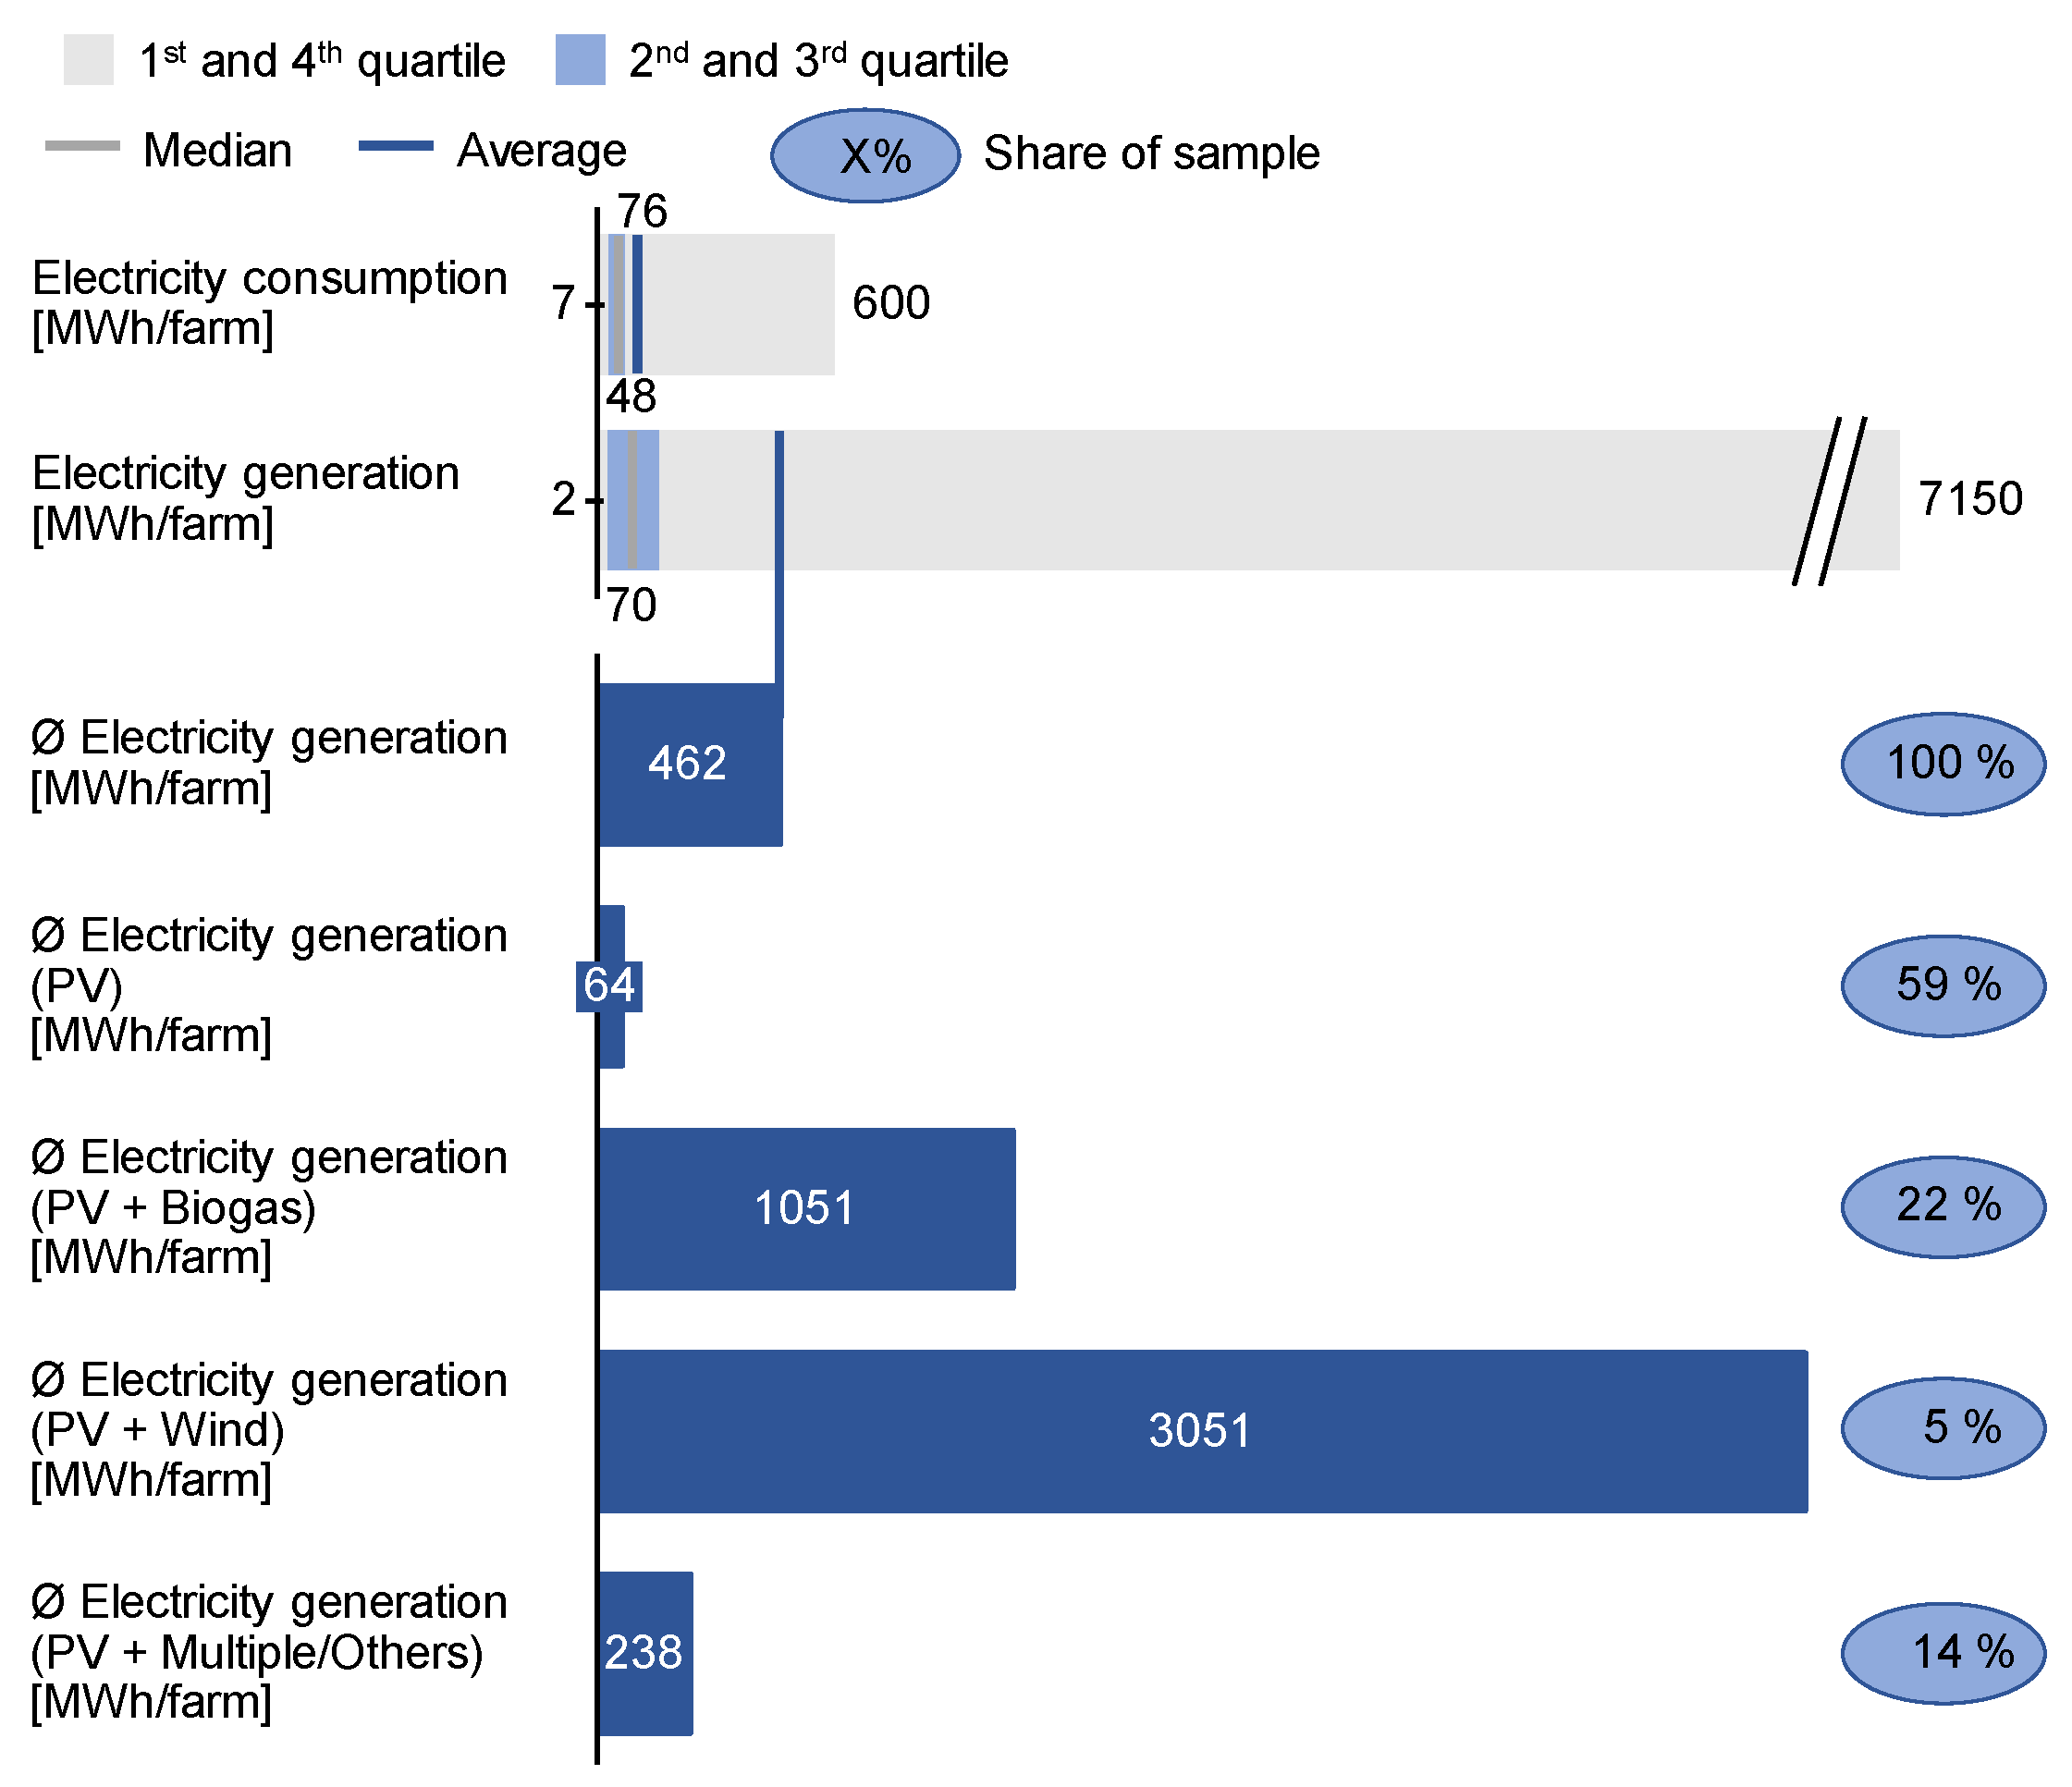
3.1. Market Relevance of DEMS for German Dairy Farms

In order to measure the interest from German dairy farmers in DEMS and hence test the first hypothesis of this study, survey participants were asked to rate the relevance of DEMS for their farms on a scale from 1 to 4, with the option to abstain (Figure 4). In this study, it was shown that the overall interest in DEMS is high, as reflected by an average evaluation of 2.9. In this context, the assessment varies across the seven pre-defined DEMS, with a highest score of 3.4 shown for energy data analysis (process optimization). Similarly good assessments (3.2 and 3.0) were generated for energy data visualization, knowledge service (energy management in the dairy sector), energy marketplace, and energy-related documentation and inquiries. With a score of 2.7, the relevance of energy data analysis (predictive maintenance) was assessed as relatively low. Nevertheless, the lowest score (2.2) was gathered for energy data marketplaces—a result that could come from the general caution of German farmers to share data with others, especially when data rights are unclear [5]. Against this background, the first hypothesis of this study can be confirmed, although there are case-specific differences in the relevance of DEMS. On top of that, 5–11% of the sample did not provide an assessment on the relevance of DEMS (i.e., responded with ‘n/a’), which can be seen as an indicator for the novelty of the research field (i.e., German dairy farmers have been barely confronted with similar research questions).
Given that farm characteristics such as farm size or the farmer’s age can have an impact on the adoption rate of digital services at farms [28] and hence also on the relevance of DEMS, the sample’s assessment from Figure 4 was analyzed in more detail (Table 2). Hence, in order to test the second hypothesis of this study, it was investigated whether the sample’s assessment of DEMS significantly varied in dependence on selected farm characteristics. To do so, for figures with continuous values (such as total electricity generation), we differentiated between sample farms with values below the respective median (M) and those with values equal to or higher M. Furthermore, for cases with an observed deviation of more than 0.20 points from the average assessment of a DEMS, we conducted a chi-squared test to look for significant differences (p < 0.05) [29]. Results of this analysis show that in the case of three DEMS—energy data analysis (process optimization), knowledge service (energy management in the dairy sector), and energy-related documentation and inquiries–only low deviations were observed, i.e., deviations below 0.20 points from the average assessment of the respective DEMS. In the case of the other four DEMS—energy data visualization, energy data analysis (predictive maintenance), energy marketplace, and energy data marketplace—six Chi-squared tests were conducted with none of them indicating significant dependence between the sample farm characteristics and the relevance assessment of DEMS (p < 0.05). The highest correlation was shown between the dairy herd size and the relevance of energy data visualization (p = 0.0582). Hence, the second hypothesis of this study has to be rejected since there is no indication for the necessity of segmenting customers when providing DEMS to German dairy farmers. Instead, it is more important to consider the differences in digital service valuation across DEMS, i.e., to prioritize DEMS with a higher value for dairy farmers.

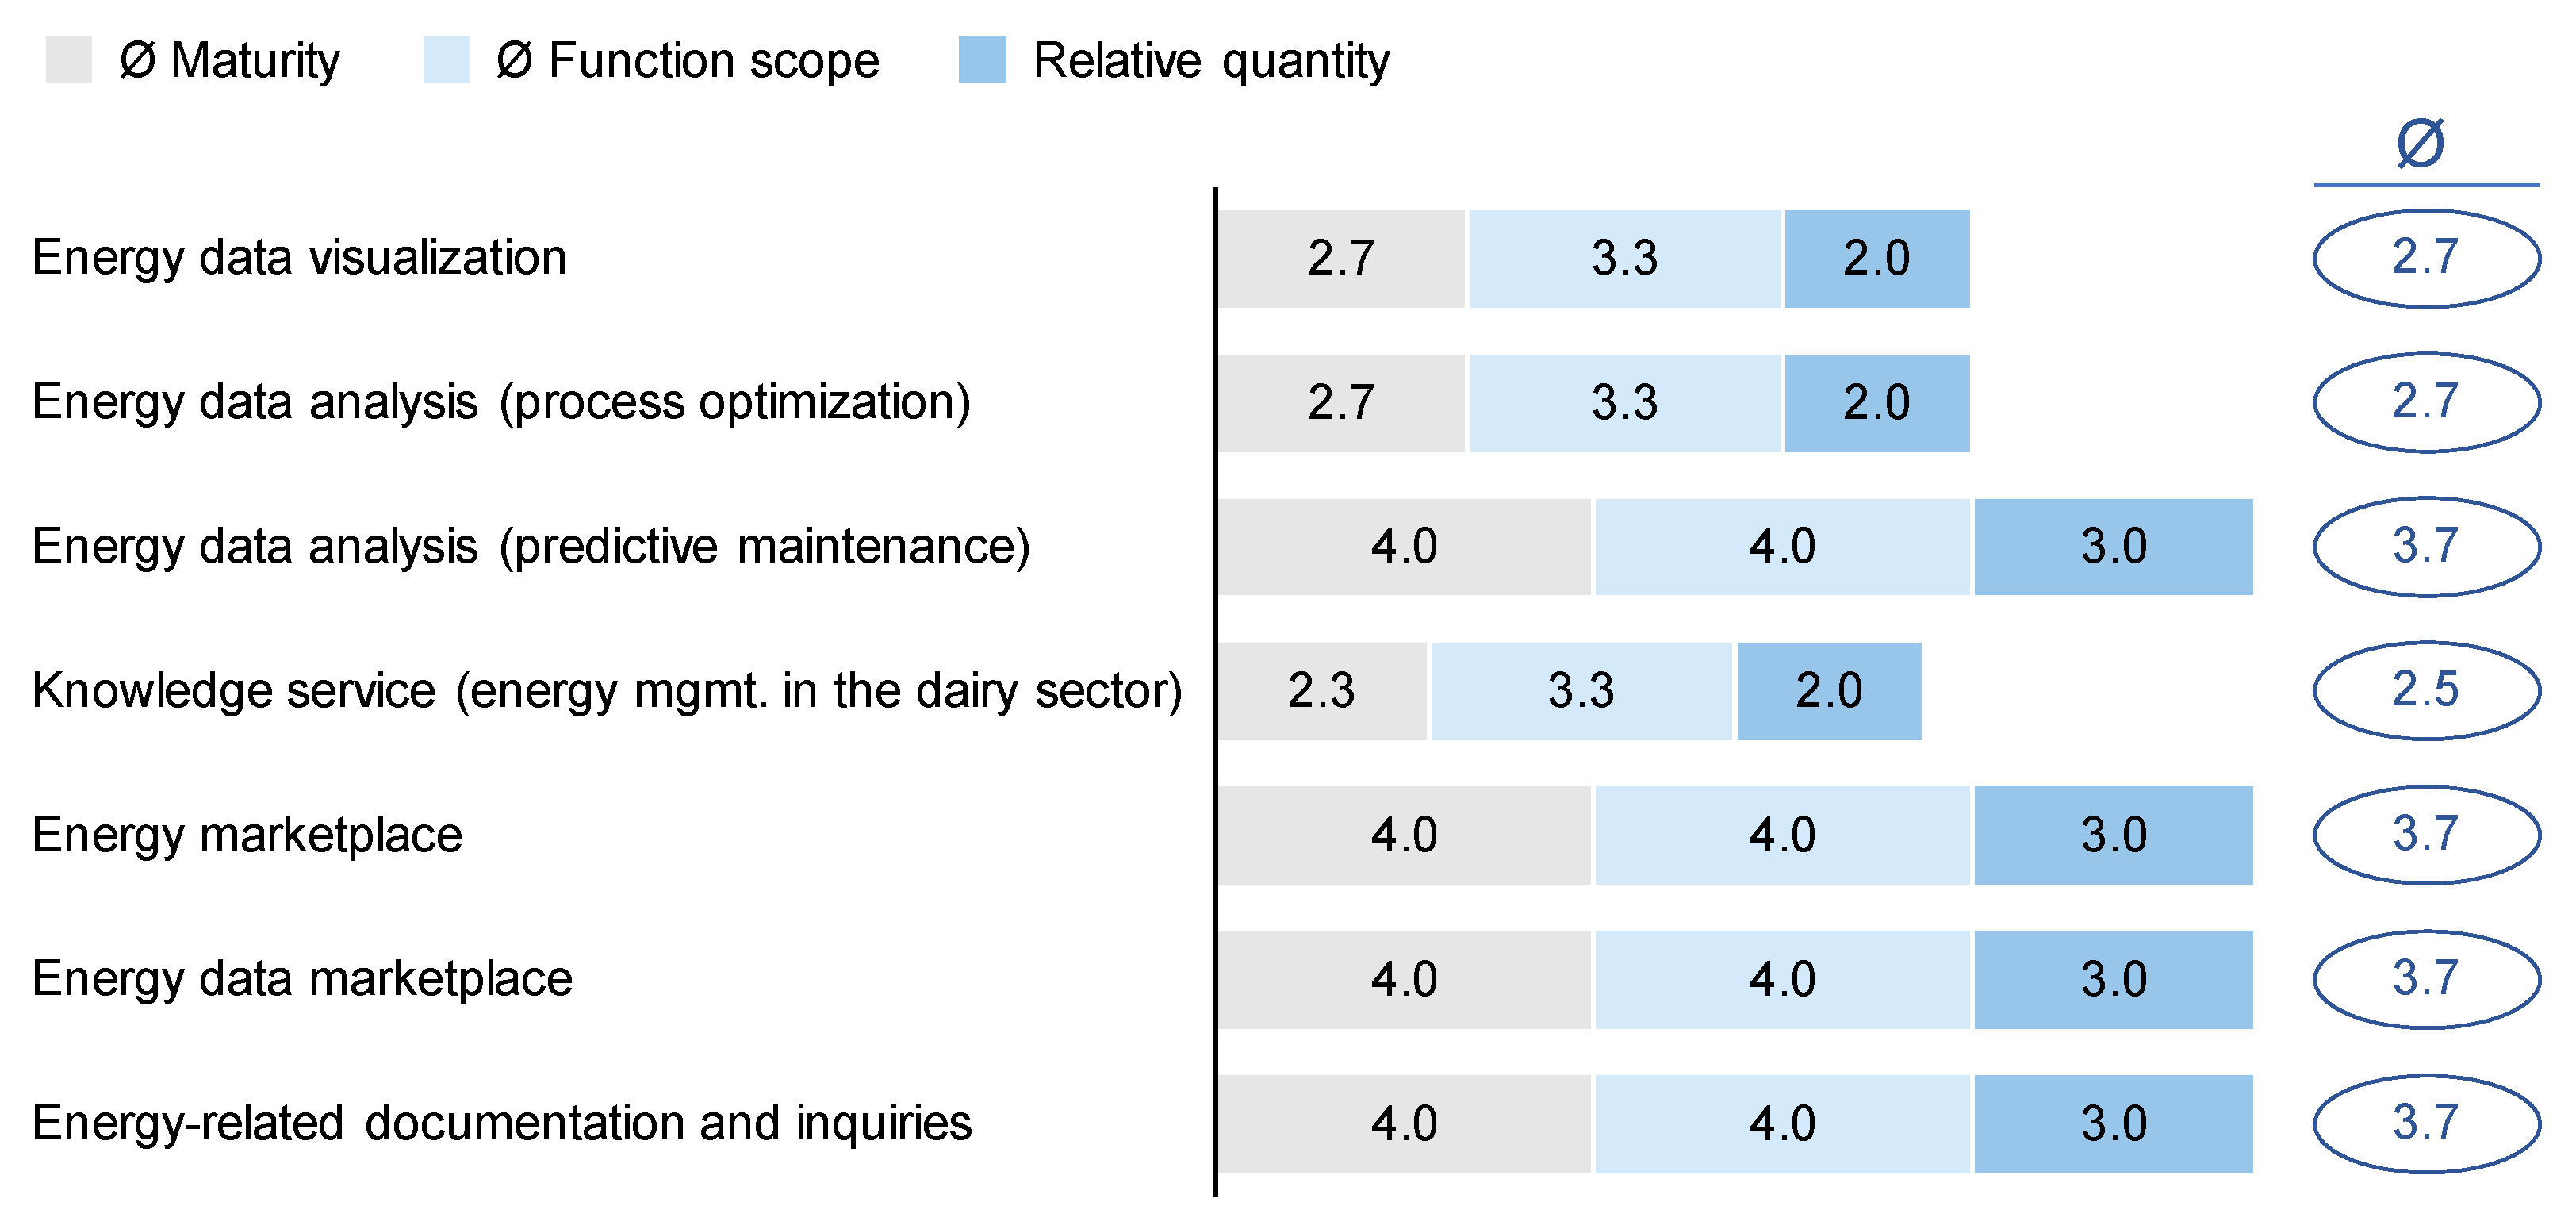
3.2. As-is Market Offering of DEMS for German Dairy Farmers

In the context of our work, we identified only four market solutions that provide at least one of the seven pre-defined DEMS tailored to German dairy farms. Hence, in order to test the third hypothesis of our study, the DEMS of these market solutions were rated on a scale from 1 to 4 while focusing on the following three dimensions: maturity, function scope, and relative quantity of DEMS (Table 3). In this context, the maturity of a DEMS was assessed by determining its technology readiness level (TRL) [30], while the relative quantity was measured across the seven pre-defined DEMS.
As a result, the as-is market offering of DEMS tailored to German dairy farmers turned out to be very limited, so that the third hypothesis of this study can be confirmed. Solutions are available that provide energy data visualization, optimization-oriented energy data analyses, and sector-relevant insights on energy management (Figure 5). Other DEMS are not yet available at an adequate TRL or are not tailored to the special needs of German dairy farms. Overall, the as-is market offering for German dairy farms lacks richness in functionality, such as the visualization of energy-related financial insights or the detection of farm system outages based on energy data. The existing function scope of the as-is market offering is outlined below.
The energy management system “CowEnergy”, which was introduced by ref. [12], is already implemented at a German dairy farm and includes, in addition next to physical systems, a selection of DEMS. The “CowEnergy” solution visualizes farm system-specific energy generation and consumption over time as well as the amount of stored energy. Besides that, “CowEnergy” processes generic data, e.g., to serve the farmer with insights on the German power grid [31], and also does automated energy data analyses optimizing a farm’s on-farm power utilization [12]. Comparable research targets are pursued by the “SmartFarm” project [32], while both solutions focus on providing physical energy management systems. As opposed to that, in 2022, a concept called “DairyChainEnergy” was introduced by ref. [13] aiming to provide DEMS to stakeholders of the German dairy sector. The targeted function scope of “DairyChainEnergy” comprises all seven DEMS in the scope of this study; the solution, however, is still at TRL 1. By contrast, a market solution that has already been tested by more than seven thousand German dairy farmers is the QM-Milch sustainability tool. Within this tool, a farmer provides manual input data on ecological, economic, social, and animal welfare issues. Hence, the focus of the QM-Milch sustainability tool is not only on farms’ energy management; however, the farmer is able to receive insights from peer benchmarks [33].
Next to these four solutions, there are also other DEMS available in the German market that are not tailored to dairy farms but rather suitable for a wider range of companies and private households. For example, “Cells Energy” is a marketplace that enables direct marketing for selling generated electricity to others [34], and providers of energy generation technology typically offer digital maintenance services to their customers [35,36]. However, due to their broad customer bases, those solutions are not able to holistically address the needs of dairy farmers. For example, predictive maintenance services based on energy data should not be limited to an energy generation system of one specific provider but should cover all relevant systems at the barn.

3.3. Market Opportunity for Offering DEMS to German Dairy Farmers

To evaluate the market opportunity for offering DEMS to German dairy farmers, we took an aggregated look at our study results on the relevance and market coverage of DEMS (Figure 6). By doing this, we see that for DEMS with the highest relevance for our survey sample, such as energy data visualization or energy data analysis (process optimization), there are already first-market solutions available. By contrast, other DEMS with comparably high relevance (e.g., energy-related documentation and inquiries) are not yet available in a tailored offering for German dairy farmers. Against this background, there definitely is a market opportunity for FMIS providers to integrate DEMS into their as-is service offering, especially for those planning to deploy multiple DEMS to German dairy farmers. When doing this, both DEMS with the highest relevance for the customer, e.g., energy data analysis (process optimization), as well as those with the greatest novelty for the market, e.g., energy-related documentation and inquiries, should be included in the digital service offering portfolio of a FMIS provider.

4. Discussion

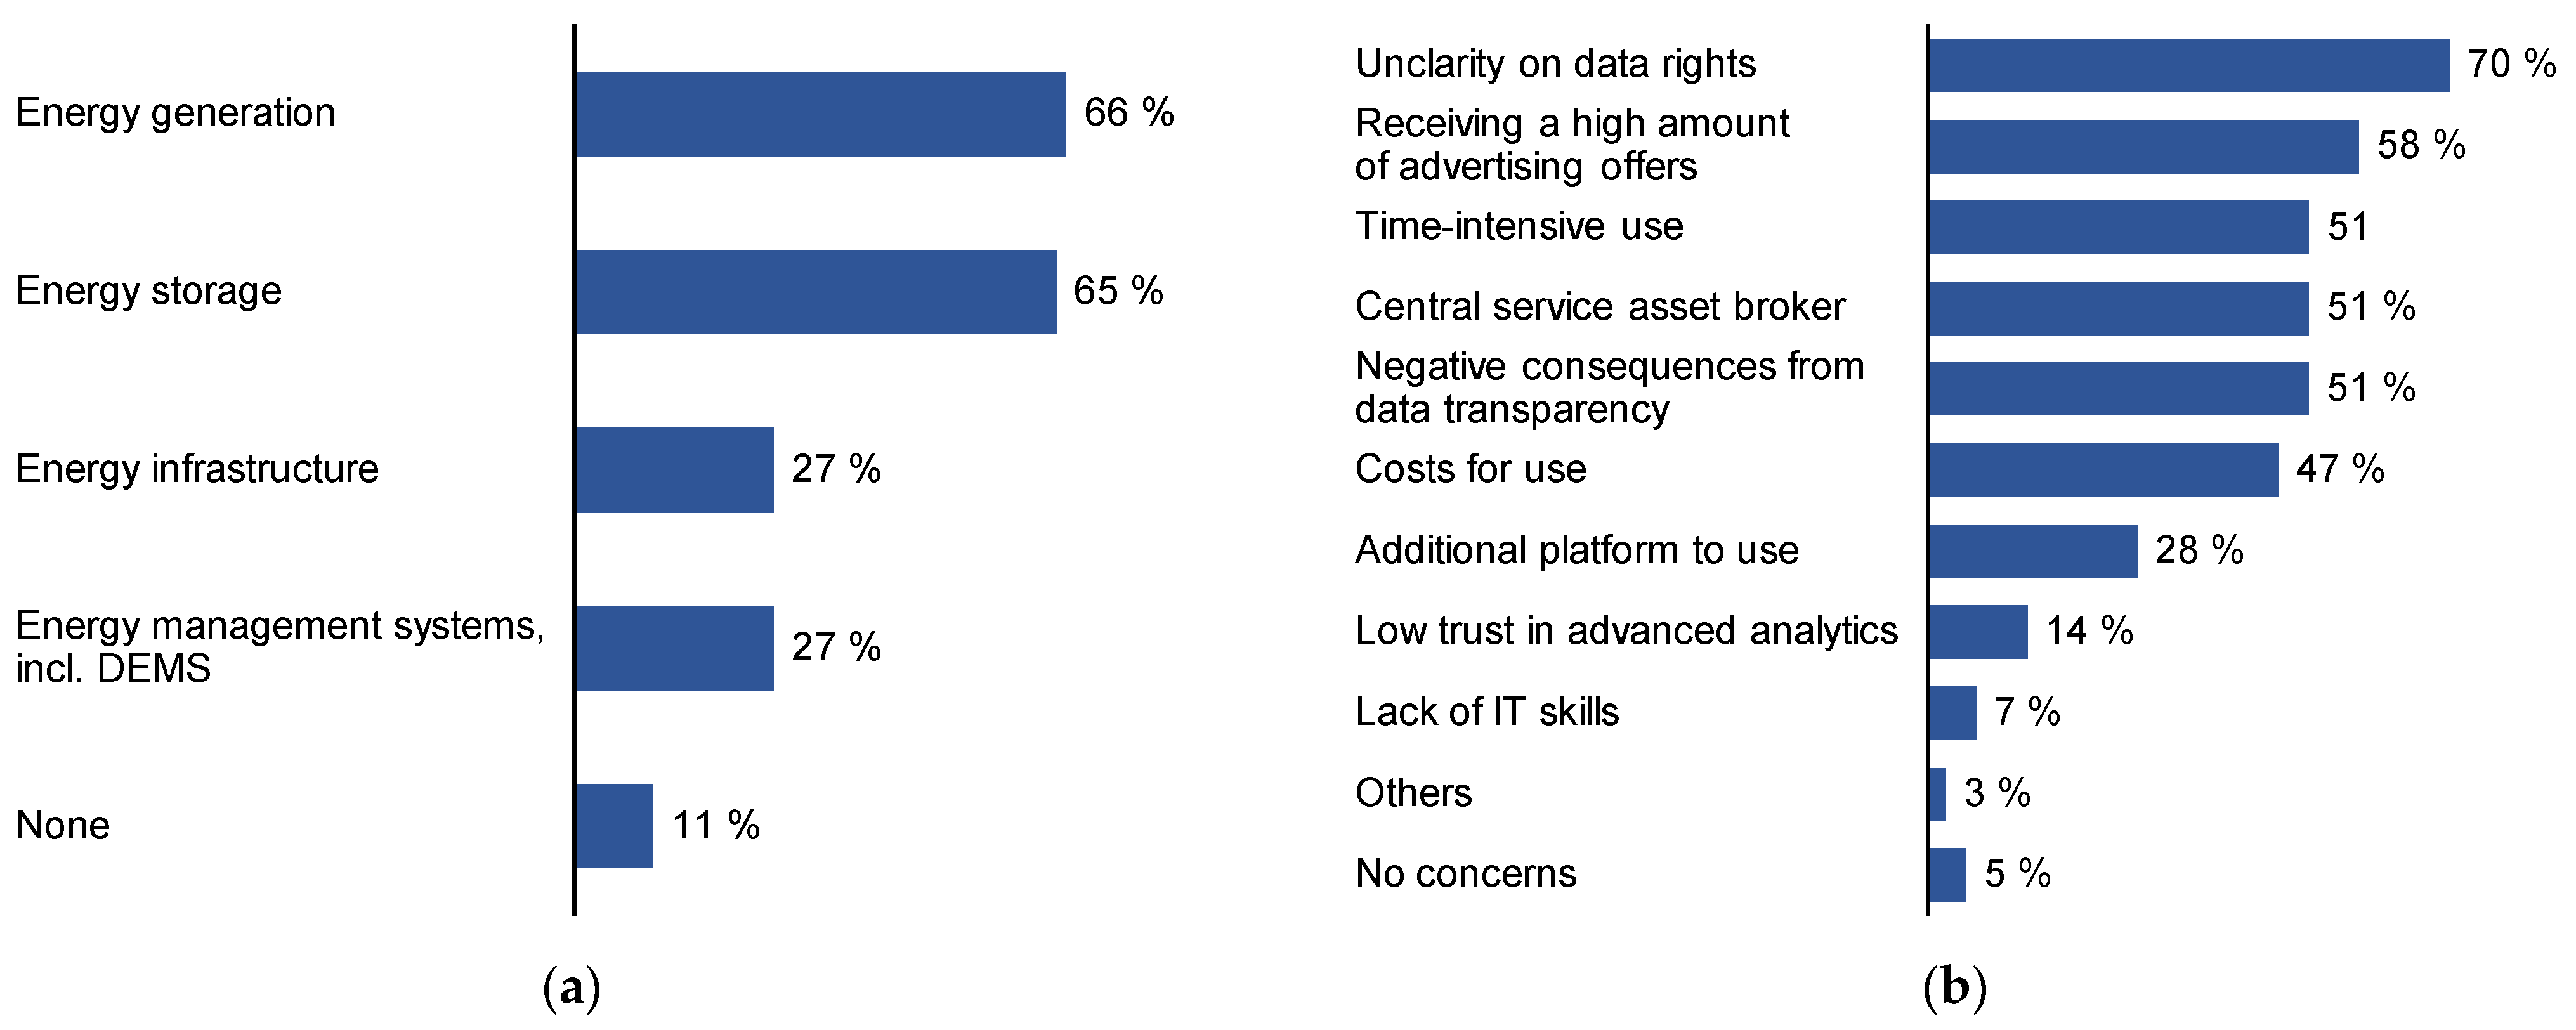
4.1. Investment Intentions and Concerns of German Dairy Farmers

Also in the future, farmers are planning to further invest in energy management, with investments in energy generation systems expected to become the biggest investment block at farms [37]. This predominant interest in expanding energy generation capacities was confirmed by our survey results (Figure 7a) and can be attributed to farms’ striving to become energy self-sufficient, increase profitability, and mitigate GHG emissions [12,13,38]. Beyond that, 65% of our sample voiced a plan to invest in energy storage solutions until 2025, while 27% plan to spend on expanding the farm’s energy infrastructure (e.g., implementing charging stations for electric vehicles). Hence, even though the focus of future energy management investments across the sample will remain on energy generation and storage solutions, 27% of the sample also stated to invest in energy management systems, including DEMS. This finding shows that even if a DEMS is evaluated as being highly relevant for a farm, this will not automatically imply actual investments. Reasons for that could be the insufficient as-is market offering but also farmers’ overall concerns about applying DEMS. In this context, major concerns raised by our sample, as illustrated in Figure 7b, are related to unclear data rights (70%), advertising (58%), and high time investment efforts (51%). Furthermore, 51% of the sample did not like the idea of DEMS being managed by a central entity, even though that is how digital services are typically provided [2]. By contrast, lack of IT skills was not a major obstacle for the sample respondents. Hence, all in all, the sample’s concerns about DEMS do not differ significantly from farmers’ overall restraints when using digital services [5].

4.2. Applicability of Our Study Results to the German Dairy Farm Population and Other Stakeholders from the Dairy Sector

The major limitation of this study is the relatively small size of the survey sample (74 responses), which was used to analyze the relevance of DEMS for German dairy farms. Due to this and given that certain sample farm characteristics (e.g., on-farm energy generation) deviate from those observable in the German dairy farm population, it can be questioned how applicable our study results are to the majority of more than 50 thousand German dairy farms [23]. However, findings from ref. [37,39] indicate that the characteristics of German dairy farms will, in the future, be more aligned with those of the sample (e.g., larger dairy herd size, more on-farm energy generation) so that our survey results can be used to better assess the future customer needs of German dairy farms. On top of that, the outlined value-add of DEMS (e.g., reduction in energy-related costs) is valid for all German dairy farms.
In addition to that, the results of this study are not only useful for FMIS providers but are also insightful for other stakeholders in the German dairy sector. For example, with an increased adoption rate of DEMS and hence increased transparency on energy data, stakeholders from the downstream supply chain (e.g., dairy factories and retail stores) will have a better chance to provide net zero energy milk [38], and providers of on-farm equipment can improve their offering (e.g., by drawing conclusions from energy data on the on-site utilization of a product) [22].

4.3. Challenges when Providing DEMS to German Dairy Farmers

When thinking about integrating DEMS as part of FMIS, providers should be aware of particular challenges in the context of deploying DEMS to German dairy farmers. In contrast to many other digital agri-services, DEMS can have critical effects on the functionality of a farm’s infrastructure, i.e., bugs or structural system errors can have severe consequences, with power outages being the worst case scenario [40]. Hence, the demand for resilience is even higher with DEMS compared with other digital services. Furthermore, most farms do not yet have central control units installed to collect energy data at the dairy barn as input for DEMS, given the novelty of this technology [12]. Hence, for farms, the implementation of such a physical energy management system, as a pre-requisite for leveraging most benefits from DEMS, will pose an on-top investment that is not directly affecting a dairy farm’s core income streams. Against this background, we expect a combined offering package, including a physical energy management system and a selection of DEMS, to be most valuable for the farmer. On top of that, when deciding which DEMS to deploy, FMIS providers should also think about how to leverage synergy effects during the implementation process. Lastly, to holistically evaluate the market opportunity of each DEMS from a company-perspective, a FMIS provider should critically review its capabilities, resources, and market channels for deploying a DEMS and evaluate the expected return on investment [21]. For example, to manage the challenges outlined above, a FMIS provider should review the expertise of its own staff with regards to knowledge on the German energy market, implementation of digital farming solutions (e.g., development of AI services), and legal framework conditions (e.g., data rights in Germany).

5. Conclusions

The novelty of this study lies in the detailed analysis of market demand and the offering of DEMS for German dairy farms. Hence, our analyses provided valuable insights on which digital services are most relevant for dairy farmers and which of those are not yet adequately covered by the as-is market offering. For example, digital services such as energy data analyses for process optimization were evaluated by our sample as being the most relevant DEMS but are not yet adequately provided by the market. To close this market gap, we recommend further work on how to implement such DEMS. Besides that, the farmer survey conducted in the context of this study provided valuable insights on the status quo of energy management at German dairy farms. Looking at our sample, photovoltaic is the most prominent energy generation technology, most farms generate more electricity than they consume, and thermal storage systems are the most common solution for accumulating energy.

Author Contributions

Conceptualization, T.T.; methodology, T.T. and J.K.; validation, T.T.; formal analysis, T.T.; investigation, T.T. and J.K.; resources, T.T. and H.B.; data curation, T.T.; writing—original draft preparation, T.T.; writing—review and editing, T.T. and H.B.; visualization, T.T.; supervision, H.B.; project administration, T.T. All authors have read and agreed to the published version of the manuscript.

Funding

This research received no external funding.

Institutional Review Board Statement

Not applicable.

Data Availability Statement

The data presented in this study are available on request from the corresponding author.

Conflicts of Interest

The authors declare no conflict of interest.

References

  1. Green, T.; Gourdain, E.; Hirschy, G.; Sine, M.; Geyer, M.; Laun, N.; Zude-Sasse, M.; Durner, D.; Koch, C.; Rhemouga, N.; et al. Farming System Perspective. In Handbook Digital Farming; Dörr, J., Nachtmann, M., Eds.; Springer: Berlin/Heidelberg, Germany, 2022; pp. 277–340. ISBN 978-3-662-64377-8. [Google Scholar]
  2. Koch, M.; Krohmer, D.; Naab, M.; Rost, D.; Trapp, M. A matter of definition: Criteria for digital ecosystems. Digit. Bus. 2022, 2, 1–13. [Google Scholar] [CrossRef]
  3. Dörr, J.; Nachtmann, M.; Linke, C.; Crawford, J.; Ehlers, K.; Balzer, F.; Gandorfer, M.; Gabriel, A.; Pfeiffer, J.; Spykman, O.; et al. Introduction. In Handbook Digital Farming; Dörr, J., Nachtmann, M., Eds.; Springer: Berlin/Heidelberg, Germany, 2022; pp. 1–58. ISBN 978-3-662-64377-8. [Google Scholar]
  4. Tummers, J.; Kassahun, A.; Tekinerdogan, B. Obstacles and features of Farm Management Information Systems: A systematic literature review. Comput. Electron. Agric. 2019, 157, 189–204. [Google Scholar] [CrossRef]
  5. Gabriel, A.; Gandorfer, M.; Spykman, O. Nutzung und Hemmnisse digitaler Technologien in der Landwirtschaft: Sichtweisen aus der Praxis und in den Fachmedien. Berichte über Landwirtschaft—Zeitschrift für Agrarpolitik und Landwirtschaft. Aktuelle Beitr. 2021, 99, 1–27. [Google Scholar] [CrossRef]
  6. Melzer, M.; Bellingrath-Kimura, S.; Gandorfer, M. Commercial Farm Management Information Systems—A Demand-Oriented Analysis of Functions in Practical Use. SSRN J. 2023, 4, 100203. [Google Scholar] [CrossRef]
  7. Pelegrini, D.F.; Lopes, M.A.; Demeu, F.A.; Rocha, Á.G.F.; Bruhn, F.R.P.; Casas, P.S. Effect of socioeconomic factors on the yields of family-operated milk production systems. Semina Ciênc. Agrár. 2019, 40, 1199–1213. [Google Scholar] [CrossRef] [Green Version]
  8. Kassahun, A.; Bloo, R.; Catal, C.; Mishra, A. Dairy Farm Management Information Systems. Electronics 2022, 11, 239. [Google Scholar] [CrossRef]
  9. Slob, N.; Catal, C.; Kassahun, A. Application of machine learning to improve dairy farm management: A systematic literature review. Prev. Vet. Med. 2021, 187, 105237. [Google Scholar] [CrossRef] [PubMed]
  10. Wijerathna-Yapa, A.; Pathirana, R. Sustainable Agro-Food Systems for Addressing Climate Change and Food Security. Agriculture 2022, 12, 1554. [Google Scholar] [CrossRef]
  11. Milchland Niedersachsen. Klimaplattform Milch. Available online: https://milchland.de/milchprofis/nachhaltigkeit/klimaplattform-milch/#agrarklimacheck (accessed on 11 March 2023).
  12. Bernhardt, H.; Höhendinger, M.; Stumpenhausen, J. Development of the Technical Structure of the “Cow Energy” Concept. Agronomy 2021, 11, 1915. [Google Scholar] [CrossRef]
  13. Theunissen, T.C.; Bernhardt, H. Revenue increase for German dairy farmers through cross-value chain energy management. In Proceedings of the 2022 ASABE Annual International Meeting Houston, TX, USA, 17–20 July 2022; American Society of Agricultural and Biological Engineers: St. Joseph, MI, USA, 2022. [Google Scholar]
  14. Zhou, K.; Fu, C.; Yang, S. Big data driven smart energy management: From big data to big insights. Renew. Sustain. Energy Rev. 2016, 56, 215–225. [Google Scholar] [CrossRef]
  15. Netztransparenz. Marktwertübersicht. Available online: https://www.netztransparenz.de/EEG/Marktpraemie/Marktwerte (accessed on 4 April 2023).
  16. Shine, P.; Upton, J.; Sefeedpari, P.; Murphy, M.D. Energy Consumption on Dairy Farms: A Review of Monitoring, Prediction Modelling, and Analyses. Energies 2020, 13, 1288. [Google Scholar] [CrossRef] [Green Version]
  17. Senna, P.P.; Almeida, A.H.; Barros, A.C.; Bessa, R.J.; Azevedo, A.L. Architecture Model for a Holistic and Interoperable Digital Energy Management Platform. Procedia Manuf. 2020, 51, 1117–1124. [Google Scholar] [CrossRef]
  18. Chen, X.; Chen, X. Data visualization in smart grid and low-carbon energy systems: A review. Int. Trans. Electr. Energ. Syst. 2021, 31, e12889. [Google Scholar] [CrossRef]
  19. Mohsenimanesh, A.; LeRiche, E.L.; Gordon, R.; Clarke, S.; MacDonald, R.D.; MacKinnon, I.; VanderZaag, A.C. Review: Dairy Farm Electricity Use, Conservation, and Renewable Production—A Global Perspective. Appl. Eng. Agric. 2021, 37, 977–990. [Google Scholar] [CrossRef]
  20. Theunissen, T.; Keller, J.; Bernhardt, H. Market gap for cross-value chain energy management in the German dairy sector. In Proceedings of the XX CIGR World Congress: Sustainable Agricultural Production—Water, Land, Energy and Food, Kyoto, Japan, 5–9 December 2022. [Google Scholar]
  21. Kotler, P.; Keller, K.L.; Zawiślak, M.; Środa, J. Marketing Management, Dodruk; Rebis: Poznań, Poland, 2021; ISBN 978-0-13-210292-6. [Google Scholar]
  22. Gerhardt, C.; Bröring, S.; Strecker, O.; Wustmans, M.; Moretti, D.; Breunig, P.; Pichon, L.; Müller-Seitz, G.; Förster, B. Framework for the Digital Transformation of the Agricultural Ecosystem. In Handbook Digital Farming; Dörr, J., Nachtmann, M., Eds.; Springer: Berlin/Heidelberg, Germany, 2022; pp. 59–108. ISBN 978-3-662-64377-8. [Google Scholar]
  23. FADN. Farm Accountancy Data Network (FADN) Public Database. Available online: https://agridata.ec.europa.eu/extensions/FADNPublicDatabase/FADNPublicDatabase.html (accessed on 4 March 2023).
  24. Arla. Arla Climate Check Report. Available online: https://www.arla.com/4a8073/globalassets/arla-global/sustainability/dairys-climate-footprint/arla-climate-check-report-2022.pdf (accessed on 9 March 2023).
  25. Bernhardt, H. Digitales Energiemanagement im Milchviehbereich. Inform. Spektrum 2023, 46, 3–7. [Google Scholar] [CrossRef]
  26. Statistisches Bundesamt. Stromverbrauch der privaten Haushalte nach Haushaltsgrößenklassen. Available online: https://www.destatis.de/DE/Themen/Gesellschaft-Umwelt/Umwelt/UGR/private-haushalte/Tabellen/stromverbrauch-haushalte.html (accessed on 9 March 2023).
  27. Flak, J. Technologies for Sustainable Biomass Supply—Overview of Market Offering. Agronomy 2020, 10, 798. [Google Scholar] [CrossRef]
  28. Khan, N.; Ray, R.L.; Kassem, H.S.; Zhang, S. Mobile Internet Technology Adoption for Sustainable Agriculture: Evidence from Wheat Farmers. Appl. Sci. 2022, 12, 4902. [Google Scholar] [CrossRef]
  29. Tallarida, R.J.; Murray, R.B. Chi-Square Test. In Manual of Pharmacologic Calculations; Tallarida, R.J., Murray, R.B., Eds.; Springer: New York, NY, USA, 1986; pp. 140–142. ISBN 978-1-4612-9380-4. [Google Scholar]
  30. Mankins, J.C. Advanced Concepts Office, Office of Space Access and Technology, NASA. In Technology Readiness Level; NASA: Washington, DC, USA, 1995. [Google Scholar]
  31. Munich Television. Heimatgschichtn—Beim Huabahof in Königsdorf. Available online: https://www.youtube.com/watch?v=t5HxfYU0v6Y&t=605s (accessed on 12 March 2023).
  32. Jung, F.; Büskens, C.; Lachmann, M. SmartFarm—Data based optimization for optimal energy management. Proc. Appl. Math. Mech. 2017, 17, 741–742. [Google Scholar] [CrossRef]
  33. Lindena, T.; Claus, A.S.; Johns, J.; Nieberg, H. QM-Nachhaltigkeitsmodul Milch—Es geht weiter! Available online: https://media.diemayrei.de/57/722557.pdf (accessed on 12 March 2023).
  34. Cells Energy. Marktplatz. Available online: https://marktplatz.cells.energy/ (accessed on 12 March 2023).
  35. 2G. Digitale Lösungen und Steuerungstechnik. Available online: https://2-g.com/de/produkte/digitale-und-steuerungsloesungen (accessed on 12 March 2023).
  36. Enertrag. Powersystem—Lassen Sie Daten sprechen. Available online: https://enertrag.com/produkte/powersystem (accessed on 12 March 2023).
  37. Deutscher Bauernverband. Konjunkturbarometer Agrar: Stimmungslage deutlich verschlechtert. Available online: https://www.bauernverband.de/fileadmin/user_upload/dbv/gruener_dienst/2022/KW_26_bis_KW_52/KW_41/2022_-_127_KB_September_2022_-_Charts_fuer_die_Homepage.pdf (accessed on 11 March 2023).
  38. Malliaroudaki, M.I.; Watson, N.J.; Ferrari, R.; Nchari, L.N.; Gomes, R.L. Energy management for a net zero dairy supply chain under climate change. Trends Food Sci. Technol. 2022, 126, 153–167. [Google Scholar] [CrossRef]
  39. Statista. Anzahl der Milchkühe je Betrieb in Deutschland in den Jahren 1995 bis 2022. Available online: https://de.statista.com/statistik/daten/studie/28755/umfrage/anzahl-der-milchkuehe-je-halter-in-deutschland-seit-1990/#:~:text=In%20den%20vergangenen%20Jahrzehnten%20ist,etwa%2071%20K%C3%BChe%20pro%20Betrieb (accessed on 4 April 2023).
  40. Kuntke, F.; Linsner, S.; Steinbrink, E.; Franken, J.; Reuter, C. Resilience in Agriculture: Communication and Energy Infrastructure Dependencies of German Farmers. Int. J. Disaster Risk Sci. 2022, 13, 214–229. [Google Scholar] [CrossRef]
Figure 1. Farm characteristics of the survey sample compared to data from [23,24].
Agriculture 13 00861 g001
Figure 2. Electricity consumption and generation of the sample farms in 2021.
Agriculture 13 00861 g002
Figure 3. (a) Share of on-farm electricity utilization in 2021 across the sample; (b) Installed energy storage systems at the sample farms.
Agriculture 13 00861 g003
Figure 4. Sample farmers’ responses on relevance of DEMS on a scale from 1 (Not relevant) to 4 (Highly relevant)–translated and simplified.
Agriculture 13 00861 g004
Figure 5. Maturity, function scope and relative quantity of DEMS in the as-is market offering tailored to German dairy farms.
Agriculture 13 00861 g005
Figure 6. Market opportunity for DEMS considering customer needs and market coverage.
Agriculture 13 00861 g006
Figure 7. (a) The sample’s energy management investment plans until 2025–translated and simplified; (b) Concerns of the sample about applying DEMS–translated and simplified.
Agriculture 13 00861 g007
Table 1. Description of the seven DEMS from [20] in scope of this study.
Digital Energy Management
Service (DEMS)
Description
Energy data visualizationVisualization of on-farm energy data (e.g., total energy consumption and generation, energy-related costs and revenues) to increase transparency and understanding of the status quo [18]
Energy data analysis (process optimization)Analysis of energy data to optimize farms’ on-site energy management, including power generation planning and efficiency improvement [14]
Energy data analysis (predictive maintenance)Analysis of on-farm energy data to improve performance of farm equipment and power generators [22], including fault and outage detection [14]
Knowledge service (energy management in the dairy sector)Provision of insights on the German energy market (e.g., forecasts on the electricity market prices), including relevant findings from the dairy sector (e.g., peer and industry benchmarks) [17]
Energy marketplaceMarketplace for trading energy with focus on selling electricity from the farm to third parties, including real-time interaction and dynamic pricing [14]
Energy data marketplaceMarketplace for selling energy data from the farm to stakeholders of the dairy sector and beyond (e.g., retailers, manufacturers of farm equipment, public sector) [13]
Energy-related documentation and inquiriesManagement of energy-related files (e.g., documentation of energy data in subsidy request forms, generation of purchase requests)
Table 2. Stated relevance of DEMS dependent on farm characteristics (translated and simplified), including information on the sample share and the p-Value in selected data fields.
Digital Energy
Management
Service (DEMS)
Age of FarmerDairy Herd SizeLocationMilk Yield
Per Cow
Total
Electricity
Generation
Electricity Consumption per kg of MilkOn-Farm
Electricity
Utilization
Organic Farm
<M≥M<M≥MBavariaNRW<M≥M<M≥M<M≥M<20%≥20%YesNo
Energy data
visualization
3.2
(46%)
3.1
(43%)
2.9
(45%)
3.4
(45%)
3.2
(54%)
3.2
(28%)
3.2
(46%)
3.1
(43%)
3.1
(47%)
3.2
(42%)
3.1
(47%)
3.2
(42%)
3.1
(55%)
3.2
(34%)
3.5
(18%)
3.1
(72%)
p = 0.0582 *p = 0.3599
Energy data analysis
(process
optimization)
3.4
(47%)
3.4
(43%)
3.4
(43%)
3.4
(47%)
3.4
(53%)
3.4
(31%)
3.3
(45%)
3.5
(46%)
3.4
(49%)
3.4
(42%)
3.4
(47%)
3.4
(43%)
3.3
(57%)
3.6
(34%)
3.6
(19%)
3.3
(72%)
Energy data analysis
(predictive
maintenance)
2.7
(46%)
2.8
(47%)
2.6
(45%)
2.9
(49%)
2.7
(58%)
3.0
(28%)
2.6
(50%)
2.8
(43%)
2.8
(46%)
2.7
(47%)
2.6
(46%)
2.8
(47%)
2.7
(57%)
2.8
(36%)
2.8
(22%)
2.7
(72%)
p = 0.6231
Knowledge service
(energy mgmt.
in the dairy sector)
3.0
(46%)
3.3
(49%)
3.0
(46%)
3.3
(49%)
3.1
(57%)
3.2
(31%)
3.0
(47%)
3.3
(47%)
3.0
(47%)
3.3
(47%)
3.1
(47%)
3.2
(47%)
3.1
(59%)
3.2
(35%)
3.1
(19%)
3.2
(76%)
Energy marketplace2.9
(46%)
3.0
(46%)
2.8
(45%)
3.1
(47%)
3.0
(45%)
3.0
(31%)
2.8
(45%)
3.1
(47%)
2.9
(46%)
3.0
(46%)
2.6
(45%)
3.3
(47%)
2.9
(57%)
3.0
(35%)
3.0
(19%)
2.9
(73%)
p = 0.1426 *
Energy data
marketplace
2.3
(49%)
2.1
(46%)
2.0
(47%)
2.4
(47%)
2.1
(58%)
2.4
(30%)
2.0
(49%)
2.4
(46%)
2.0
(47%)
2.3
(47%)
2.4
(47%)
2.0
(47%)
2.2
(58%)
2.2
(36%)
2.0
(20%)
2.2
(74%)
p = 0.0811p = 0.5127 *
Energy-related
documentation and
inquiries
2.9
(46%)
3.1
(47%)
2.9
(45%)
3.0
(49%)
2.9
(55%)
3.0
(31%)
2.9
(47%)
3.1
(46%)
3.1
(46%)
2.9
(47%)
3.0
(47%)
2.9
(46%)
3.0
(59%)
2.9
(34%)
3.0
(19%)
3.0
(74%)
Total2.9
(47%)
3.0
(46%)
2.8
(45%)
3.1
(47%)
2.9
(56%)
3.0
(30%)
2.8
(47%)
3.0
(46%)
2.9
(47%)
3.0
(46%)
2.9
(47%)
3.0
(46%)
2.9
(58%)
3.0
(35%)
3.0
(19%)
2.9
(73%)
Data fields with deviation from average assessment above 0.20 were highlighted in grey. In case of data fields marked with *, a chi-square test was conducted based on the four quartiles of the respective farm characteristic.
Table 3. Selected scale to evaluate maturity, function scope and relative quantity of DEMS.
Assessment DimensionScale
1234
MaturityTRL 9 TRL 5–8TRL 2–4TRL 1
Function scopeComprehensive
functionality
Majority of functions containedLimited number of functions includedNo functions implemented yet
Relative quantity>30%11–30%1–10%0%
Disclaimer/Publisher’s Note: The statements, opinions and data contained in all publications are solely those of the individual author(s) and contributor(s) and not of MDPI and/or the editor(s). MDPI and/or the editor(s) disclaim responsibility for any injury to people or property resulting from any ideas, methods, instructions or products referred to in the content.

