
Agricultural International Trade by Brazilian Ports: A Study Using Social Network Analysis
 ,
,  , , , , and
Abstract
:1. Introduction
2. Materials and Methods
2.1. Data Collection
- We selected a ten-year period from January 2013 to December 2022.
- The extraction filters were international standard classification by economic activities, selecting the division of plant, animal, and hunting; maritime transportation; ports of exportation; and importer country.
2.2. Data Analysis
3. Results and Discussion
3.1. Descriptive Statistics
3.2. SNA Analysis
Centrality Degree
3.3. K-Core
3.4. Tie Strength
4. Conclusions
Author Contributions
Funding
Institutional Review Board Statement
Data Availability Statement
Conflicts of Interest
References
- United Nations. World Population Prospects 2022: Summary of Results; United Nations: New York, NY, USA, 2022. [Google Scholar]
- FAO. Faostat. Available online: https://www.fao.org/faostat/en/#country/21 (accessed on 24 March 2023).
- Hernandez, J.E.; Mortimer, M.; Panetto, H. Operations management and collaboration in agri-food supply chains. Prod. Plan. Control 2021, 32, 1163–1164. [Google Scholar] [CrossRef]
- Esteso, A.; Alemany, M.M.E.; Ortiz, A. Impact of product perishability on agri-food supply chains design. Appl. Math. Model. 2021, 96, 20–38. [Google Scholar] [CrossRef]
- Cao, Y.; Tao, L.; Wu, K.; Wan, G. Coordinating joint greening efforts in an agri-food supply chain with environmentally sensitive demand. J. Clean. Prod. 2020, 277, 123883. [Google Scholar] [CrossRef]
- Ciccullo, F.; Cagliano, R.; Bartezzaghi, G.; Perego, A. Implementing the circular economy paradigm in the agri-food supply chain: The role of food waste prevention technologies. Resour. Conserv. Recycl. 2021, 164, 105114. [Google Scholar] [CrossRef]
- Hu, J.y.; Zhang, J.; Mei, M.; Yang, W.m.; Shen, Q. Quality control of a four-echelon agri-food supply chain with multiple strategies. Inf. Process. Agric. 2019, 6, 425–437. [Google Scholar] [CrossRef]
- Zaw, T.N.; Lim, S. The military’s role in disaster management and response during the 2015 Myanmar floods: A social network approach. Int. J. Disaster Risk Reduct. 2017, 25, 1–21. [Google Scholar] [CrossRef]
- Procopiuck, M.; Frey, K. Redes de políticas públicas e de governança e sua análise a partir da websphere analysis. Rev. Sociol. E Política 2009, 17, 63–83. [Google Scholar] [CrossRef]
- Wellman, B. Structural analysis: From method and metaphor to theory and substance. In Social Structures: A Network Approach; Structural Analysis in the Social Sciences; Cambridge University Press: New York, NY, USA, 1988; Volume 2, pp. 19–61. [Google Scholar]
- Klijn, E.H.; Koppenjan, J.F.M. Public Management and Policy Networks. Public Manag. Int. J. Res. Theory 2000, 2, 135–158. [Google Scholar] [CrossRef]
- Farine, D.R.; Whitehead, H. Constructing, conducting and interpreting animal social network analysis. J. Anim. Ecol. 2015, 84, 1144–1163. [Google Scholar] [CrossRef] [PubMed] [Green Version]
- Luo, Q.; Zhong, D. Using social network analysis to explain communication characteristics of travel-related electronic word-of-mouth on social networking sites. Tour. Manag. 2015, 46, 274–282. [Google Scholar] [CrossRef]
- Loughead, T.M.; Fransen, K.; Puyenbroeck, S.V.; Hoffmann, M.D.; Cuyper, B.D.; Vanbeselaere, N.; Boen, F. An examination of the relationship between athlete leadership and cohesion using social network analysis. J. Sport. Sci. 2016, 34, 2063–2073. [Google Scholar] [CrossRef] [PubMed] [Green Version]
- Cooc, N.; Kim, J.S. Peer influence on children’s reading skills: A social network analysis of elementary school classrooms. J. Educ. Psychol. 2017, 109, 727–740. [Google Scholar] [CrossRef] [Green Version]
- Yip, W.S.; To, S. Identification of stakeholder related barriers in sustainable manufacturing using Social Network Analysis. Sustain. Prod. Consum. 2021, 27, 1903–1917. [Google Scholar] [CrossRef]
- Castells, M.; Cardoso, G. Do Conhecimento à Acção Política. In A Sociedade em Rede; Paz e Terra: São Paulo, Brazil, 1999; p. 47. [Google Scholar]
- Apostolato, I.A. An overview of Software Applications for Social Network Analysis. Int. Rev. Soc. Res. 2013, 3, 71–77. [Google Scholar] [CrossRef] [Green Version]
- Borgatti, S.P.; Everett, M.G.; Johnson, J.C. Analyzing Social Networks; SAGE: Los Angeles, CA, USA, 2013. [Google Scholar]
- Vignery, K.; Laurier, W. A methodology and theoretical taxonomy for centrality measures: What are the best centrality indicators for student networks? PLoS ONE 2020, 15, e0244377. [Google Scholar] [CrossRef]
- Tabassum, S.; Pereira, F.S.F.; Fernandes, S.; Gama, J. Social network analysis: An overview. WIREs Data Min. Knowl. Discov. 2018, 8, e1256. [Google Scholar] [CrossRef]
- Dey, P.; Chaterjee, A.; Roy, S. Influence maximization in online social network using different centrality measures as seed node of information propagation. Sādhanā 2019, 44, 205. [Google Scholar] [CrossRef] [Green Version]
- Vega-Oliveros, D.A.; Gomes, P.S.; Milios, E.E.; Berton, L. A multi-centrality index for graph-based keyword extraction. Inf. Process. Manag. 2019, 56, 102063. [Google Scholar] [CrossRef]
- Kong, Y.X.; Shi, G.Y.; Wu, R.J.; Zhang, Y.C. k-core: Theories and applications. Phys. Rep. 2019, 832, 1–32. [Google Scholar] [CrossRef]
- Saqr, M.; Fors, U.; Nouri, J. Using social network analysis to understand online Problem-Based Learning and predict performance. PLoS ONE 2018, 13, e0203590. [Google Scholar] [CrossRef] [PubMed] [Green Version]
- Brazilian Trade Foreign Portall. Comexstat. Available online: http://comexstat.mdic.gov.br/pt/home (accessed on 21 March 2023).
- Borgatti, S.P. NetDraw Software for Network Visualization; Analytic Technologies: Lexington, KY, USA, 2002. [Google Scholar]
- Martinelli, L.A.; Batistella, M.; Silva, R.F.B.d.; Moran, E. Soy Expansion and Socioeconomic Development in Municipalities of Brazil. Land 2017, 6, 62. [Google Scholar] [CrossRef] [Green Version]
- Watai, R.; Ruggeri, F.; Tannuri, E.; Santos, N.; Tavares, B.; dos Santos, J. An analysis methodology for the passing ship problem considering real-time simulations and moored ship dynamics: Application to the Port of Santos, in Brazil. Appl. Ocean Res. 2018, 80, 148–165. [Google Scholar] [CrossRef]
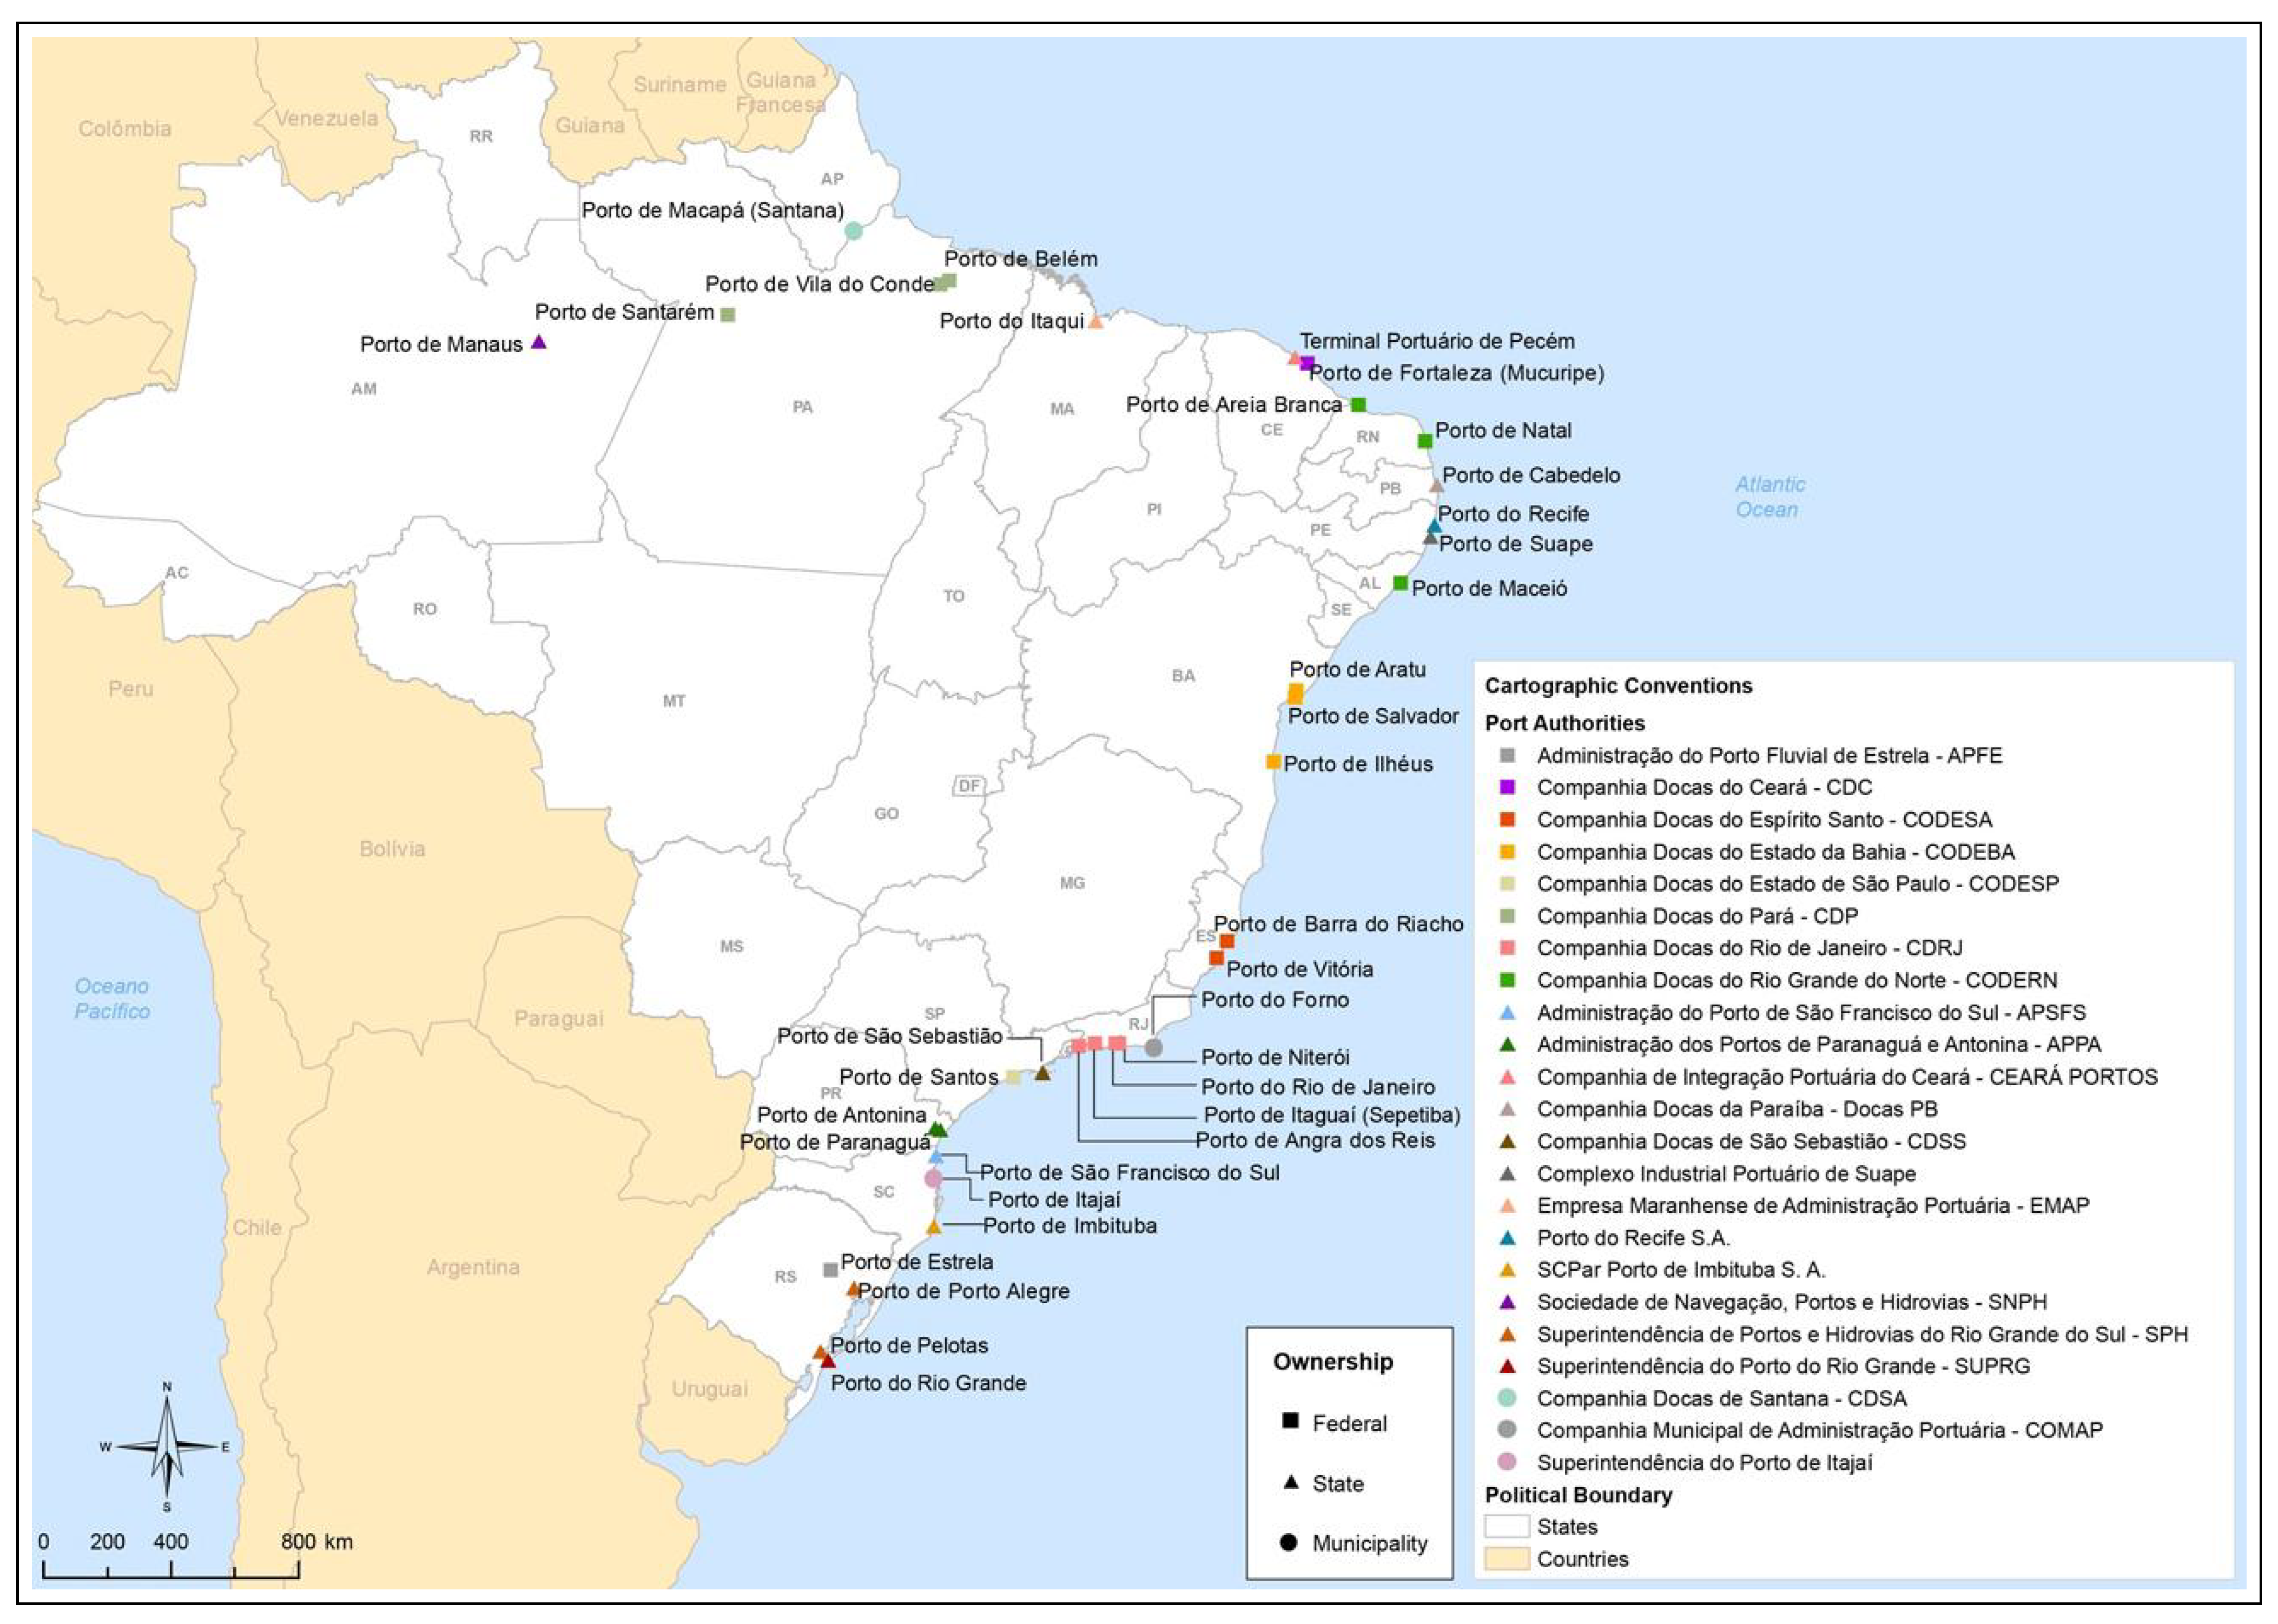
- Maps Brasil. Brazil Ports Map. Available online: https://maps-brazil.com/maps-brazil-transports/brazil-ports-map (accessed on 31 March 2023).
- Celik, S.; Corbacioglu, S. From linearity to complexity: Emergent characteristics of the 2006 Avian Influenza Response System in Turkey. Saf. Sci. 2016, 90, 5–13. [Google Scholar] [CrossRef]
- Jugović, A.; Komadina, N.; Perić Hadžić, A. Factors influencing the formation of freight rates on maritime shipping markets. Pomorstvo 2015, 29, 23–29. [Google Scholar]
- Martínez-López, B.; Perez, A.M.; Sánchez-Vizcaíno, J.M. Social Network Analysis. Review of General Concepts and Use in Preventive Veterinary Medicine. Transbound. Emerg. Dis. 2009, 56, 109–120. [Google Scholar] [CrossRef]
- Luz, J.; Reis, J.; Araújo Leite, F.; Araújo, K.; Moritz, G. Effects of Transport Infrastructure in the Economic Development. In Proceedings of the Advances in Production Management Systems. Initiatives for a Sustainable World; Nääs, I., Vendrametto, O., Mendes Reis, J., Gonçalves, R.F., Silva, M.T., von Cieminski, G., Kiritsis, D., Eds.; Springer International Publishing: Cham, Switzerland, 2016; pp. 633–640. [Google Scholar]
- Bispo, S.Q.A. NT DINTE 26—China: Importação dos Principais Subsetores do Agronegócio e o Market-Share Brasileiro. In Notas Técnicas; Ministério da Saúde: São Paulo, Brazil, 2021; pp. 1–25. [Google Scholar]
- Cariello, T.; Fragoso, G.; Pimenta, J.U.R.; Nacif, G.A.L. Oportunidades de Comércio e Investimento na China. Alimentos e Bebidas; Technical Report; CEBC: São Paulo, Brazil, 2018. [Google Scholar]


| Actor Name | Degree | NrmDegree | % |
|---|---|---|---|
| PORT_OF_PARANAGUA | 22 | 61.111 | 6.145 |
| PORT_OF_SAO_LUIZ | 22 | 61.111 | 6.145 |
| PORT_OF_BELEM | 21 | 58.333 | 5.866 |
| PORT_OF_SANTOS | 21 | 58.333 | 5.866 |
| PORT_OF_MANAUS | 17 | 47.222 | 4.749 |
| PORT_OF_PORTO_DE_RIO_GRANDE | 17 | 47.222 | 4.749 |
| PORT_OF_BARCARENA | 16 | 44.444 | 4.469 |
| PORT_OF_SAO_FRANCISCO_DO_SUL | 15 | 41.667 | 4.190 |
| PORT_OF_VITORIA | 15 | 41.667 | 4.190 |
| PORT_OF_SANTAREM | 13 | 36.111 | 3.631 |
| Egypt | 10 | 27.778 | 2.793 |
| Morocco | 10 | 27.778 | 2.793 |
| Spain | 10 | 27.778 | 2.793 |
| Algeria | 9 | 25.000 | 2.514 |
| Iran | 9 | 25.000 | 2.514 |
| Japan | 9 | 25.000 | 2.514 |
| China | 8 | 22.222 | 2.235 |
| Saudi_Arabia | 8 | 22.222 | 2.235 |
| South_Korea | 8 | 22.222 | 2.235 |
| Vietnam | 8 | 22.222 | 2.235 |
| Colombia | 7 | 19.444 | 1.955 |
| Malaysia | 7 | 19.444 | 1.955 |
| Netherlands_(Holand) | 7 | 19.444 | 1.955 |
| Portugal | 7 | 19.444 | 1.955 |
| Bangladesh | 6 | 16.667 | 1.676 |
| Dominican_Republic | 6 | 16.667 | 1.676 |
| Ireland | 6 | 16.667 | 1.676 |
| Israel | 6 | 16.667 | 1.676 |
| Mexico | 6 | 16.667 | 1.676 |
| United_States | 6 | 16.667 | 1.676 |
| Venezuela | 6 | 16.667 | 1.676 |
| Indonesia | 5 | 13.889 | 1.397 |
| Italy | 5 | 13.889 | 1.397 |
| Guatemala | 4 | 11.111 | 1.117 |
| Jordan | 3 | 8.333 | 0.838 |
| UK | 2 | 5.556 | 0.559 |
| India | 1 | 2.778 | 0.279 |
| Network Centralization = 36.19% |
| Pos | Actor Name | Outdeg | Outdeg Volume | nOutdeg | Volume |
|---|---|---|---|---|---|
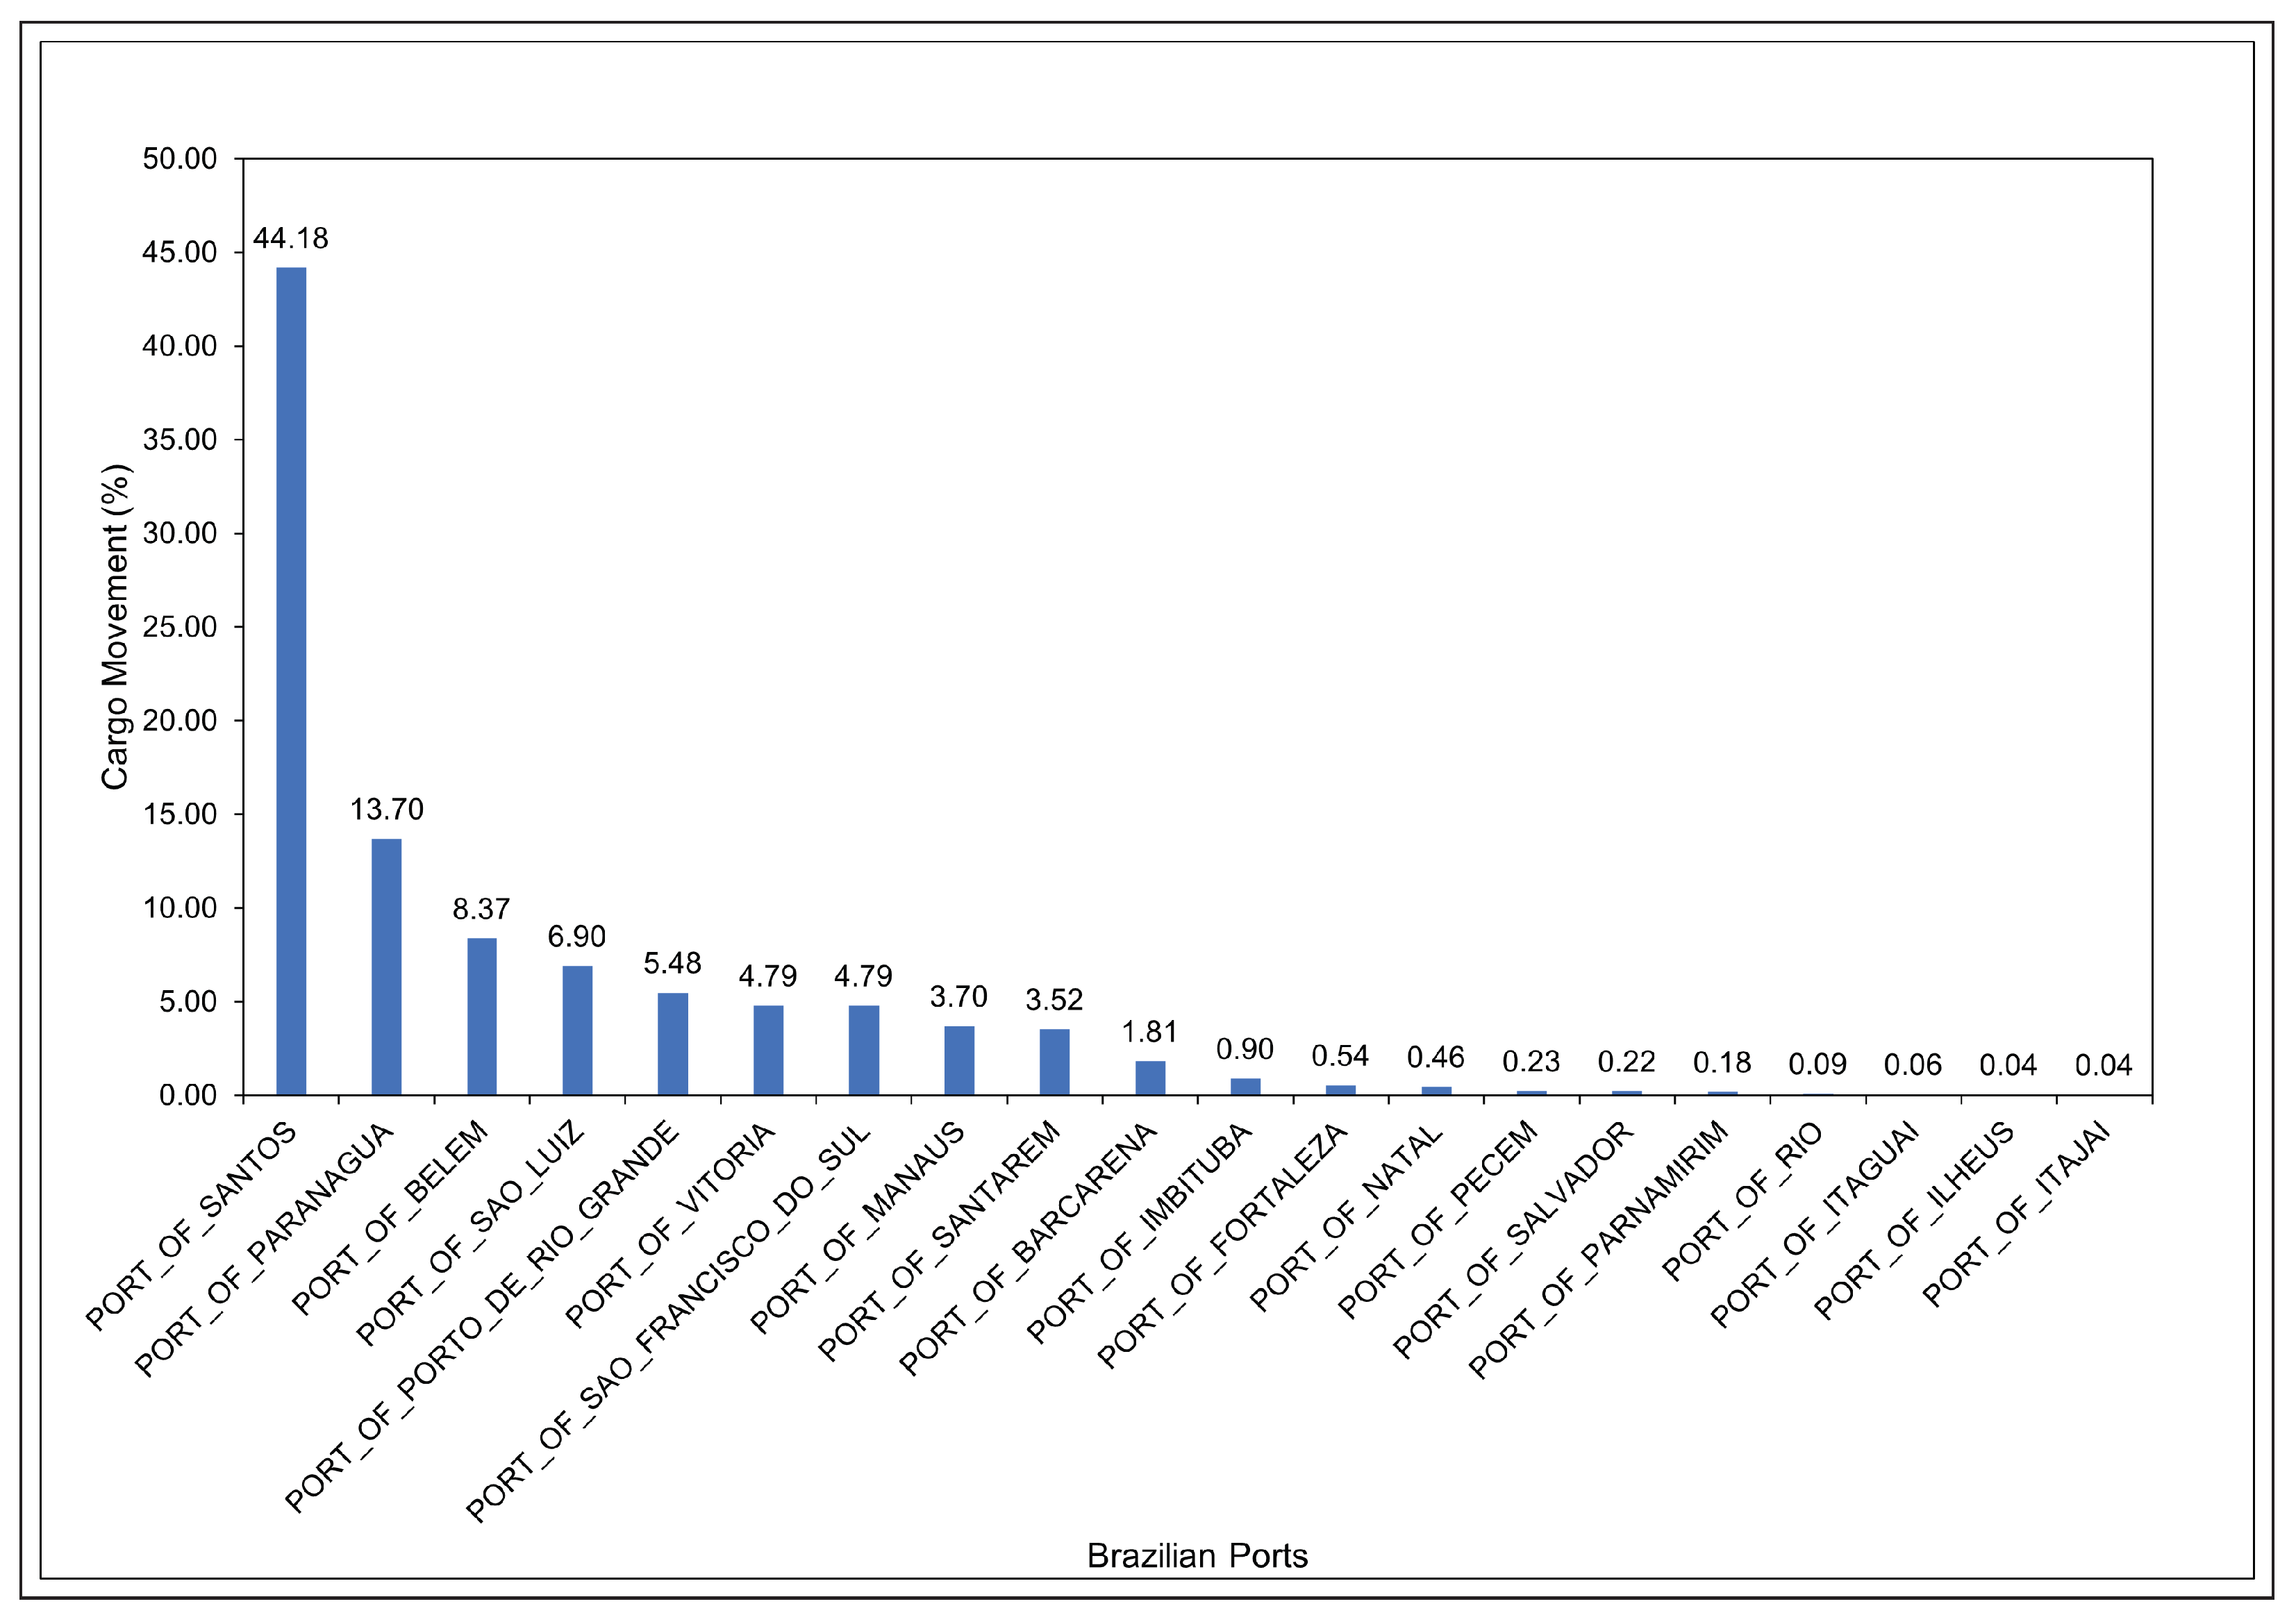
| 1 | PORT_OF_SANTOS | 21 | 136,155,406,336 | 0.1358 | 46.4% |
| 2 | PORT_OF_PARANAGUA | 22 | 40,576,499,712 | 0.0405 | 13.8% |
| 3 | PORT_OF_BELEM | 21 | 24,558,422,016 | 0.0245 | 8.4% |
| 4 | PORT_OF_SAO_LUIZ | 22 | 21,694,980,096 | 0.0216 | 7.4% |
| 5 | PORT_OF_VITORIA | 15 | 15,140,585,472 | 0.0151 | 5.2% |
| 6 | PORT_OF_SAO_FRANCISCO_DO_SUL | 15 | 14,871,945,216 | 0.0148 | 5.1% |
| 7 | PORT_OF_PORTO_DE_RIO_GRANDE | 17 | 13,077,299,200 | 0.0130 | 4.5% |
| 8 | PORT_OF_MANAUS | 17 | 11,531,336,704 | 0.0115 | 3.9% |
| 9 | PORT_OF_SANTAREM | 13 | 10,253,905,920 | 0.0102 | 3.5% |
| 10 | PORT_OF_BARCARENA | 16 | 5,735,461,888 | 0.0057 | 2.0% |
| Pos | Actor Name | Indeg | Indeg Volume | nIndeg | Volume |
|---|---|---|---|---|---|
| 1 | Iran | 9 | 44,369,219,584 | 0.0443 | 15.1% |
| 2 | Japan | 9 | 32,002,746,368 | 0.0319 | 10.9% |
| 3 | China | 8 | 31,351,230,464 | 0.0313 | 10.7% |
| 4 | Vietnam | 8 | 30,467,119,104 | 0.0304 | 10.4% |
| 5 | Egypt | 10 | 23,318,702,080 | 0.0232 | 7.9% |
| 6 | South_Korea | 8 | 23,044,272,128 | 0.0230 | 7.8% |
| 7 | Spain | 10 | 20,430,151,680 | 0.0204 | 7.0% |
| 8 | Malaysia | 7 | 12,081,029,120 | 0.0120 | 4.1% |
| 9 | Saudi_Arabia | 8 | 8,704,136,192 | 0.0087 | 3.0% |
| 10 | Indonesia | 5 | 7,316,413,440 | 0.0073 | 2.5% |
| 11 | Mexico | 6 | 6,507,229,184 | 0.0065 | 2.2% |
| 12 | Morocco | 10 | 6,453,629,440 | 0.0064 | 2.2% |
| 13 | Netherlands_(Holand) | 7 | 6,071,270,912 | 0.0060 | 2.1% |
| 14 | Algeria | 9 | 5,686,460,928 | 0.0057 | 1.9% |
| 15 | Bangladesh | 6 | 5,559,529,472 | 0.0055 | 1.9% |
| 16 | Colombia | 7 | 4,852,723,200 | 0.0048 | 1.7% |
| 17 | Portugal | 7 | 4,462,600,192 | 0.0044 | 1.5% |
| 18 | Dominican_Republic | 6 | 4,263,524,608 | 0.0042 | 1.5% |
| 19 | Venezuela | 6 | 2,640,897,536 | 0.0026 | 0.9% |
| 20 | Italy | 5 | 2,535,391,488 | 0.0025 | 0.9% |
| 21 | India | 1 | 2,197,663,232 | 0.0022 | 0.7% |
| 22 | Israel | 6 | 2,126,153,216 | 0.0021 | 0.7% |
| 23 | Ireland | 6 | 2,119,811,840 | 0.0021 | 0.7% |
| 24 | United_States | 6 | 1,669,986,816 | 0.0017 | 0.6% |
| 25 | Jordan | 3 | 1,619,229,184 | 0.0016 | 0.6% |
| 26 | Guatemala | 4 | 1,003,094,656 | 0.0010 | 0.3% |
| 27 | UK | 2 | 741,621,120 | 0.0007 | 0.3% |
Disclaimer/Publisher’s Note: The statements, opinions and data contained in all publications are solely those of the individual author(s) and contributor(s) and not of MDPI and/or the editor(s). MDPI and/or the editor(s) disclaim responsibility for any injury to people or property resulting from any ideas, methods, instructions or products referred to in the content. |
© 2023 by the authors. Licensee MDPI, Basel, Switzerland. This article is an open access article distributed under the terms and conditions of the Creative Commons Attribution (CC BY) license (https://creativecommons.org/licenses/by/4.0/).
Share and Cite
Xavier, D.L.d.J.; Reis, J.G.M.d.; Ivale, A.H.; Duarte, A.C.; Rodrigues, G.S.; Souza, J.S.d.; Correia, P.F.d.C. Agricultural International Trade by Brazilian Ports: A Study Using Social Network Analysis. Agriculture 2023, 13, 864. https://doi.org/10.3390/agriculture13040864
Xavier DLdJ, Reis JGMd, Ivale AH, Duarte AC, Rodrigues GS, Souza JSd, Correia PFdC. Agricultural International Trade by Brazilian Ports: A Study Using Social Network Analysis. Agriculture. 2023; 13(4):864. https://doi.org/10.3390/agriculture13040864
Chicago/Turabian StyleXavier, Daniel Laurentino de Jesus, João Gilberto Mendes dos Reis, André Henrique Ivale, Aparecido Carlos Duarte, Gabriel Santos Rodrigues, Jonatas Santos de Souza, and Paula Ferreira da Cruz Correia. 2023. "Agricultural International Trade by Brazilian Ports: A Study Using Social Network Analysis" Agriculture 13, no. 4: 864. https://doi.org/10.3390/agriculture13040864