Article

Analysis and Experimental of Seeding Process of Pneumatic Split Seeder for Cotton

1
College of Mechanical and Electrical Engineering, Shihezi University, Shihezi 832003, China
2
Xinjiang Production and Construction Corps, Key Laboratory of Modern Agricultural Machinery, Shihezi 832000, China
*
Author to whom correspondence should be addressed.
Agriculture 2023, 13(5), 1050; https://doi.org/10.3390/agriculture13051050
Submission received: 17 April 2023 / Revised: 28 April 2023 / Accepted: 10 May 2023 / Published: 12 May 2023
(This article belongs to the Section Agricultural Technology)

Abstract

:
In order to study the working mechanism and sowing effect of seed delivery pipes and their associated cavity seeders, the factors affecting the sowing test were first derived through pressure loss theory and force analysis of cotton seed particles in the gas-solid coupling field. Secondly, Ansys fluent was used to simulate the flow field of seed delivery pipe joints to study the effect of seed delivery pipe joints on the overall pressure loss and uniformity of air pressure distribution and to determine the optimal structure of seed delivery pipe joints. Then, the EDEM was simulated for the overall seed delivery pipe and its associated cavity seeders in the absence of positive pressure to analyze the transport pattern of each cotton seed. Finally, CFD-DEM gas-solid coupling simulation experiments were conducted on the center of two rows of seed delivery pipes and their connected cavity seeders to analyze the trajectory of cotton seeds under different rotational speeds of cavity seeders and different positive seed delivery pressures and to deeply analyze the causes of Multiple seeding and Miss-seeding. At the same time, the seeding performance was evaluated by coupling simulation values with single seeding rate and multiple seeding rate as seeding performance evaluation indexes and compared with bench test. The results show that in the coupling simulation, when the speed of the cavity seeders is 20~40 rev/min and the seed delivery tube is passed into 50~150 Pa positive pressure airflow, the single seeding rate is not less than 83.06%, and the missed seeding rate is not more than 9.23%. In the bench test, the single seeding rate was not less than 80.64%, and the missed seeding rate was not more than 9.86% under the same cavity seeders speed and positive pressure, and the results of the bench test and the simulation test were close and consistent, which verified the feasibility of the simulation.

1. Introduction

The pneumatic seed disperser uses the flowing gas provided by the fan to complete a series of sowing process, which is more suitable for high speed and wide precision sowing operation than the traditional mechanical seed disperser with no damage to the seeds and strong versatility [1,2,3]. The pneumatic split cotton seed collector mainly absorbs, carries, and casts the seed through the air-absorbing roller; the seed delivery tube is fed with positive airflow to transport cotton seeds; the cavity seeder breaks the film into the soil and other processes to complete the precision sowing operation, and the processes are precisely coordinated to jointly affect the sowing quality [4]. In the process of air-blown seed delivery [5,6,7,8], the structure of the seed delivery tube and the related working parameters will affect the seed discharge performance of the seed dispenser.
A reasonable seed tube structure cannot only reduce pressure loss but also reduce the friction and collision between the cotton seed and the tube wall, reduce the seed breakage rate, lower energy consumption, and enhance the seeding performance. Sun and Qi et al. conducted a study on the design and pressure loss calculation of the seed delivery pipeline in the airflow first-order set discharge seeding system, respectively, which shortened the delivery distance and reduced the pressure loss [9,10]. To investigate the transport law of different seeds in different seed transport pipes, He et al. carried out experimental research from the basic theory of gas-solid two-phase flow, using seven seeds and 12 pipes, and determined reasonable airflow and pipe structure parameters [11]. Li et al. [12,13] conducted an experimental study on different seed delivery tube lengths and found that as the length of the tube increased, the flow velocity in the tube decreased, and the seed movement slowed down. Hans [14] and Qi et al. [15] conducted experimental studies on the diameter and inclination angle of the seed delivery tube, respectively. Hans found that the inclination angle of the seed delivery tube was 45°, which was favorable for seed movement, and the tube diameter had no effect on the energy loss; Qi et al. concluded that the best performance of the seed releaser was achieved when the inclination angle of the seed delivery tube was 28° and the inner diameter of the seed delivery tube was 22 mm. Although domestic and foreign scholars carry out macroscopic studies of seed delivery tube structure on seed particles by mathematical modelling and bench tests, the complex microscopic change processes inside them are challenging to analyze by traditional research methods.
In recent years, with the development of computer technology, fluent gas simulation technology, discrete element simulation technology, and FLUENT-EDEM coupled simulation methods have been increasingly used in seeder research, solving many practical problems [16,17,18,19]. Zhao et al. [20] conducted an orthogonal simulation experimental study of corn adsorption using a fluent simulation technique. They compared it with a high-speed camera to determine the optimal combination of parameters. Lei et al. [21] used EDEM discrete element software to carry out simulation experiments on seeds inside the seed delivery tube to study the interaction mechanism between seeds and the seed delivery tube and arrive at suitable parameters to improve the seeding uniformity. Han et al. [22] successfully reduced the fan’s energy consumption and improved the seed rower’s operation by simulating different nozzle positions through coupled CFD-DEM. Li et al. [23] conducted coupling simulation tests on gas-solid phases by FLUENT-EDEM coupling method to verify the feasibility of FLUENT-EDEM coupling simulation research method and the transport law under the action of different seed delivery tube lengths. Lei, S. et al. analyzed the effect of seed delivery tube structure on the phase migration process of seed particles by coupled CFD-DEM. Although some scholars have conducted simulation experiments on seed delivery tubes, at the moment, domestic scholars mainly study the air-solid coupling of venturi [24], seed guide tubes and seed dispensers of wheat [25,26], and rape and corn seeders in the coupling simulation of seed dispersal, and the air-solid coupling of single-grain cotton hole sowing on film is relatively little reported [27,28,29].
Xinjiang has a typical temperate continental arid climate with scarce rainfall and high evaporation. The film-on-hole seeder technology carries out resource-conserving tillage from limited water systems, which helps researchers to meet the challenges posed by unfavorable natural resources and protect natural resources such as water and soil while increasing farmers’ net profits [30]. Therefore, further research is needed on the technology of hole sowing on film for cotton in this region.
In order to study the technology of hole sowing on film for cotton in this region, this paper is based on two coupled simulation software, Fluent and EDEM, to simulate each seed delivery tube and cavity seeder with air-suction split centralized seed disperser as the experimental object. Different structural parameters and working parameters were investigated on the airflow distribution of the seed delivery pipe and the transport process of cotton seed particles in the seed delivery pipe and the cavity seeder and were verified by bench test in order to obtain a better seed delivery pipe structure and a suitable combination of working parameters and finally improve the actual working performance of the seed rower.

2. Analysis of the Structure and Pneumatic Seed Delivery Process of the Split Seed Dispenser

2.1. Structure and Working Principle of the Split Seed Rower

As shown in Figure 1, the split type cotton collection and row device can realize six rows of hole sowing on film at one time, and the whole machine mainly consists of three major parts: air suction collection and row drum, seed guide tube, and cavity seeder. When the seed discharger works, the motor drives the drum through the sprocket, and the negative pressure applied by the fan enters the negative pressure shaft through the negative pressure duct, and the negative pressure shaft passes the negative pressure to each suction hole of the drum. When the air-absorbing drum rotates clockwise, the cotton seeds on the upper layer of the seed box are adsorbed to the suction holes due to the pressure difference and rotated together with the air-absorbing drum. When the seeds reach the isolation pressure position, the airflow is blocked by the pressure block inside the air suction and discharge drum; the adsorption pressure disappears, and the seeds are put into the positive pressure seed delivery tube by gravity and centrifugal force. A uniform single seed flow is formed in the pipe, which is finally sent to the cavity seeder uniformly, following the rotation of the cavity seeder to break the film into the soil and complete the precision film sowing operation.
The seed delivery pipe is the key structure connecting the air-absorbing drum and the cavity seeder, which affects the arrangement of the whole machine structure, the airflow loss of the pipe, the seed transport trajectory, and the seed speed and finally affects the uniformity of seed discharge. Its structure is shown in the figure. The seed delivery pipeline mainly consists of joints and subsequent seed delivery pipelines. The cotton seed particles enter through the seed inlet and are in a free fall state at the upper part of the vertical section of the seed delivery pipe joint; when the seeds reach the middle of the seed delivery pipe, they come into contact with the airflow and form a gas-solid mixture, which is then transported to the cavity seeder in a uniform and orderly manner by the subsequent seed delivery pipe.

2.2. Pneumatic Conveying Seed Process Analysis

2.2.1. Pipeline Airflow Resistance and Pressure Loss Analysis

There are mainly along-range drag and local drag in gas-solid two-phase flow. In turbulent flow, the along-stream resistance is mostly caused by fluid mass migration and lateral pulsation [24] and increases with the increase of pipe length. When there is a sudden change in diameter and bend in the pipe, the velocity and flow direction of the airflow changes, resulting in local vortex areas and stagnant areas, causing local pressure loss. Therefore, an airflow field pressure loss analysis is required for the corresponding structure.

2.2.2. Pressure Loss Calculation for Each Section

The pressure loss in the pneumatic seed delivery tube is mainly divided into two parts: pure air flow pressure loss and additional pressure loss from seed movement, and the seed pipeline is mainly composed of linear and bending sections, so the linear section pressure loss formula and bending section pressure loss formula can be used to calculate the total pressure loss [31,32].
The total pressure loss ΔPmt in a straight section is calculated as follows:
Δ P m t = P 1 P 2 = ρ 2 v 2 2 2 ρ 1 v 1 2 2 + Δ P s a + Δ P g + Δ P s f + Δ P s s + Δ P q
The first bracketed term on the right side of the equation is the incremental kinetic energy of air acceleration, which is very small and negligible. Since the seed guide tube is a pneumatic transport of single seeds at orderly intervals, there is basically no pressure loss ΔPss between seed particles, so the formula can be simplified as:
Δ P m t = P 1 P 2 = Δ P s a + Δ P g + Δ P s f + Δ P q
Among them:
Δ p s a = 1 2 λ s a μ ρ v 2 Δ p g = λ g μ ρ v 2 τ L 2 D Δ p s f = λ s f μ ρ v 2 τ L 2 D Δ p q = λ ρ v 2 L 2 D τ = u v  
where ΔPsa is the cotton seed acceleration pressure loss, Pa; ΔPg is the gravitational pressure loss of the cotton seed, Pa; ΔPsf is the frictional pressure loss of the cotton seed on the pipe wall, Pa; ΔPq is the pure air pressure loss, Pa; λsa is the accelerated pressure loss coefficient; λ is the pressure loss coefficient of airflow in the horizontal tube; λsf is the pressure loss coefficient of cotton seed in the horizontal tube; λg is the gravitational pressure loss coefficient; μ is the material to gas ratio; ρ is the density of the airflow in the pipe, 1.205 kg/m3; v is the fan given airflow velocity, m/s; u is the cotton seed critical velocity m/s; L is the horizontal pipe length, m; D is the pipe inner diameter, m.
The bending section pressure loss ΔPw is calculated by the following equation:
Δ p w = ζ w + λ w 1 + λ w 2 + λ w 3 π R 0 2 D μ ρ v 2 2  
ξw is the friction coefficient of airflow in the bend; λw1 is the impact and friction pressure loss coefficient of cotton seed in the bend; λw2 is the acceleration pressure loss coefficient of cotton seed in the bend; λw3 is the gravity pressure loss coefficient of cotton seed in the bend; R0 is the bending radius of the bend section, m.
The total pressure loss of the pneumatic seed transmission pipeline is calculated by the formula:
Δ P A = Δ P m t + Δ P w  
The above pressure loss formula analysis can be obtained when the airflow speed and material to gas ratio are certain; the greater the length of the seed delivery pipe and the corresponding pressure loss coefficient, the greater the total pressure loss of the pipe, into a positive correlation; the larger the inner diameter of the seed pipe and the bending radius of the bend section, the smaller the total pressure loss of the pipe, which is negatively correlated; the total pressure loss is positively related to the given airflow speed of the fan, the material-to-air ratio, and the corresponding pressure loss coefficient when the seed delivery piping structure is inevitable. In conclusion, the unreasonable pressure loss will further affect the transport law of cotton seeds and make it difficult to realize uniform seed delivery operation, which requires further theoretical research on the force of cotton seeds.

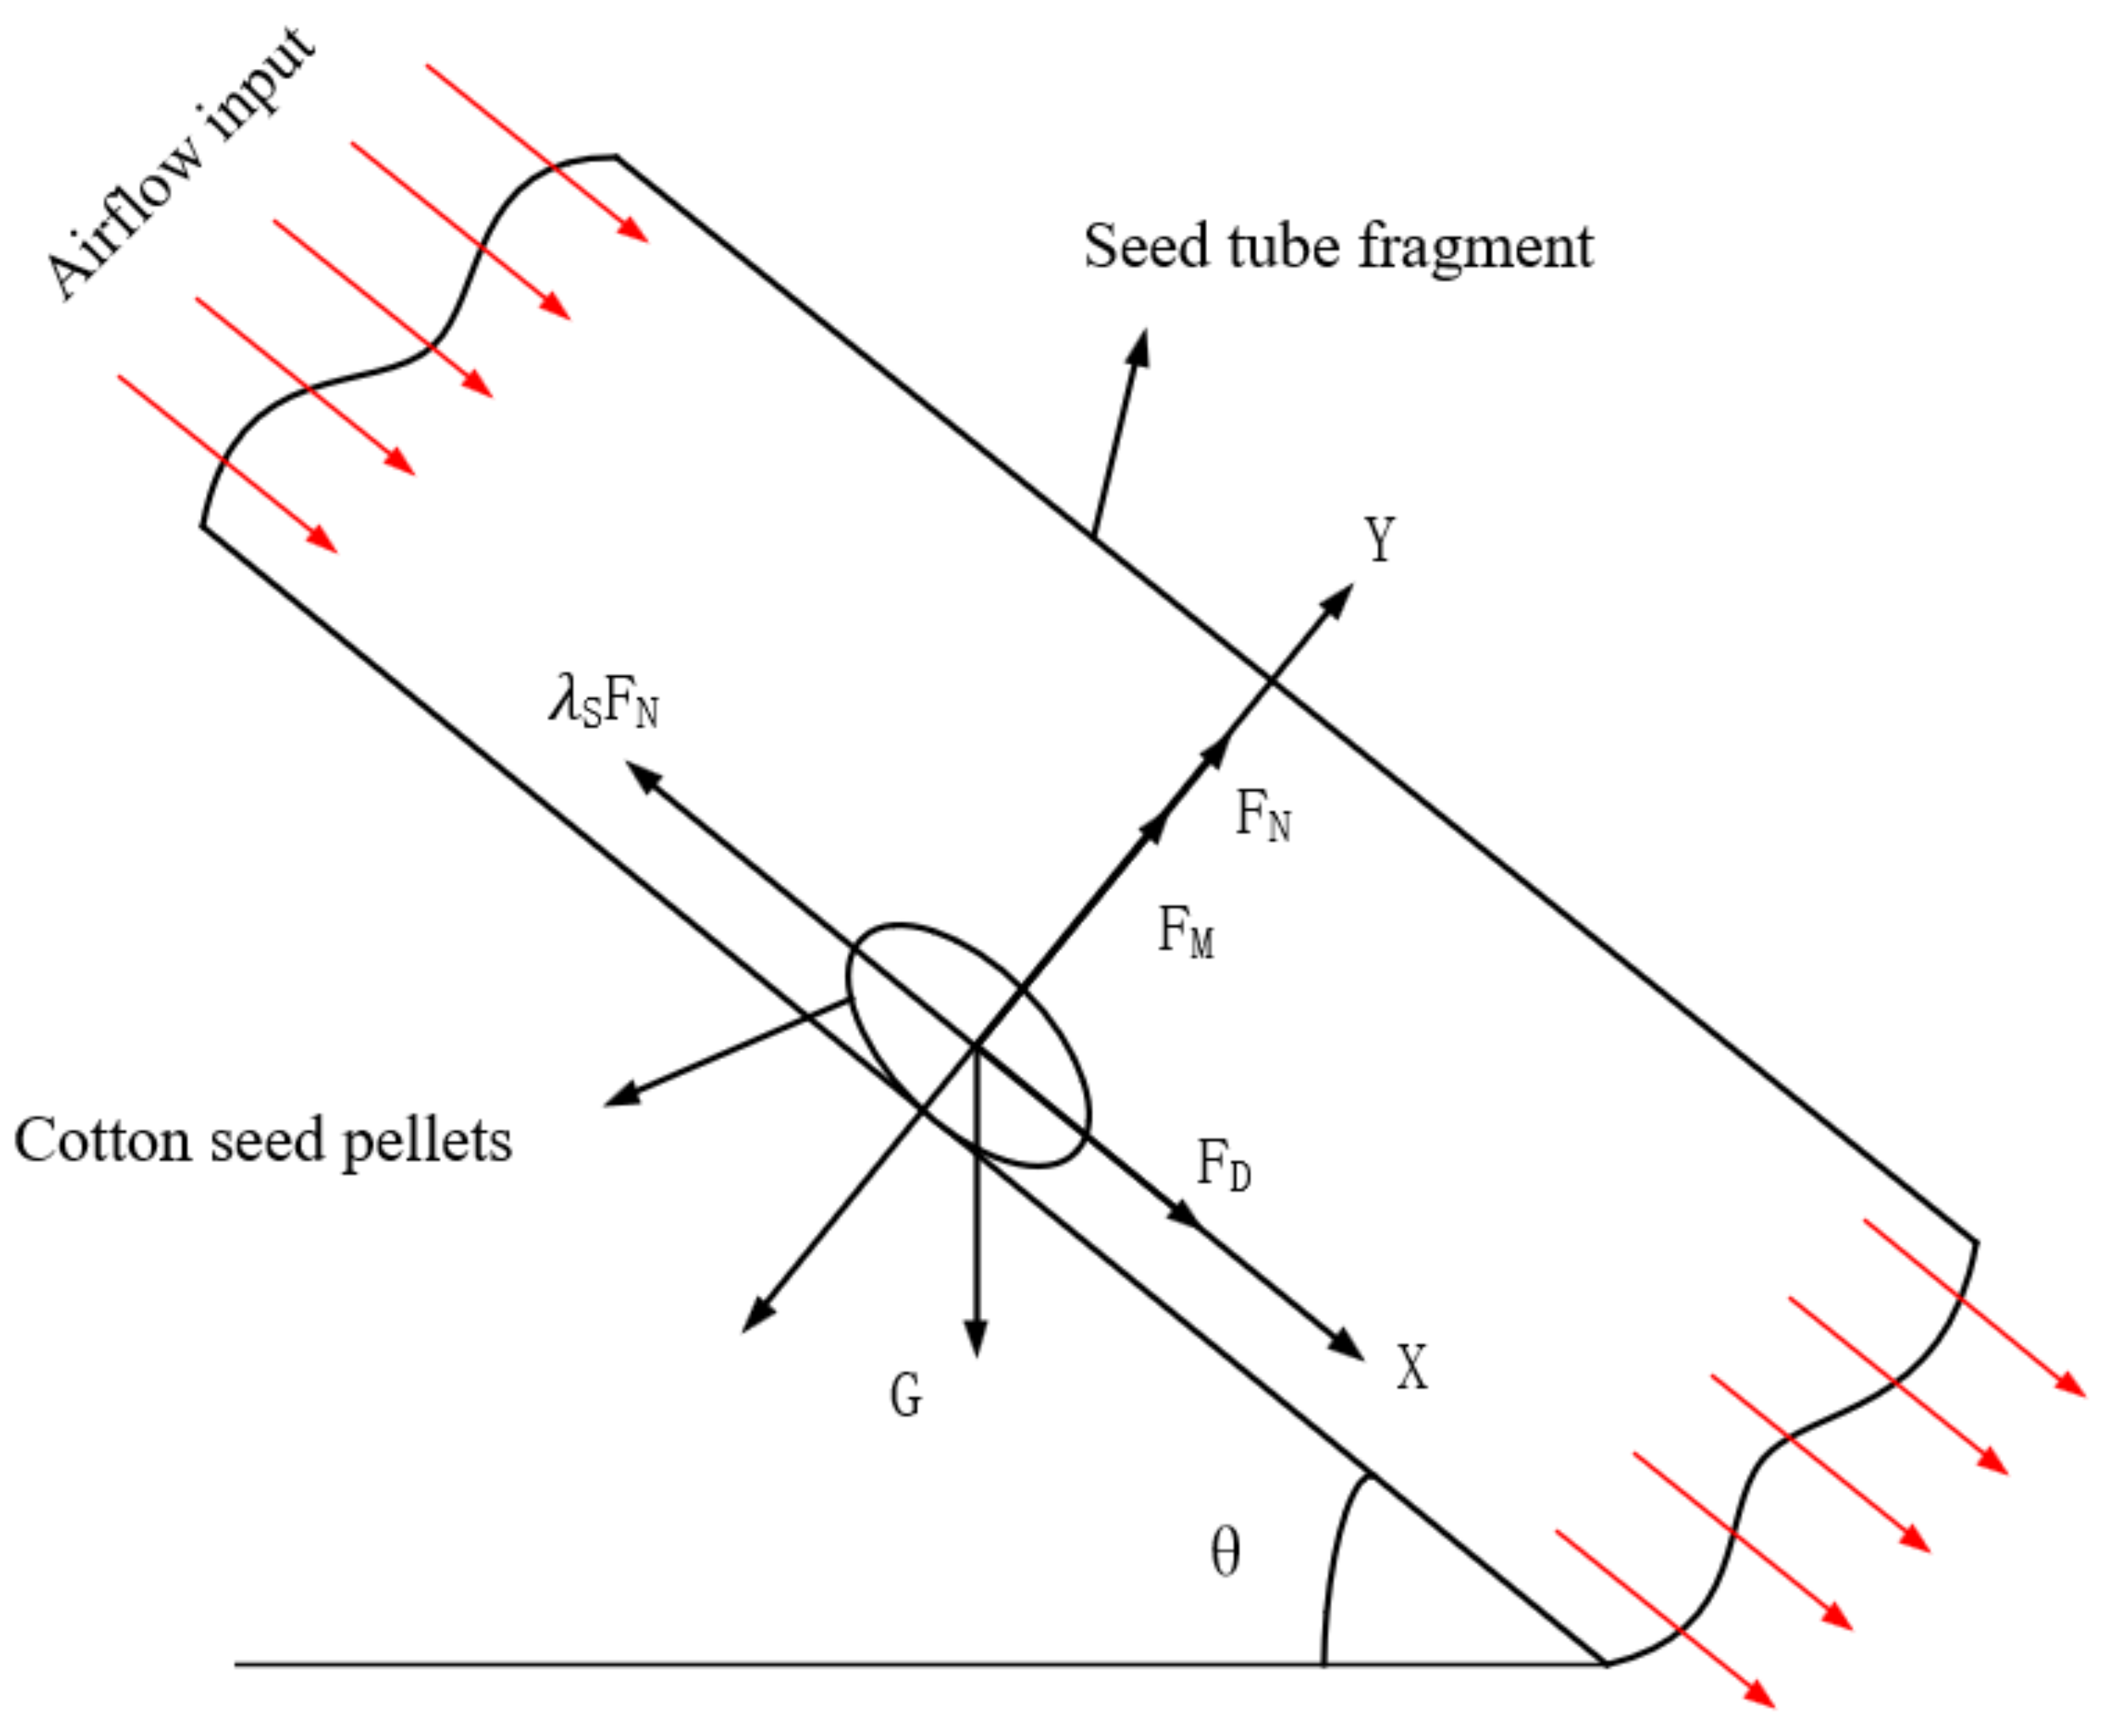
2.2.3. Force Analysis of Cotton Seeds

The transport process of cotton seeds in the pneumatic seed transfer tube should reduce the contact with the tube wall, but the actual situation of the seed transfer tube arrangement is difficult to achieve the exact same direction as the movement of cotton seed particles, resulting in the movement of cotton seeds in straight and curved tubes which will inevitably come into contact with the tube wall. Assume that the movement of cotton seed particles in the seed guide tube at a certain moment is shown in Figure 2. According to the theory of gas-solid two-phase fluid mechanics, the forces on the cotton seed particles moving in the airflow field include the gravity of the cotton seed itself, the traction force of the airflow on the cotton seed, the lift force generated by the rotation of the cotton seed, the lift force and pressure gradient force generated by the velocity difference and pressure gradient on both sides of the cotton seed, etc. Among them, the main impact on the movement of cotton seeds is gravity, traction, and rotational lift; the other forces can be disregarded [33,34].
The equation for the force on cotton seed is as follows:
F X = F D + G c o s θ λ s F N F y = F M + F N G s i n θ F D = 1 2 A C ρ V 2  
Among them:
G = m g V 2 = 2 P ρ
According to Newton’s second law, the acceleration of the cotton seed in the x-axis direction α can be obtained from Equations (6) and (7):
α = A C P m + g c o s θ λ s F N m  
FD is the traction force of the airflow on the cotton seed, N; FN is the support force of the tube wall on the cotton seed, N; FM is the lift force generated by the rotation of the cotton seed, N; G is the gravity, m/s2; P is the airflow pressure in the pipe, Pa; A is the windward force area of the cotton seed, m2; P is the density of airflow in the pipe, 1.205 kg/m3; V is the velocity of airflow, m/s; C is the drag coefficient; λs is the friction coefficient of the pipe wall.
From Equation (8), it can be concluded that the acceleration of the cotton seed is mainly related to the airflow pressure P given by the fan, the angle between the direction of movement of the cotton seed and the pipe wall, and the pipe material. Different working parameters and structural parameters have an impact on the uniformity of cotton seed transport. The more significant the wind pressure, the greater the airflow pressure, the smaller the angle between the cotton seed and the tube wall, and the greater the acceleration, but too much wind pressure is prone to unnecessary waste and easy to cause seed damage caused by the larger force when the cotton seed enters the cavity seeder. When the wind pressure is given, the number of seeds in the seed delivery tube increases, resulting in the reduction of the relative windward force area of the seeds, which in turn affects the transport speed of the seeds. When the working parameters are certain, different pipe structures, such as pipe joint structure, pipe diameter, bend curvature, etc., will change the direction and size of the given airflow and eventually affect the cotton seed transport law.
The above theoretical analysis shows that different working parameters and the structure of the seed guide tube can affect the cotton seed in uniform single seed transport. Due to the existence of unclear parameters in the theoretical equations, it is difficult to determine the actual seed guide structure and various working parameters by the equations alone, and further simulation experimental studies are needed to obtain the optimal structure and working parameters.

3. Simulation Analysis of Seed Delivery and Seeding

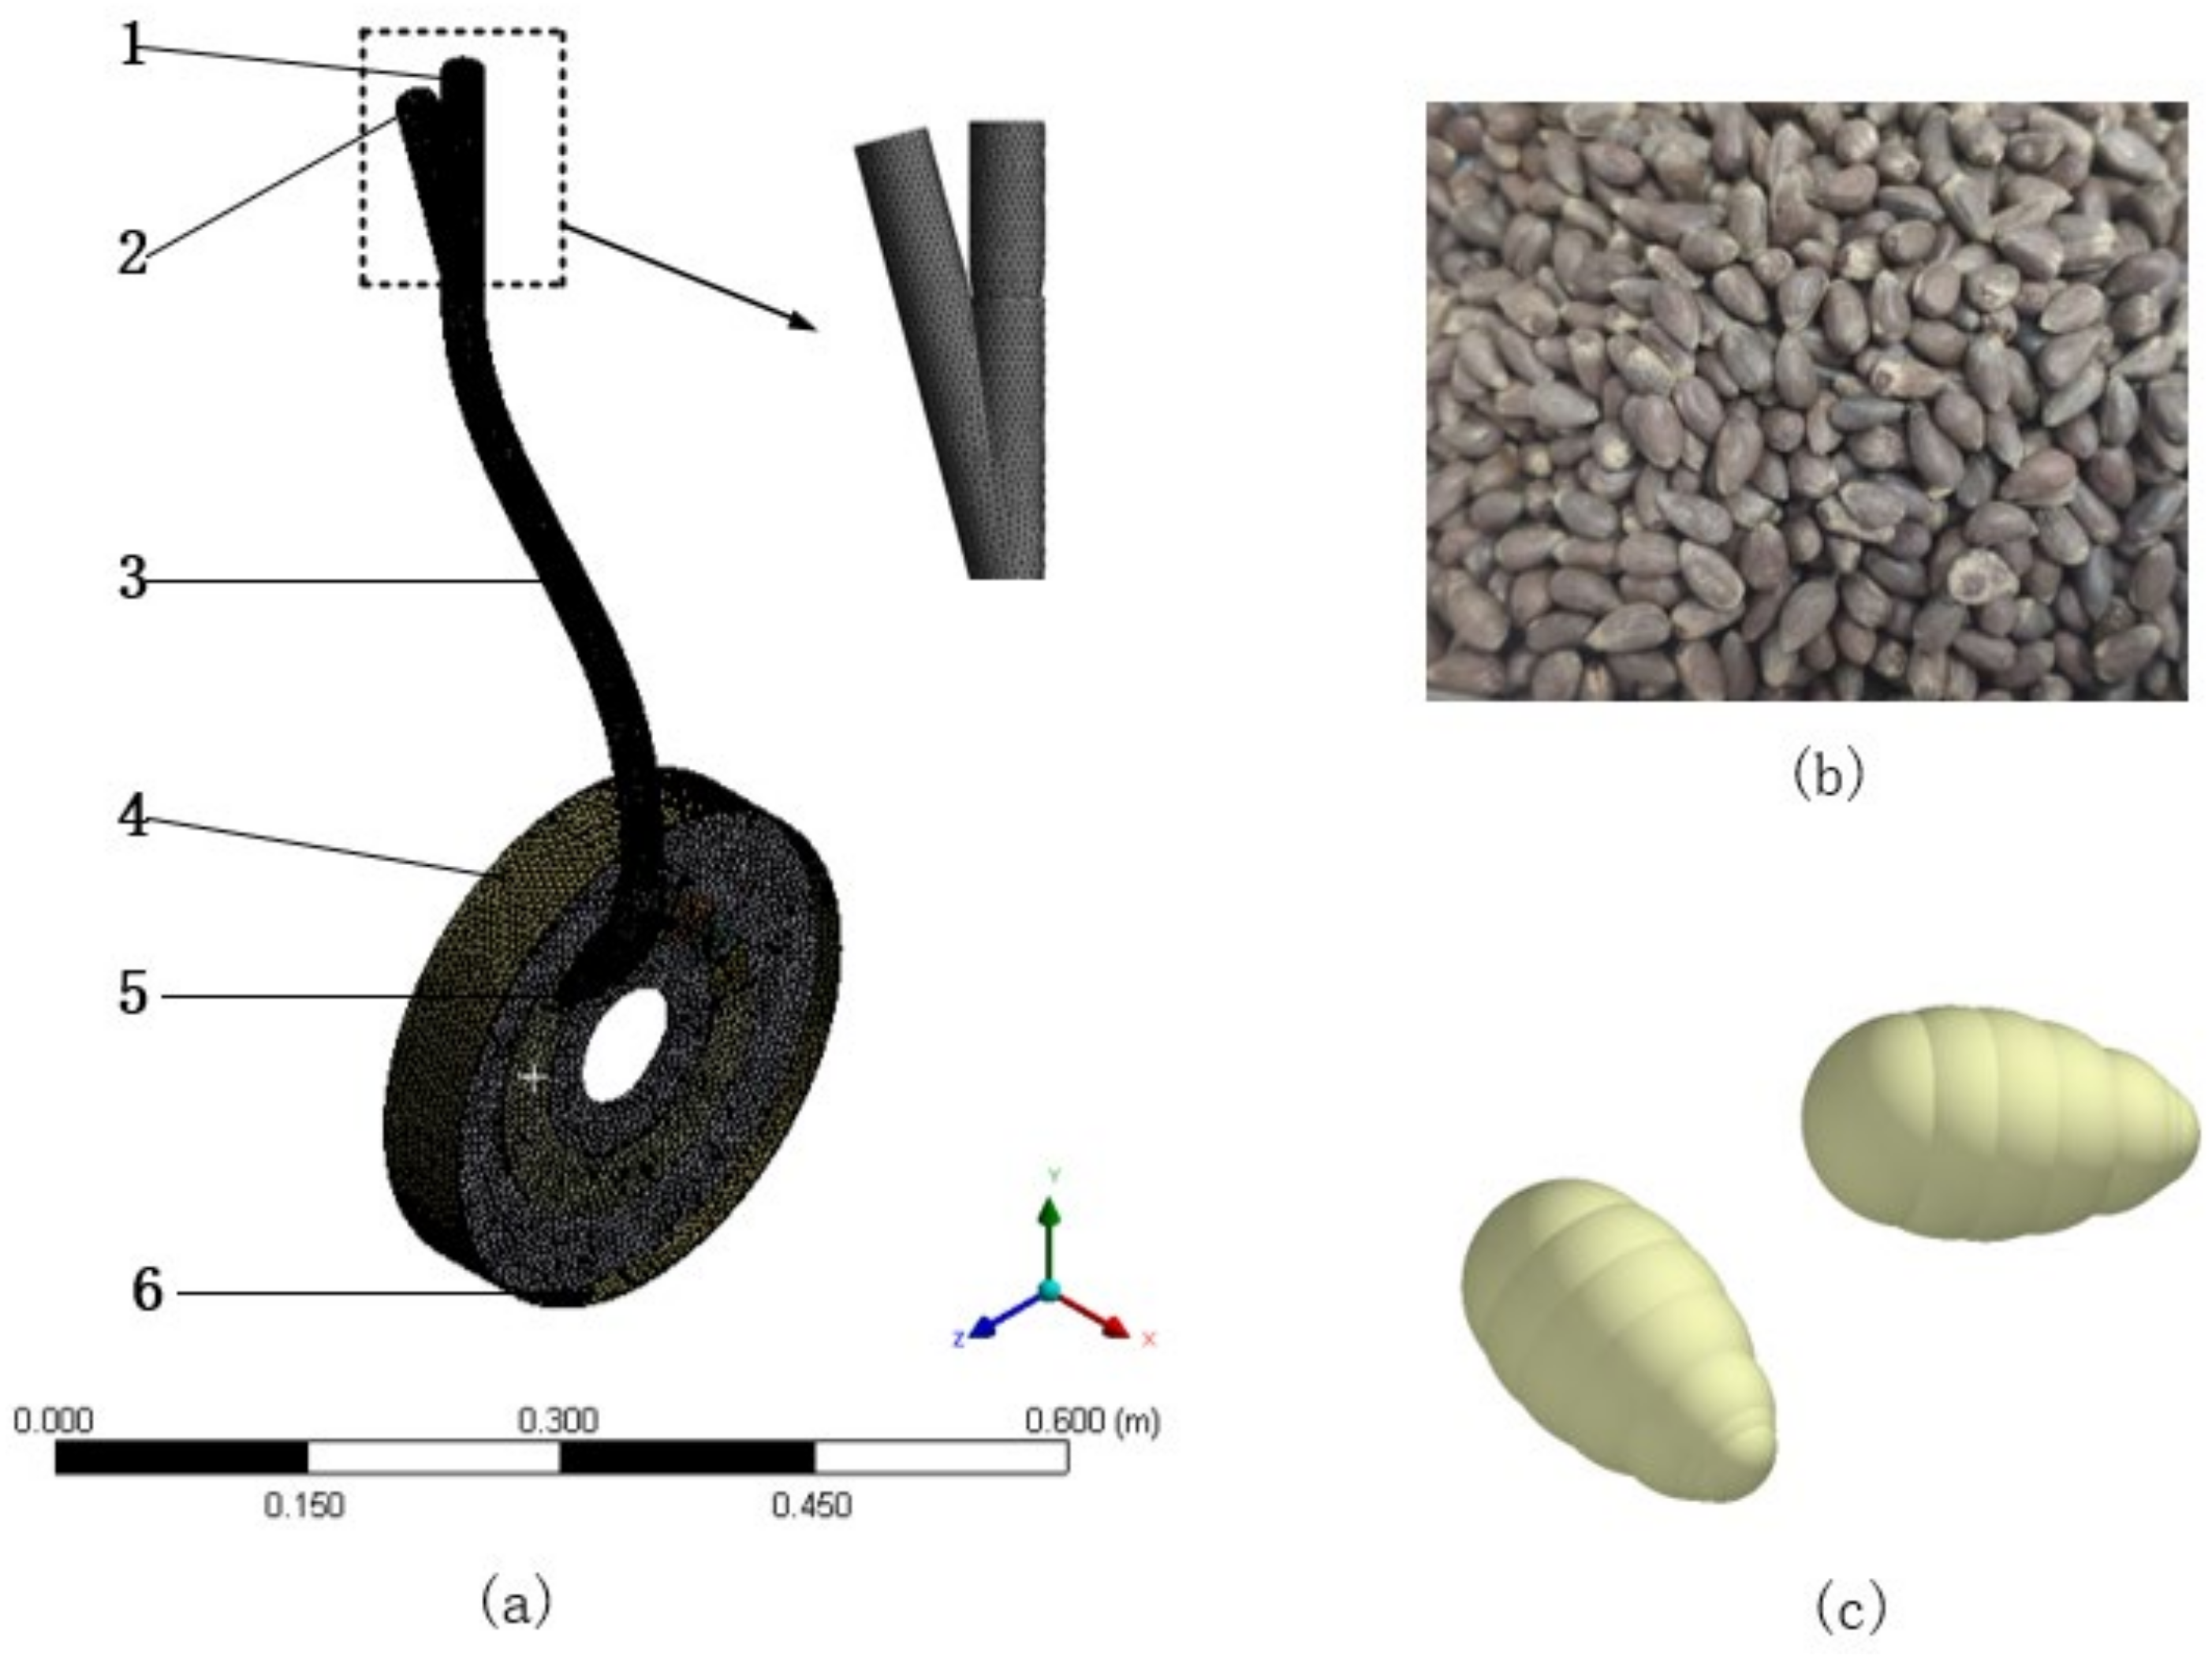
3.1. Simulation Model

Because of the high quality and low quantity of structural meshes compared with non-structural meshes and the speed of subsequent simulation, the non-structural meshes are simple to operate and easy to delineate in complex areas; the mesh component was used in Workbench 19.0 to perform mixed meshing of structural and non-structural meshes for the seed delivery tube and its connected cavity seeder. All the grid evaluation indexes are better and meet the simulation test indexes, and the grid division is shown in Figure 3. The air inlet is set as the pressure inlet, and the seed inlet and the seed outlet are set as pressure outlet. The airflow provided by the external fan enters through the airflow inlet and the final air-solid flow flows from the seed outlet into the seeding compartment of the cavity seeder.
Figure 3b shows the actual cotton seeds; the variety is Xinlu Early 48 (length: 8.94 ± 0.63; width 5.19 ± 0.19; thickness 4.82 ± 0.31) [4]. Based on the sample data of the three axes dimensions of the natural cotton seeds, the Modify shape function in EDEM software is used to build the cotton seed simulation model, which is similar to the actual cotton seeds by more than 90%, and the standard deviation is 5% when generated.

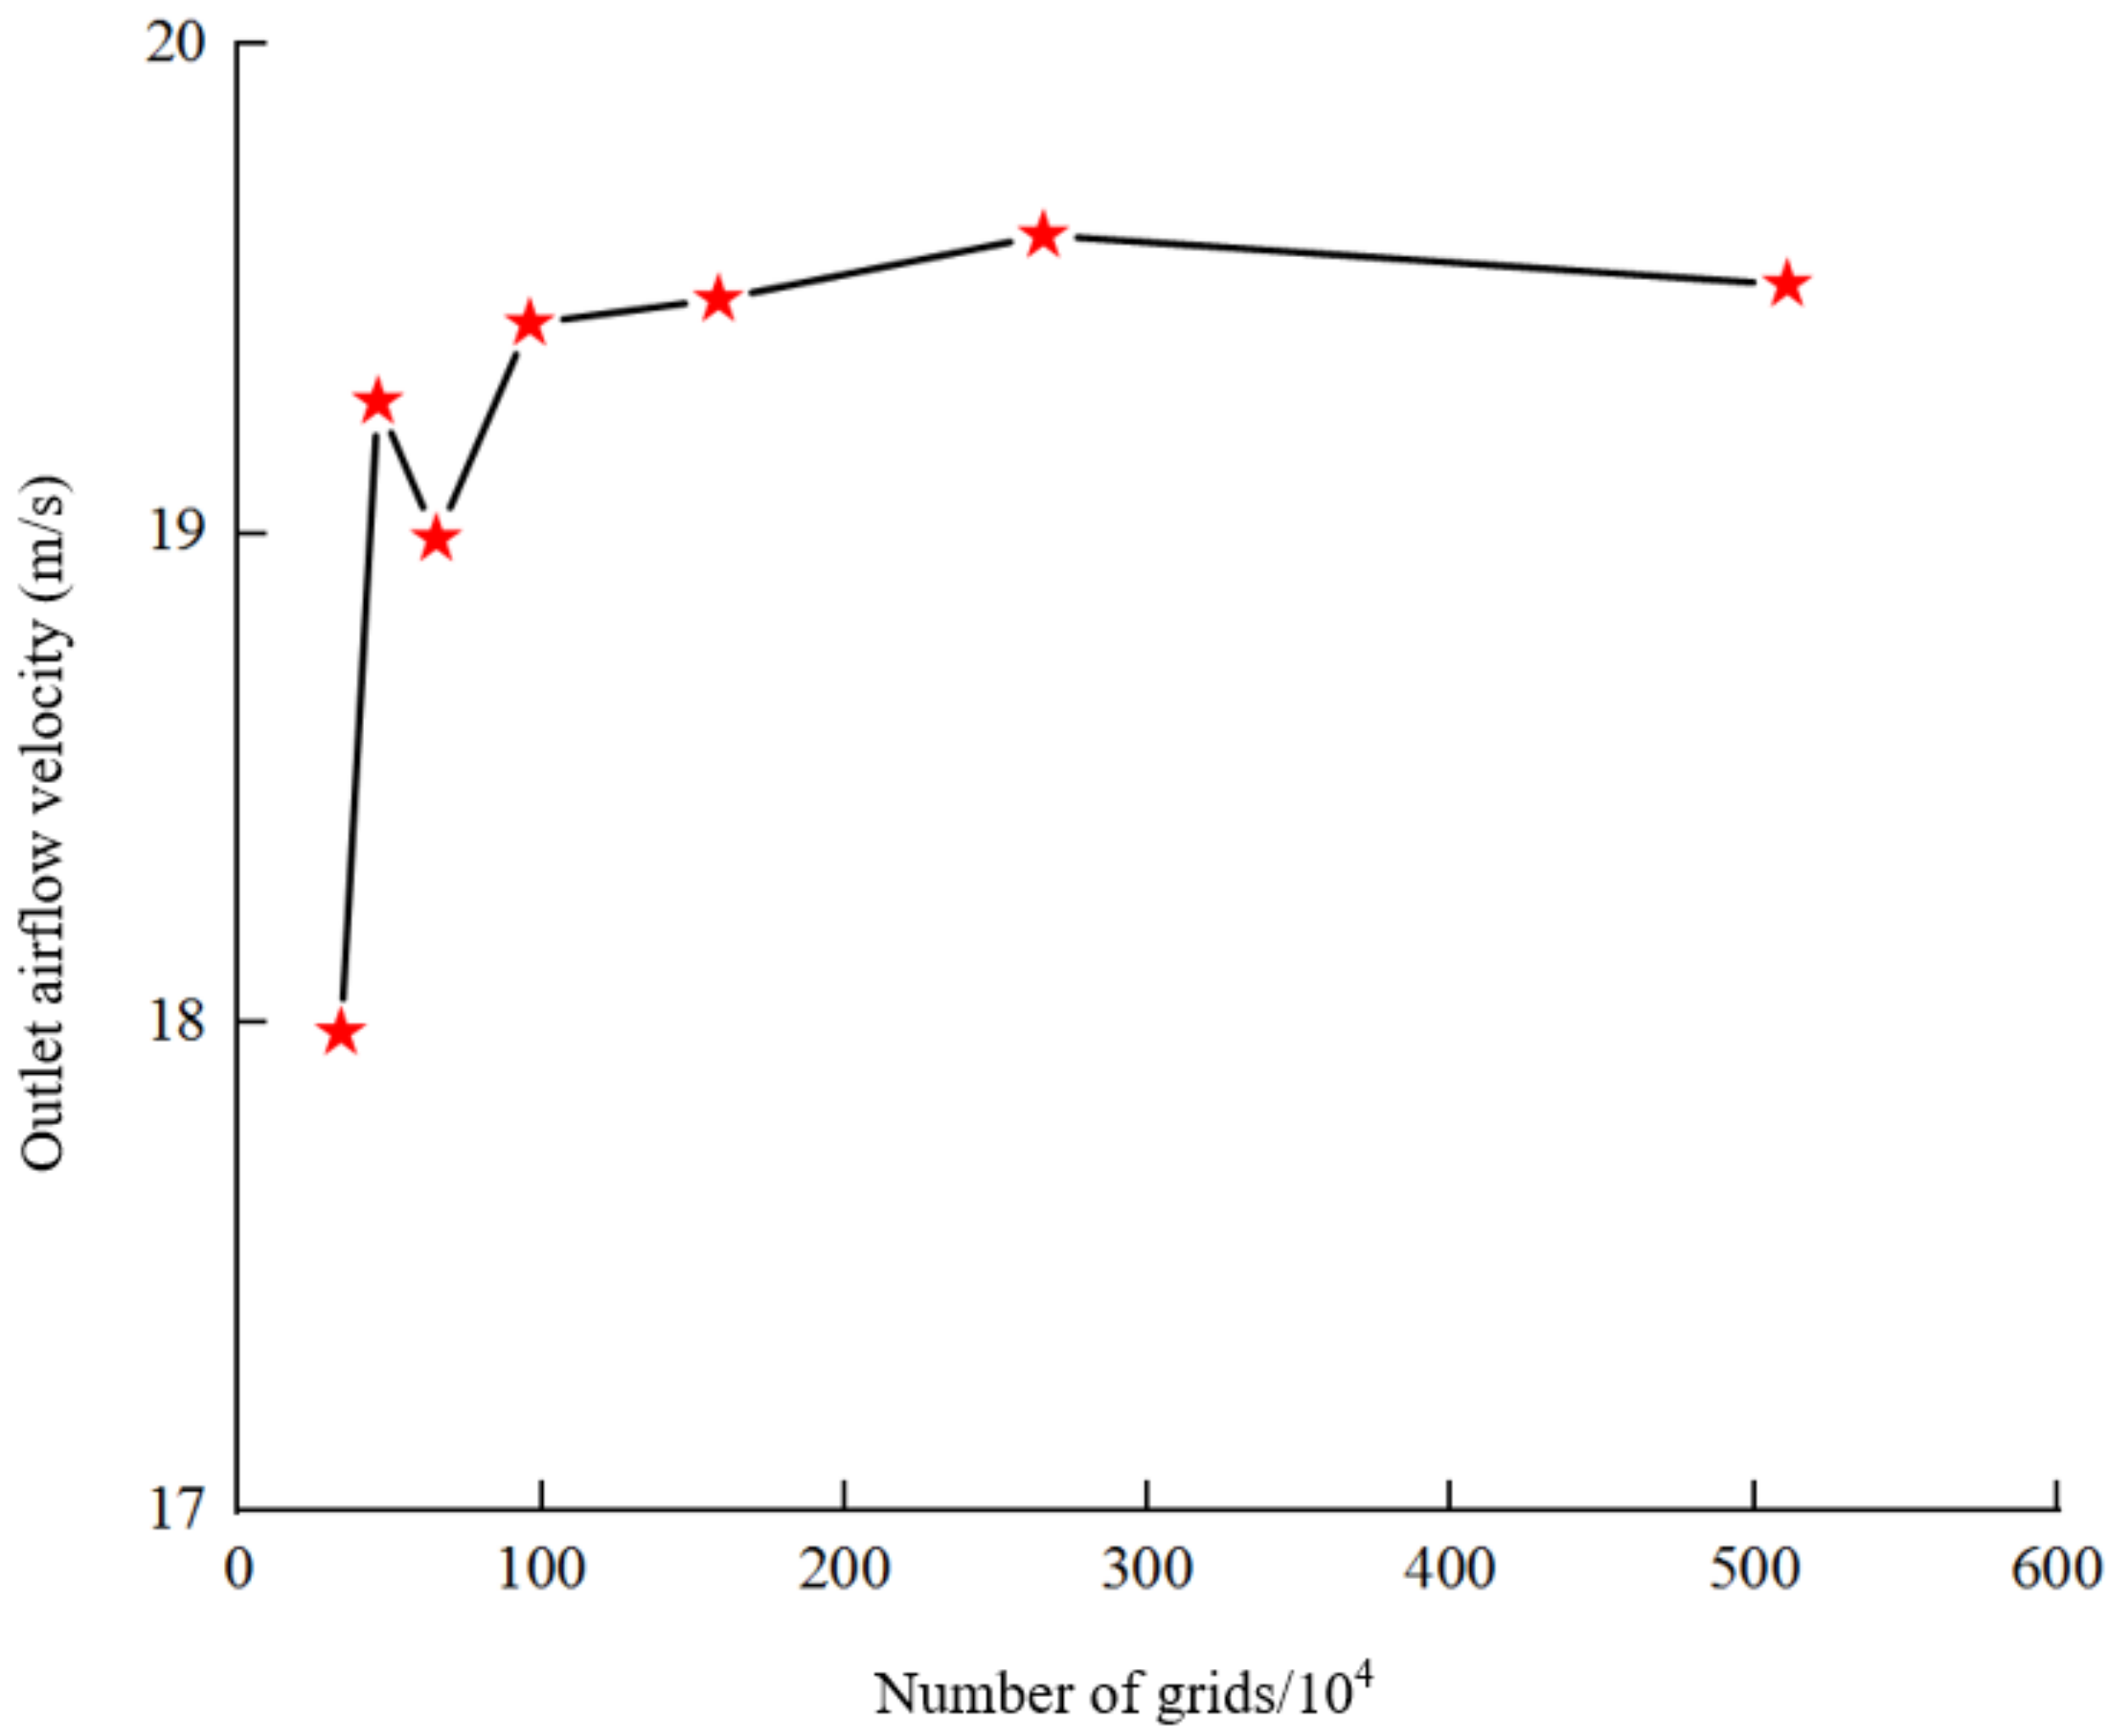
3.2. Grid Irrelevance Verification

The mesh is the carrier of fluid simulation calculation, and the size and quantity of the mesh determine the accuracy and time of the solution. In order to verify the rationality of mesh selection for the simulation model in this study, meshing of six rows of seed delivery pipe model with different densities is carried out. The number of grids for the computational model is 337,000, 458,000, 651,000, 959,000, 1,582,000, 2,652,000, and 5,106,000, respectively. Figure 4 (The red stars are the data nodes: the exit airflow velocity nodes corresponding to different numbers of grid models.) represents the values of the gas-solid mixture exit velocity in row 3, monitored as the model grid is refined, when other conditions are the same, and it can be seen from the figure that the airflow velocity at the exit changes very little when the number of grids exceeds 100,000, which means that continuing to increase the number of grids has less influence on the calculation results, and it can be considered that the 158,200 grids already meet the simulation requirements.

3.3. Simulation Test Design

3.3.1. Fluent-Based Simulation Tests

The primary purpose of this paper is to improve the seed delivery pipe structure, find out the optimal working parameters, make the seed delivery pipe airflow evenly distributed, reduce the frictional contact between the cotton seed particles and the pipe wall, realize the uniform hole sowing of single cotton seed, and finally improve the sowing performance; the two pipe clamping angles and the inflow structure were selected as the test factors for the fluent simulation test to analyze the airflow distribution and pressure loss of each structure and arrive at the optimal seed delivery pipe structure. In the simulation model, the angle θ of the two pipes is 15°, 30°, 45°, and 60°, and the inflow structure is cylindrical, round table, and vertical plate, and the joint form is shown in Figure 5. During the simulation, the diameter of the seed delivery pipe joint was 25 mm; the airflow inlet pressure was set to 500 Pa, and the speed of the cavity seeder was 40 rev/min.

3.3.2. EDEM-Based Simulation Test

The EDEM discrete element software was used to simulate the whole seed delivery pipe and its cavity seeder without positive pressure to observe the transport pattern of cotton seed particles inside. The rotation speed of the cavity seeder is set at 40 rev/min, and the height of the seed drop is 1500 mm; the diameter of the seed delivery tube is 25 mm.

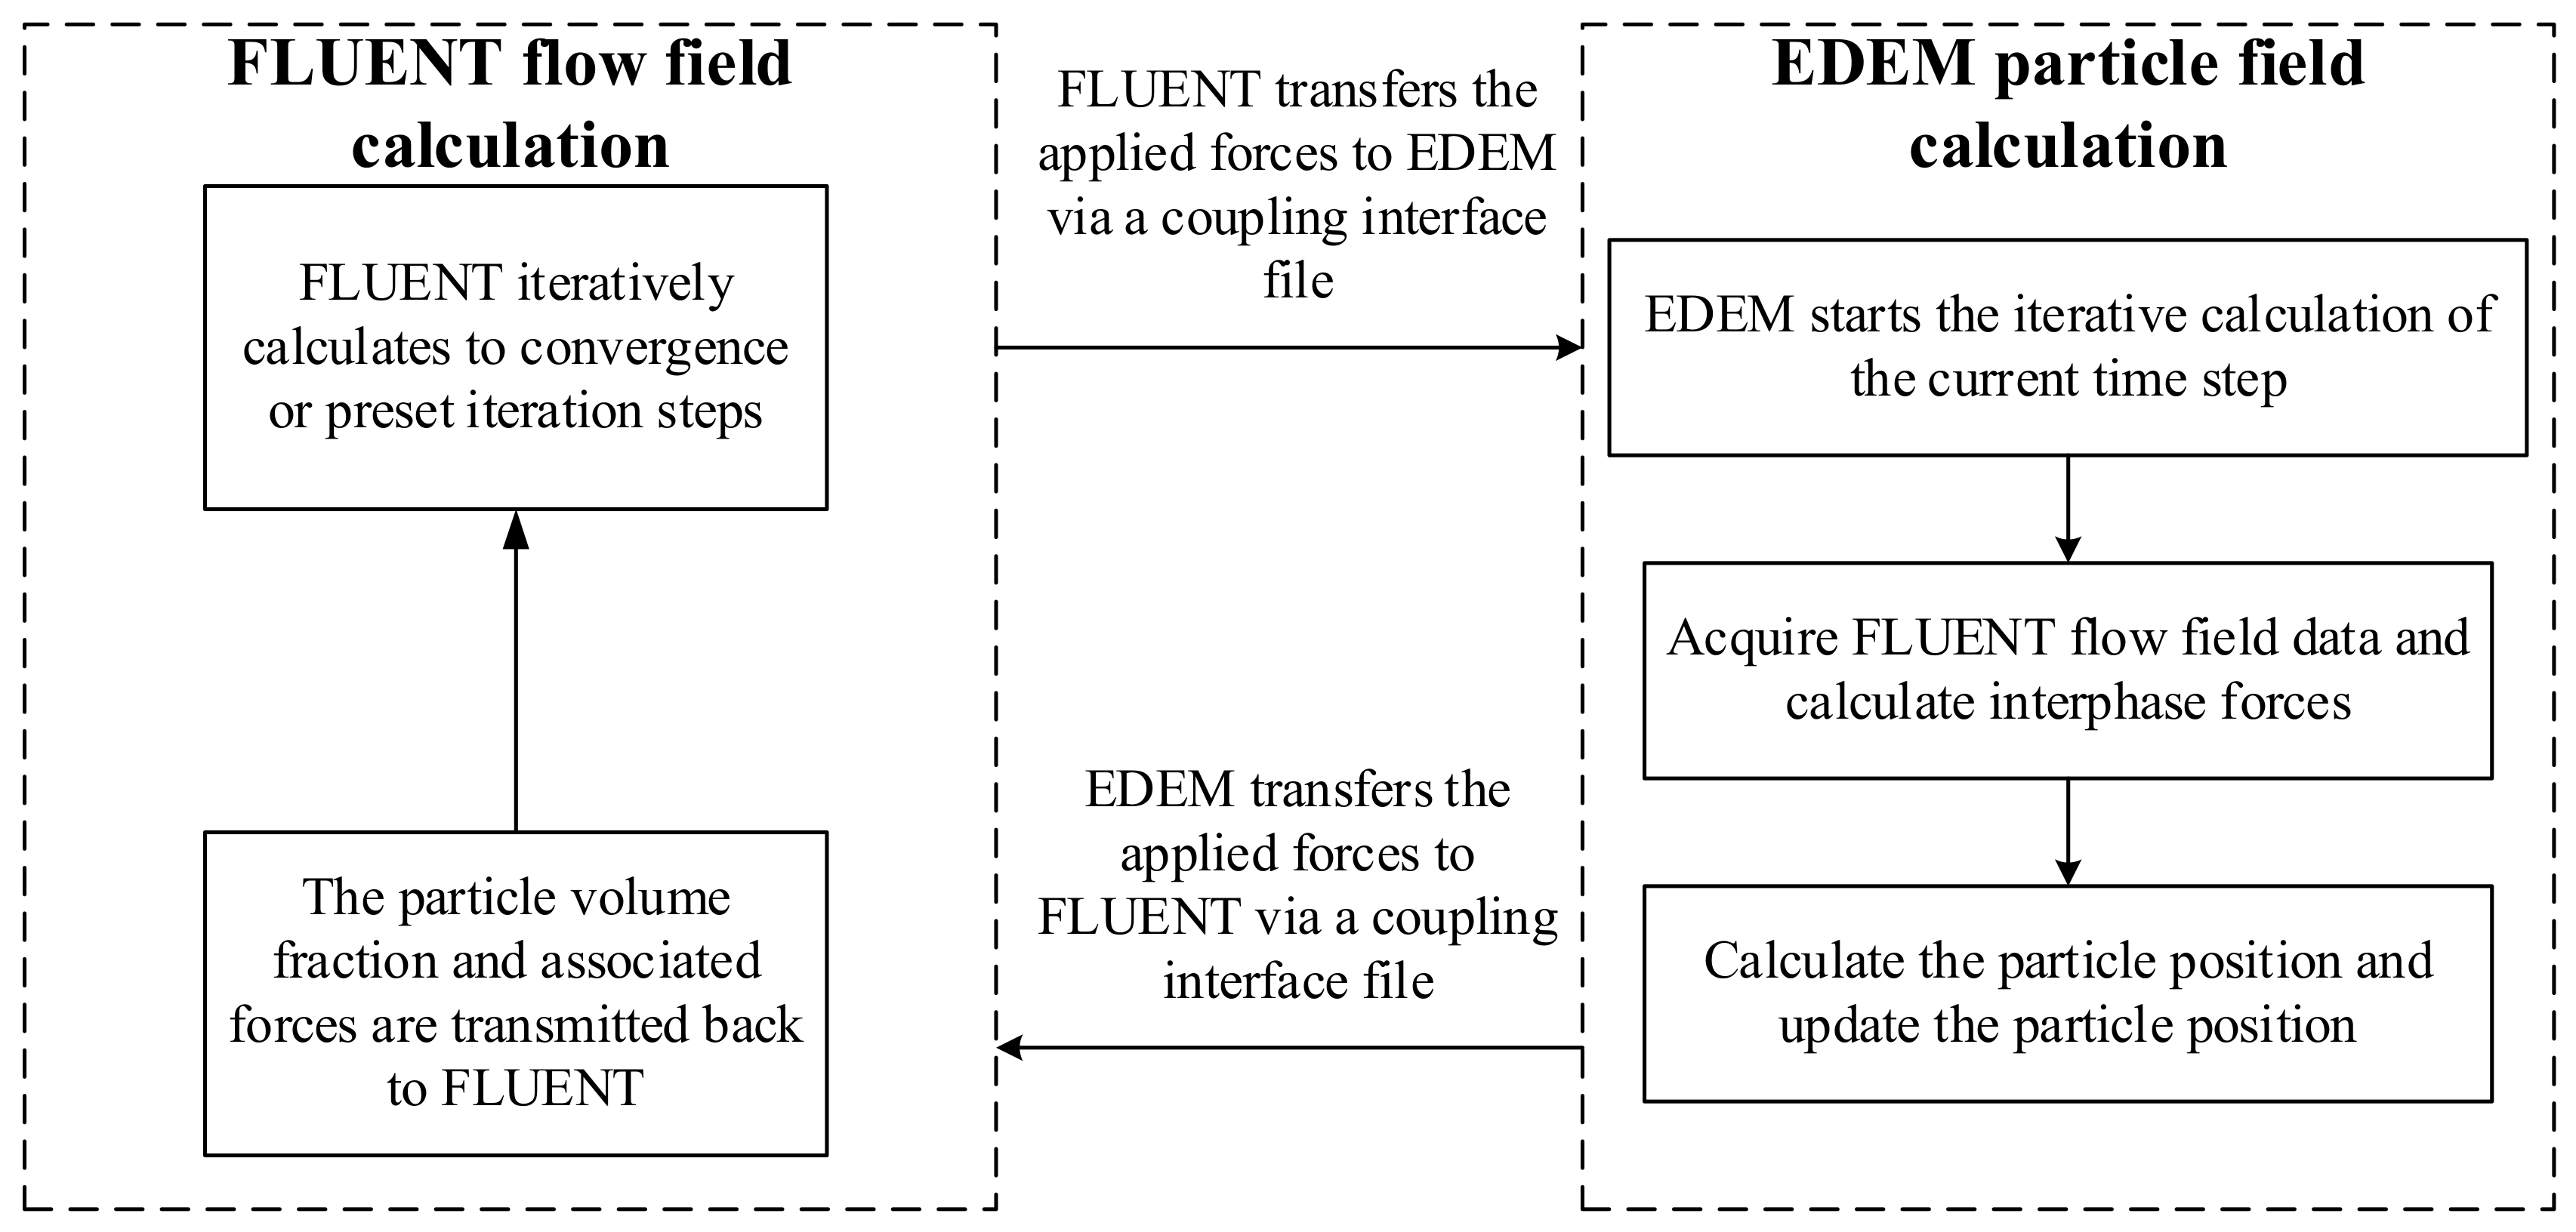
3.3.3. FLUENT-EDEM Based Coupling Simulation Test

Further coupling simulations were performed on the center row at the height of the bench test (700 mm seed drop height, seed tube diameter 25 mm), using positive air blowing pressure and hole sower speed as experimental factors to study the effect of cotton seed movement and air flow field on seed single seed rate. The better air-blowing positive pressure range of 0~350 Pa is selected according to the simulation pre-experiment results; the forward speed of the field machine is 1.89~4.73 km/h, which corresponds to the speed range of the hole sower: 20~50 rev/min by theoretical formula calculation. According to GB/T 6973-2005 “Single grain (precision) sower test method”, using the single seeding rate and missed seeding rate as an evaluation index [28], through the analyst module in EDEM and playback coupling simulation process, one grain per hole is recorded as pass; two or more grains per hole are recorded as resowing; zero grains per hole is recorded as miss sowing; 250 cotton seeds are recorded continuously. Each group of the test was repeated three times to take its average value, and for each group of test hole sowing single grain rate A1 and missed seeding rate M1, each test index calculation formula was as follows:
A 1 = n 1 250
M 1 = n 2 250
where n1 is the total frequency of 1 seed in 1 hole; n2 is the total frequency of 0 seed in 1 hole.

3.4. Coupling Simulation Process

In this CFD-DEM coupling simulation test, FLUENT19.0 software and EDEM2018 software were used to carry out the relevant coupling simulation test. Since the volume of cotton seeds accounts for less than 10% of the total volume inside the pneumatic seed delivery tube, the Eulerian-Lagrangian coupling model is chosen to achieve not only the momentum exchange between the gas term and the cotton seed particle term but also to take into account the effect of the particle volume on the gas continuum term, which can accurately analyze the interaction between the two gas-solid flows [29]. The coupled flow process is shown in Figure 6. First, FLUENT iteratively calculates the airflow field in time steps, and if the current time step converges or reaches the preset number of iteration steps, the airflow force is applied to the EDEM through the UDF coupling interface file, which affects the particle motion. Meanwhile, EDEM performs iterative calculations of the same time step by the discrete element method and imports the particle volume, position, and velocity information into fluent through the coupling interface, thereby calculating the interaction between the particles and the flow field. The entire coupling simulation process is achieved by iterating the calculation until the set convergence value is reached.

3.5. Simulation Parameter Setting

The airflow field was modeled in FLUENT using the standard K-ε viscosity model with an incoming airflow density of 1.225 kg/m3, a viscosity of 1.7894 × 10⁻⁵, and a gravitational acceleration of 9.81 m/s2. The coupling simulation was performed in FLUENT software by selecting the Freestream Equation traction model, Saffman Lift, and Magnus Lift models in the coupling module to simulate the forces of the airflow field on the cotton seeds. The parts of the seed delivery tube and the cavity seeder in the simulation model are plastic. The characteristics of the cotton seed and plastic and their mutual contact parameters are shown in Table 1 [4,35]. The Hertz-Mindlin (No Slip) model was selected in EDEM, and the Remove Particles model was added at the cotton seed outlet to ensure the normal outflow of gas-solid two-phase flow [30]. To ensure that the time step in Fluent is much larger than that in EDEM and is an integer multiple, the time steps in Fluent and EDEM are set to 5 × 10⁻³ and 1 × 10⁻⁵, respectively, and the number of Fluent time steps is set to 6000; i.e., the total coupling simulation time is the 30 s, and the total cotton seed particles reach 290.

3.6. Simulation Results and Analysis

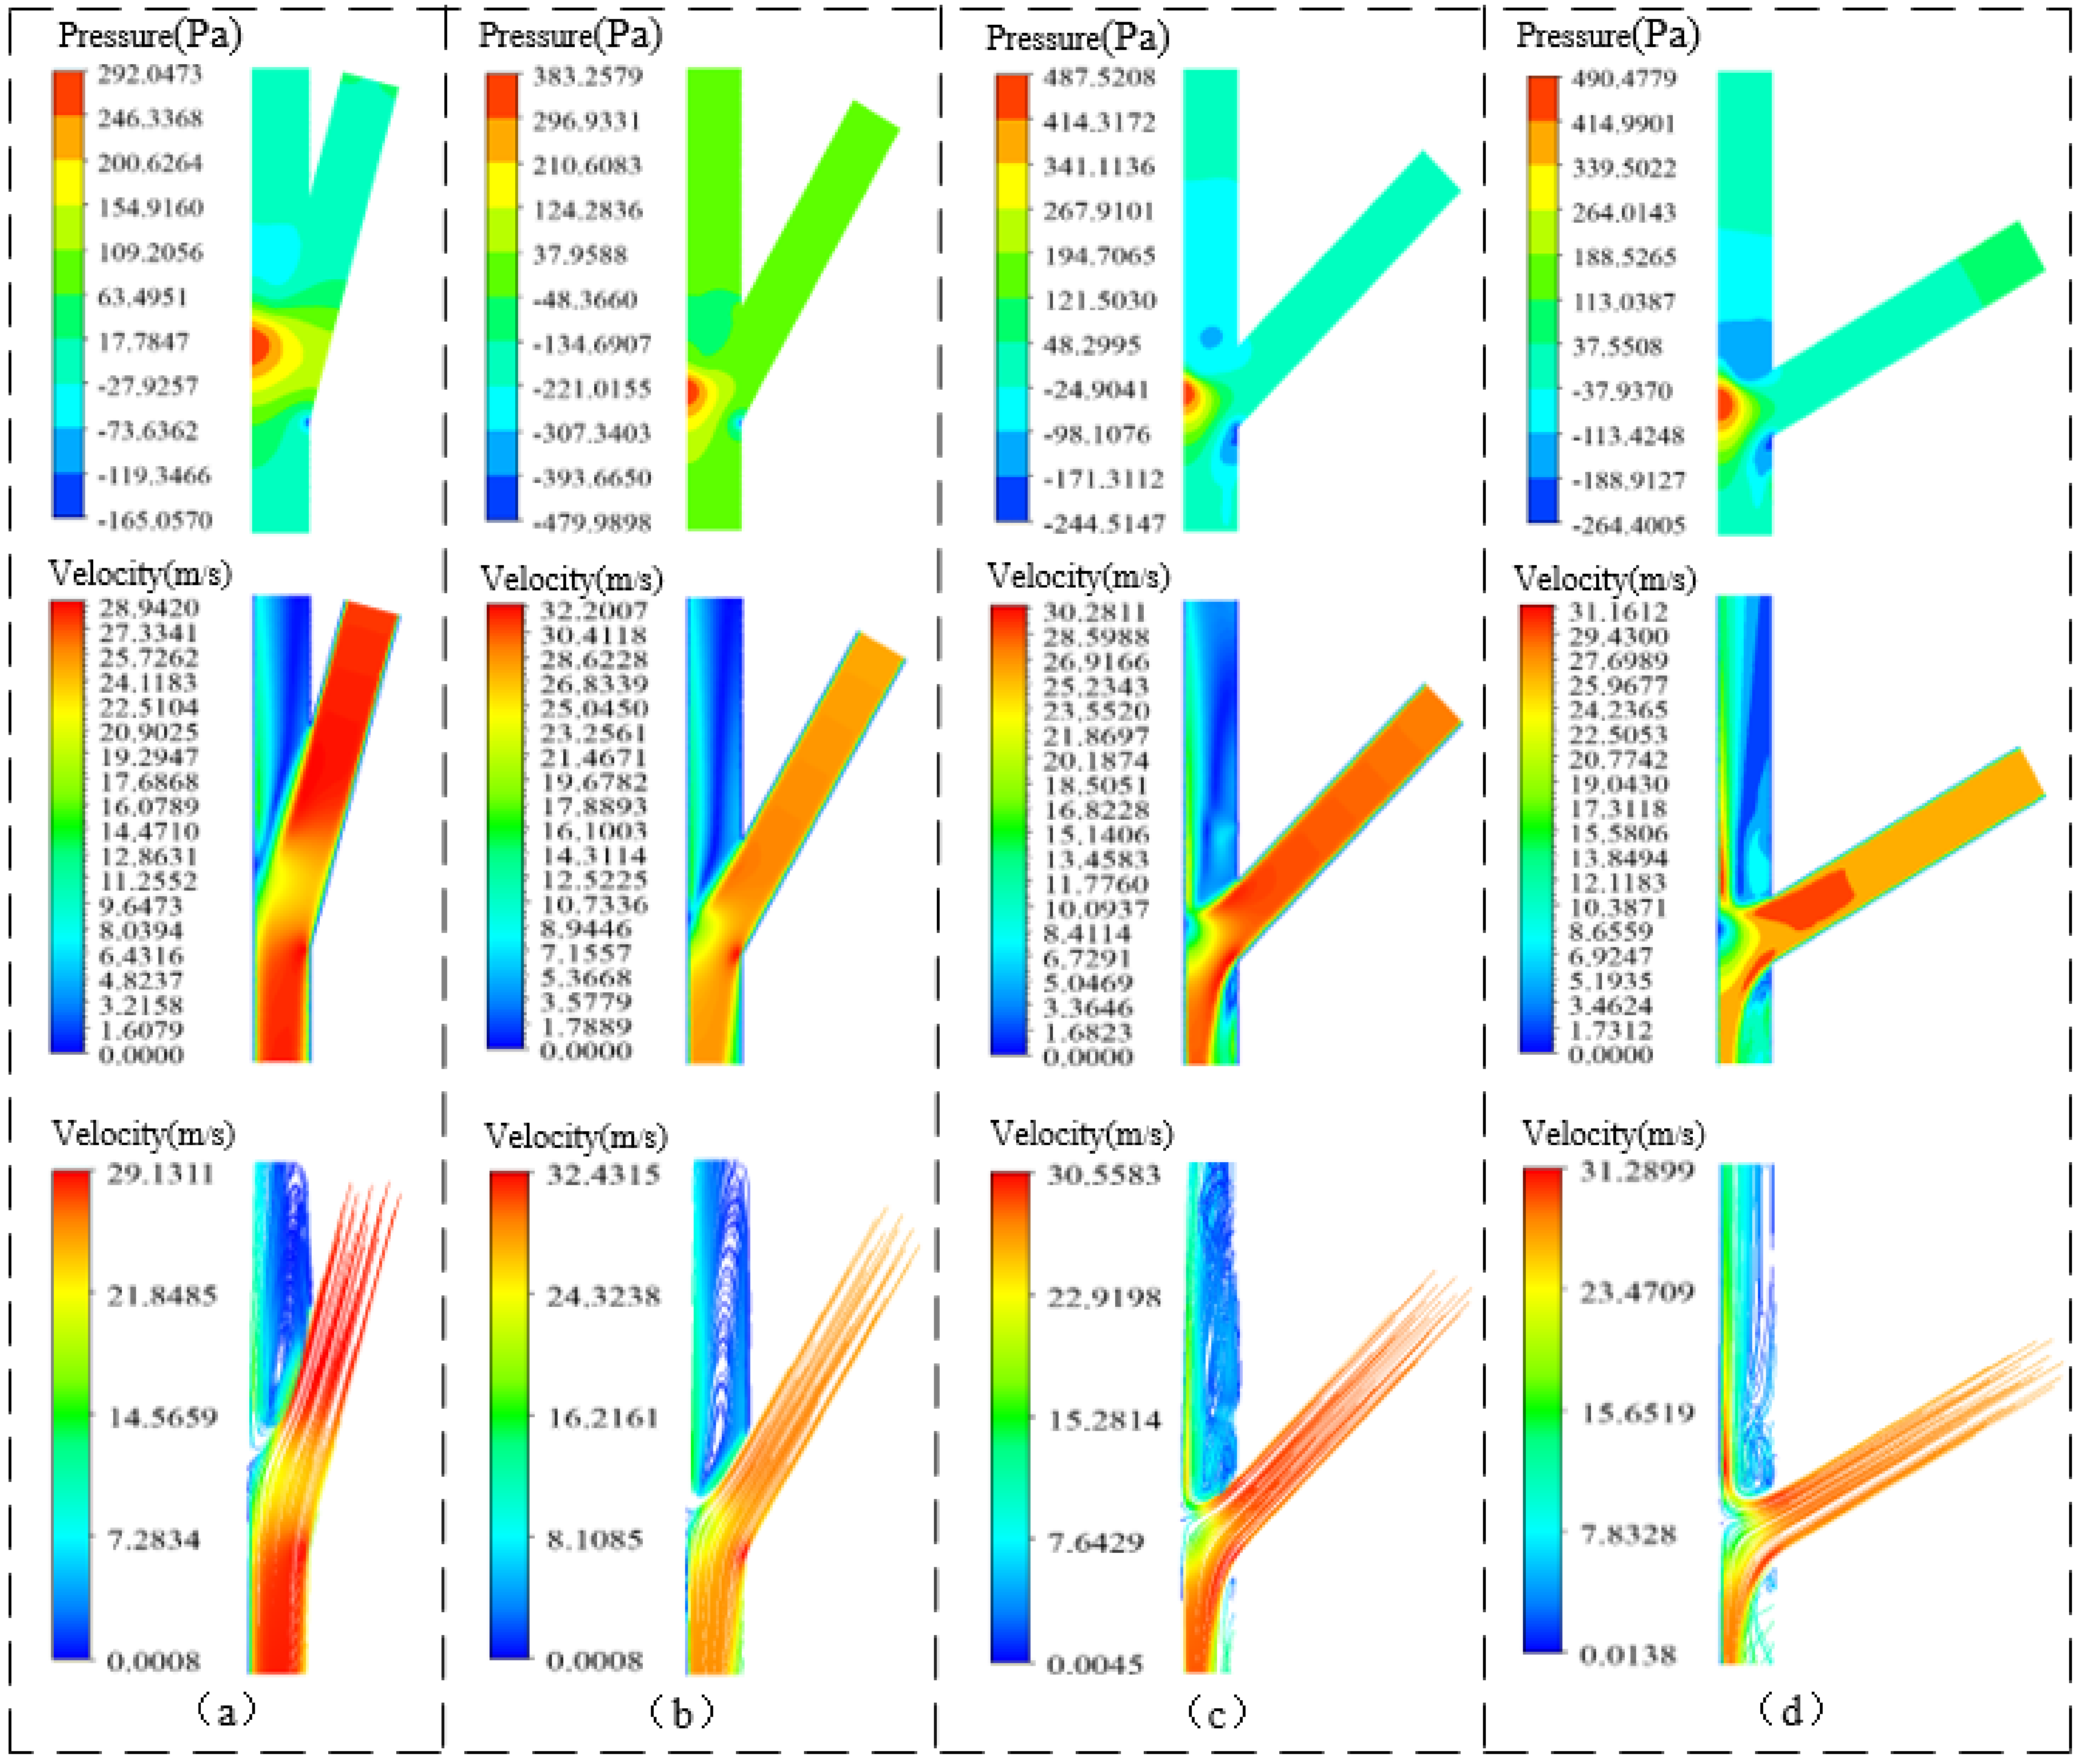
3.6.1. Influence of Seed Delivery Tube Joint Angle on Airflow Field

From the airflow field distribution in Figure 7, it can be seen that the airflow collides with the inner wall of the vertical pipe when it reaches the initial gas-solid mixing region. The local pressure loss in the initial gas-solid mixing region is proportional to the pipe angle; the larger the pipe angle, the greater the local pressure loss between the airflow and the inner wall of the pipe. The sudden pressure change and vortex phenomenon occurred in the vertical ducts of all structural ducts, in which the airflow velocity distribution uniformity in the 15° angle air-solid initial mixing area was the best, and the airflow stagnation area and vortex area in the collision area between the airflow and the duct wall were the smallest. From Table 2, it can be concluded that the overall pressure loss of the seed delivery pipe is the lowest when the angle of the two pipes is 15°, which is the same as the analysis of the relevant airflow field in the previous paper. The airflow velocity at the seed inlet is consistent with the change of the pipe angle; the larger the pipe angle, the larger the airflow velocity at the seed inlet, which is not conducive to the uniform fall of single seeds. With comprehensive airflow distribution uniformity of each angle duct and various airflow parameters, the pipe clamping angle is chosen to be 15°.

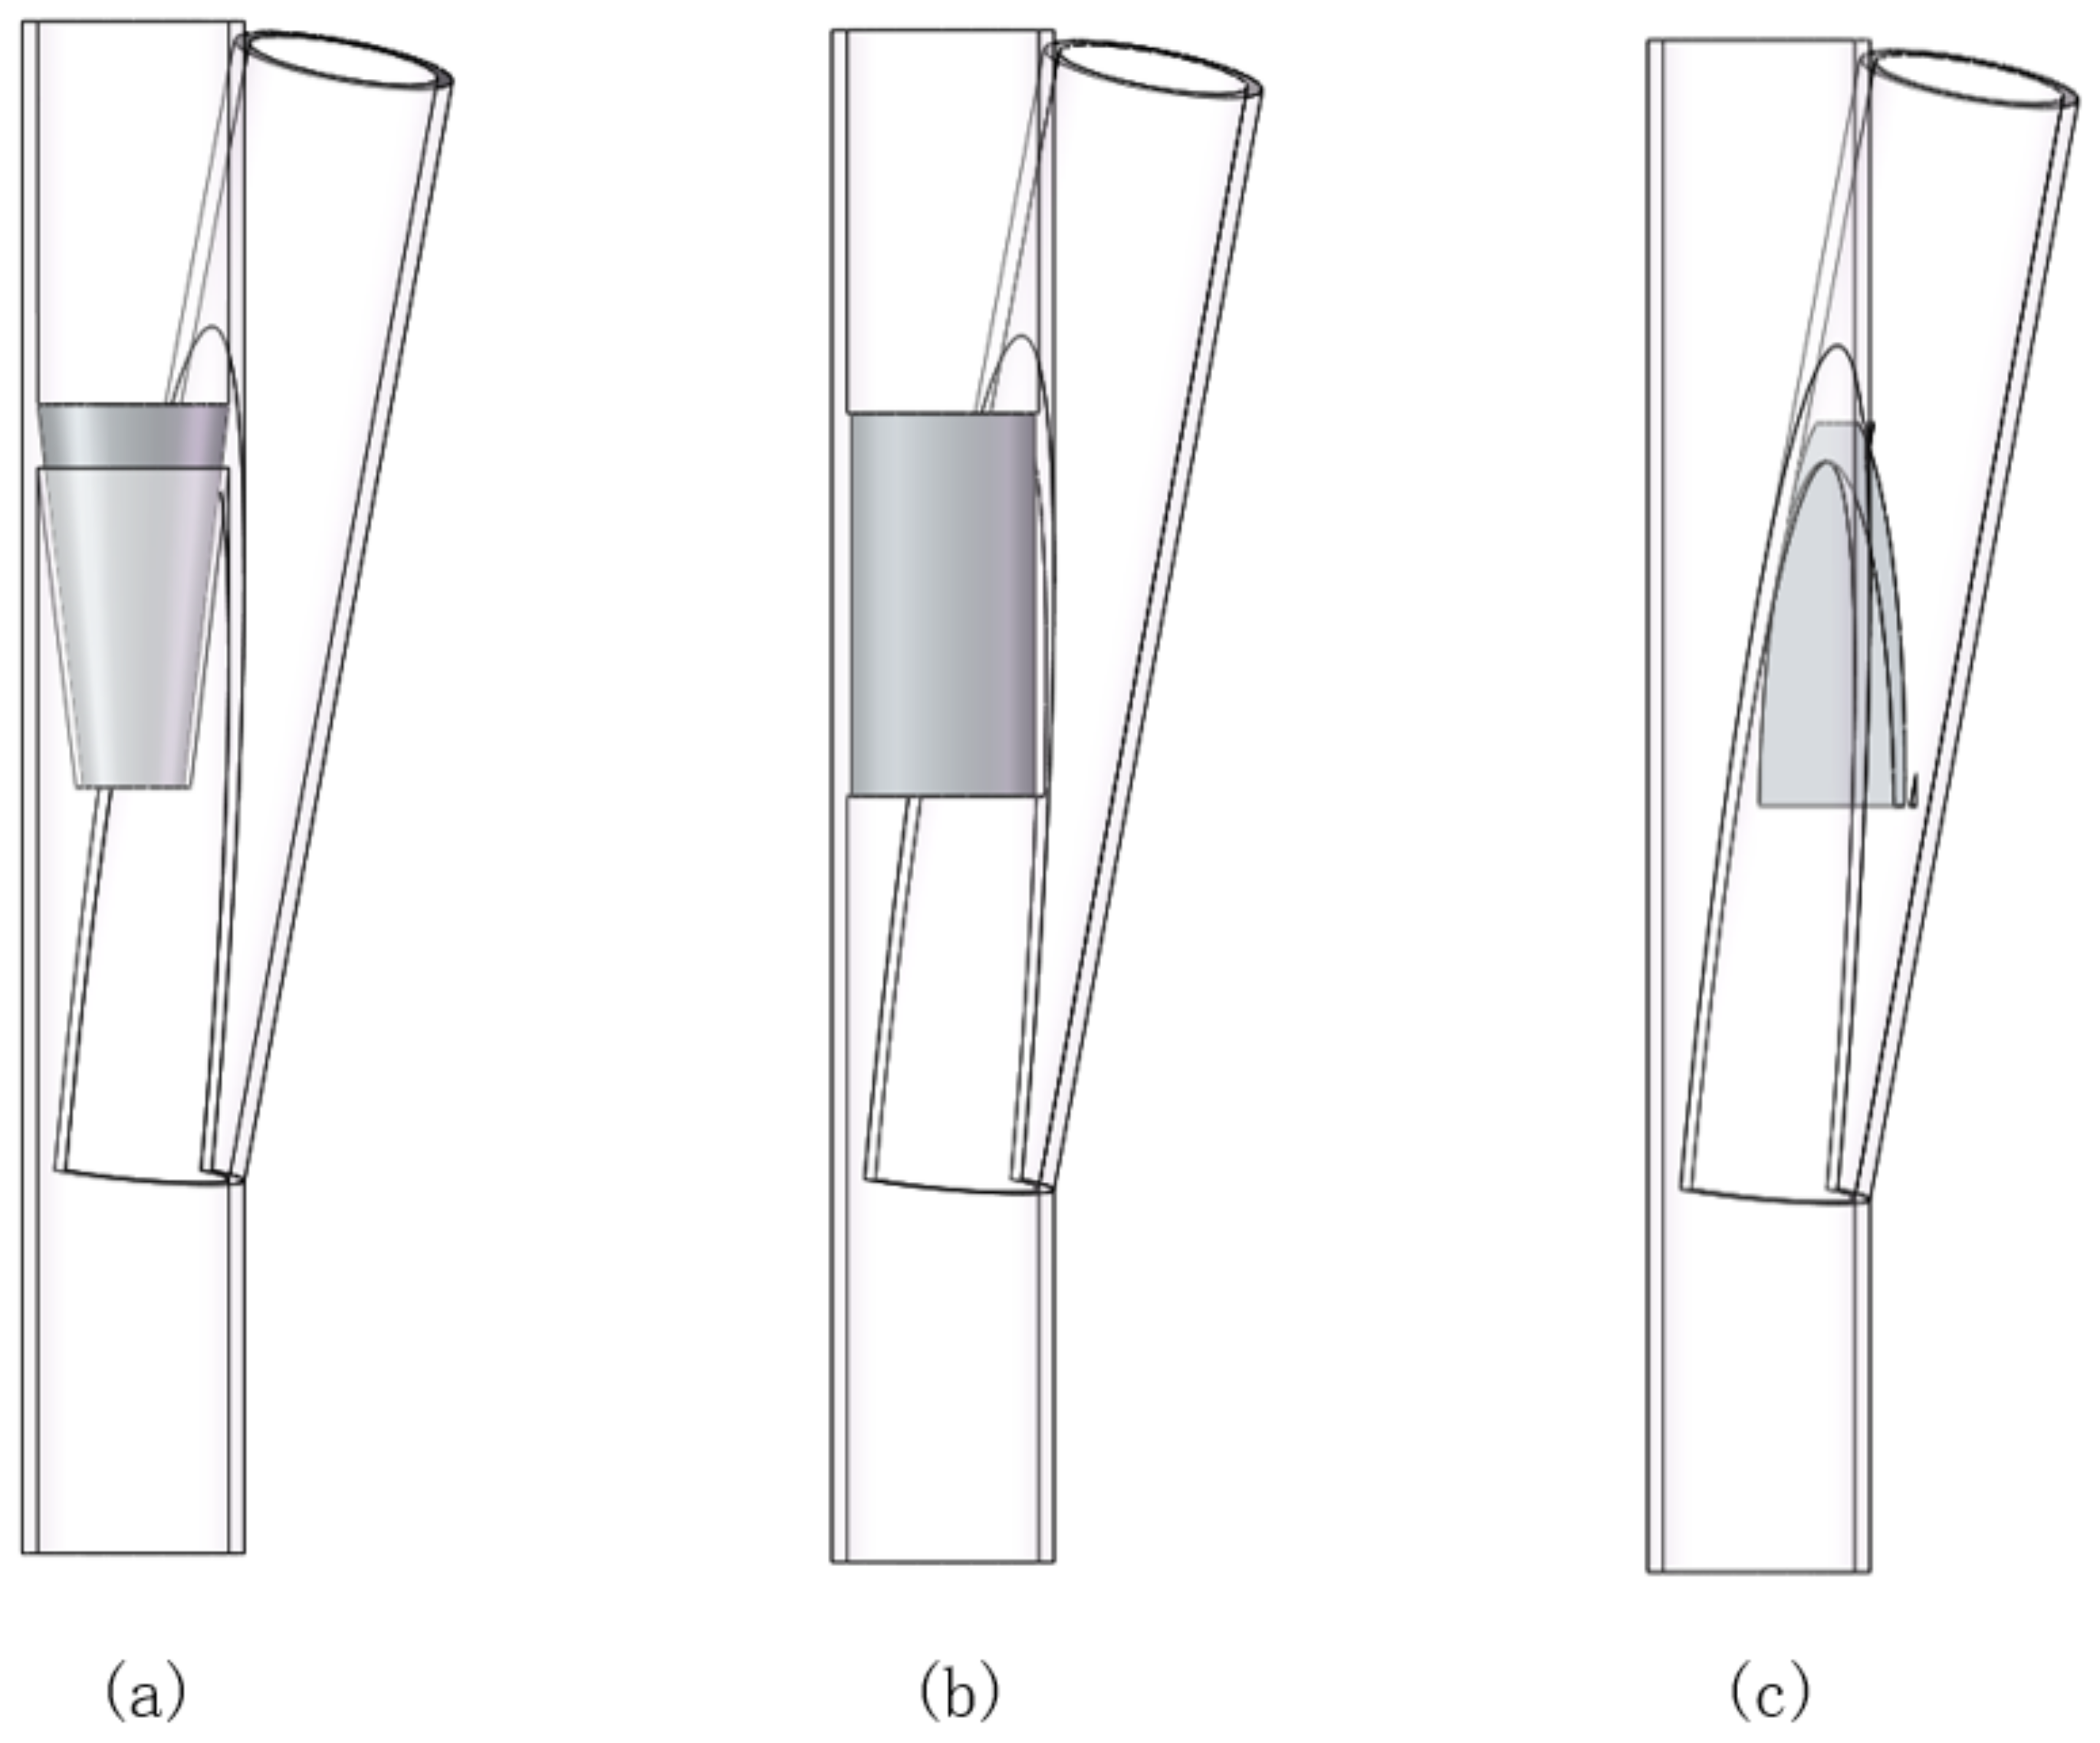
3.6.2. Influence of the Diversion Structure of the Seed Delivery Pipe Joint on the Airflow Field

It can be concluded from Table 3 that the airflow pressure at the seed inlet of the seed guide pipe with an inflow structure is close to the normal atmospheric pressure, which can ensure the uniform and orderly fall of single seed particles and play the role of inflow, and among the three inflow structures, the overall pressure loss and the exit airflow velocity and airflow inlet velocity of the round table inflow seed guide pipe are the lowest. From Figure 8, it can be seen that the airflow pressure distribution in the inlet section of the seed transport duct of the round table diversion struct is uniform. Its along-travel pressure loss and local pressure loss are the lowest, and the airflow velocity in the subsequent transport section is the highest. On the whole, the seed transporting pipeline of the round table diversion structure is conducive to reducing the contact probability between the cotton seeds and the pipe wall in transportation under the condition of reducing the power consumption of the fan and can realize the uniform transport of single seeds.

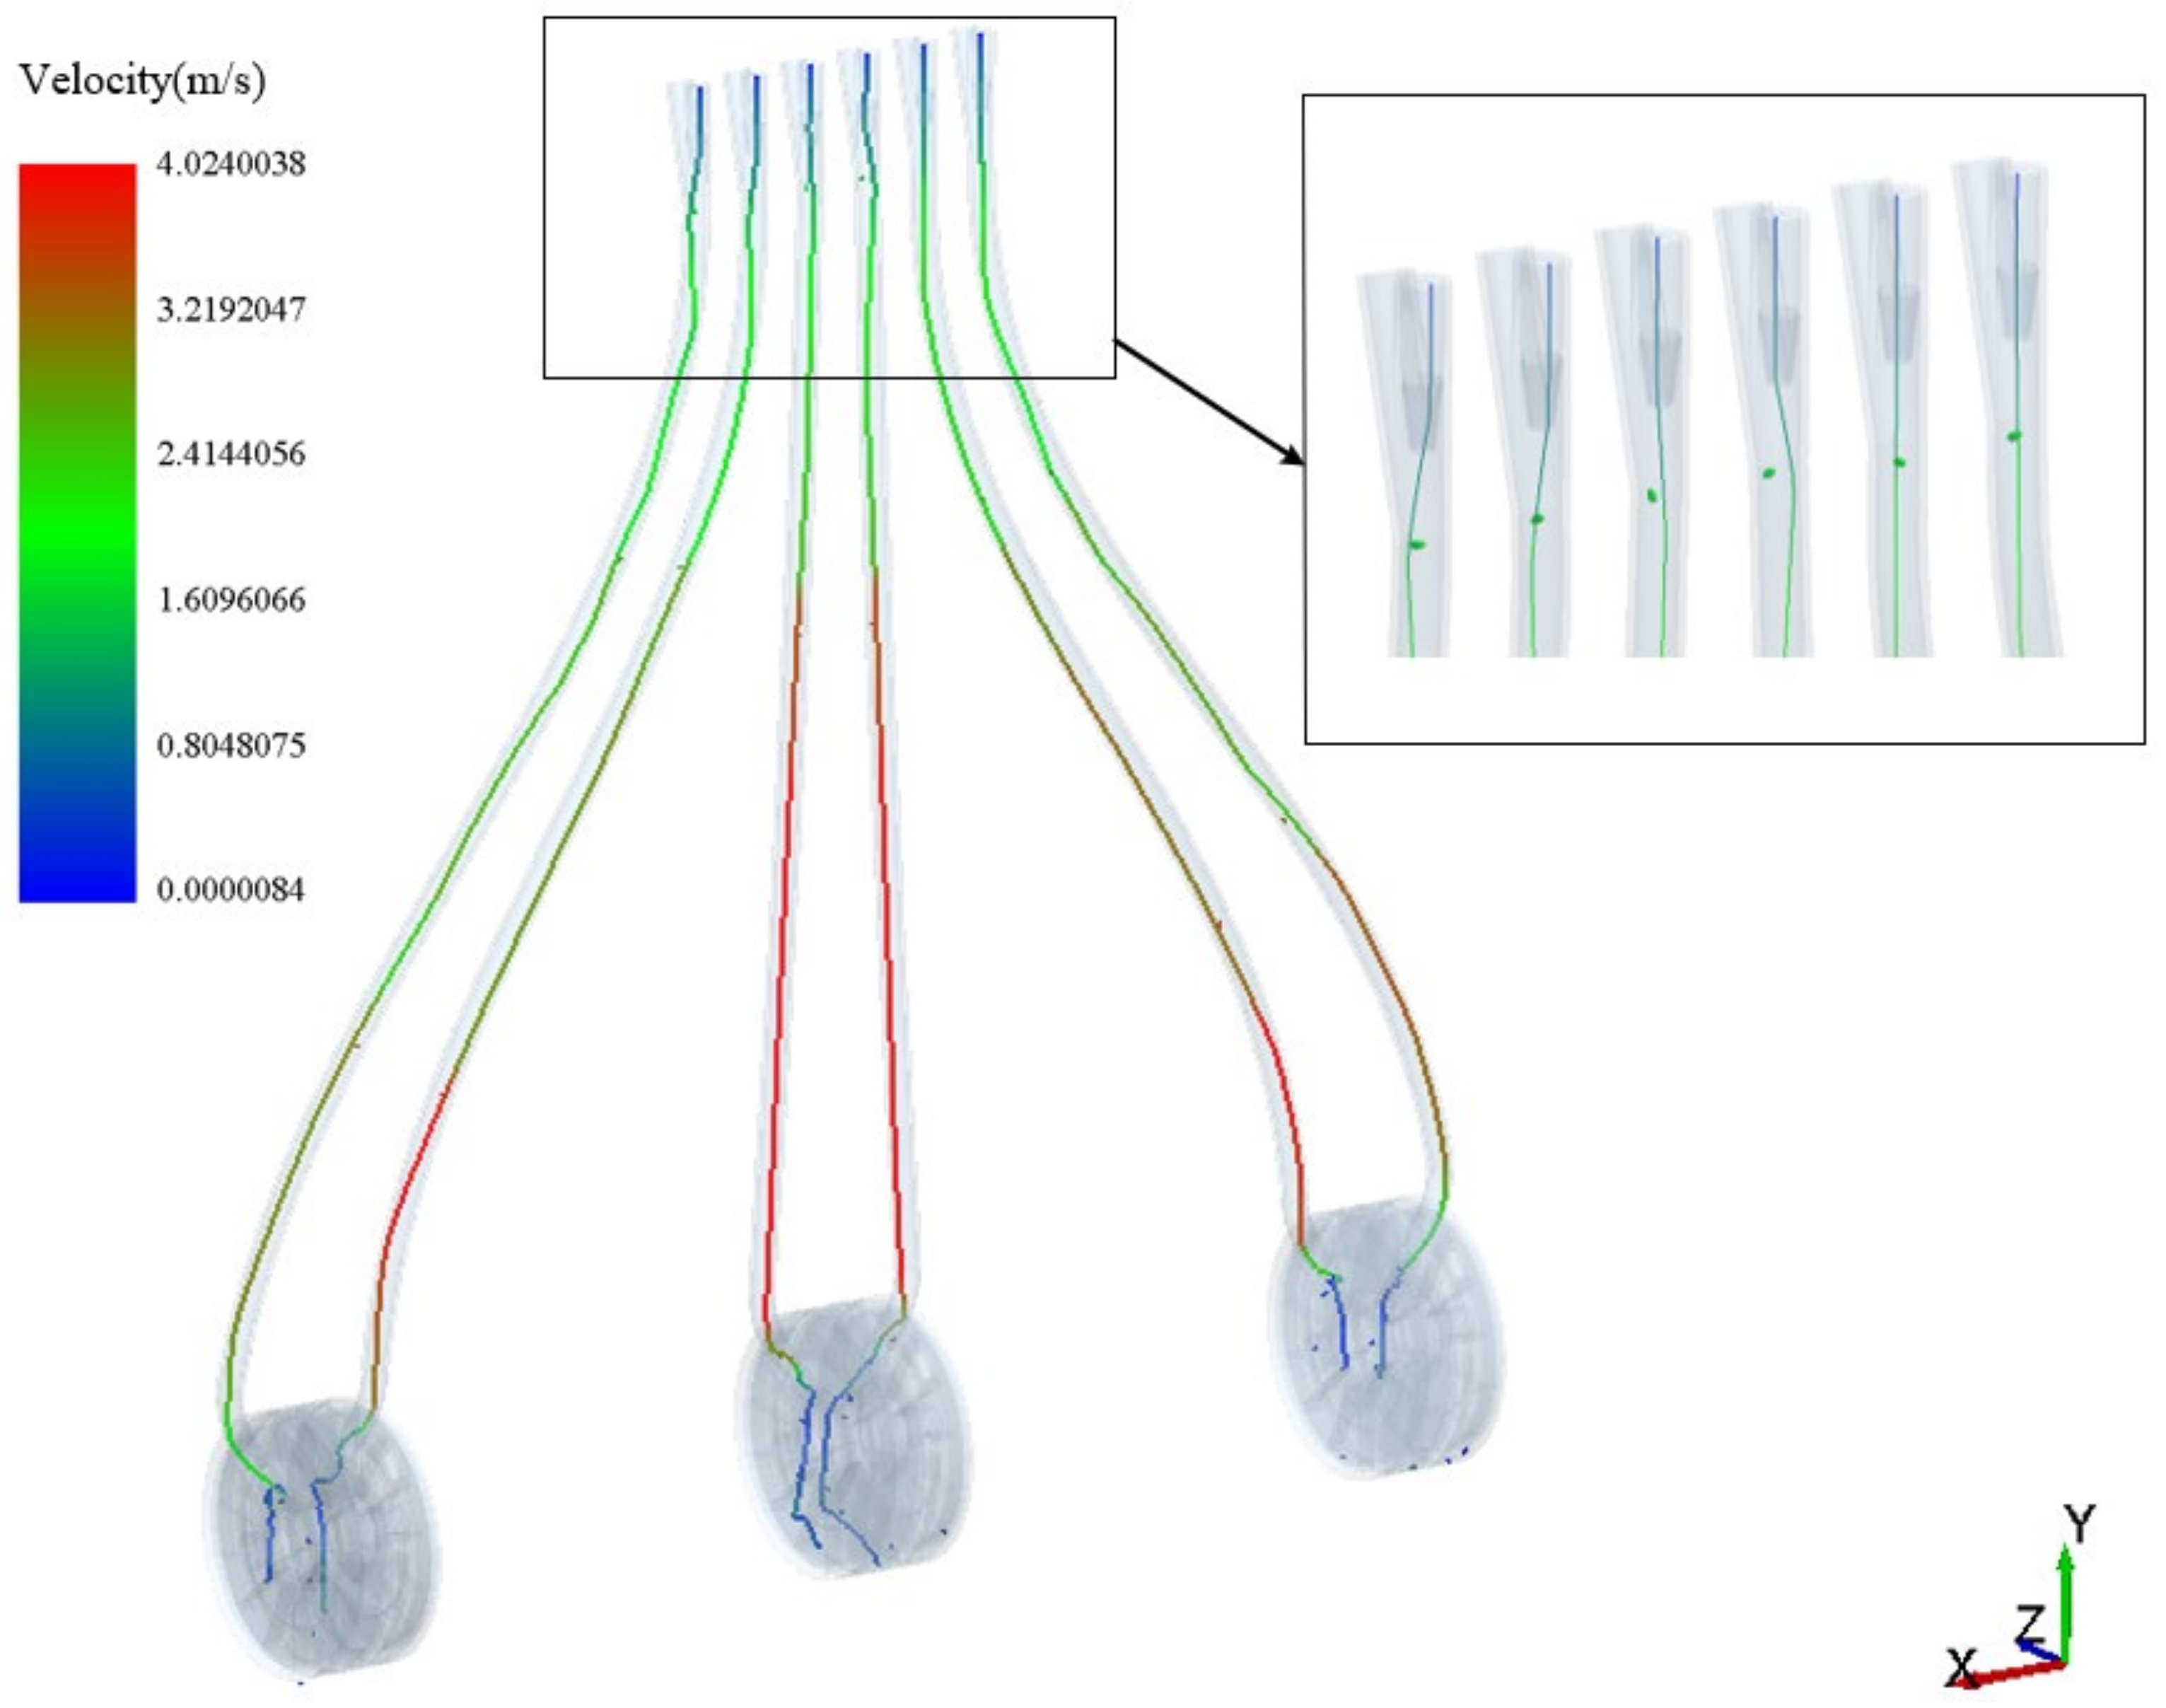
3.6.3. Overall Seeding Analysis

As shown in Figure 9, the trajectory of the seeds in the seed tubes and their hole sowers is illustrated, with the seeds bouncing in the joint area and subsequently moving along the tube wall and changing direction as the tube wall bends. Due to the length of the tubes, the middle two rows of seeds were discharged before the four lateral rows. Figure 10a,b shows that the velocity of seed movement increases from the side pipes to the center pipe, and the seed velocity in each pipe increases steadily and then decreases sharply when it reaches the highest value, which indicates that the seeds enter the cavity sower and are subject to resistance in the opposite direction. Overall, the number of seed velocity fluctuations increased from the center pipe to the side pipes, illustrating that the cotton seed in the side pipes collided with the pipe wall more often than the center pipe. The angular velocity of the cotton seed gradually increased from the center pipe to the side pipe, which showed that the angular velocity increased with the increase of the pipe length.

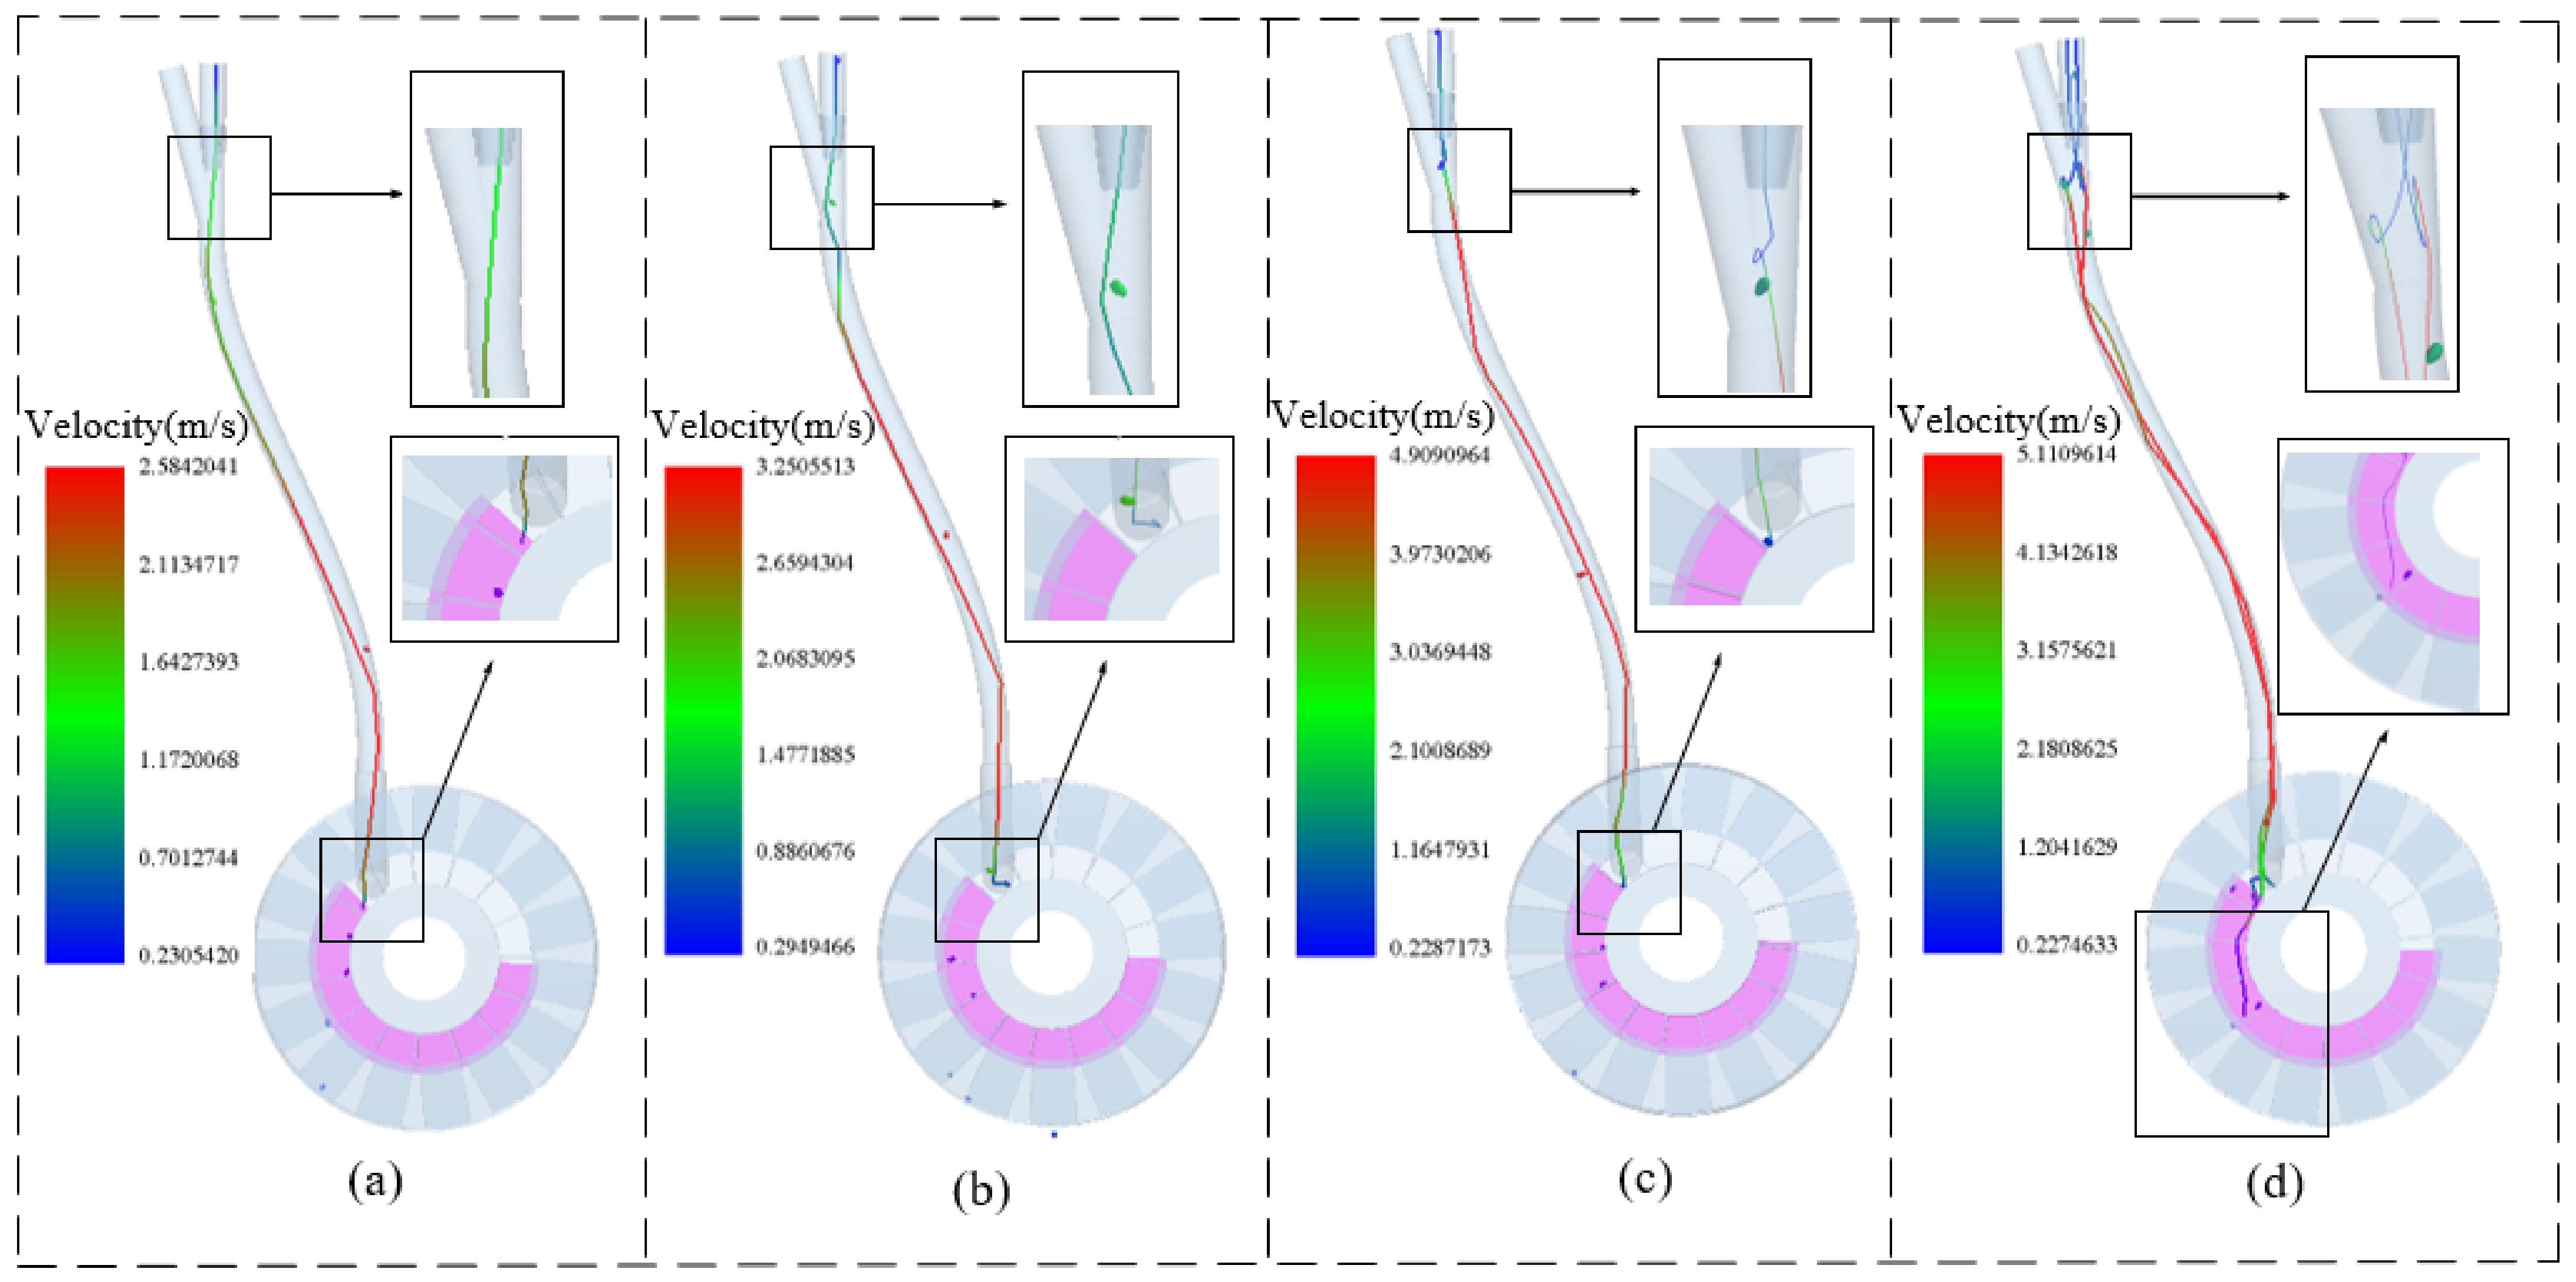
3.6.4. Analysis of Cotton Seed Transport Process under Different Cavity Seeder Speed

It can be concluded from Figure 11 that the velocity of cotton seeds at different speeds of the hole sower is basically the same, and it reaches the peak of acceleration when it is close to the outlet of the seed delivery pipe (the maximum speed peak is around 3 m/s), and after colliding with the pipe wall, the rate decreases sharply and finally falls into the hole sower with a lower velocity; however, as the speed of the cavity seeder increases, the time interval between single seeds entering the cavity seeder becomes shorter and less uniform, increasing the number of replanting of cotton seeds at the same time.
Figure 12 shows the trajectory of cotton seed transport at the corresponding speed of Figure 11. Figure 12a is the ideal trajectory line of cotton seeds, which are distributed singly in each compartment of the cavity seeder; Figure 12b is for cotton seeds that have been spaced too long from the previous grain resulting in resowing with the latter grain; Figure 12c indicates that the cotton seed particles bounce when they collide with the seed stopper when entering the cavity seeder and then enter the seeding compartment together with the subsequent cotton seeds, thus resowing occurs; Figure 12d shows that the seed particles collide with the retaining ring when the cavity seeder is rotating too fast, resulting in the seed particles skipping the seed outlet and continuing to rotate with the seed divider into the next sowing cycle, thus leading to reseeding.

3.6.5. Analysis of Cotton Seed Transport Process under Different Seed Delivery Positive Pressure

Analysis of the data in Figure 13 shows that when the positive pressure of seed delivery is low, the movement speed trend of each cotton seed is approximately the same as the time interval. There is no reseeding or omission at the same time; with the increase of applied air pressure, the peak velocity of each cotton species also gradually increased from 3 m/s to 7 m/s, and the trend of velocity fluctuation increased. The uniformity of the time interval between two cotton seeds gradually decreased; the probability of omission and resowing increased, and there were more than two resowing in the same unit of time.
Figure 14 shows the cotton seed transport trajectory under positive pressure corresponding to Figure 13a showing that when the positive pressure of seed delivery is 50 Pa, the trajectory of cotton seed movement is consistent with the seed delivery pipe, and the time interval between seeds is the same; Figure 13b shows that the different drop positions of the cotton seeds lead to a collision with the inlet pipe wall when passing the end of the seed delivery pipe connector, resulting in a lag when the seeds enter the hole sower and enter the same seeding compartment of the hole sower together with the subsequent seeds; Figure 13c,d shows that the vortex phenomenon occurs when the cotton seeds reach the initial air-solid mixing area, and the vortex area tends to intensify as the seed delivery pressure increases, which eventually leads to frequent reseeding of two or more seeds.

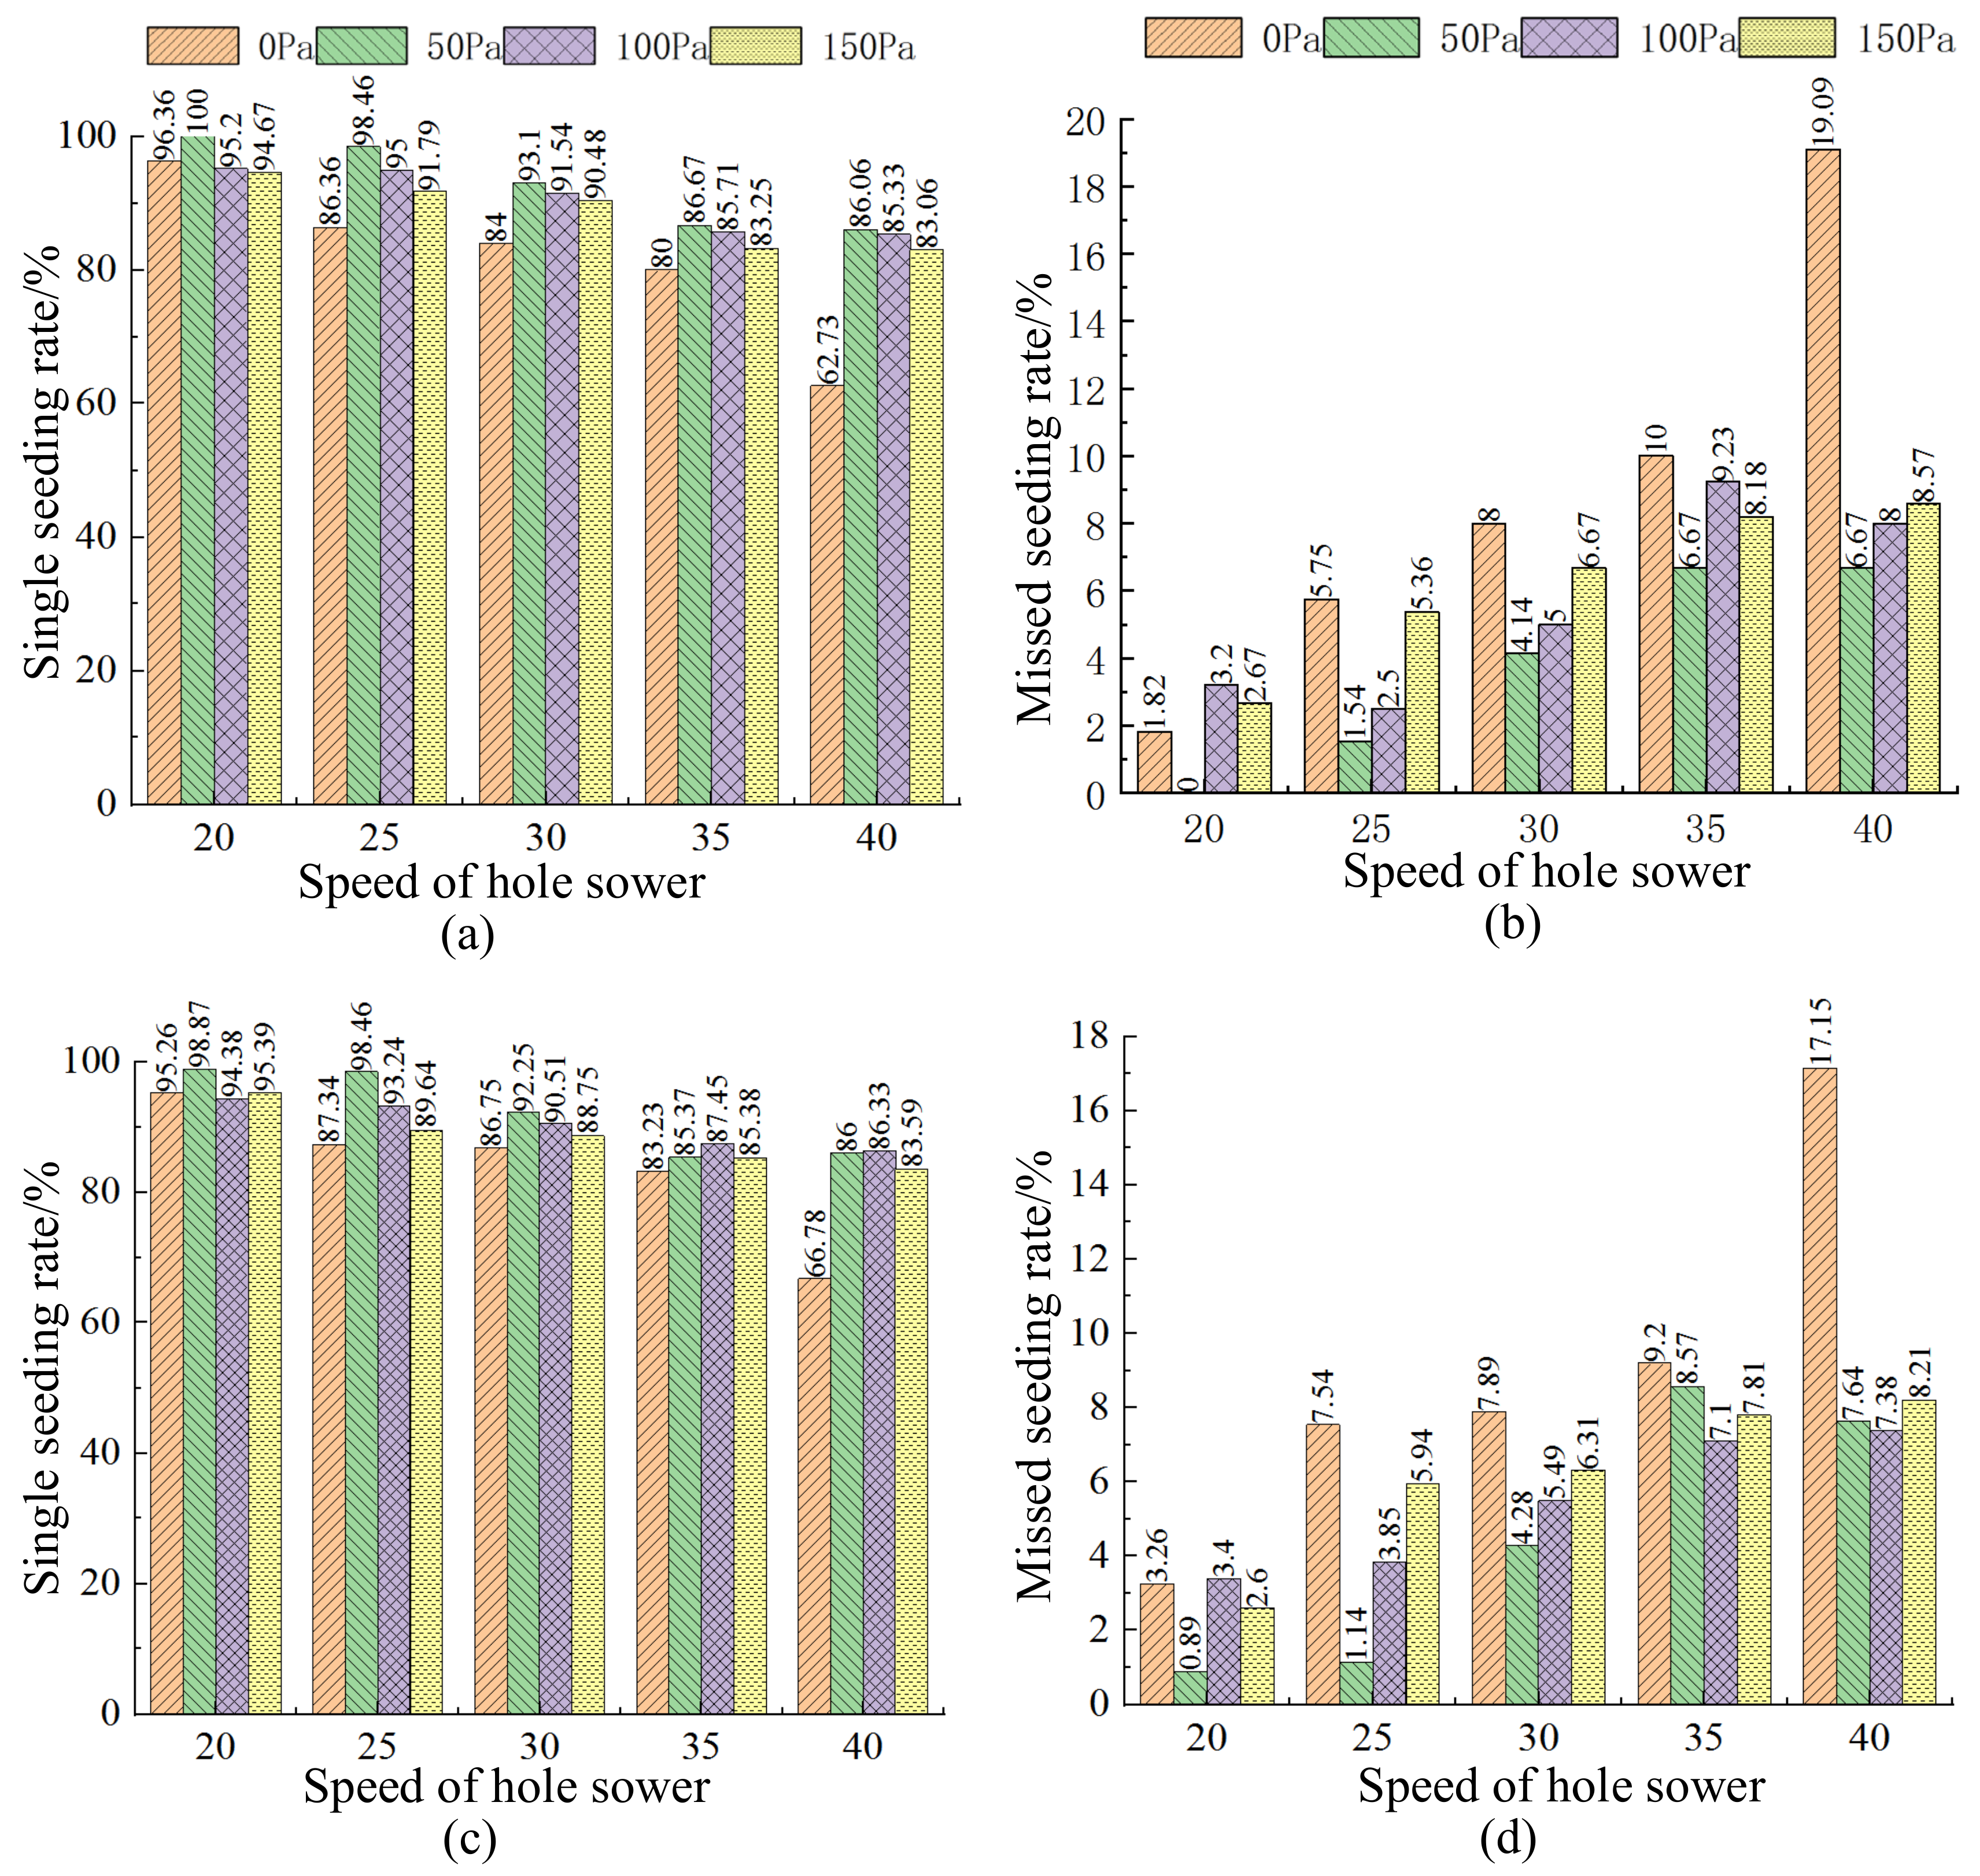
3.6.6. Influence of Working Parameters on Seeding Effect

From Figure 15, it can be seen that the single seeding rate and the missed seeding rate of the third-row and the fourth-row pipes are basically the same and have the same trend. Except for the case where the rotation speed of the cavity seeder is 20 rev/min, the qualification rate of the seed delivery tube with positive pressure is significantly higher than that without positive pressure. The single seeding rate was inversely proportional to the speed of the cavity seeder, with a decreasing trend at all positive pressure levels as the speed of the cavity seeder increased. Figure 15b,d shows that the seed delivery tube is fed with positive pressure to significantly reduce the seeding leakage rate. The cavity seeder rotational speed had a significant effect on the seed leakage rate. The multiple seeding rate and the missed seeding rate were proportional to the cavity seeder rotational speed at the same level of positive pressure. On the whole, when the rotation speed of the cavity seeder does not exceed 40 rev/min and the seed delivery pipe is fed with 50 Pa~150 Pa positive pressure airflow, the single seeding rate is not less than 83.06%, and the missed seeding rate is not more than 9.23%, close to the precision agriculture sowing requirements; the seeder needs to be researched and improved at a later stage.

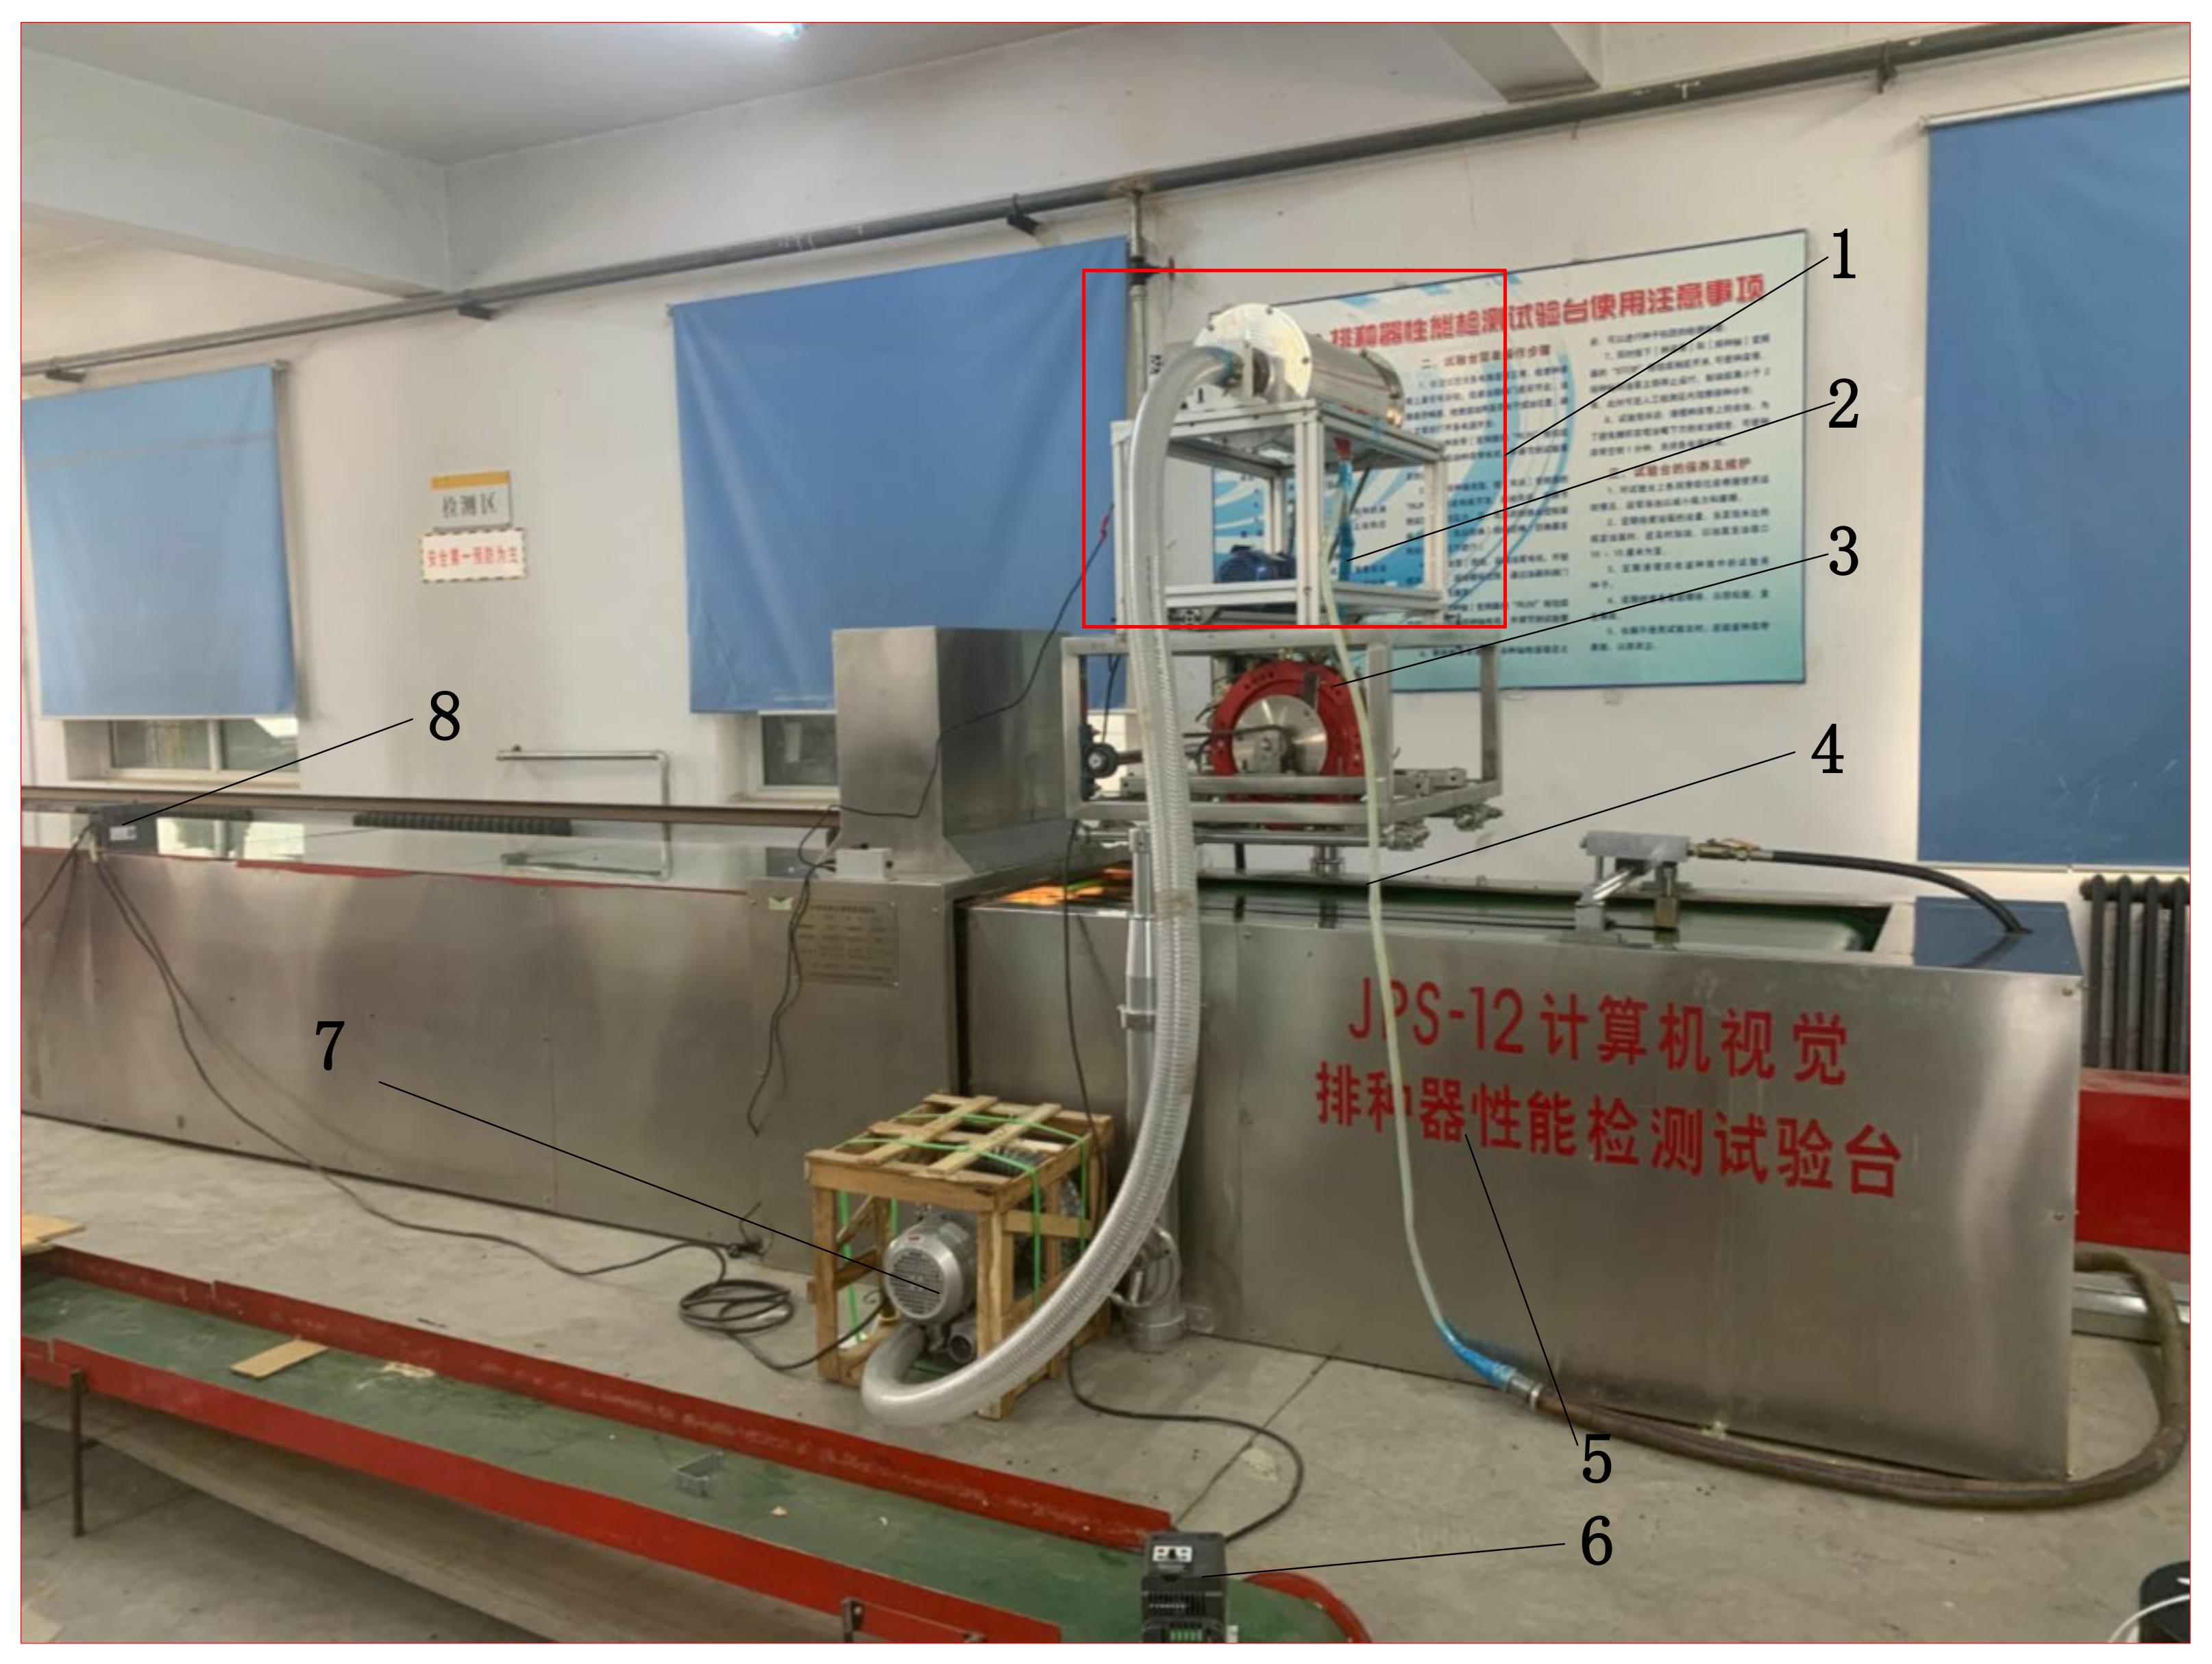
4. Bench Test Verification

4.1. Experimental Design and Methodology

To verify the seed discharge performance of the air-split type cotton precision seed discharger, seed discharge performance tests were conducted in the critical experimental room of the agricultural machinery of Xinjiang Corps. The leading types of equipment are the JPS-12 seed rower performance testing test bench, homemade seed rower, high-speed camera, vortex fan, two-phase inverter, three-phase inverter, reducer motor, ABS plastic seed delivery tube, negative pressure detector, and other equipment; the test bench is shown in Figure 16.
Using row 3 as the test subject, the cotton seeds used in the experiment were Xin luzao 48, which is widely grown in Xinjiang; the negative pressure of the roller is set to 2000 Pa; the positive pressure of the seed delivery tube is set to 0~150 Pa, and every 50 Pa is set as a level; the speed of the cavity seeder was set at 30rev/min, and the level was set at 10 rev/min intervals, and each group of tests was repeated five times to take the average value. According to GB/T6973-2005 “Single grain (precision) seeder test method”, the seed row performance test was carried out with the evaluation indexes of qualified rate, missed seeding rate, and reseeding rate, and the test results are shown in Table 4.

4.2. Test Results and Analysis

To highlight the comparison of the seeding performance between the simulated test and the bench test, the single seeding rate, missed seeding rate, and multiple seeding rate data of the simulated and bench tests are compared, as shown in Figure 17.
Analysis of Figure 16 shows that the seeding performance trends of the bench test and the simulation test tend to be consistent, and the single seeding rate of the seed delivery tube with positive pressure is higher than that of the seed delivery tube without positive pressure, and when the positive pressure of 50~150 Pa was passed, the seed discharge performance did not differ much, but the seeding effect had a tendency to become worse, which was the same as the previous simulation analysis. The missed seeding rate of the bench test was higher than that of the simulation test because the default set-row roller absorbed 100% of the single seeds in the simulation test; in the actual bench simulation, some individual seeds failed to overcome the frictional resistance between seeds and were not successfully adsorbed, resulting in leakage when the cotton seeds entered the seed delivery pipe. There is also a slight difference between the reseeding rate of the bench test and that of the simulation test, which is mainly due to the irregular shape of the seeds and the possibility of the set-row roller to adsorb two smaller seeds, causing two seeds to enter the seed delivery pipe at the same time, resulting in more reseeding. In addition, there is a small difference in the overall data due to the difference between the seed delivery piping arrangement in the bench test and the seed delivery piping arrangement in the simulation; however, in general, the results of the bench test are closer to the results of the simplified simulation test, and it is scientific and reliable to adopt the simulation test method to analyze the performance of the seed releaser.

5. Conclusions

(1) In order to improve the working performance of the pneumatic split type cotton seed rower, from the whole machine structure and working principle, through the pipe fluid pressure loss and cotton seed particle force analysis, the influence factors affecting the sowing effect were derived.
(2) The structural design of the seed delivery pipe joints, the fluent virtual simulation model, was established to analyze the flow field distribution inside the different forms of pipe joints, and the final test results showed that the overall flow field distribution of the seed delivery pipe joints with the angle of 15° and the internal flow guide structure of circular table shape was uniform and the pressure loss was the lowest. An EDEM simulation was performed with the integral seed delivery pipe and its connected cavity seeder under no positive pressure; the simulation tests showed that the cotton seed particles in the center two rows of seed delivery tubes had the same transport pattern, and the number of velocity fluctuations of cotton seed particles in the side four rows of seed delivery tubes was significantly more than that in the center row of seed delivery tubes.
(3) To save simulation time, the seed delivery tube of the central row was selected for the CFD-DEM coupling simulation test, and the transport of cotton seed particles under each single-factor condition was studied with positive pressure and cavity seeder as the test factors to further analyze the causes of its occurrence of missed seeding and reseeding. The coupled simulation test of sowing performance was carried out by using the single seeding rate and missed sowing rate as the test index, and the results showed that the single seeding rate was not less than 83.06%, the multiple seeding rate was not more than 8.57%, and the missed sowing index was not more than 9.23% when the cavity seeder speed did not exceed 40 rev/min and the seed delivery pipe was fed with 50 Pa~150 Pa positive pressure airflow, close to precision agriculture seeding requirements.
(4) The data between the bench test and the simulation test are slightly different, but the data results tend to be consistent, and in general, it is feasible to use the simulation test to study the seeding performance.

Author Contributions

Conceptualization, K.L. and S.L.; methodology, X.N.; software, K.L.; validation, K.L., S.L. and B.L.; formal analysis, B.L.; investigation, X.N.; resources, S.L.; data curation, B.Z.; writing—original draft preparation, K.L.; writing—review and editing, K.L.; visualization, X.N. and W.C; supervision, S.L.; project administration, S.L.; funding acquisition, X.N. All authors have read and agreed to the published version of the manuscript.

Funding

This research was supported by grants from the National Natural Science Foundation of China (Grant No. 52065056).

Institutional Review Board Statement

Not applicable.

Data Availability Statement

All relevant data presented in the article are kept at the request of the institution and are therefore not available online. However, all data used in this manuscript are available from the corresponding authors.

Conflicts of Interest

The authors declare no conflict of interest.

References

  1. Han, D.; Zhang, D.; Jing, H.; Yang, L.; Cui, T.; Ding, Y.; Wang, Z.; Wang, Y.; Zhang, T. DEM-CFD coupling simulation and optimization of an inside-filling air-blowing maize precision seed-metering device. Comput. Electron. Agric. 2018, 150, 426–438. [Google Scholar] [CrossRef]
  2. Mandal, S.; Kumar, G.P.; Tanna, H.; Kumar, A. Design and evaluation of a pneumatic metering mechanism for power tiller operated precision planter. Curr. Sci. A Fortn. J. Res. 2018, 115, 1106–1114. [Google Scholar] [CrossRef]
  3. Xue, P.; Xia, X.; Gao, P.; Ren, D.; Hao, Y.; Zheng, Z.; Zhang, J.; Zhu, R.; Hu, B.; Huang, Y. Double-Setting Seed-Metering Device for Precision Planting of Soybean at High Speeds. Trans. ASABE 2019, 62, 187–196. [Google Scholar] [CrossRef]
  4. Lu, B.; Ni, X.; Li, S.; Li, K.; Qi, Q. Simulation and Experimental Study of a Split High-Speed Precision Seeding System. Agriculture 2022, 12, 1037. [Google Scholar] [CrossRef]
  5. Liao, Y.; You, Y.; Hui, Y.; Zhang, X.; Wang, D. Mixed Seeds of Oat and Vetch Based on DEM-Fluent Coupling Motion Simulation in a Venturi Tube. Processes 2023, 11, 1095. [Google Scholar] [CrossRef]
  6. Kocher, M.F.; Coleman, J.M.; Smith, J.A.; Kachman, S.D. Corn seed spacing uniformity as affected by seed tube condition. Appl. Eng. Agric. 2011, 27, 177–183. [Google Scholar] [CrossRef]
  7. Wang, B.; Liao, Q.; Wang, L.; Shu, C.; Cao, M.; Du, W. Design and Test of Air-Assisted Seed-Guiding Device of Precision Hill-Seeding Centralized Seed-Metering Device for Sesame. Agriculture 2023, 13, 393. [Google Scholar] [CrossRef]
  8. Yatskul, A.; Lemiere, J.P. Establishing the conveying parameters required for the air-seeders. Biosyst. Eng. 2018, 166, 1–12. [Google Scholar] [CrossRef]
  9. Qin, J. Development of One-Step Centralized Type Pneumatic Seeding System. Master’s Thesis, Shandong Agricultural University, Tai’an, China, 2005. [Google Scholar]
  10. Sun, Q. Study and Test Analysis of One-Stepseed-Centralized Pneumatic Drill. Master’s Thesis, Shandong Agricultural University, Tai’an, China, 2003. [Google Scholar]
  11. He, Y. Study on the structure and airflow parameters of airflow seed delivery tube. J. Xihua Univ. Nat. Sci. 1982, 13, 24–31+61. [Google Scholar]
  12. Li, Y.; Liu, R.; Liu, C.; Liu, L. Simulation and Test of Seed Velocity Coupling in Seed Tube of Pneumutic Seed Metering Device. Trans. Chin. Soc. Agric. Mach. 2021, 52, 54–61+133. [Google Scholar]
  13. Li, Y.; Liu, Y.; Liu, L. Distribution Mechanism of Airflow in Seed Tube of Different Lengths in Pneumatic Seeder. Trans. Chin. Soc. Agric. Mach. 2020, 51, 55–64. [Google Scholar]
  14. Endrerud, H.C. Influence of Tube Configuration on Seed Delivery to a Coulter. J. Agric. Eng. Res. 1999, 74, 177–184. [Google Scholar] [CrossRef]
  15. Qi, Q.; Ni, X.; Kang, S.; Lu, B.; Hu, B. Test on cotton seed pneumatic delivery performance of centralized seed-metering device. J. Gansu Agric. Univ. 2021, 56, 187–192+200. [Google Scholar] [CrossRef]
  16. Cheng, L.; Mou, X.; Pen, Z. Application of discrete element method in agricultural engineering. Agric. Eng. 2021, 11, 29–34. [Google Scholar]
  17. Din, l.; Yang, L.; Wu, D.; Li, D.; Zhang, D.; Liu, S. Simulation and Experiment of Corn Air Suction Seed Metering Device Based on DEM-CFD Coupling Method. Trans. Chin. Soc. Agric. Mach. 2018, 49, 48–57. [Google Scholar]
  18. Zhang, X. Research on computer simulation technology and its application in agricultural engineering. China Rice 2021, 27, 150. [Google Scholar]
  19. Zhen, Z.; Ma, X.; Cao, X.; Li, Z.; Wang, X. Critical review of applications of discrete element method in agricultural engineering. Trans. Chin. Soc. Agric. Mach. 2021, 52, 1–20. [Google Scholar]
  20. Zhao, X.; Xu, L.; Wang, Y.; Li, C. Directional Adsorption Characteristics of Corn Seed Based on Fluent and High-speed Photography. Trans. Chin. Soc. Agric. Mach. 2014, 45, 103–109+128. [Google Scholar]
  21. Lei, X.; Hu, H.; Wu, W.; Liu, H.; Liu, L.; Yang, W.; Zhou, Z.; Ren, W. Seed motion characteristics and seeding performance of a centralised seed metering system for rapeseed investigated by DEM simulation and bench testing. Biosyst. Eng. 2021, 203, 22–33. [Google Scholar] [CrossRef]
  22. Han, D.; Zhang, D.; Yang, L.; Li, K.; Zhang, T.; Wang, Y.; Cui, T. EDEM-CFD simulation and experiment of working performance of inside-filling air-blowing seed metering device in maize. Trans. Chin. Soc. Agric. Eng. 2017, 33, 23–31. [Google Scholar]
  23. Lei, X.; Liao, Y.; Zhang, W.; Li, S.; Wang, D.; Liao, Q. Simulation and Experiment of Gas-Solid Flow in Seed Conveying Tube for Rapeseed and Wheat. Trans. Chin. Soc. Agric. Mach. 2017, 33, 67–75. [Google Scholar]
  24. Gao, X.; Xu, Y.; Yang, L.; Zhang, D.; Li, Y.; Cui, T. Simulation and Experiment of Uniformity of Venturi Feeding Tube Based on DEM-CFD Coupling. Trans. Chin. Soc. Agric. Mach. 2018, 49, 92–100. [Google Scholar]
  25. Lei, X.; Liao, Y.; Li, Z.; Cao, X.; Li, S.; Wei, Y.; Liao, Q. Design and experiment of seed feeding device in air-assisted centralized metering device for rapeseed and wheat. Trans. Chin. Soc. Agric. Eng. 2015, 31, 10–18. [Google Scholar]
  26. Wang, L.; Liao, Y.; Wan, X.; Wang, B.; Hu, Q.; Liao, Q. Design and Test on Mixing Component of Air-assisted Centralized Metering Device for Rapeseed and Wheat. Trans. Chin. Soc. Agric. Mach. 2022, 53, 68–79+97. [Google Scholar]
  27. Li, Y.; ZHAO, J.; ZHAO, J.; LIU, L.; LIU, R. Biomimetic Design and Experiment of Distributor of Pneumatic Seeding System Based on Crucian Curve. Trans. Chin. Soc. Agric. Mach. 2022, 53, 80–87. [Google Scholar]
  28. Wang, L.; Liao, Y.; Wan, X.; Xiao, W.; Wang, B.; Liao, Q. Design and Test on Distributor Device of Air-assisted Centralized Metering Device for Rapeseed and Wheat. Trans. Chin. Soc. Agric. Mach. 2021, 52, 43–53. [Google Scholar]
  29. Zou, Y.; Hao, X.; He, R. Numerical simulation and experiment of air distribution seed-metering device based on coupled EDEM-Fluent. J. South China Agric. Univ. 2017, 38, 110–116. [Google Scholar]
  30. Kumar, N.; Upadhyay, G.; Choudhary, S.; Patel, B.; Naresh; Chhokar, R.S.; Gill, S.C. Resource Conserving Mechanization Technologies for Dryland Agriculture. In Enhancing Resilience of Dryland Agriculture Under Changing Climate: Interdisciplinary and Convergence Approaches; Naorem, A., Machiwal, D., Eds.; Springer Nature Singapore: Singapore, 2023; pp. 657–688. [Google Scholar]
  31. Chang, J.; Zhang, X. Design and test of one-step centralized type pneumatic seeding system. Trans. Chin. Soc. Agric. Eng. 2011, 27, 136–141. [Google Scholar]
  32. Qi, B.; Zhang, D.; Cui, T. Design and experiment of centralized pneumatic seed metering device for maize. Trans. Chin. Soc. Agric. Eng. 2013, 29, 8–15. [Google Scholar]
  33. Wang, G.; Xia, X.; Zhu, Q.; Yu, H.; Huang, D. Design and experiment of soybean high-speed precision vacuum seed metering with auxiliary filling structure based on DEM-CFD. J. Jilin Univ. Eng. Technol. Ed. 2022, 52, 1208–1221. [Google Scholar] [CrossRef]
  34. GB/T 6973-2005; Testing Methods of Single Seed Drills (Precision Drills). China Standard Publishing House: Beijing, China, 2005.
  35. Bai, S.; Yuan, Y.; Niu, K.; Zhou, L.; Zhao, B.; Wei, L.; Liu, L.; Xiong, S.; Shi, Z.; Ma, Y.; et al. Simulation Parameter Calibration and Experimental Study of a Discrete Element Model of Cotton Precision Seed Metering. Agriculture 2022, 12, 870. [Google Scholar] [CrossRef]
Figure 1. (a) Structure of the whole machine; (b) Structure of cavity seeder; (c) Seed delivery tube structure. 1. motor 2. negative pressure shaft 3. sprocket 4. air suction roller 5. seed box 6. absolute pressure block 7. inoculation port 8. negative pressure duct 9. fan 10. frame 11. seed pipe 12. cavity seeder 13. seed guide 14. fixed disc 15. seed divider 16. seed stopping disc 17. shaft 18. moving disc 19. curved seed guard disc 20. retaining ring 21. duck beak 22. cotton seed inlet 23. air flow inlet 24. seed delivery 25. subsequent piping 26. gas-solid mixture outlet.
Agriculture 13 01050 g001
Figure 2. Analysis of the force on cotton seeds at a certain moment.
Agriculture 13 01050 g002
Figure 3. (a) Simulation model grid structure; (b) Cotton seeds in kind; (c) Cotton seeds simulation model. 1. Cotton seed inlet 2. Airflow inlet 3. Seed delivery pipe 4. Cavity seeder 5. Gas-solid mixture outlet 6. Cotton seed outlet.
Agriculture 13 01050 g003
Figure 4. Grid independence test.
Agriculture 13 01050 g004
Figure 5. The form of pipeline joints for transmission: (a) Round table diversion structure; (b) Cylindrical diversion structure; (c) Vertical plate diversion structure.
Agriculture 13 01050 g005
Figure 6. FLUENT-EDEM coupling calculation flow chart.
Agriculture 13 01050 g006
Figure 7. Distribution of airflow field in joints with different clamping angles: (a) 15°; (b) 30°; (c) 45°; (d) 60°.
Agriculture 13 01050 g007
Figure 8. Airflow field distribution with different diversion structures: (a) Round table diversion structure; (b) Vertical plate diversion structure; (c) Cylindrical diversion structure.
Agriculture 13 01050 g008
Figure 9. Distribution of seed transport trajectories in different rows.
Agriculture 13 01050 g009
Figure 10. Velocity distribution of different rows of seeds: (a) Seed velocity distribution for different rows; (b) Angular velocity distribution of seeds in different rows.
Agriculture 13 01050 g010
Figure 11. Velocity of cotton seeds in the seed delivery tube (a positive pressure of 50 Pa was applied externally, with the red arrow leading to the mark meant for replay). (a) Speed of cavity seeder 20 rev/min; (b) Speed of cavity seeder 30 rev/min; (c) Speed of cavity seeder 40 rev/min; (d) Speed of cavity seeder 50 rev/min.
Agriculture 13 01050 g011
Figure 12. Movement trajectory and distribution state of cotton seeds: (a) Speed of cavity seeder 20 rev/min; (b) Speed of cavity seeder 30 rev/min; (c) Speed of cavity seeder 40 rev/min; (d) Speed of cavity seeder 50 rev/min.
Agriculture 13 01050 g012
Figure 13. The speed distribution of the cotton seeds in the seed delivery tube (the speed of each cavity seeder is 30 rev/min): The red arrow leads to the mark meant for resowing. (a) Positive pressure 50 Pa. (b) Positive pressure 150 Pa. (c) Positive pressure 250 Pa. (d) Positive pressure 350 Pa.
Agriculture 13 01050 g013
Figure 14. Movement trajectory and distribution state of cotton seeds(cavity seeder speed 30 rev/min). (a) Positive pressure 50 Pa. (b) Positive pressure 150 Pa. (c) Positive pressure 250 Pa. (d) Positive pressure 350 Pa.
Agriculture 13 01050 g014
Figure 15. Effect of different working parameters on seeding performance: (a) for third row single seeding rate; (b) for third row missed seeding rate; (c) for fourth row single seeding rate; (d) for fourth row missed seeding rate.
Agriculture 13 01050 g015
Figure 16. Seed Discharger Performance Testing Test Bench. 1. Homemade seed rower; 2. Seed tube; 3. Cavity seeder; 4. Positive pressure air delivery tube; 5. JPS-12 computer visual seed row performance testing test bench; 6. Two-phase inverter; 7. Vortex fan 8. Three-phase inverter.
Agriculture 13 01050 g016
Figure 17. Bench test and simulation test performance comparison: (a) Single seeding rate; (b) Missed seeding rate; (c) Multiple rate.
Agriculture 13 01050 g017
Table 1. Simulation material parameter setting.
ProjectsPropertiesNumerical Value
Cotton seedsTriaxial dimension (mm × mm × mm)6.94 × 5.19 × 4.82
Density/(kg·m−3)664.6
Poisson’s ratio0.25
Elastic modulus/Pa1.0 × 106
ABS PlasticDensity/(kg·m−3)1180
Poisson’s ratio0.5
Elastic modulus/Pa1.77 × 106
Cotton seed-cotton seedCollision recovery coefficient0.3
coefficient of static friction0.56
coefficient of rolling friction0.15
ABS Plastic-cotton seedCollision recovery coefficient0.6
coefficient of static friction0.48
coefficient of rolling friction0.1
Table 2. Influence of seed delivery tube joint angle on airflow parameters.
Pipe
Angle
(°)
Outlet Air
Pressure
(Pa)
Outlet Air
Flow Velocity
(m/s)
Cotton Seed
Inlet Airflow Pressure (Pa)
Cotton Seed
Inlet Air Flow Rate (m/s)
Pressure
Loss
(Pa)
Air Flow into PORT Speed (m/s)
15417.6325.936.372.3076.0028.00
30411.2725.607.472.6081.2627.79
45353.6223.3321.974.81124.4127.46
60277.5219.9844.967.69177.5227.04
Table 3. Influence of the airflow parameters of the diversion structure of the seed delivery tube joint.
Type of the Seed
Diversion Tube Joint
Outlet Air
Pressure
(Pa)
Outlet Air
Flow Velocity
(m/s)
Cotton Seed
Inlet Air Flow Pressure (Pa)
Cotton Seed
Inlet Air Flow Rate (m/s)
Pressure
Loss
(Pa)
Air Flow into Port Speed (m/s)
No diversion417.6325.936.372.3076.0028.00
Vertical plate diversion155.0614.51−0.06−6.19345.0015.54
Cylindrical diversion250.0918.47−0.03−3.27249.7415.18
Round table diversion386.7824.950.010.12113.2125.05
Table 4. Bench test results.
Speed of Cavity Seeder
(rev/min)
Positive Pressure
(Pa)
Single Seeding
Rate/%
Missed Seeding Rate/%Multiple Seeding
Rate/%
20080.3610.549.10
5089.546.434.03
10088.926.784.30
15085.348.336.33
30077.8213.099.09
5088.767.263.98
10086.597.755.66
15083.218.937.86
40070.6516.5312.82
5087.327.385.30
10086.127.945.94
15080.649.869.50
Disclaimer/Publisher’s Note: The statements, opinions and data contained in all publications are solely those of the individual author(s) and contributor(s) and not of MDPI and/or the editor(s). MDPI and/or the editor(s) disclaim responsibility for any injury to people or property resulting from any ideas, methods, instructions or products referred to in the content.

