Article

Identification of Candidate Genes for Drought Resistance during Soybean Seed Development

1
Soybean Research Institute, Heilongjiang Academy of Agricultural Science, Harbin 150086, China
2
College of Life Sciences, Northeast Agricultural University, Harbin 150030, China
*
Authors to whom correspondence should be addressed.
Agriculture 2023, 13(5), 949; https://doi.org/10.3390/agriculture13050949
Submission received: 13 March 2023 / Revised: 6 April 2023 / Accepted: 20 April 2023 / Published: 25 April 2023
(This article belongs to the Section Crop Genetics, Genomics and Breeding)

Abstract

:
Drought is the main abiotic stress limiting soybean production worldwide and seriously limits the reproductive growth of soybean. To elucidate the molecular mechanisms of drought stress response in soybean seed developmental stages, transcriptome analysis was performed on five seed developmental stages under drought stress and control conditions. Thousands of genes were found to change in expression level under drought stress, GO and KEGG enrichment analysis showed that differentially expressed genes (DEGs) were involved in drought resistance at every stage or tissue, but there were very few DEGs at the primary stage of seed development, which indicated that the seeds at the primary developmental stage were influenced little by drought stress. There was no shared DEG among all five stages or tissues, this indicated that they have different mechanisms to resist drought stress. Furthermore, we investigated DEGs associated with drought response at different stages to identify candidate regulators of drought stress response during soybean seed development. These genes are associated with metabolic and regulatory networks, among others. Taken together, the results will expand our understanding of the adaptation of soybean to drought stress and provide new insights into the molecular mechanisms of soybean drought tolerance development.

1. Introduction

Drought is one of the main environmental constraints affecting crop growth and development, ultimately leading to reduced yields [1]. Soybean (Glycine max L.) is the most widely grown oilseed in the world, providing extremely valuable oils and proteins for humans and animals [2]. Drought can occur in different stages of soybean growth, but soybean plants are most seriously affected by drought during the reproductive growth period. Water deficit causes the flowers to wilt and a reduction in the number of pods, resulting in smaller and fewer seeds [3,4]. Early seed development or seed set is a critical stage in determining yield potential [5]. This stage is a critical stage that determines yield, which involves the processes of carbohydrate uptake and transport and protein and lipid biochemical synthesis during seed development [6,7,8]. Therefore, understanding the molecular mechanisms by which soybean plants respond to drought stress is important at the seed development stage to help improve soybean yield.
Plant resistance to drought stress involves complex physiological and biochemical processes [9,10,11]. Plants subjected to drought stress increased the expression of various genes to produce the appropriate proteins, such as heat shock protein (HSP) and late embryogenesis protein (LEA), which increase the water-binding capacity of cells under drought stress [12,13,14]. Alternatively, transcription factors (TFs) are transcriptional regulatory proteins that regulate the overall response to drought, such as DREB, HSF and MYB [15,16,17]. The transcriptome can comprehensively reflect the gene expression of an organism at a given developmental stage or environment, and reveal important functional genes [18]. Transcriptome sequencing technology (RNA-seq) has become an important technology for analyzing the regulatory mechanisms of complex traits [19,20], and has been used to study the drought resistance mechanism of soybean [21,22]. Current studies mainly focus on the analysis of the dehydration mechanism and drought management in seedlings and vegetative growth stages [21,23,24], while there are few reports on the molecular mechanisms and genetic basis of drought response in soybean seed development stages. Due to the different developmental stages of soybean seeds, their response mechanisms to drought may be inconsistent. Therefore, it is necessary to analyze the transcriptome of different developmental stages of soybean seeds. In this study, RNA-Seq was used to dissect the molecular responses of soybean seed developmental stages under drought stress conditions, including flowers, pods at 7 days after flowering (DAF) and seeds at 14, 25 and 35 DAF. We identified important DEGs associated with drought response at different stages and found different mechanisms to resist drought stress among all five stages. This result will expand our understanding of soybean’s adaptation to drought stress and provide novel insights into the molecular basis of drought resistance in soybean seed development.

2. Materials and Methods

2.1. Plant Growth Conditions and Sample Collection

The soybean cultivar Heinong 84 was used in this study. Seeds were sown on plastic pots (29 × 24 cm) with 4:1:1 (v/v/v) of soil, vermiculite and perlite mixture, cultured in a growth chamber with a temperature cycling between 18 °C (night) and 26 °C (day), relative humidity of 55%,14 h light–10 h dark cycle and 1000 μmol m−2 s−1 light intensity. Three plants were set up in each pot at the Vegetative 1 stage (V1), and all pots were kept well watered until the V6 stage. From anthesis to maturity, water treatments were imposed in two ways: well-watered conditions (C) and drought stress conditions (D). Normal watering irrigation kept the relative soil water content at 70–80% of the field water, and water stress treatment kept the relative soil water at 35–40% of the field water. Soil moisture was monitored with a soil moisture meter (TZS, TOP Instruments, Hangzhou, China). A variety of tissues, including flowers (FL), pods at 7 DAF (7P) and seeds at 14 DAF, 25 DAF, 35 DAF (14S, 25S and 35S) were collected for further investigation. The tissues mentioned above were immediately frozen in liquid nitrogen and then stored at −80 °C until further use.

2.2. RNA Isolation and Transcriptome Sequencing

The total RNA of soybean samples was extracted using TRIzol reagent. RNA quality was determined by Agilent 2100 Bioanalyzer. A total of 30 cDNA libraries were established, including 5 drought treatment groups (D_FL, D_7P, D_14S, D_25S and D_35S) and 5 control groups (C_FL, C_7P, C_14S, C_25S and C_35S), each with three replicates. All samples were sequenced using Illumina HiSeq 4000 platform by Lianchuan Biotechnology Co., Ltd. (Hangzhou, China). The clean reads were aligned to the soybean reference genome (Williams_82_a4_v1) using HISAT package (v2.2.1).

2.3. Identification of Differentially Expressed Genes (DEGs)

FPKM (fragments per kilobase of exon per million reads mapped) can be used for gene expression level. FactoMineR (v2.2) and vegan packages (v2.5.4) were used to perform Principal Component Analysis (PCA) on the gene expression profiles. The DEGs were identified using edgeR package (v3.22.5) and filtered by |log2FoldChange| ≥ 1 and p value < 0.05. Function enrichment analysis of DEGs in Gene Ontology (GO) terms and KEGG pathways were performed using ClusterProfiler package (v3.6). Other bioinformatics analysis was performed using the OmicStudio tools at https://www.omicstudio.cn/tool (accessed on 1 March 2023).

2.4. qRT-PCR Verification

For the verification of differentially expressed genes by qRT-PCR to verify the expression of DEGs, we selected 10 drought-responsive genes and quantified their transcription by qRT-PCR. In these analyses, all the same soybean RNA samples were used. Soybean actin (NM_001253024.3) and RLP24 (XM_003551021) were used as inner reference genes, all primers are listed in Supplementary Table S1. Primer efficiency was determined using a 2-fold dilution of pooled cDNA samples. A standard curve for each set of primers was generated using five serially diluted cDNA samples as templates. E values were estimated as described previously [25]. E values ranged from 0.91 to 1.05 and R2 ranged from 0.98 to 0.99, respectively (Figure S1). First-strand cDNA was synthesized with TUREscript 1st Stand cDNA SYNTHESIS Kit (Aidlab, Beijing, China), and qRT-PCR was performed with analytikjena-qTOWER2.2 (ANALYTIKJENA, Leipzig, Germany). The PCR steps were 95 °C for 3 min, 95 °C for 10 s, 60 °C for 30 s, 40 cycles, and qRT-PCR for each gene was repeated 3 times. Relative expression levels of selected genes were calculated using the 2−ΔΔCt method [26]. Pearson correlation analysis of the RNA-seq and qRT-PCR data were performed using R. Student’s t-test was used to analyze significant differences in expression changes between drought stress and control (* p < 0.05, ** p < 0.01).

3. Results

3.1. Generation of Transcriptome Data

A variety of tissues, including FL, 7P, 14S, 25S and 35S, were collected under drought stress and control. To identify candidate genes associated with drought resistance during soybean seed development, 30 cDNA libraries (three replicates) were sequenced under normal and drought stress conditions. The total clean data were 201.78 GB in size with greater than 98.09% Q30 bases (Table S2). At least 96.44% of the data in each library could be mapped to the Williams_82_a4_v1 soybean reference genome (Table S3). Gene expression levels were measured using normalized FPKM (Figure S2).

3.2. Differential Expression Genes under Drought Stress

The DEGs were identified from each comparison by |log2FoldChange| ≥ 1 and p value < 0.05. Thousands of genes were found to change in expression level under drought stress; the number of DEGs at the primary stage of seed development was low, though the numbers of DEGs at prior stages/tissues (flower and pod) were higher, but the numbers of DEGs increased with the growth of seeds (Figure 1A).
In addition, we performed a functional enrichment analysis of the drought-responding DEGs using GO and KEGG databases. GO enrichment revealed that DEGs were associated with multiple biological processes (Figure S3), but several GO terms were very common and possessed most DEGs, for example transcriptional regulation, transcription, defense response and protein phosphorylation. These genes are upstream regulators of many biological processes. Based on the KEGG database, the pathway enrichment analysis of the DEGs was carried out, and the top 20 enriched KEGG pathways are shown in Figure 1. Most of them are related to drought stress resistance, such as plant hormone signal transduction, MAPK signaling pathway, phenylpropanoid biosynthesis, flavonoid biosynthesis, stilbenoid, diarylheptanoid and gingerol biosynthesis, starch and sucrose metabolism, etc.
However, several unique pathways were significantly enriched in different stage comparisons (Table S4; Figure S4). We found that α-linolenic acid metabolism, cofactor biosynthesis, glyoxylate and dicarboxylic acid metabolism, nitrogen metabolism, photosynthetic-antenna proteins, porphyrin metabolism and tyrosine metabolism pathways were significantly enriched in D_FLVSC_FL. Glycine, serine and threonine metabolism, mismatch repair and ribosome were significantly enriched in D_7PVSC_7P. Diterpenoid biosynthesis was significantly enriched in D_14SVSC_14S. Cutin, suberine and wax biosynthesis, pentose and glucuronate interconversions, plant–pathogen interaction and tryptophan metabolism were significantly enriched in D_25SVSC_25S. Meanwhile, arginine and proline metabolism, beta-alanine metabolism, biosynthesis of various antibiotics, carotenoid biosynthesis, glycosphingolipid biosynthesis-globo and isoglobo series, purine metabolism, riboflavin metabolism and sphingolipid metabolism were significantly enriched in D_35SVSC_35S.

3.3. Identification of Common DEGs in Response to Drought

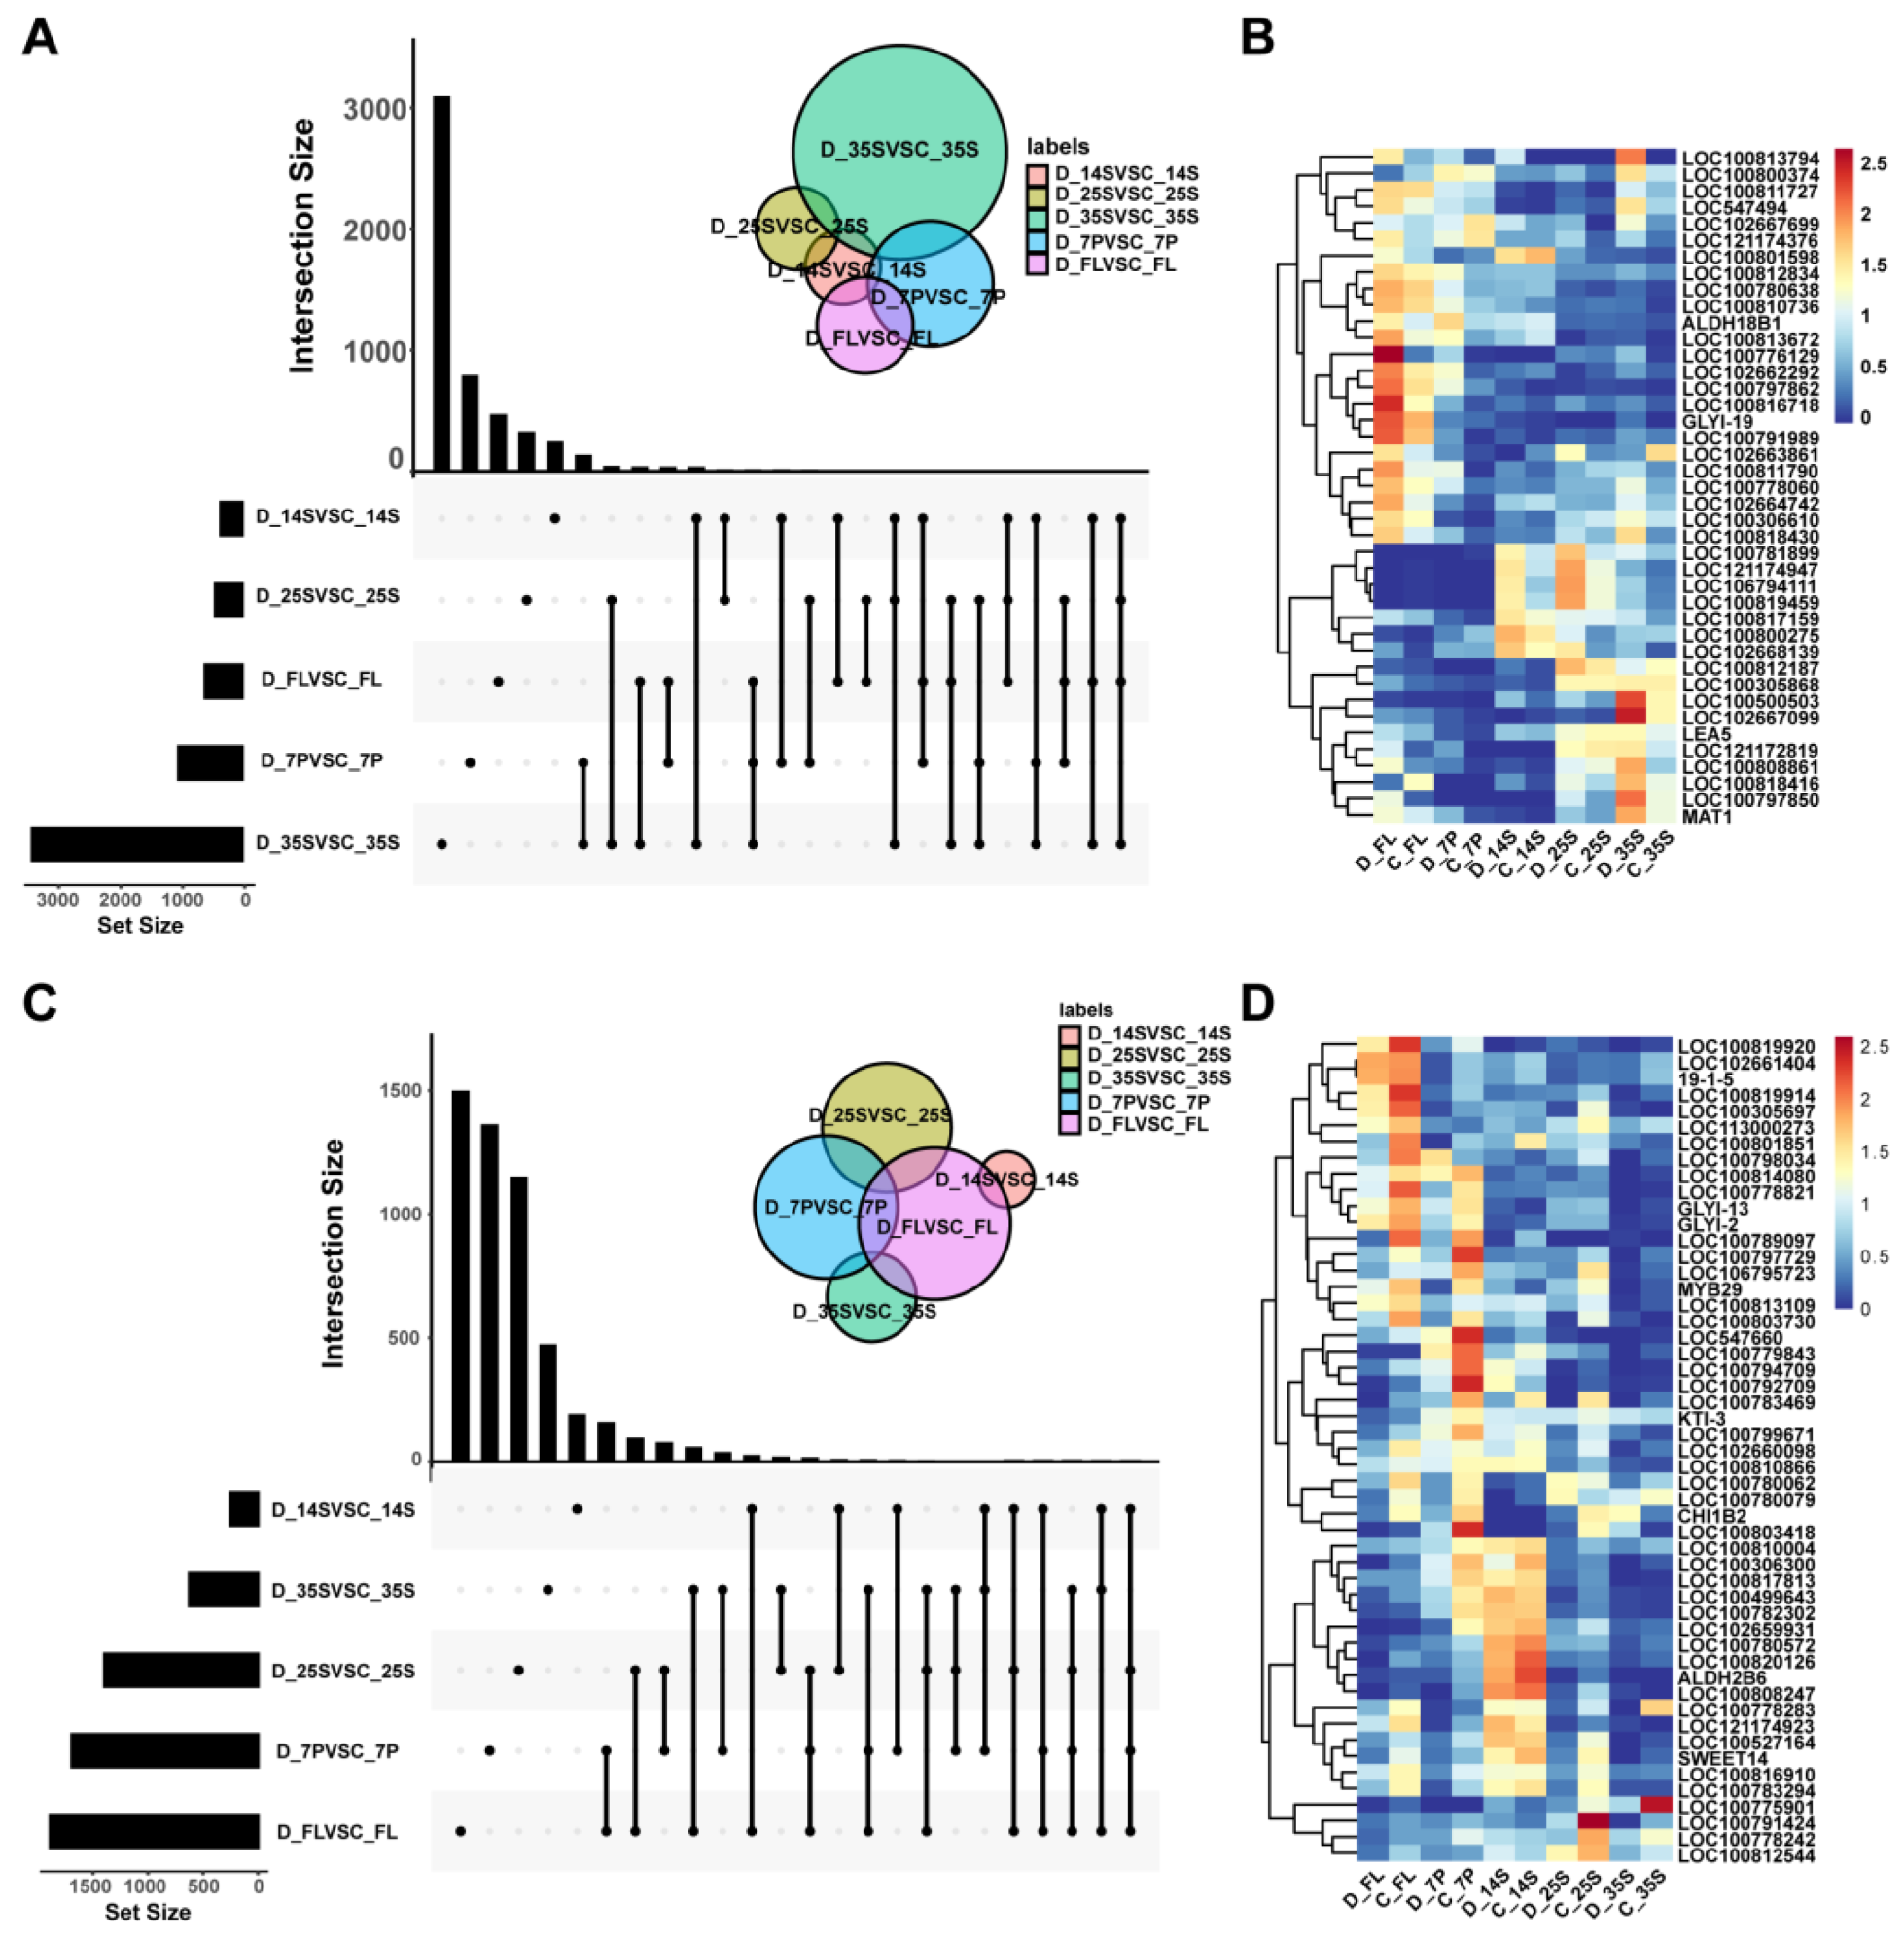
Venn diagrams were constructed to show the overlapping sets of all upregulated and downregulated DEGs between the groups (Figure 2A,C). The results displayed 41 overlapping upregulated (0.35% of all DEGs) and 51 overlapping downregulated DEGs (0.44% of all DEGs) across any three of all stages, respectively. No DEG was shared by all five comparisons, which indicates that the five tissues or stages have different mechanisms to resist drought stress. We constructed heat maps to show the expression patterns of these common DEGs, and they showed varied patterns (Figure 2B,D). Among the common DEGs, 66 genes have functional descriptions and 14 of them are known drought resistance genes, including DREB 2D [27], HSFA-2 [28], probable E3 ubiquitin-protein ligase XERICO [29], delta-1-pyrroline-5-carboxylate synthase [30], LEA5 [31], etc. (Table S5).
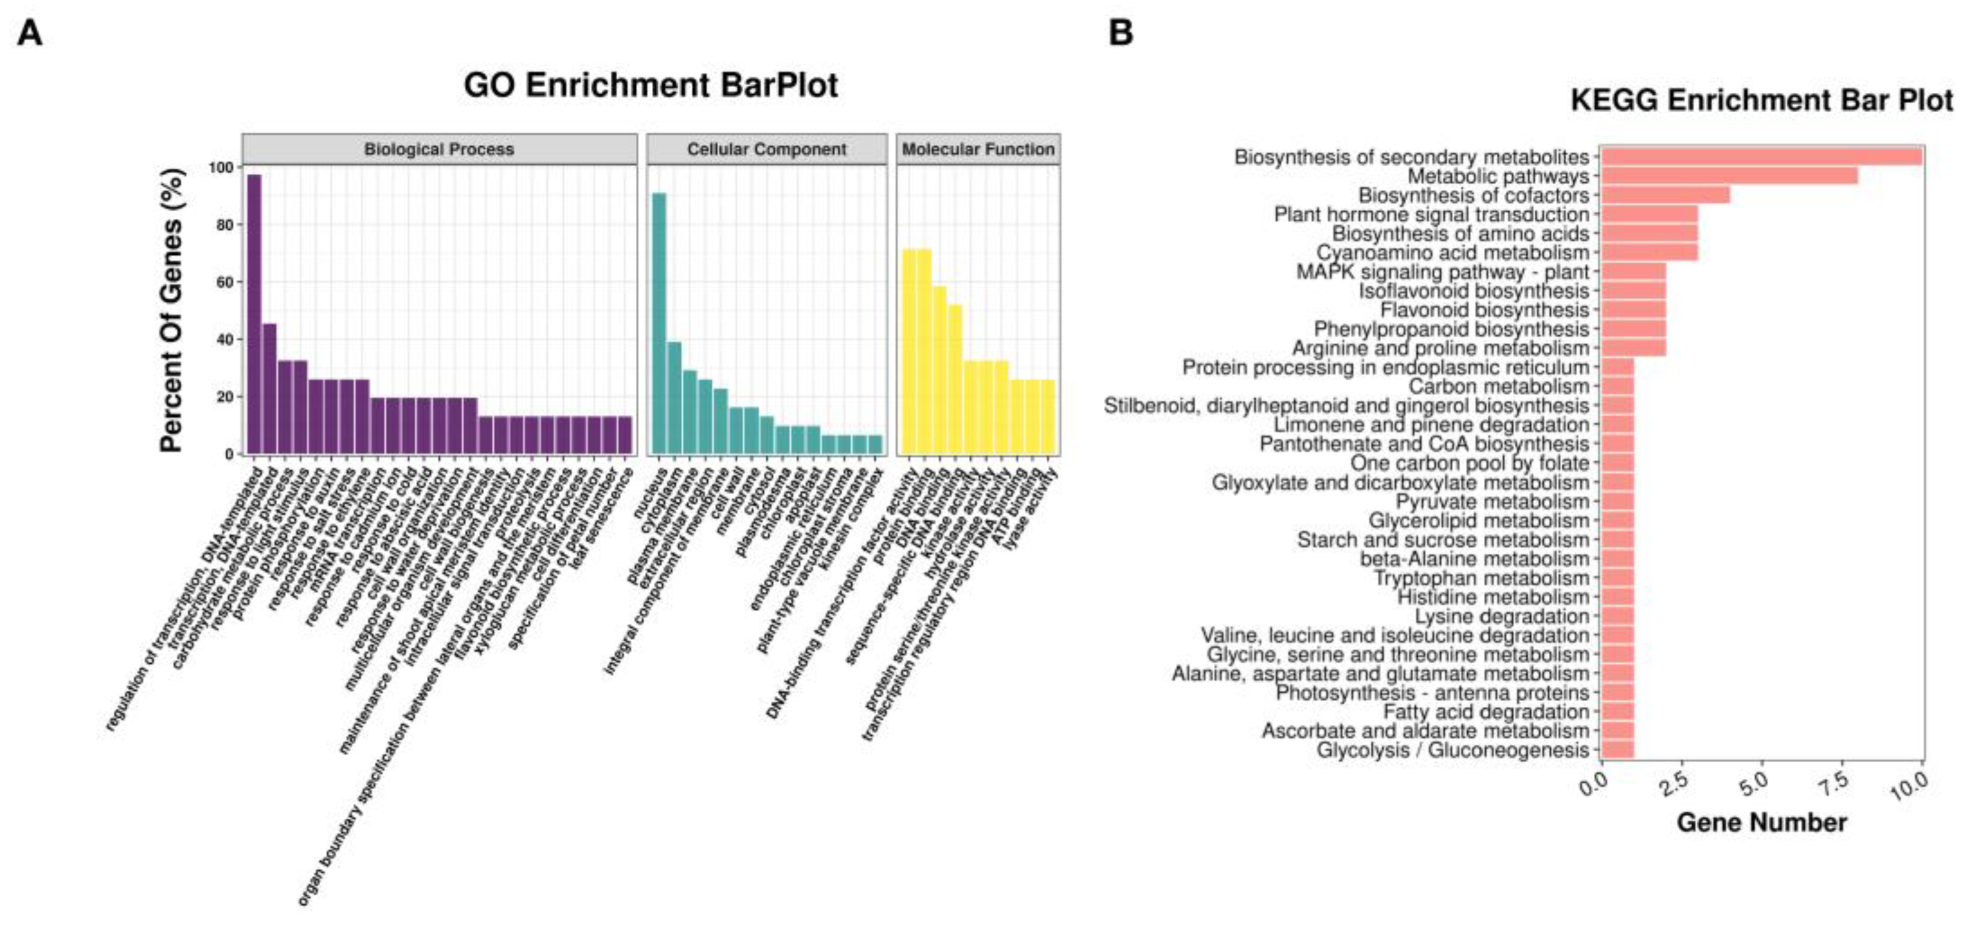
GO enrichment revealed that these DEGs were involved in several biological processes, including ‘regulation of transcription, D-templated’, ‘transcription, D-templated’, carbohydrate metabolic process, response to light stimulus, protein phosphorylation, etc. (Figure 3A). The main enriched cellular components were the nucleus, cytoplasm, plasma membrane and extracellular region components. The most common molecular functions were DNA binding transcription factor activity, protein binding, DNA binding and sequence-specific DNA binding. This indicates that these DEGs are upstream regulators of some biological processes. The enrichment of the KEGG pathways indicated that these DEGs were mainly involved in secondary metabolite biosynthesis, metabolic pathways, cofactor biosynthesis, plant hormone signaling, cyanoamino acid metabolism and the MAPK signaling pathway in plants (Figure 3B).

3.4. Identification of Candidate Drought Resistance Genes at Different Stages of Soybean Seed Development

Furthermore, to investigate the candidate drought resistance genes at different stages of soybean seed development, we generated volcano plots and heatmaps of the top 20 DEGs in each group (Figure 4A–E). They display that the genes were highly expressed at a specific stage rather than at all stages. In total, 81 out of these 100 DEGs had functional descriptions, and many DEGs are known drought resistance genes, including four PP2Cs [32], three transcription factors [33], eight heat shock proteins [34], three LEA proteins [31], two proline-rich proteins [30], etc. (Table S6).
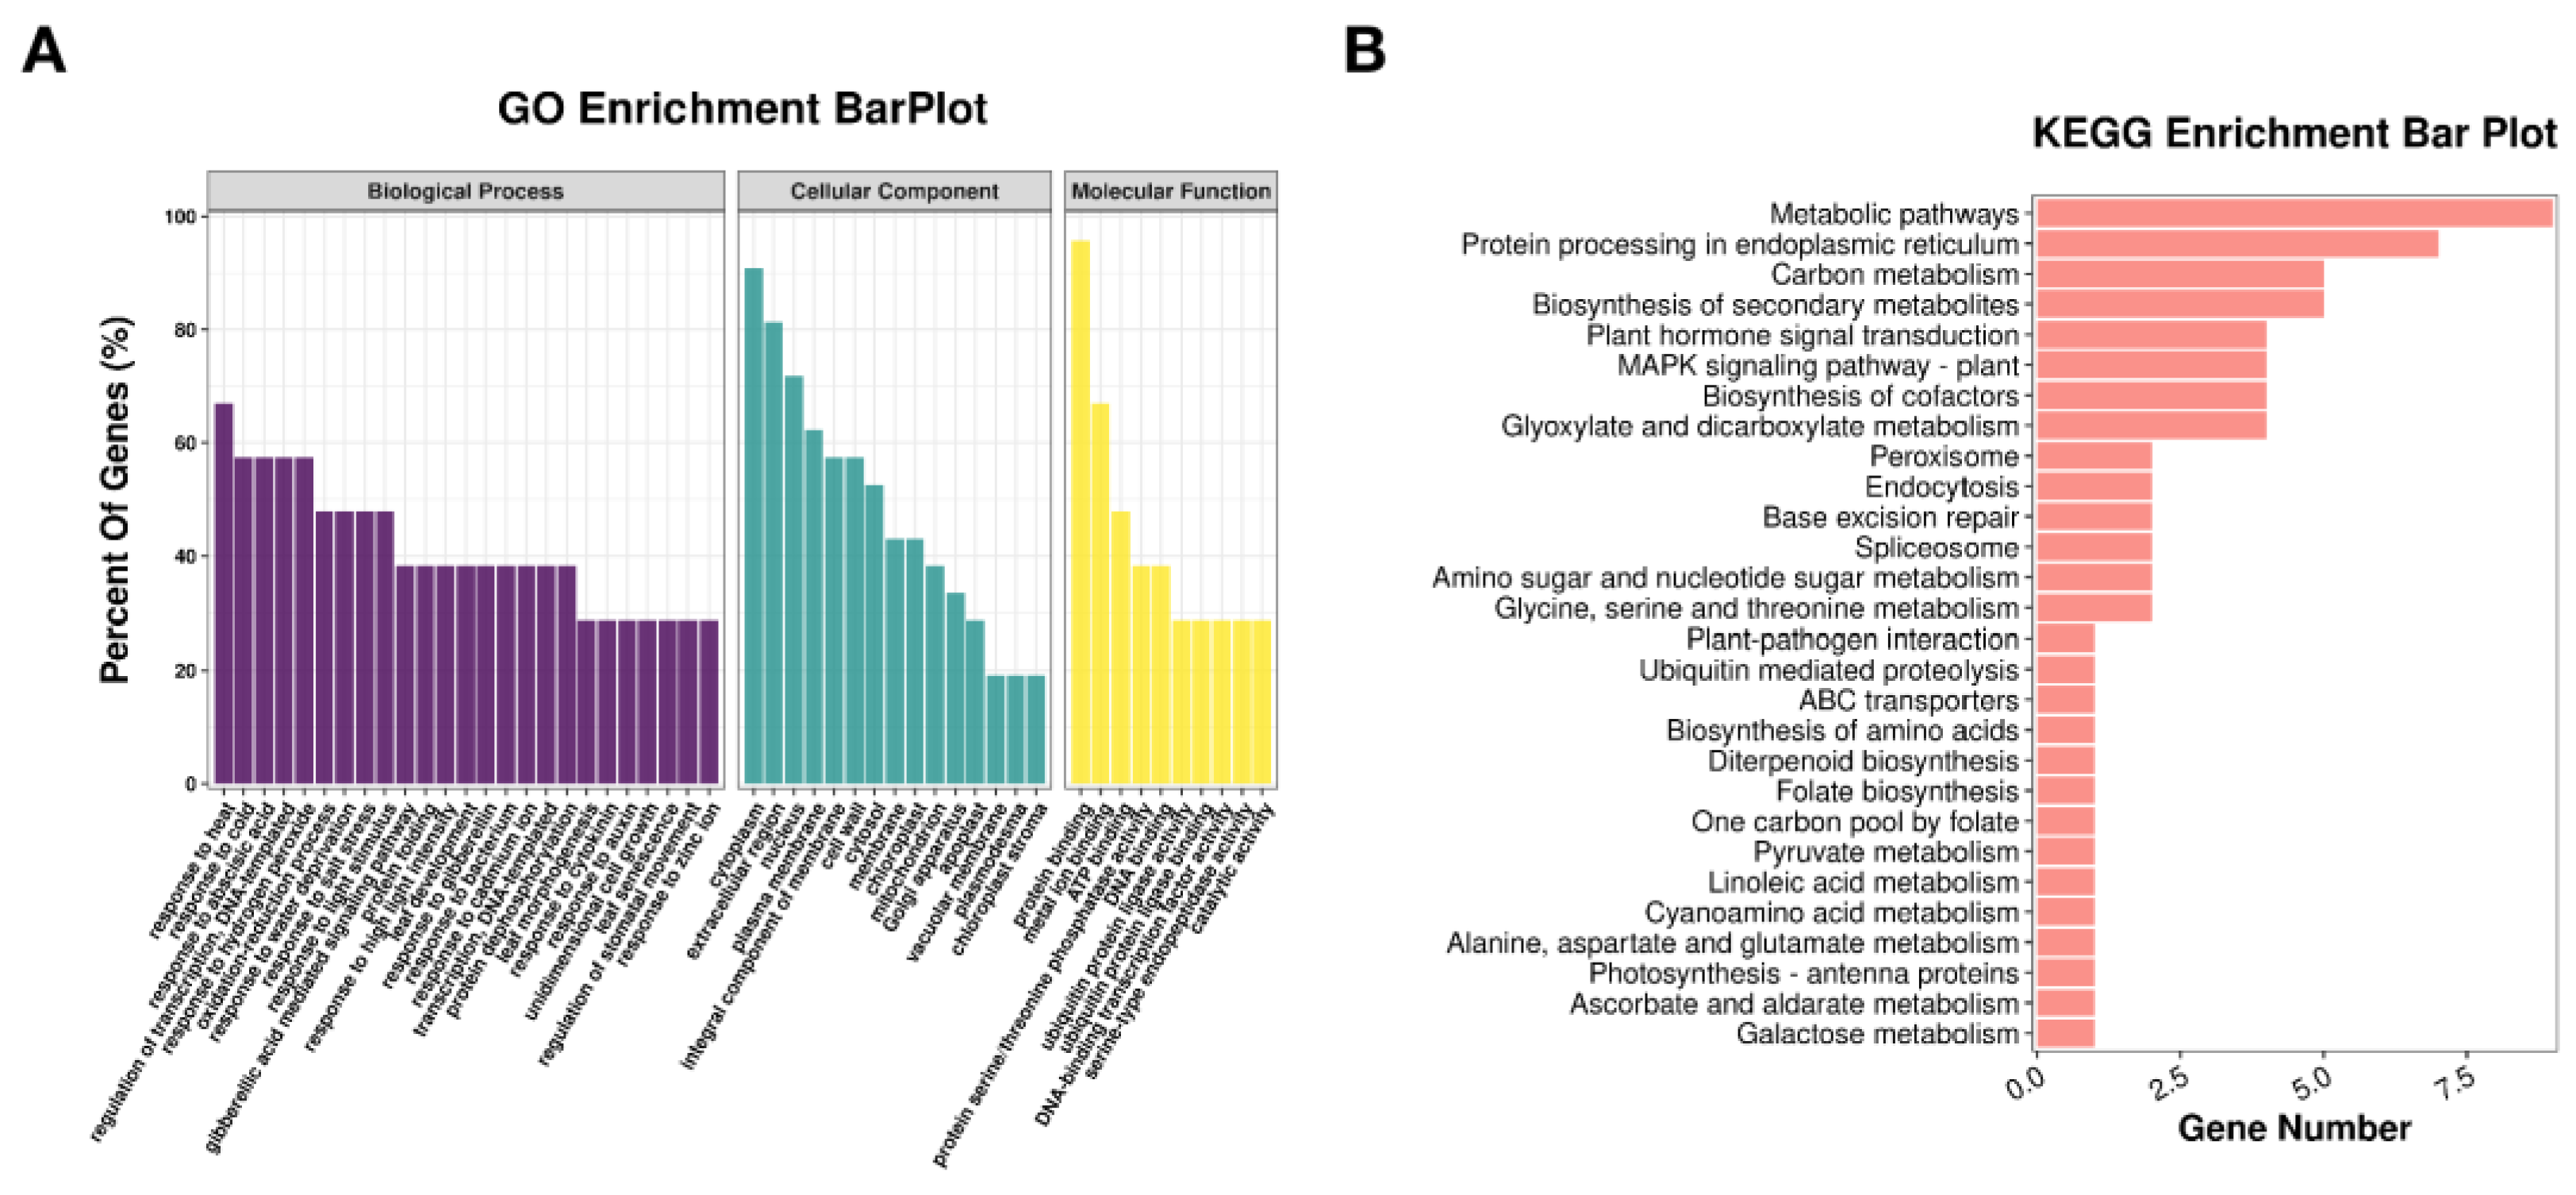
GO enrichment analysis revealed the top 20 DEGs were mainly associated with abiotic stress response genes (Figure 5A), including response to heat, cold, abscisic acid, hydrogen peroxide, dehydration, etc. The most concentrated cellular component of the DEGs was the cytoplasm, followed by the extracellular region component. The most common molecular functions are protein binding, metal ion binding and ATP binding. KEGG pathway enrichment showed that these DEGs were mainly involved in metabolic pathways, protein processing in endoplasmic reticulum, biosynthesis of secondary metabolites, carbon metabolism, glyoxylate and dicarboxylate metabolism, biosynthesis of cofactors, MAPK signaling pathway, and plant hormone signal transduction (Figure 5B).

3.5. qRT-PCR

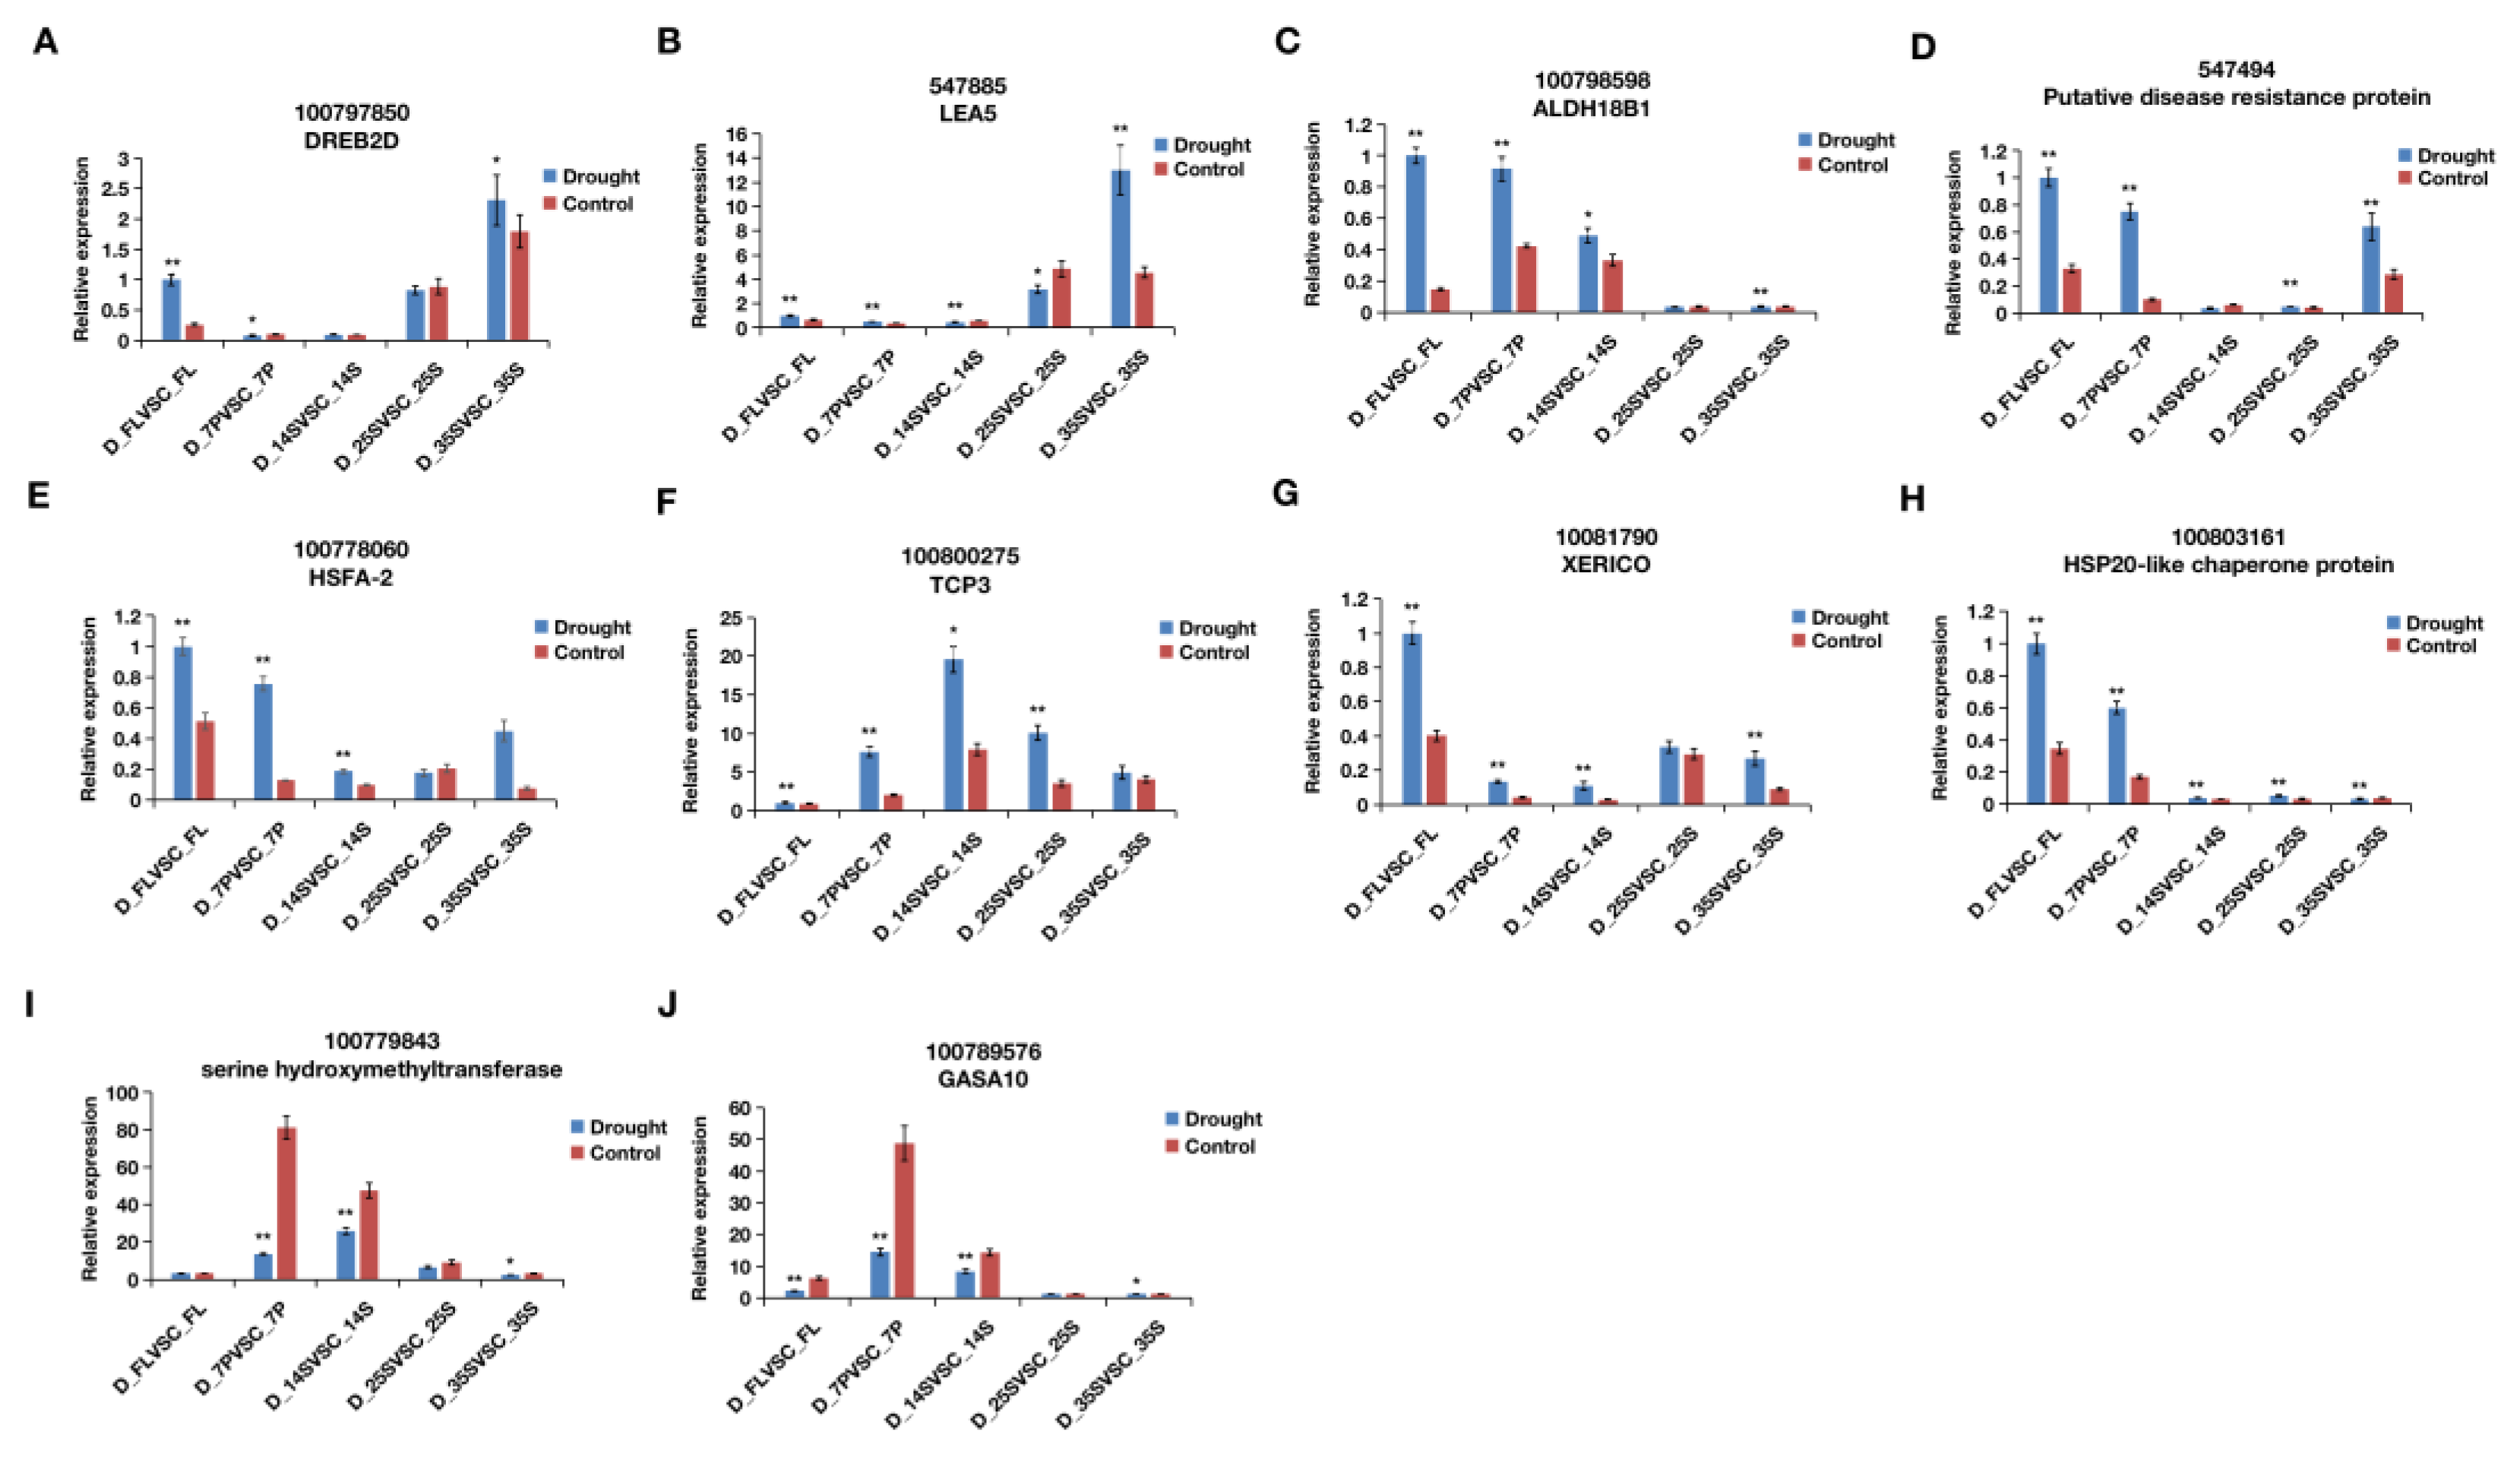
To identify and validate the drought-stress-induced genes, 10 DEGs were selected for qRT-PCR analysis. As shown in Figure 6, eight genes (Figure 6A–H) were commonly upregulated under drought stress. In addition, serine hydroxymethyltransferase and GASA10 (Figure 6I,J) were generally downregulated under drought stress. The results showed that the expression trends of these DEGs obtained by qRT-PCR were consistent with the results of RNA-seq, and the Pearson coefficient was between 0.82 and 0.93. This confirmed that our RNA-seq results are reliable for studying gene expression in soybean seed development under drought stress.

4. Discussion

4.1. Drought-Responsive Genes at Five Stages of Soybean Seed Development

Under drought stress, plants attempt to adapt to new environments by changing gene expression when they detect stress signals [35,36,37]. Therefore, genes with altered expression may be related to drought response pathways in plants. In this study, RNA-seq technology was used to analyze the transcriptome changes in five stages of soybean seed development under drought stress. Our results showed that in the primary stage of seed development (14 DAF), drought stress has few effects on seeds. Previous studies also showed no significant difference in seed weight between drought-stressed and control plants during early seed development (15 DAF). However, in the middle and late stages of seed development (30–45 DAF), the weight of the seeds under drought stress decreased by 41.65% compared with the control [8]. This is valuable in agriculture and worthy for further study. The investigation in this study also showed that no DEG was shared by all five comparisons, and several unique pathways were significantly enriched in different stage comparisons (Table S4).
Meanwhile, DEGs at each stage/tissue enrich in stress resistance GO terms or KEGG pathways. Plant hormone signal transduction is an important signal process in plants under drought stress conditions [38]. In this study, the DEGs of the plant hormone signal transduction pathway mainly included genes related to auxin, ABA and ethylene signaling, such as auxin-induced protein, auxin-responsive protein, indole-3-acetic acid-amido synthetase, abscisic acid receptor, protein phosphatase 2C, ethylene-responsive transcription factor, transcription factor TGA and xyloglucan endotransglucosylase/hydrolase protein. The mitogen-activated protein kinase (MAPK) cascade is a major conserved signaling pathway in plants that transduces extracellular drought stress signals into intracellular signals [20,39]. We also observed an enrichment of genes in the MAPK signaling pathway, involving in Mitogen-activated protein kinase, LRR receptor-like serine/threonine-protein kinase, transcription factor SPEECHLESS, ERECTA-like kinase, chitinase class I precursor, catalase, copper-transporting ATPase and respiratory burst oxidase homolog protein. Consistent with this, many genes involved in plant–pathogen interactions showed differential expression under drought stress conditions in this study, such as calcium-dependent protein kinase, calcium-binding protein, pathogenesis-related protein, heat shock protein, cysteine proteinase, cyclic nucleotide-gated ion channel and 3-ketoacyl-CoA synthase.
Phenylpropanoid metabolism is the first step in the biosynthesis of secondary metabolites, leading to the accumulation of various phenolic compounds under abiotic stress conditions [40]. The accumulation of plant phenolics is important to neutralize the negative effects of drought stress [41]. Flavonoids from the phenylpropanoid pathway are able to bind reactive oxygen species (ROS), protecting plants from damage caused by biotic and abiotic stresses [42,43]. We observed that the expression of many phenylpropane biosynthesis and flavonoid biosynthesis genes was significantly affected by drought in the seed developmental stages of soybean, involving peroxidase, phenylalanine ammonia-lyase, spermidine hydroxycinnamoyl transferase, cinnamoyl-CoA reductase, cytochrome P450, caffeoylshikimate esterase, Shikimate O-hydroxycinnamoyltransferase, chalcone synthase, chalcone reductase and flavonol synthase. Starch is the most important storage carbohydrate in plants, which is converted to soluble sugars under drought stress [44,45]. Sucrose, the main product of plant photosynthesis, is the most important energy substrate and regulator of plant growth signals [46]. Starch and sucrose metabolism pathways are highly enriched during seed development under drought stress, including beta-fructofuranosidase, beta-glucosidase, sugar efflux transporter SWEET, beta-amylase, cyanogenic beta-glucosidase, endoglucanase, granule-bound starch synthase, probable trehalose-phosphate phosphatase, sucrose synthase, fructokinase, glucose-1-phosphate adenylyltransferase, etc.

4.2. Identified the Candidate Genes in Response to Drought during Soybean Seed Development

To identify the candidate regulators of drought stress responses during soybean seed development, we investigated the DEGs associated with drought responses at different stages. Transcription factor TCP3, DREB2D, HSFA-2, homeodomain/HOMEOBOX transcription factor and homeobox-leucine zipper protein ATHB-40 were significantly upregulated under drought stress. TCP proteins belong to the bHLH family, and AtTCP3 has been shown to interact with R2R3-MYB, leading to increased flavonoid production and the further downregulation of auxin responses in Arabidopsis [47]. According to our results, TCP3 may play a role in stress resistance, which deserves further study. Studies have confirmed that both DREB and HSF play important roles in drought and heat stress [28,48]. Homeodomain leucine zippers (HD-ZIPs) are a family of plant-specific transcription factors that play candidate roles in plant development in response to various stresses [49]. In addition, drought stress significantly increased the probable E3 ubiquitin protein ligases XERICO, protein phosphatase 2C 8, protein phosphatase 2C 37 and protein phosphatase 2C 39 in our study. Previous studies have shown that under osmotic stress conditions, PP2C binds to ABA receptors to release ABA and activate SnRK2 [32]. E3-ubiquitin protein ligase has been reported to target several candidate components of ABA signaling, namely ABA receptors, transcription factors PP2C, SnRK2 and ABF/ABI5 [29].
LEA proteins and heat-shock proteins, which are part of the stress response, are another common drought-responsive protein [31,50]. We observed that drought stress significantly increased LEA5, the mature protein PM3, LEA D-34, HSP20-like chaperone protein, 17.5 kDa class I heat shock protein, class II heat shock protein and heat shock protein 83. Oxidoreductases such as delta-1-pyrroline-5-carboxylate synthase, cytochrome P450 81E8, berberine bridge enzyme-like 8 and berberine bridge enzyme-like 28 were significantly increased under drought stress. In addition, we also noticed that other proteins, including glucose-6-phosphate 1-epimerase, probable protein S-acyltransferase 23, protein MAT1, low-temperature-induced 65 kDa protein, serine carboxypeptidase-like 50, ABC transporter B family member 11, probable protein S-acyltransferase 23 and cysteine proteinase inhibitor 2, were upregulated under drought stress.
In contrast, our results showed that sugar efflux transporter SWEET family proteins, such as SWEET14, SWEET16 and SWEET17, were downregulated in response to drought. SWEET is a sugar transporter newly discovered in recent years. It not only transports sugar, but also affects growth and drought response by regulating the efficiency of sugar transport across membranes [51]. Consistent with this, we also observed that drought stress dramatically declined serine hydroxymethyltransferase, vacuolar cation/proton exchanger 3, stress-induced receptor-like kinase, putative lactoylglutathione lyase 13 and Snakin-2 (GASA10). Previous reports have shown that SHMT participates in the photorespiratory pathway of plant oxidative photosynthetic organisms and plays an important role in drought [52,53]. Receptor-like protein kinases (RLKs) are the largest gene family in plants, and many RLKs are involved in the response to abiotic stresses [54,55]. In addition, lactoylglutathione lyase is a typical glycolytic detoxification enzyme for the highly toxic methylacetaldehyde produced in proteins, nucleic acids and other cellular components [56]. The GASA10 gene is known to be involved in the crosstalk of plant hormones, driving redox homeostasis and regulating the growth of roots, shoots and other organs [57,58].

5. Conclusions

In this study, we described the gene expression pattern of soybean at five seed developmental stages under drought stress and revealed that DEGs under drought stress were involved in metabolic, hormonal and regulatory networks, among others. In particular, we found that the number of DEGs at the primary stage of seed development is low, though the numbers of DEGs at prior stages/tissues (flower and pod) are higher, but the numbers of DEGs increase with the growth of seeds. This indicates that seeds may receive few influences from drought stress at the primary stage of seed development and could be rescued by rewatering. This is valuable in agriculture and worthy of further study. In addition, we found that soybean uses different mechanisms to resist drought stress at different stages/tissues, because they do not share many DEGs, though DEGs at each stage/tissue enrich in stress resistance GO terms or KEGG pathways. Our results also provide gene resources for research on the drought resistance of soybean seed development and provide new information for the study of soybean drought stress.

Supplementary Materials

The following supporting information can be downloaded at https://www.mdpi.com/article/10.3390/agriculture13050949/s1, Table S1: List of primers used for promoter cloning and qRT-PCR; Table S2: Statistics of transcriptome sequencing data; Table S3: Number of reads sequenced and mapped with HISAT2 software; Table S4: Venn diagram of unique and common pathways significantly enriched in different stage comparisons. Table S5: Comparative analysis of common DEGs in soybean seed development stages under control and drought stress; Table S6: Volcano top 20 genes that are drought-responsive at different stages of soybean seed development; Figure S1: PCR primer amplification efficiency; Figure S2: Distribution and density statistics of gene expression values in mRNA expression profiles; Figure S3: GO enrichment analysis of DEGs; Figure S4: Venn diagram of unique and common pathways significantly enriched in different stage comparisons.

Author Contributions

Conceptualization, X.T. and X.L. (Xinlei Liu); data acquirement: Y.X., X.T., D.C., X.L. (Xiaoyan Luan) and Q.L.; validation, Y.R., Z.Z. and X.L. (Xinlei Liu); data analysis, Y.L., X.T., Y.X. and K.Z.; original draft, Y.X.; review and editing, X.T., Y.L. and X.L. (Xinlei Liu); supervision, Y.L. and X.L. (Xinlei Liu). All authors have read and agreed to the published version of the manuscript.

Funding

This research was funded by the Natural Science Foundation of Heilongjiang Province, grant number LH2021C089, and Heilongjiang Province Agricultural Science and Technology Innovation Project, grant number 2019JJPY012, 2020FJZX009.

Data Availability Statement

Upon reasonable request, the corresponding author will provide the data supporting the conclusions of the study.

Acknowledgments

We are grateful to LC Biotechnology Co., Ltd. for assisting in the sequencing and bioinformatics analysis.

Conflicts of Interest

The authors declare no conflict of interest.

References

  1. Zhu, J.-K. Abiotic Stress Signaling and Responses in Plants. Cell 2016, 167, 313–324. [Google Scholar] [CrossRef] [PubMed]
  2. Ren, R.; Wang, T.; Gao, L.; Song, P.; Yang, Y.; Zhi, H.; Li, K. Development of Comprehensive Serological Techniques for Sensitive, Quantitative and Rapid Detection of Soybean Mosaic Virus. Int. J. Mol. Sci. 2022, 23, 9457. [Google Scholar] [CrossRef] [PubMed]
  3. Kokubun, M.; Shimada, S.; Takahashi, M. Flower Abortion Caused by Preanthesis Water Deficit Is Not Attributed to Impairment of Pollen in Soybean. Crop. Sci. 2001, 41, 1517–1521. [Google Scholar] [CrossRef]
  4. Ranjan, A.; Jayaraman, D.; Grau, C.; Hill, J.H.; Whitham, S.A.; Ané, J.-M.; Smith, D.L.; Kabbage, M. The Pathogenic Development of Sclerotinia Sclerotiorum in Soybean Requires Specific Host NADPH Oxidases. Mol. Plant. Pathol. 2018, 19, 700–714. [Google Scholar] [CrossRef]
  5. Zhang, J.; Wu, Z.; Hu, F.; Liu, L.; Huang, X.; Zhao, J.; Wang, H. Aberrant Seed Development in Litchi Chinensis Is Associated with the Impaired Expression of Cell Wall Invertase Genes. Hortic. Res. 2018, 5, 39. [Google Scholar] [CrossRef]
  6. Xiong, H.; Wang, R.; Jia, X.; Sun, H.; Duan, R. Transcriptomic Analysis of Rapeseed (Brassica napus L.) Seed Development in Xiangride, Qinghai Plateau, Reveals How Its Special Eco-Environment Results in High Yield in High-Altitude Areas. Front. Plant. Sci. 2022, 13, 927418. [Google Scholar] [CrossRef]
  7. Farooq, M.; Gogoi, N.; Barthakur, S.; Baroowa, B.; Bharadwaj, N.; Alghamdi, S.S.; Siddique, K.H.M. Drought Stress in Grain Legumes during Reproduction and Grain Filling. J. Agro Crop. Sci. 2017, 203, 81–102. [Google Scholar] [CrossRef]
  8. Du, Y.; Zhao, Q.; Chen, L.; Yao, X.; Zhang, H.; Wu, J.; Xie, F. Effect of Drought Stress during Soybean R2-R6 Growth Stages on Sucrose Metabolism in Leaf and Seed. Int. J. Mol. Sci. 2020, 21, 618. [Google Scholar] [CrossRef]
  9. Kumari, S.; nee Sabharwal, V.P.; Kushwaha, H.R.; Sopory, S.K.; Singla-Pareek, S.L.; Pareek, A. Transcriptome Map for Seedling Stage Specific Salinity Stress Response Indicates a Specific Set of Genes as Candidate for Saline Tolerance in Oryza sativa L. Funct. Integr. Genomics 2009, 9, 109–123. [Google Scholar] [CrossRef]
  10. Shan, X.; Li, Y.; Jiang, Y.; Jiang, Z.; Hao, W.; Yuan, Y. Transcriptome Profile Analysis of Maize Seedlings in Response to High-Salinity, Drought and Cold Stresses by Deep Sequencing. Plant. Mol. Biol. Rep. 2013, 31, 1485–1491. [Google Scholar] [CrossRef]
  11. Waititu, J.K.; Cai, Q.; Sun, Y.; Sun, Y.; Li, C.; Zhang, C.; Liu, J.; Wang, H. Transcriptome Profiling of Maize (Zea mays L.) Leaves Reveals Key Cold-Responsive Genes, Transcription Factors, and Metabolic Pathways Regulating Cold Stress Tolerance at the Seedling Stage. Genes 2021, 12, 1638. [Google Scholar] [CrossRef]
  12. Conti, V.; Cantini, C.; Romi, M.; Cesare, M.M.; Parrotta, L.; Del Duca, S.; Cai, G. Distinct Tomato Cultivars Are Characterized by a Differential Pattern of Biochemical Responses to Drought Stress. Int. J. Mol. Sci. 2022, 23, 5412. [Google Scholar] [CrossRef]
  13. Ali, F.; Bano, A.; Fazal, A. Recent Methods of Drought Stress Tolerance in Plants. Plant. Growth Regul. 2017, 82, 363–375. [Google Scholar] [CrossRef]
  14. Kosová, K.; Vítámvás, P.; Prášil, I.T. Wheat and Barley Dehydrins under Cold, Drought, and Salinity—What Can LEA-II Proteins Tell Us about Plant Stress Response? Front. Plant. Sci. 2014, 5, 343. [Google Scholar] [CrossRef]
  15. Vihervaara, A.; Duarte, F.M.; Lis, J.T. Molecular Mechanisms Driving Transcriptional Stress Responses. Nat. Rev. Genet. 2018, 19, 385–397. [Google Scholar] [CrossRef]
  16. Garrigues, J.M.; Tsu, B.V.; Daugherty, M.D.; Pasquinelli, A.E. Diversification of the Caenorhabditis Heat Shock Response by Helitron Transposable Elements. eLife 2019, 8, e51139. [Google Scholar] [CrossRef]
  17. Li, W.; Wang, Y.; Li, R.; Chang, X.; Yuan, X.; Jing, R. Cloning and Characterization of TaSAP7-A, a Member of the Stress-Associated Protein Family in Common Wheat. Front. Plant. Sci. 2021, 12, 609351. [Google Scholar] [CrossRef]
  18. Hegde, P.S.; White, I.R.; Debouck, C. Interplay of Transcriptomics and Proteomics. Curr. Opin. Biotechnol. 2003, 14, 647–651. [Google Scholar] [CrossRef]
  19. Du, J.; Wang, S.; He, C.; Zhou, B.; Ruan, Y.-L.; Shou, H. Identification of Regulatory Networks and Hub Genes Controlling Soybean Seed Set and Size Using RNA Sequencing Analysis. J. Exp. Bot. 2017, 68, 1955–1972. [Google Scholar] [CrossRef]
  20. Zhang, X.; Feng, C.; Wang, M.; Li, T.; Liu, X.; Jiang, J. Plasma Membrane-Localized SlSWEET7a and SlSWEET14 Regulate Sugar Transport and Storage in Tomato Fruits. Hortic. Res. 2021, 8, 186. [Google Scholar] [CrossRef]
  21. Xuan, H.; Huang, Y.; Zhou, L.; Deng, S.; Wang, C.; Xu, J.; Wang, H.; Zhao, J.; Guo, N.; Xing, H. Key Soybean Seedlings Drought-Responsive Genes and Pathways Revealed by Comparative Transcriptome Analyses of Two Cultivars. Int. J. Mol. Sci. 2022, 23, 2893. [Google Scholar] [CrossRef]
  22. Prince, S.J.; Joshi, T.; Mutava, R.N.; Syed, N.; Joao Vitor, M.D.S.; Patil, G.; Song, L.; Wang, J.; Lin, L.; Chen, W.; et al. Comparative Analysis of the Drought-Responsive Transcriptome in Soybean Lines Contrasting for Canopy Wilting. Plant. Sci. 2015, 240, 65–78. [Google Scholar] [CrossRef] [PubMed]
  23. Shahriari, A.G.; Soltani, Z.; Tahmasebi, A.; Poczai, P. Integrative System Biology Analysis of Transcriptomic Responses to Drought Stress in Soybean (Glycine max L.). Genes 2022, 13, 1732. [Google Scholar] [CrossRef] [PubMed]
  24. Li, M.; Li, H.; Sun, A.; Wang, L.; Ren, C.; Liu, J.; Gao, X. Transcriptome Analysis Reveals Key Drought-Stress-Responsive Genes in Soybean. Front. Genet. 2022, 13, 1060529. [Google Scholar] [CrossRef] [PubMed]
  25. Sharma, S.; Vengavasi, K.; Kumar, M.N.; Yadav, S.K.; Pandey, R. Expression of Potential Reference Genes in Response to Macronutrient Stress in Rice and Soybean. Gene 2021, 792, 145742. [Google Scholar] [CrossRef] [PubMed]
  26. Livak, K.J.; Schmittgen, T.D. Analysis of Relative Gene Expression Data Using Real-Time Quantitative PCR and the 2(-Delta Delta C(T)) Method. Methods 2001, 25, 402–408. [Google Scholar] [CrossRef] [PubMed]
  27. Sazegari, S.; Niazi, A.; Ahmadi, F.S. A Study on the Regulatory Network with Promoter Analysis for Arabidopsis DREB-Genes. Bioinformation 2015, 11, 101–106. [Google Scholar] [CrossRef]
  28. Andrási, N.; Pettkó-Szandtner, A.; Szabados, L. Diversity of Plant Heat Shock Factors: Regulation, Interactions, and Functions. J. Exp. Bot. 2021, 72, 1558–1575. [Google Scholar] [CrossRef]
  29. Coego, A.; Julian, J.; Lozano-Juste, J.; Pizzio, G.A.; Alrefaei, A.F.; Rodriguez, P.L. Ubiquitylation of ABA Receptors and Protein Phosphatase 2C Coreceptors to Modulate ABA Signaling and Stress Response. Int. J. Mol. Sci. 2021, 22, 7103. [Google Scholar] [CrossRef]
  30. Szabados, L.; Savouré, A. Proline: A Multifunctional Amino Acid. Trends Plant. Sci. 2010, 15, 89–97. [Google Scholar] [CrossRef]
  31. Magwanga, R.O.; Lu, P.; Kirungu, J.N.; Lu, H.; Wang, X.; Cai, X.; Zhou, Z.; Zhang, Z.; Salih, H.; Wang, K.; et al. Characterization of the Late Embryogenesis Abundant (LEA) Proteins Family and Their Role in Drought Stress Tolerance in Upland Cotton. BMC Genet. 2018, 19, 6. [Google Scholar] [CrossRef]
  32. Jung, C.; Nguyen, N.H.; Cheong, J.-J. Transcriptional Regulation of Protein Phosphatase 2C Genes to Modulate Abscisic Acid Signaling. Int. J. Mol. Sci. 2020, 21, 9517. [Google Scholar] [CrossRef]
  33. Lenk, I.; Fisher, L.H.C.; Vickers, M.; Akinyemi, A.; Didion, T.; Swain, M.; Jensen, C.S.; Mur, L.A.J.; Bosch, M. Transcriptional and Metabolomic Analyses Indicate That Cell Wall Properties Are Associated with Drought Tolerance in Brachypodium Distachyon. Int. J. Mol. Sci. 2019, 20, 1758. [Google Scholar] [CrossRef]
  34. Jangam, A.P.; Pathak, R.R.; Raghuram, N. Microarray Analysis of Rice D1 (RGA1) Mutant Reveals the Potential Role of G-Protein Alpha Subunit in Regulating Multiple Abiotic Stresses Such as Drought, Salinity, Heat, and Cold. Front. Plant. Sci. 2016, 7, 11. [Google Scholar] [CrossRef]
  35. Oztur, Z.N.; Talamé, V.; Deyholos, M.; Michalowski, C.B.; Galbraith, D.W.; Gozukirmizi, N.; Tuberosa, R.; Bohnert, H.J. Monitoring Large-Scale Changes in Transcript Abundance in Drought- and Salt-Stressed Barley. Plant. Mol. Biol. 2002, 48, 551–573. [Google Scholar] [CrossRef]
  36. Hazen, S.P.; Pathan, M.S.; Sanchez, A.; Baxter, I.; Dunn, M.; Estes, B.; Chang, H.-S.; Zhu, T.; Kreps, J.A.; Nguyen, H.T. Expression Profiling of Rice Segregating for Drought Tolerance QTLs Using a Rice Genome Array. Funct. Integr. Genomics 2005, 5, 104–116. [Google Scholar] [CrossRef]
  37. Guo, P.; Baum, M.; Grando, S.; Ceccarelli, S.; Bai, G.; Li, R.; von Korff, M.; Varshney, R.K.; Graner, A.; Valkoun, J. Differentially Expressed Genes between Drought-Tolerant and Drought-Sensitive Barley Genotypes in Response to Drought Stress during the Reproductive Stage. J. Exp. Bot. 2009, 60, 3531–3544. [Google Scholar] [CrossRef]
  38. Li, P.; Lin, P.; Zhao, Z.; Li, Z.; Liu, Y.; Huang, C.; Huang, G.; Xu, L.; Deng, Z.; Zhang, Y.; et al. Gene Co-Expression Analysis Reveals Transcriptome Divergence between Wild and Cultivated Sugarcane under Drought Stress. Int. J. Mol. Sci. 2022, 23, 569. [Google Scholar] [CrossRef]
  39. Opdenakker, K.; Remans, T.; Vangronsveld, J.; Cuypers, A. Mitogen-Activated Protein (MAP) Kinases in Plant Metal Stress: Regulation and Responses in Comparison to Other Biotic and Abiotic Stresses. Int. J. Mol. Sci. 2012, 13, 7828–7853. [Google Scholar] [CrossRef]
  40. Mathesius, U. Flavonoids Induced in Cells Undergoing Nodule Organogenesis in White Clover Are Regulators of Auxin Breakdown by Peroxidase. J. Exp. Bot. 2001, 52, 419–426. [Google Scholar] [CrossRef]
  41. Sharma, A.; Shahzad, B.; Rehman, A.; Bhardwaj, R.; Landi, M.; Zheng, B. Response of Phenylpropanoid Pathway and the Role of Polyphenols in Plants under Abiotic Stress. Molecules 2019, 24, 2452. [Google Scholar] [CrossRef] [PubMed]
  42. Cavaiuolo, M.; Cocetta, G.; Ferrante, A. The Antioxidants Changes in Ornamental Flowers during Development and Senescence. Antioxidants 2013, 2, 132–155. [Google Scholar] [CrossRef] [PubMed]
  43. Liu, W.; Feng, Y.; Yu, S.; Fan, Z.; Li, X.; Li, J.; Yin, H. The Flavonoid Biosynthesis Network in Plants. Int. J. Mol. Sci. 2021, 22, 12824. [Google Scholar] [CrossRef] [PubMed]
  44. Guo, X.; Peng, C.; Li, T.; Huang, J.; Song, H.; Zhu, Q.; Wang, M. The Effects of Drought and Re-Watering on Non-Structural Carbohydrates of Pinus Tabulaeformis Seedlings. Biology 2021, 10, 281. [Google Scholar] [CrossRef]
  45. Kannenberg, S.A.; Phillips, R.P. Non-Structural Carbohydrate Pools Not Linked to Hydraulic Strategies or Carbon Supply in Tree Saplings during Severe Drought and Subsequent Recovery. Tree Physiol. 2020, 40, 259–271. [Google Scholar] [CrossRef]
  46. Ruan, Y.-L.; Jin, Y.; Yang, Y.-J.; Li, G.-J.; Boyer, J.S. Sugar Input, Metabolism, and Signaling Mediated by Invertase: Roles in Development, Yield Potential, and Response to Drought and Heat. Mol. Plant. 2010, 3, 942–955. [Google Scholar] [CrossRef]
  47. Li, S.; Zachgo, S. TCP3 Interacts with R2R3-MYB Proteins, Promotes Flavonoid Biosynthesis and Negatively Regulates the Auxin Response in Arabidopsis Thaliana. Plant. J. 2013, 76, 901–913. [Google Scholar] [CrossRef]
  48. Feng, K.; Hou, X.-L.; Xing, G.-M.; Liu, J.-X.; Duan, A.-Q.; Xu, Z.-S.; Li, M.-Y.; Zhuang, J.; Xiong, A.-S. Advances in AP2/ERF Super-Family Transcription Factors in Plant. Crit. Rev. Biotechnol. 2020, 40, 750–776. [Google Scholar] [CrossRef]
  49. He, X.; Wang, T.; Zhu, W.; Wang, Y.; Zhu, L. GhHB12, a HD-ZIP I Transcription Factor, Negatively Regulates the Cotton Resistance to Verticillium Dahliae. Int. J. Mol. Sci. 2018, 19, 3997. [Google Scholar] [CrossRef]
  50. Wang, W.; Vinocur, B.; Altman, A. Plant Responses to Drought, Salinity and Extreme Temperatures: Towards Genetic Engineering for Stress Tolerance. Planta 2003, 218, 1–14. [Google Scholar] [CrossRef]
  51. Gong, Z.; Yang, S. Drought Meets SWEET. Nat. Plants 2022, 8, 25–26. [Google Scholar] [CrossRef]
  52. Bauwe, H.; Kolukisaoglu, U. Genetic Manipulation of Glycine Decarboxylation. J. Exp. Bot. 2003, 54, 1523–1535. [Google Scholar] [CrossRef]
  53. Diniz, A.L.; da Silva, D.I.R.; Lembke, C.G.; Costa, M.D.-B.L.; Ten-Caten, F.; Li, F.; Vilela, R.D.; Menossi, M.; Ware, D.; Endres, L.; et al. Amino Acid and Carbohydrate Metabolism Are Coordinated to Maintain Energetic Balance during Drought in Sugarcane. Int. J. Mol. Sci. 2020, 21, 9124. [Google Scholar] [CrossRef]
  54. Ye, Y.; Ding, Y.; Jiang, Q.; Wang, F.; Sun, J.; Zhu, C. The Role of Receptor-like Protein Kinases (RLKs) in Abiotic Stress Response in Plants. Plant. Cell. Rep. 2017, 36, 235–242. [Google Scholar] [CrossRef]
  55. Chen, F.; Fang, P.; Peng, Y.; Zeng, W.; Zhao, X.; Ding, Y.; Zhuang, Z.; Gao, Q.; Ren, B. Comparative Proteomics of Salt-Tolerant and Salt-Sensitive Maize Inbred Lines to Reveal the Molecular Mechanism of Salt Tolerance. Int. J. Mol. Sci. 2019, 20, 4725. [Google Scholar] [CrossRef]
  56. Zhang, Y.-X.; Xu, H.-H.; Liu, S.-J.; Li, N.; Wang, W.-Q.; Møller, I.M.; Song, S.-Q. Proteomic Analysis Reveals Different Involvement of Embryo and Endosperm Proteins during Aging of Yliangyou 2 Hybrid Rice Seeds. Front. Plant. Sci. 2016, 7, 1394. [Google Scholar] [CrossRef]
  57. Nahirñak, V.; Almasia, N.I.; Hopp, H.E.; Vazquez-Rovere, C. Snakin/GASA Proteins: Involvement in Hormone Crosstalk and Redox Homeostasis. Plant. Signal. Behav. 2012, 7, 1004–1008. [Google Scholar] [CrossRef]
  58. Kadam, N.N.; Tamilselvan, A.; Lawas, L.M.F.; Quinones, C.; Bahuguna, R.N.; Thomson, M.J.; Dingkuhn, M.; Muthurajan, R.; Struik, P.C.; Yin, X.; et al. Genetic Control of Plasticity in Root Morphology and Anatomy of Rice in Response to Water Deficit. Plant. Physiol. 2017, 174, 2302–2315. [Google Scholar] [CrossRef]
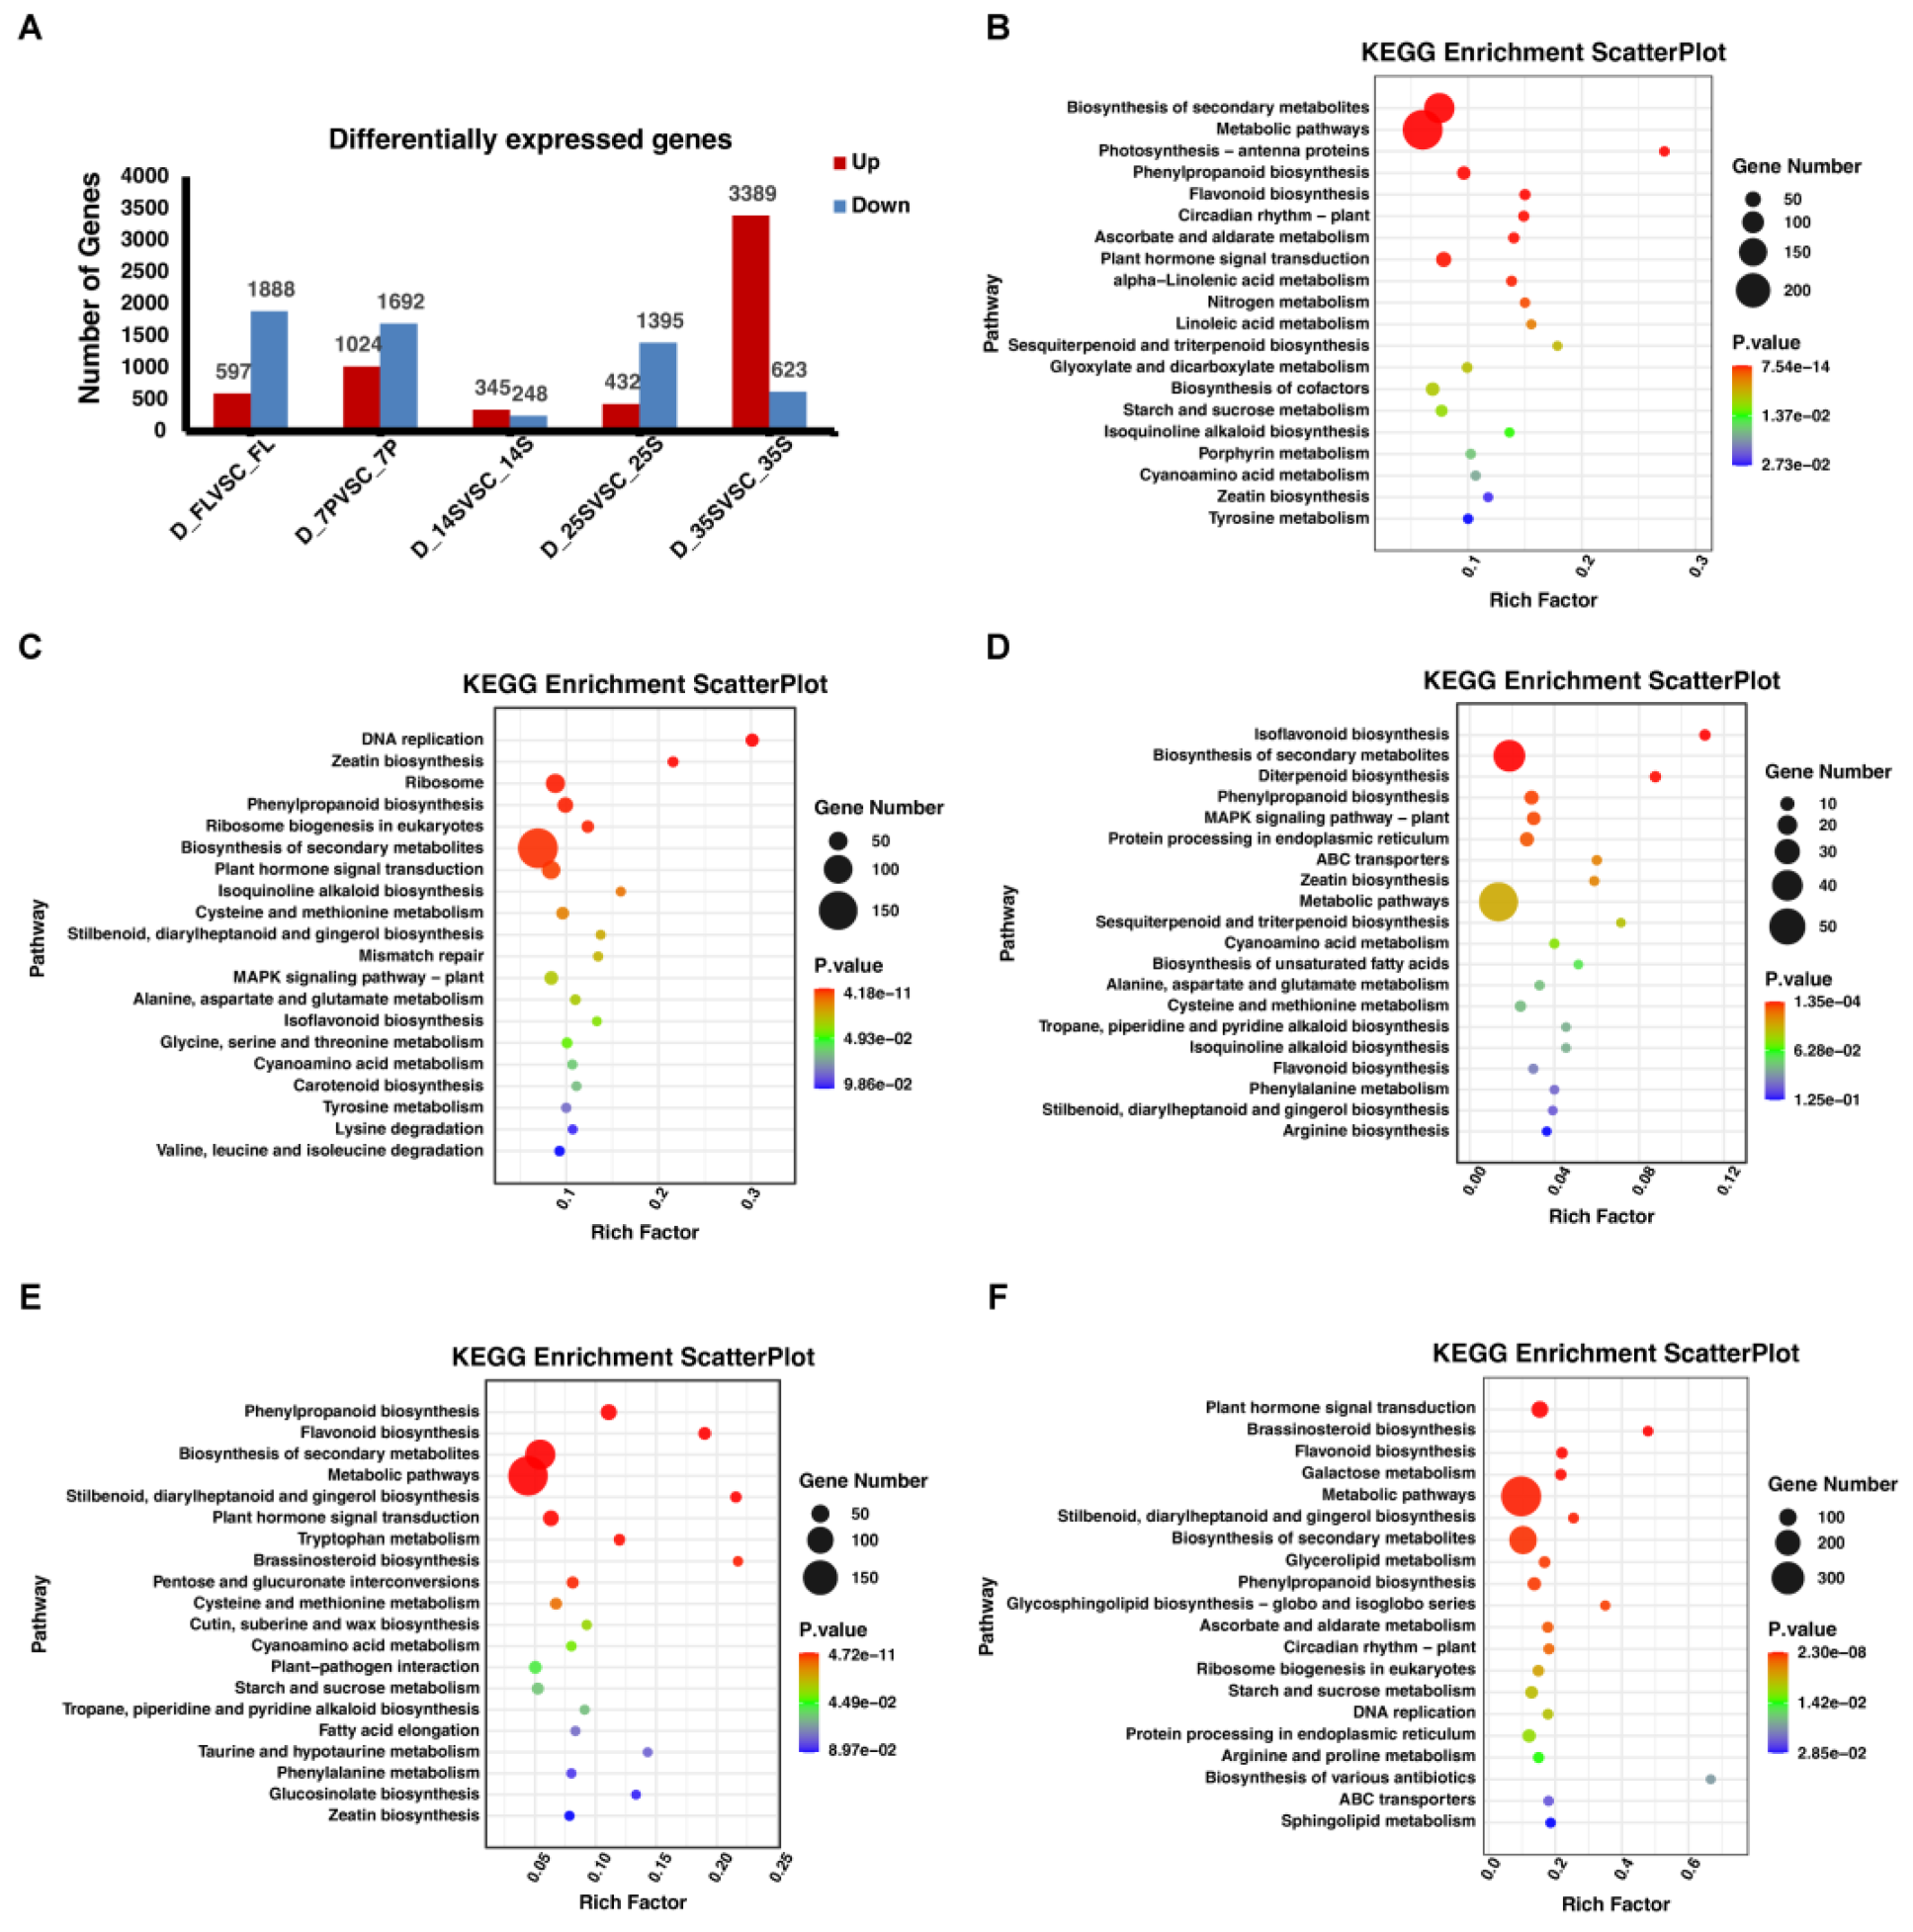
Figure 1. Differentially expressed genes and scatterplot of top 20 enriched KEGG pathways for DEGs in each pairwise comparison: (A) The number of differentially upregulated (red) and downregulated (blue) genes between control and drought stress conditions. (B) D_FL vs. C_FL. (C) D_7P vs. C_7P. (D) D_14S vs. C_14S. (E) D_25S vs. C_25S. (F) D_35S vs. C_35S. The enrichment factor is the ratio of the number of DEGs annotated with pathway entries to the number of genes annotated with all pathway entries.
Agriculture 13 00949 g001
Figure 2. Transcriptomic dissection of upregulated and downregulated genes in response to drought: (A) Venn diagram of unique and common upregulated DEGs in different stage comparisons. Venn diagram is represented in UpSet plot style. The resulting intersection subsets are named using letters. (B) Heatmap showing expression pattern of selected commonly upregulated DEGs in the three comparison groups. Gene expression data were normalized to Log2 (FPKM + 1); red and blue represent upregulated and downregulated genes, respectively. (C) Venn diagram of unique and common downregulated DEGs in different stage comparisons. Venn diagram is represented in UpSet plot style. The resulting intersection subsets are named using letters. (D) Heatmap showing expression pattern of selected commonly downregulated DEGs in the three comparison groups. Gene expression data were normalized to Log2 (FPKM + 1); red and blue represent upregulated and downregulated genes, respectively.
Agriculture 13 00949 g002
Figure 3. The GO and KEGG enrichment analysis of more than three selected DEGs that are commonly upregulated and downregulated: (A) The GO enrichment analysis. (B) The KEGG enrichment analysis.
Agriculture 13 00949 g003
Figure 4. Analysis of the volcano plot top 20 drought-responsive genes at different stages of soybean seed development: (AE) Volcano plot labeled with the top 20 DEGs at different stages of soybean seed development, upregulated genes (red) and downregulated genes (blue). Under is the heatmap of the top 20 genes. Heatmap showing the expression pattern of selected DEGs. Gene expression data were normalized to Log2 (FPKM + 1); red and blue represent upregulated and downregulated genes, respectively.
Agriculture 13 00949 g004
Figure 5. The GO and KEGG enrichment analysis of all the volcano plot top 20 DEGs at different stages of soybean seed development: (A) The GO enrichment analysis. (B) The KEGG enrichment analysis.
Agriculture 13 00949 g005
Figure 6. The relative expression of DEGs was determined by qRT-PCR at five seed developmental stages after drought stress: (AJ) Expression of 10 differentially expressed genes in response to drought stress treatment. Bars mean SD. * p < 0.05; ** p < 0.01.
Agriculture 13 00949 g006
Disclaimer/Publisher’s Note: The statements, opinions and data contained in all publications are solely those of the individual author(s) and contributor(s) and not of MDPI and/or the editor(s). MDPI and/or the editor(s) disclaim responsibility for any injury to people or property resulting from any ideas, methods, instructions or products referred to in the content.