

Study on the Drying Process and the Influencing Factors of Desiccation Cracking of Cohesive Soda Saline-Alkali Soil in the Songnen Plain, China


Abstract
1. Introduction
2. Materials and Methods
2.1. Study Area and Soil Sampling
2.2. Soil Property Measurements
2.3. Crack Scale Computation
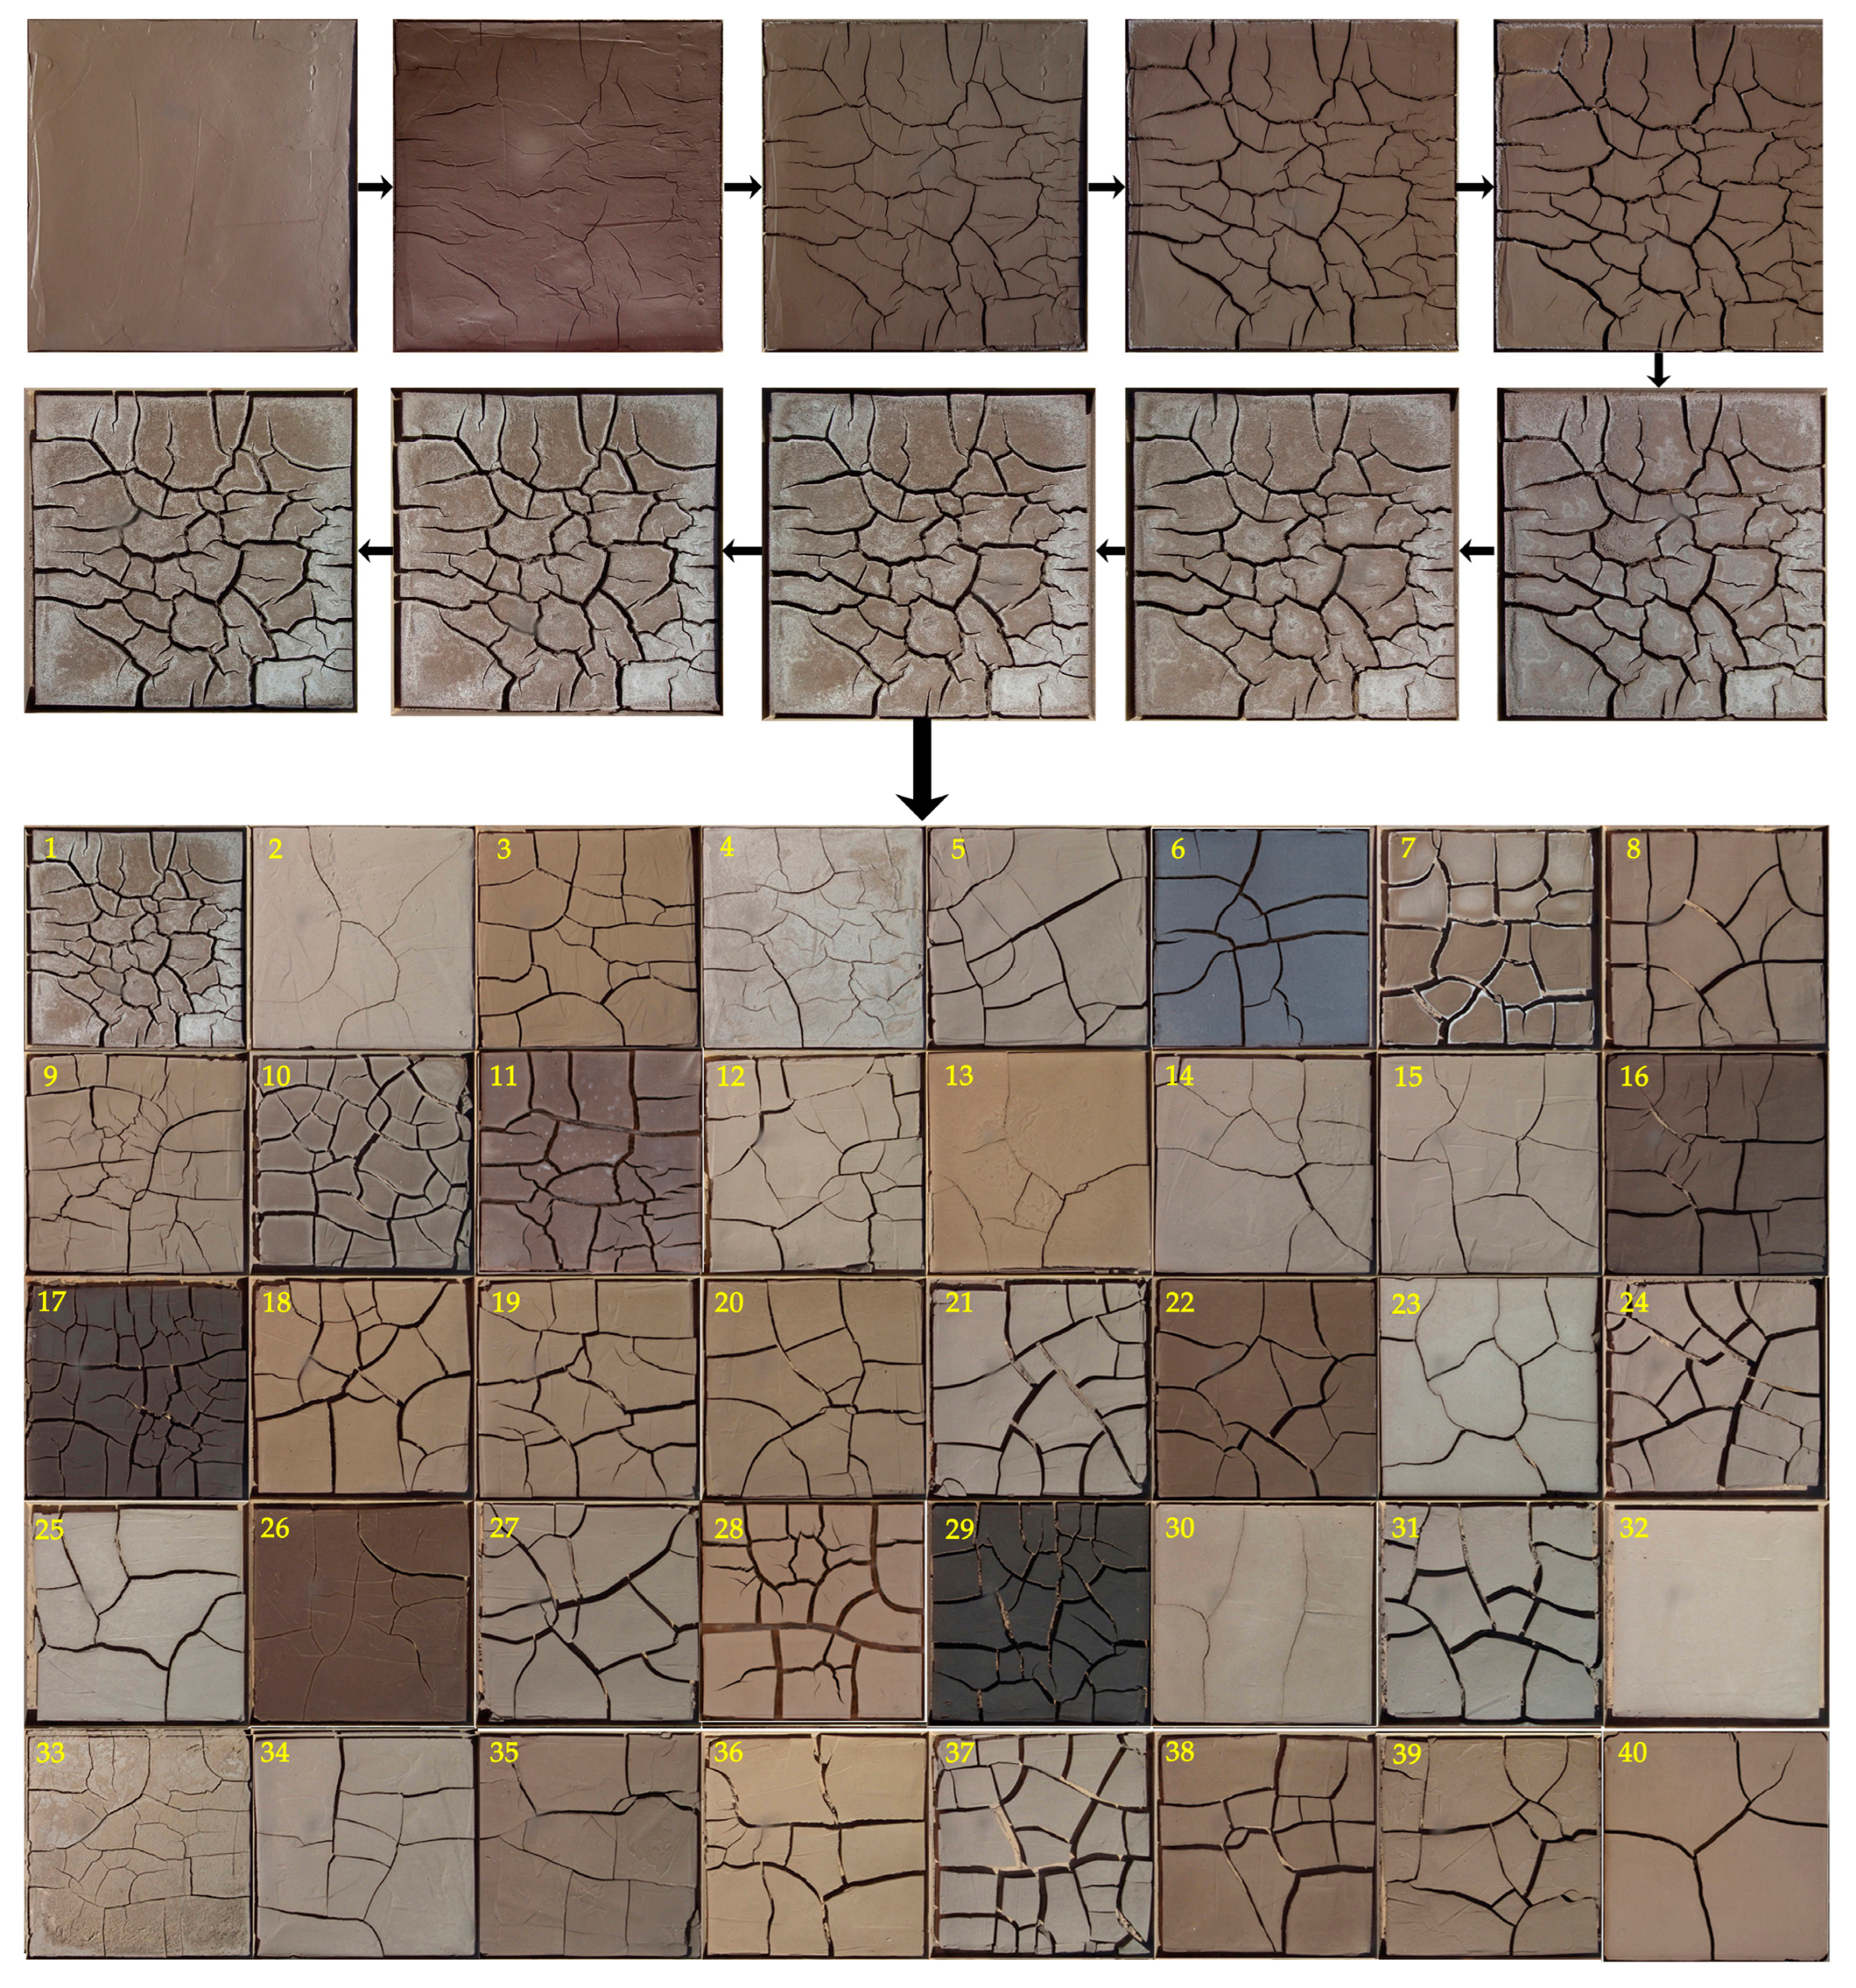
2.4. Desiccation Cracking Test
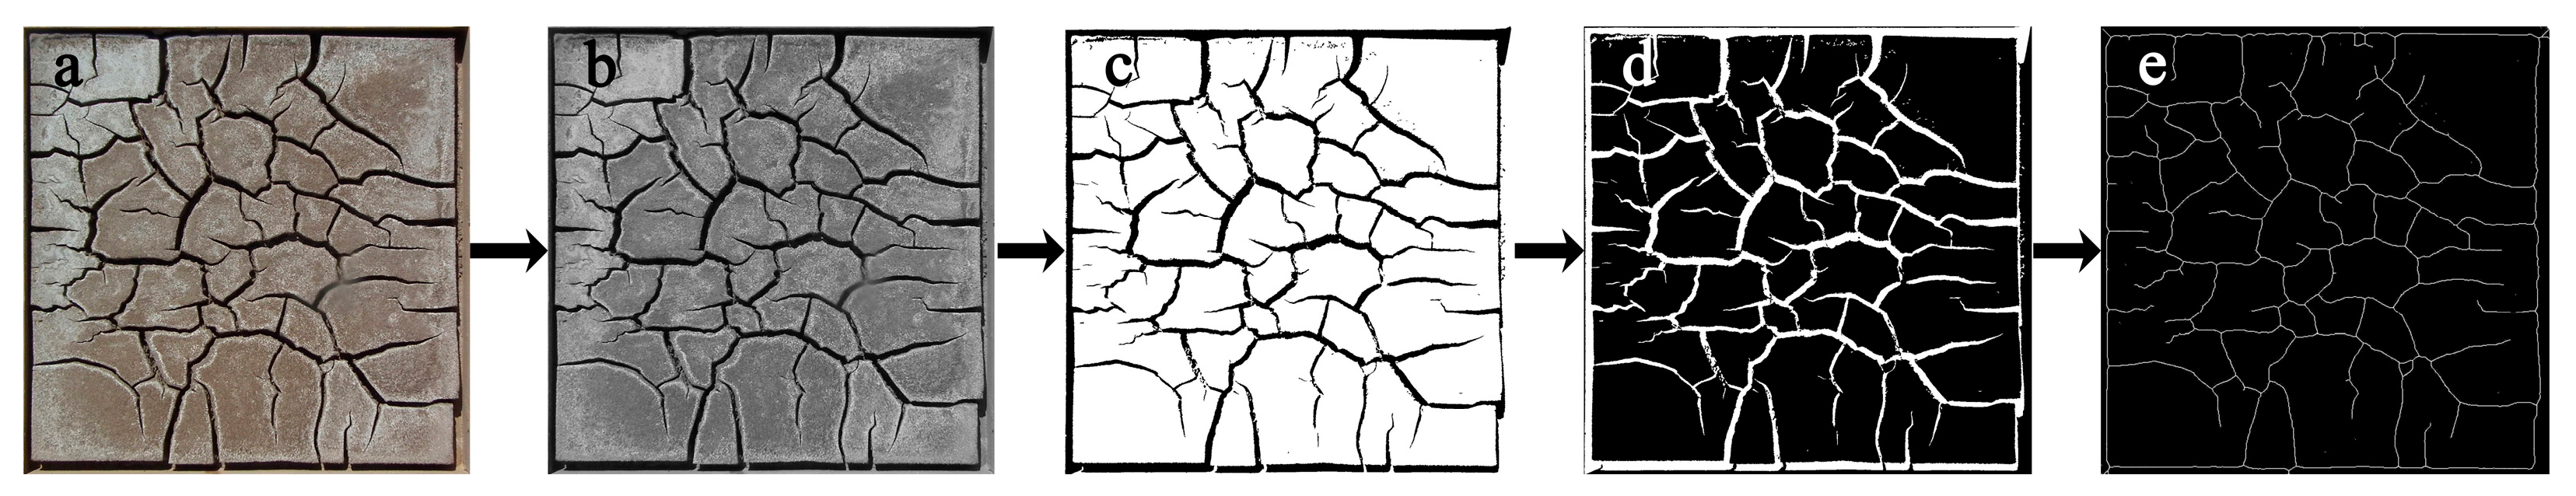
2.5. Crack Characteristics Extraction
2.5.1. Preprocessing of Crack Images
2.5.2. Geometric Parameter Extraction
2.5.3. Texture Feature Extraction
2.5.4. Fractal Dimension Extraction
2.6. Statistical Analysis
3. Results
3.1. Soil Properties
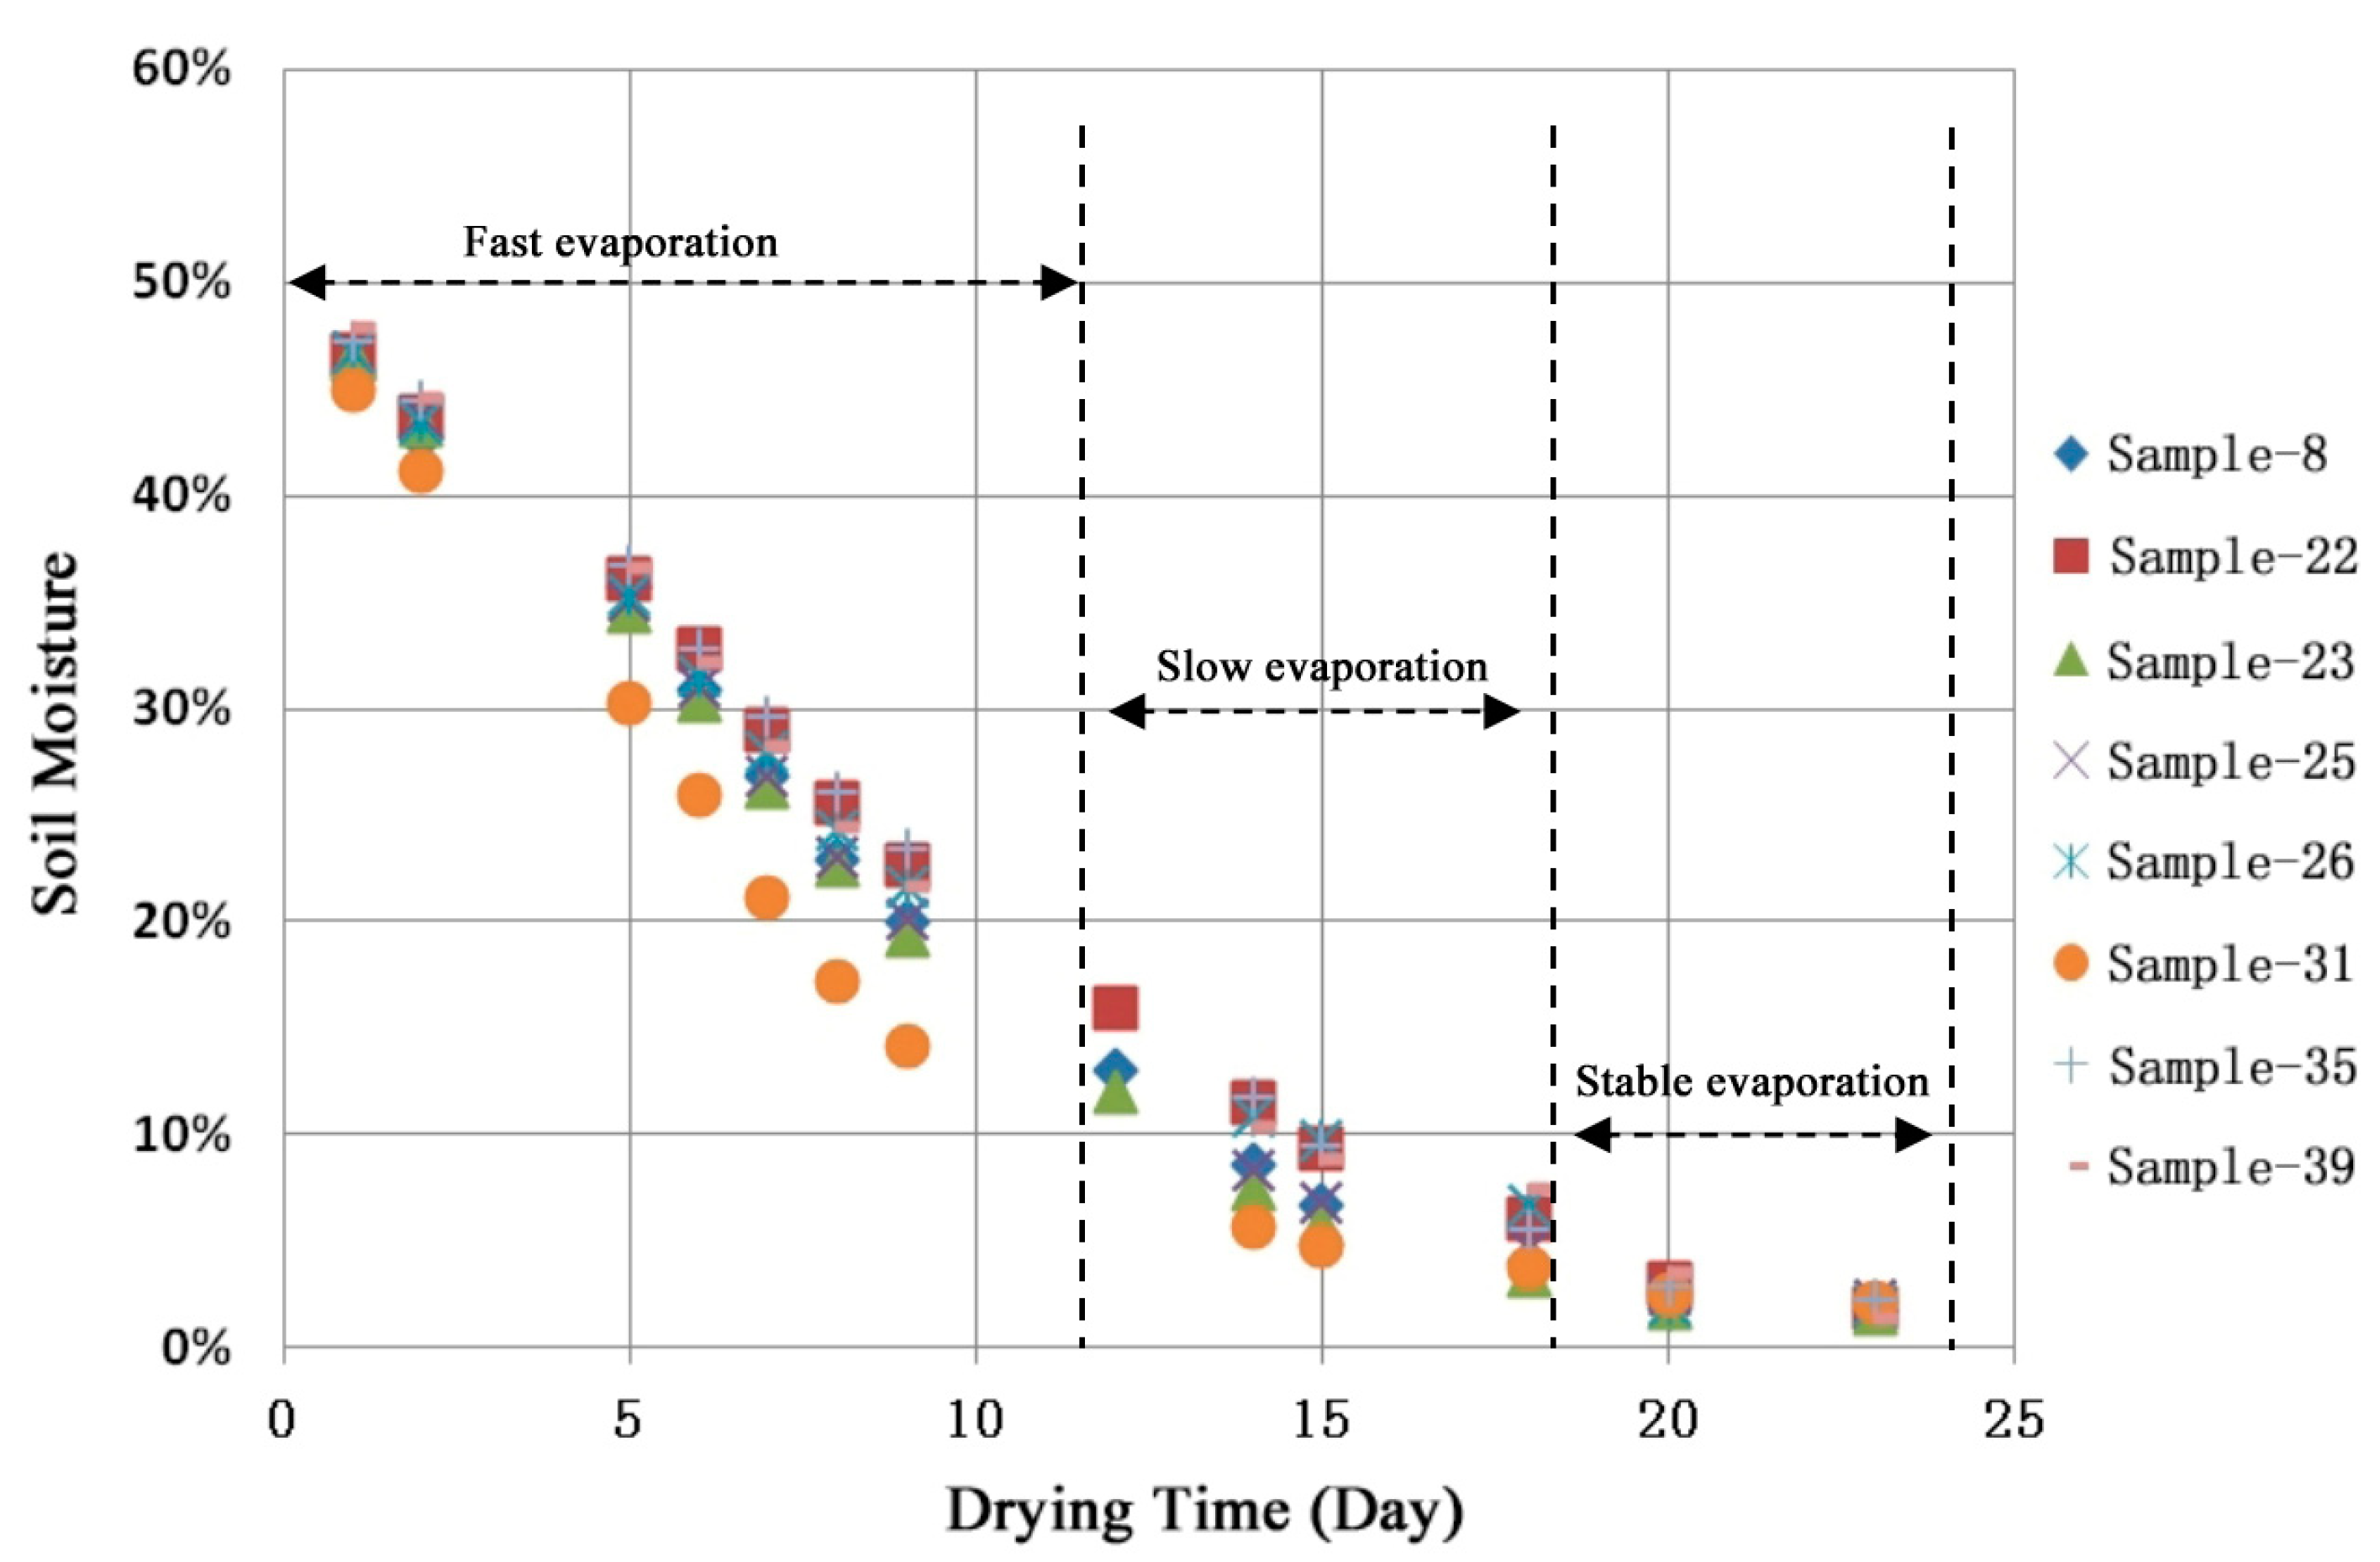
3.2. Dynamic Change of Soil Moisture
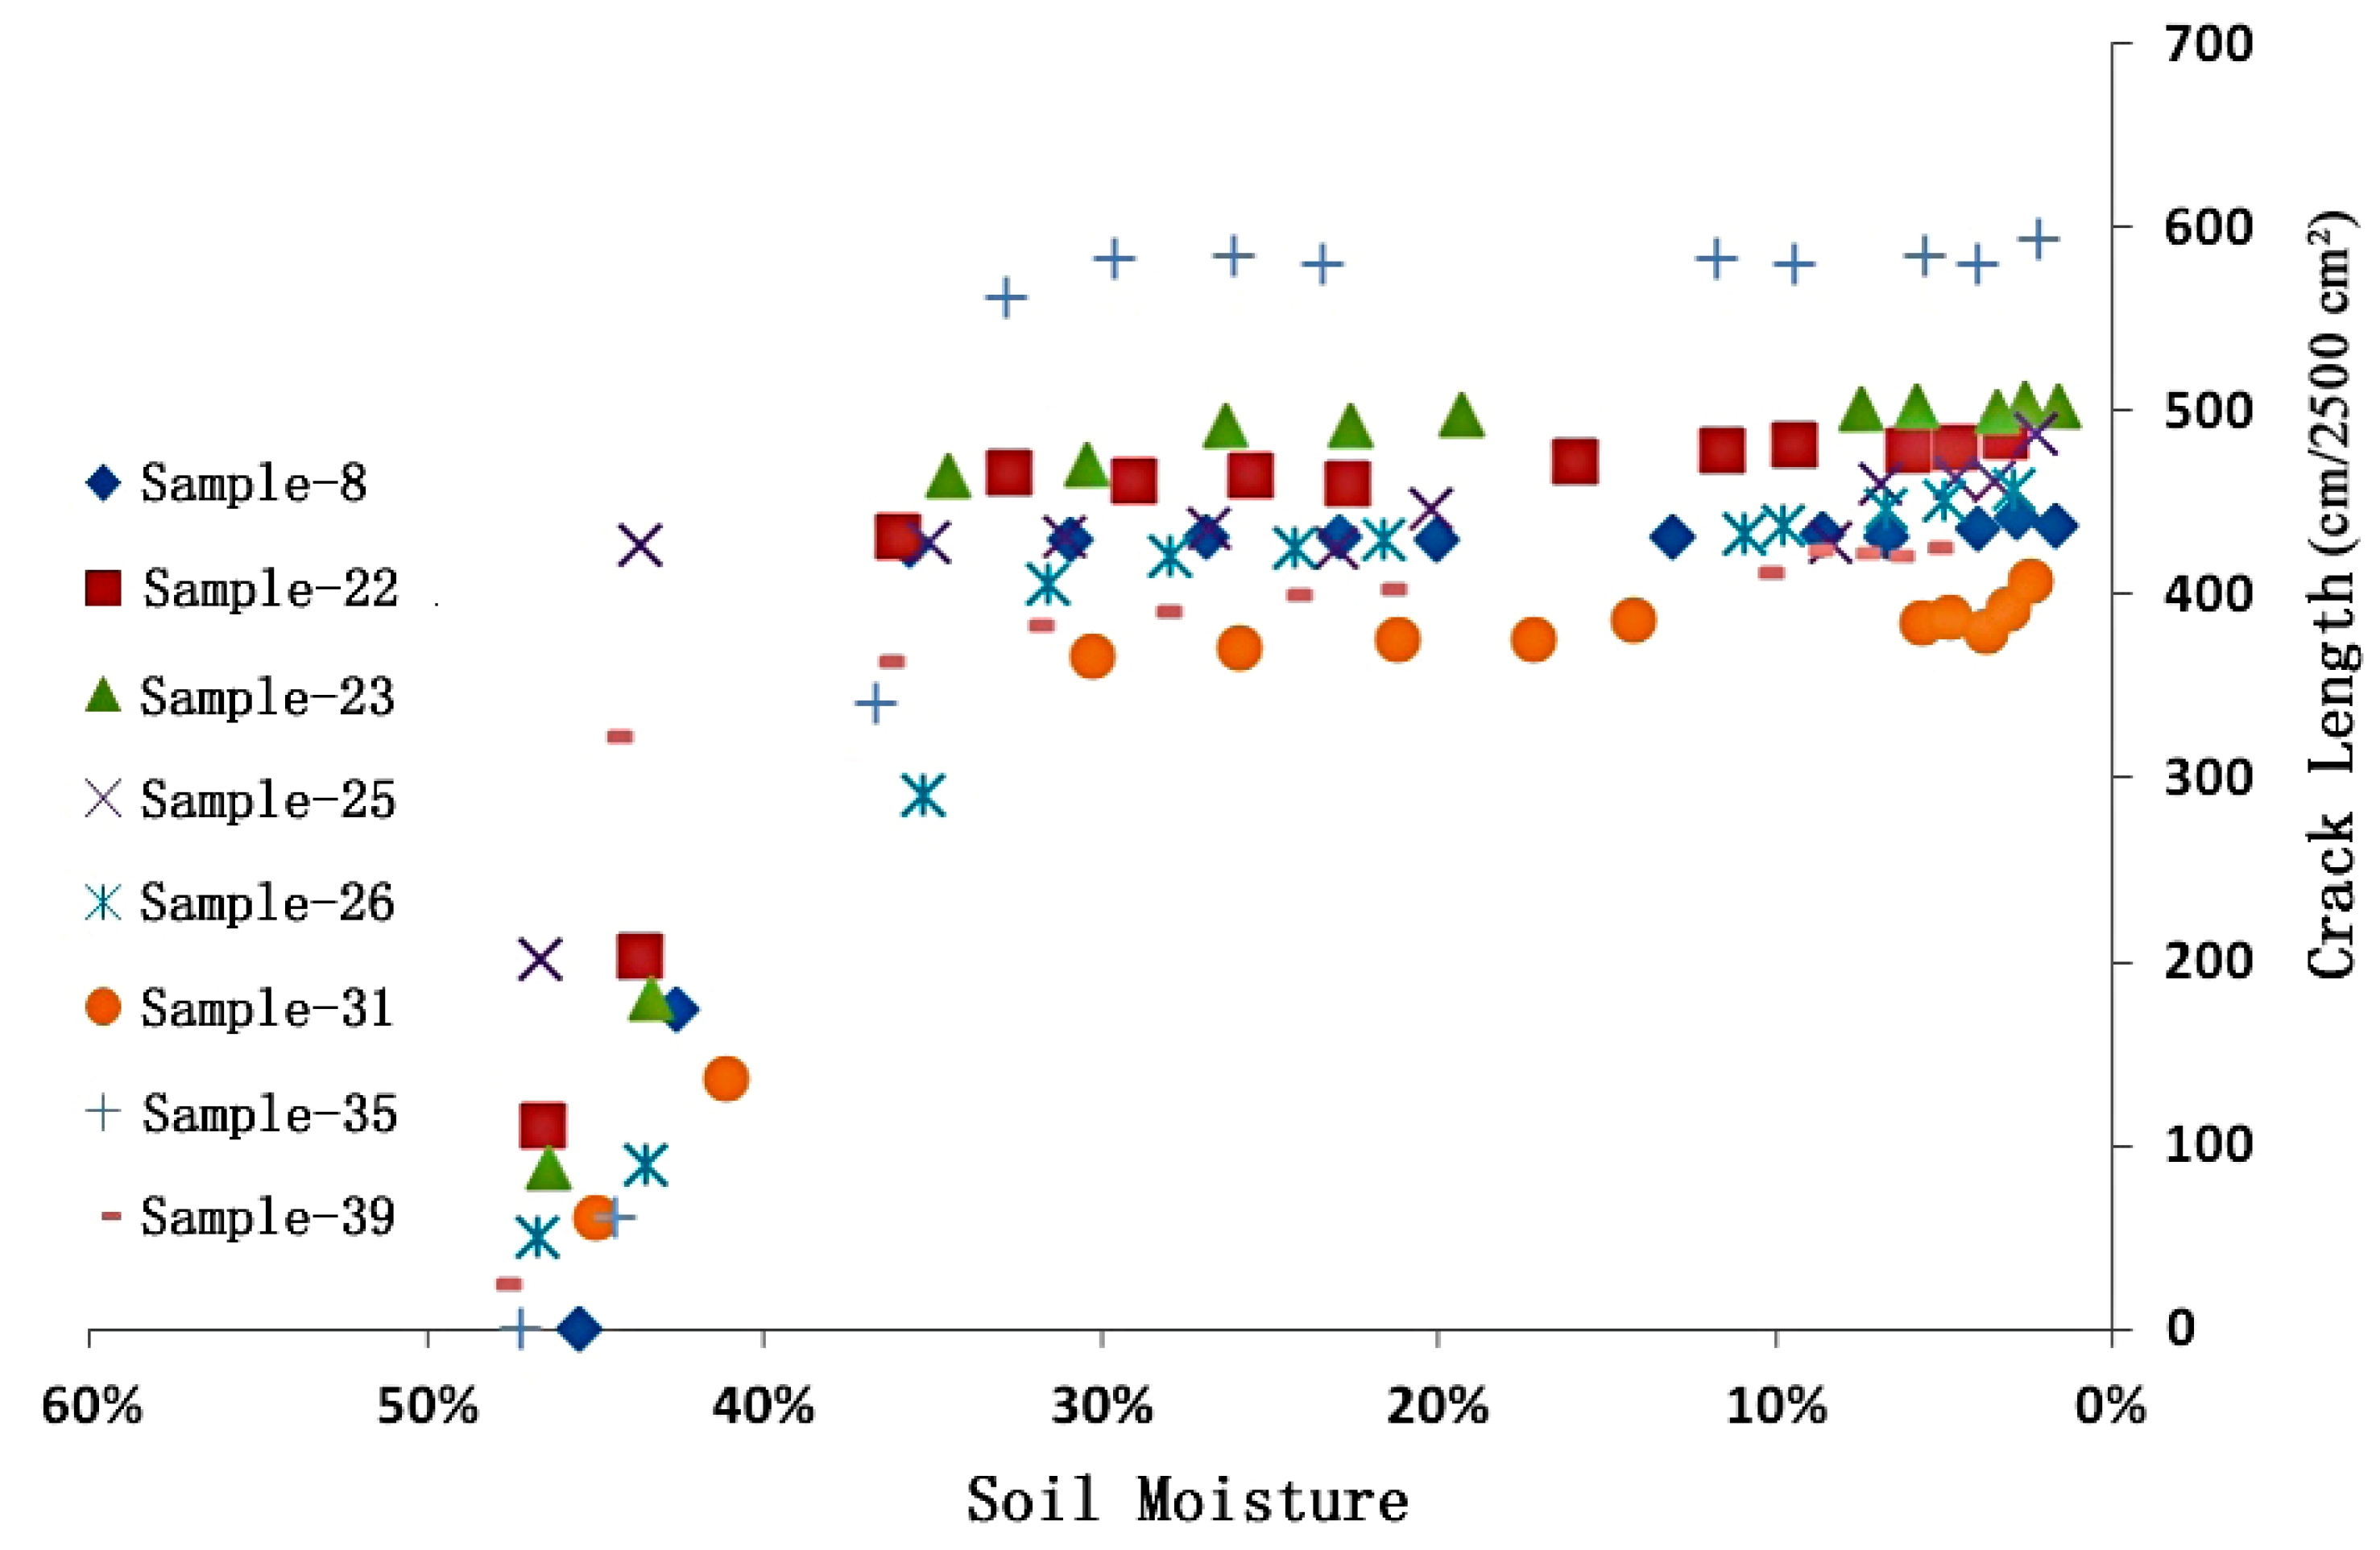
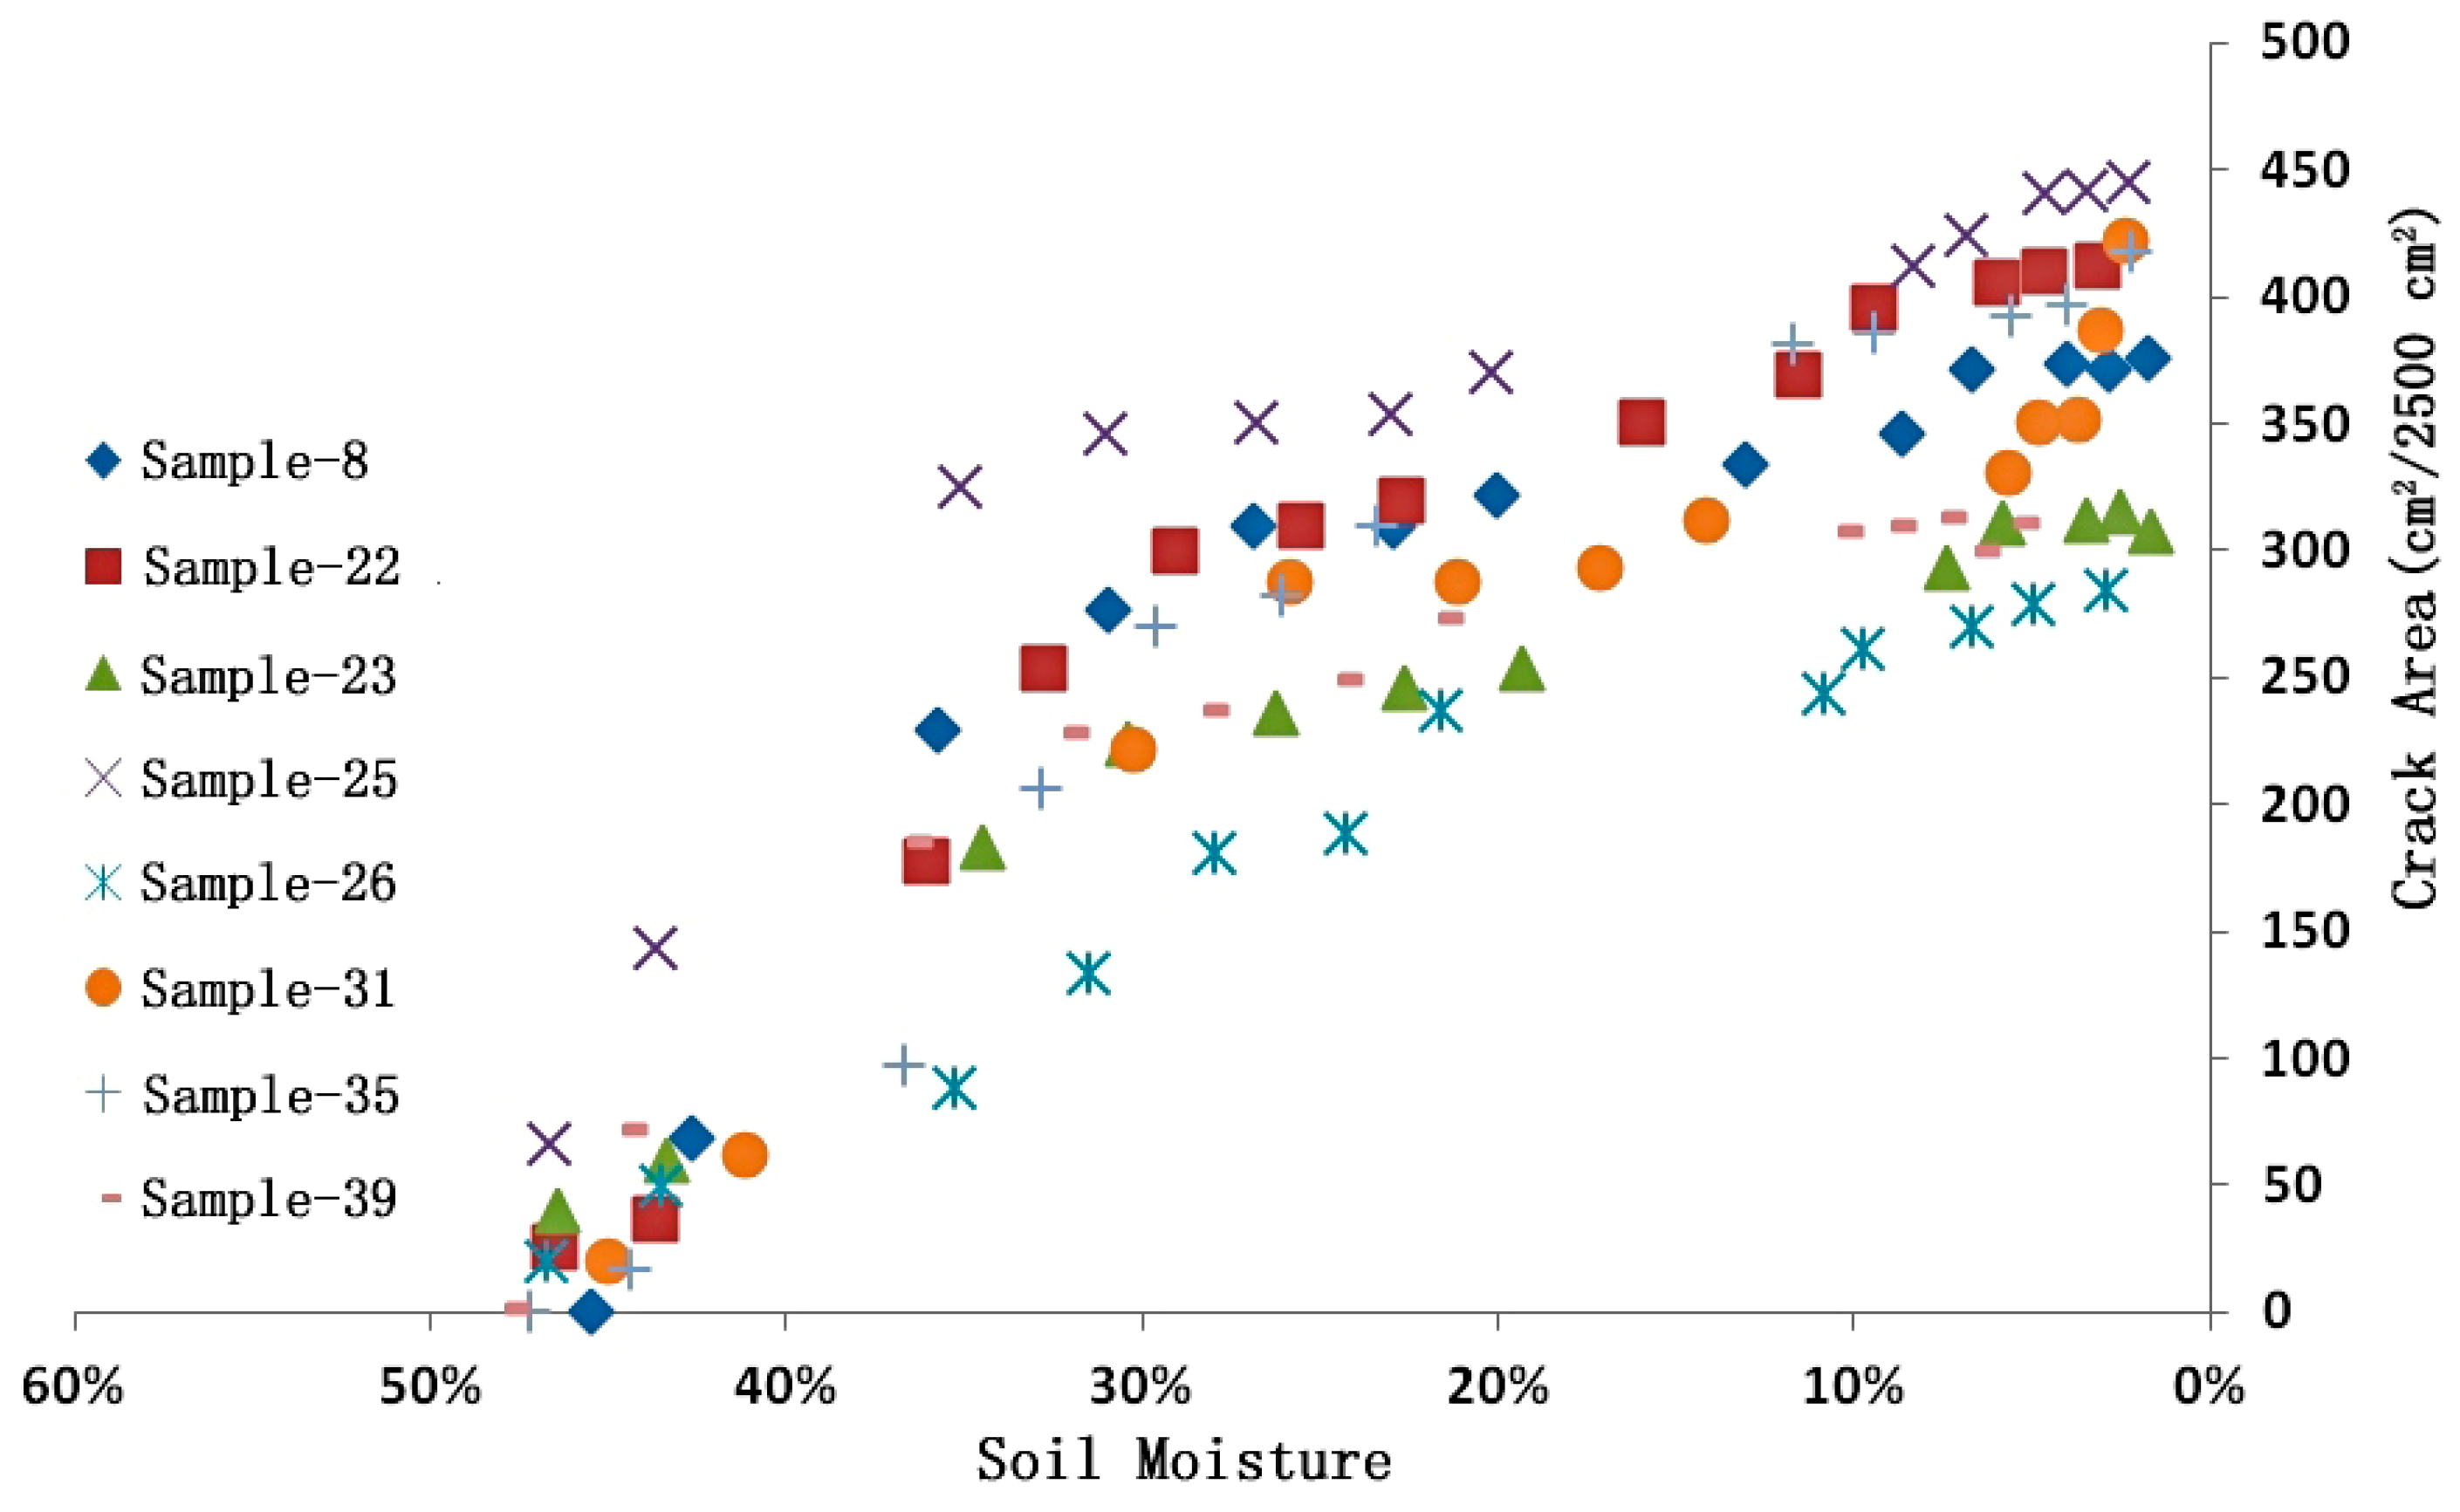
3.3. Dynamic Changes of Soil Cracks
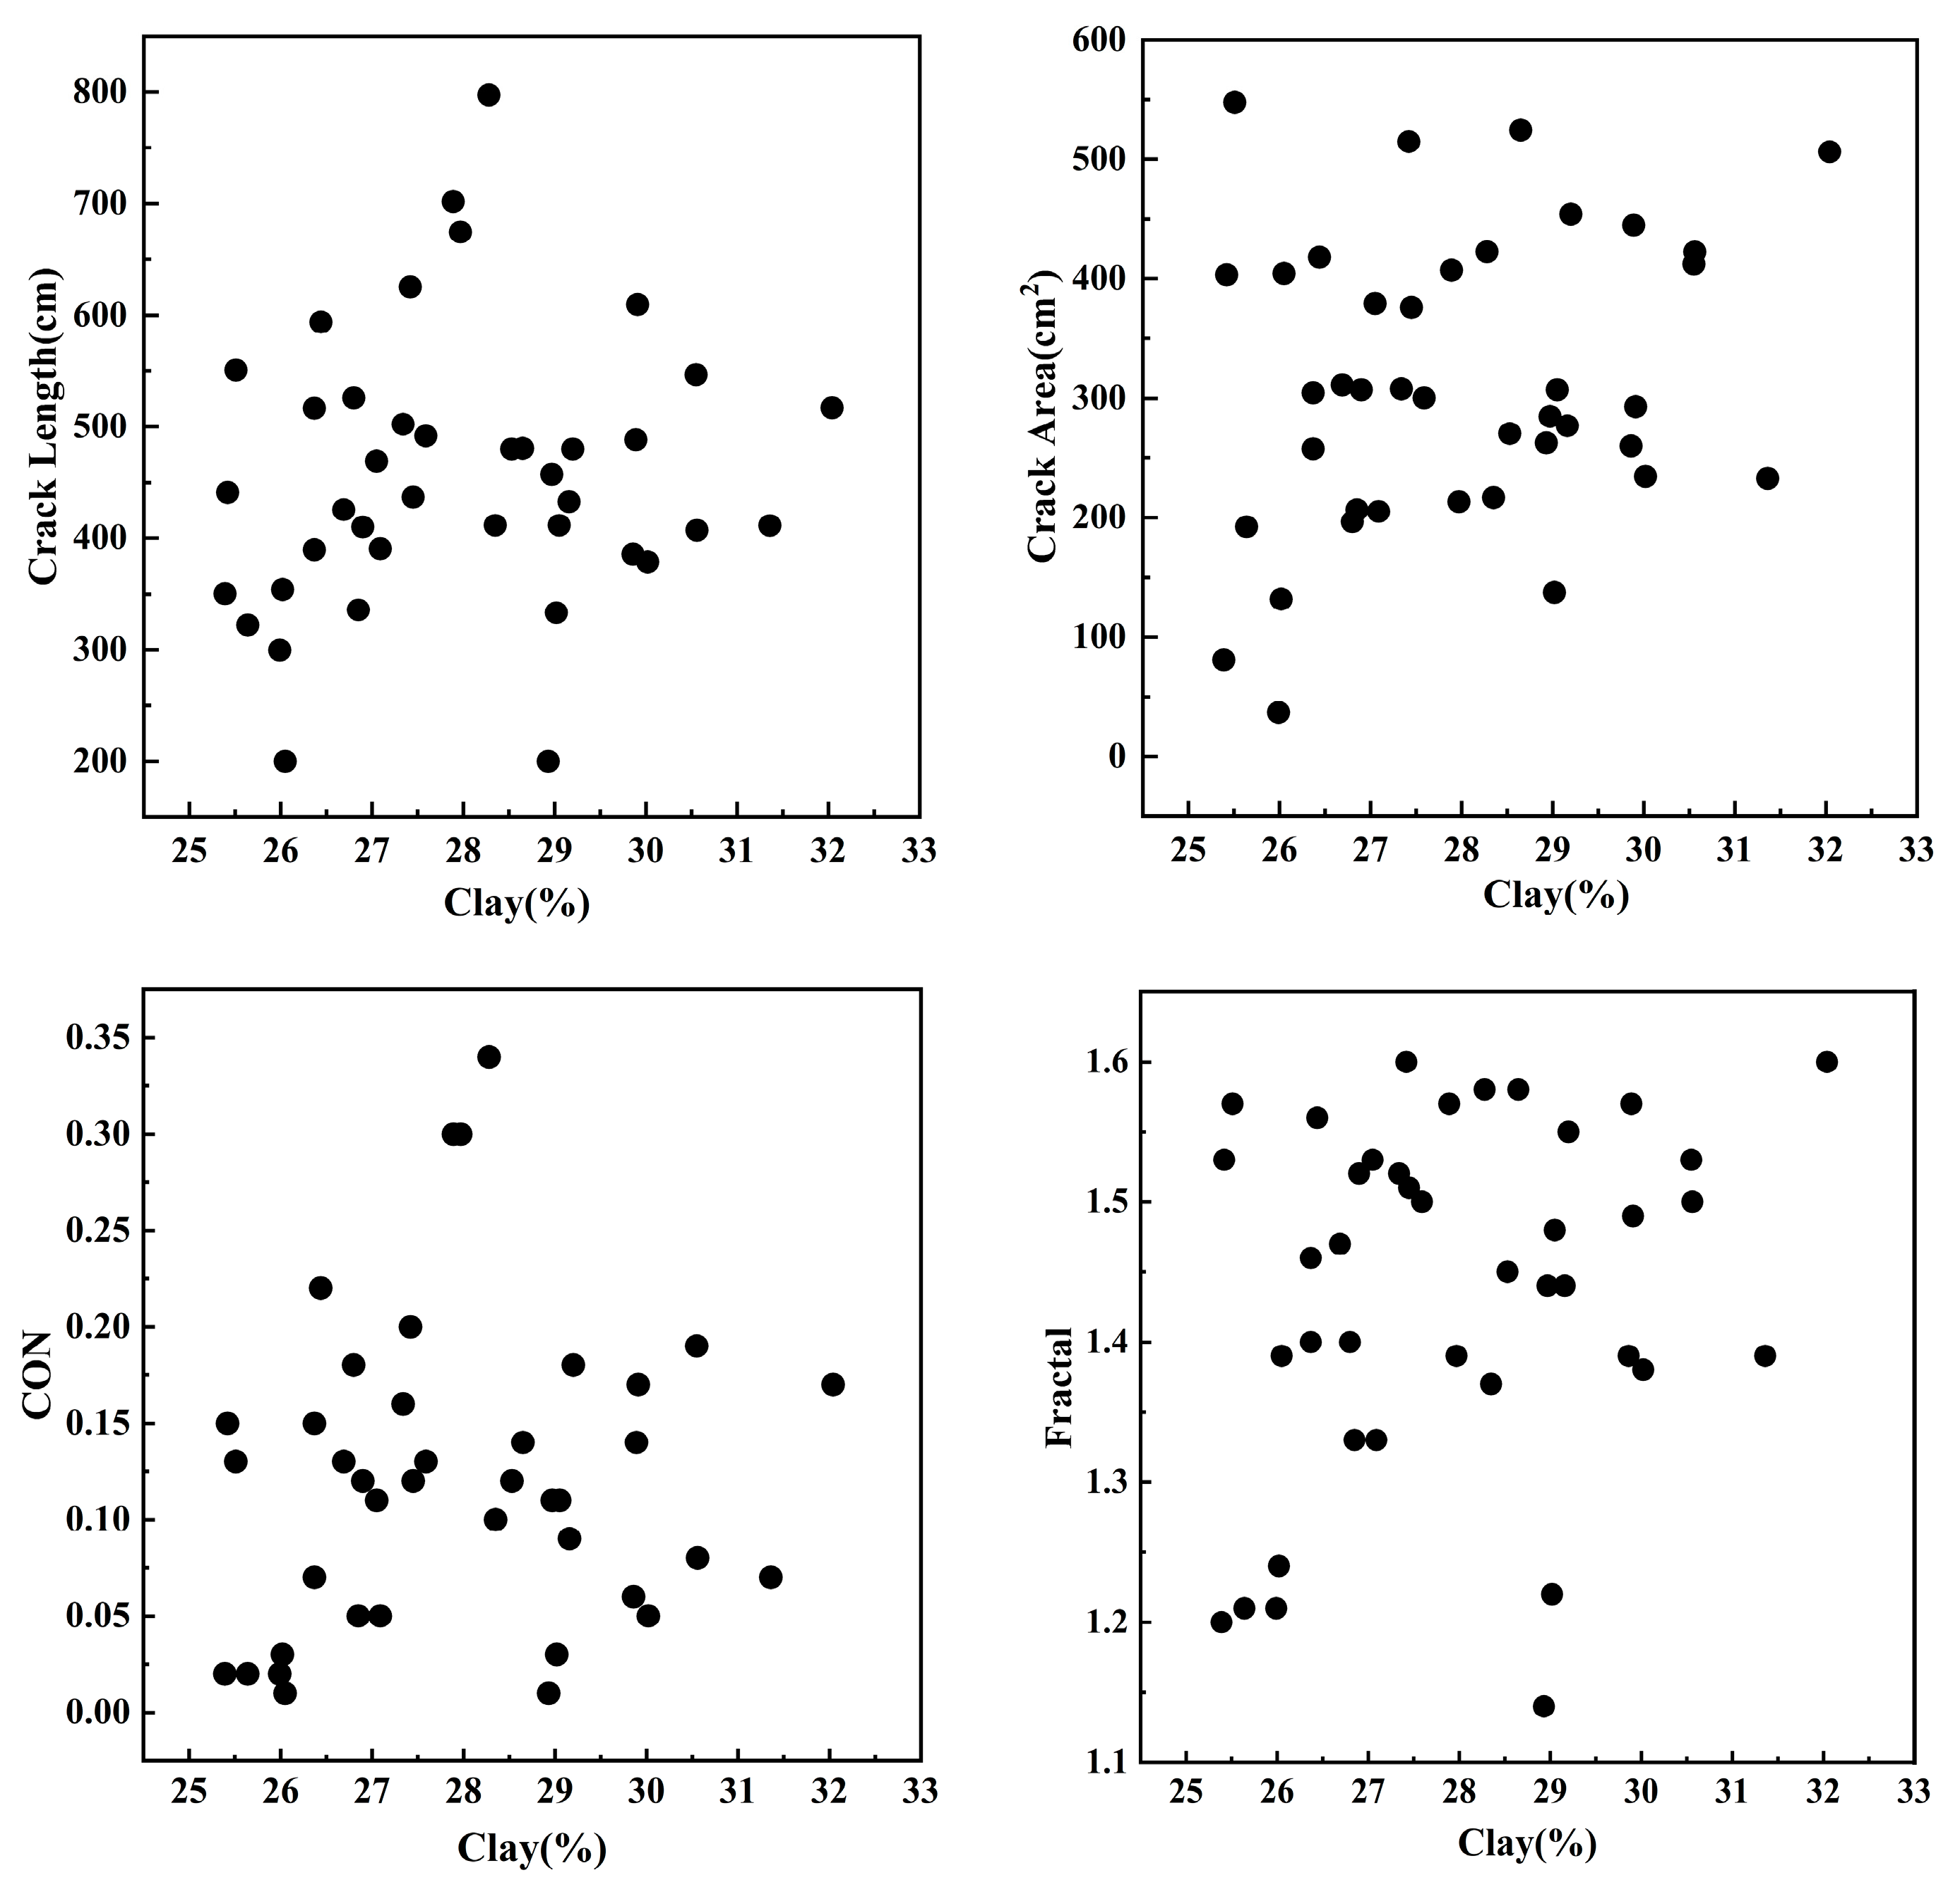
3.4. Crack Characteristics
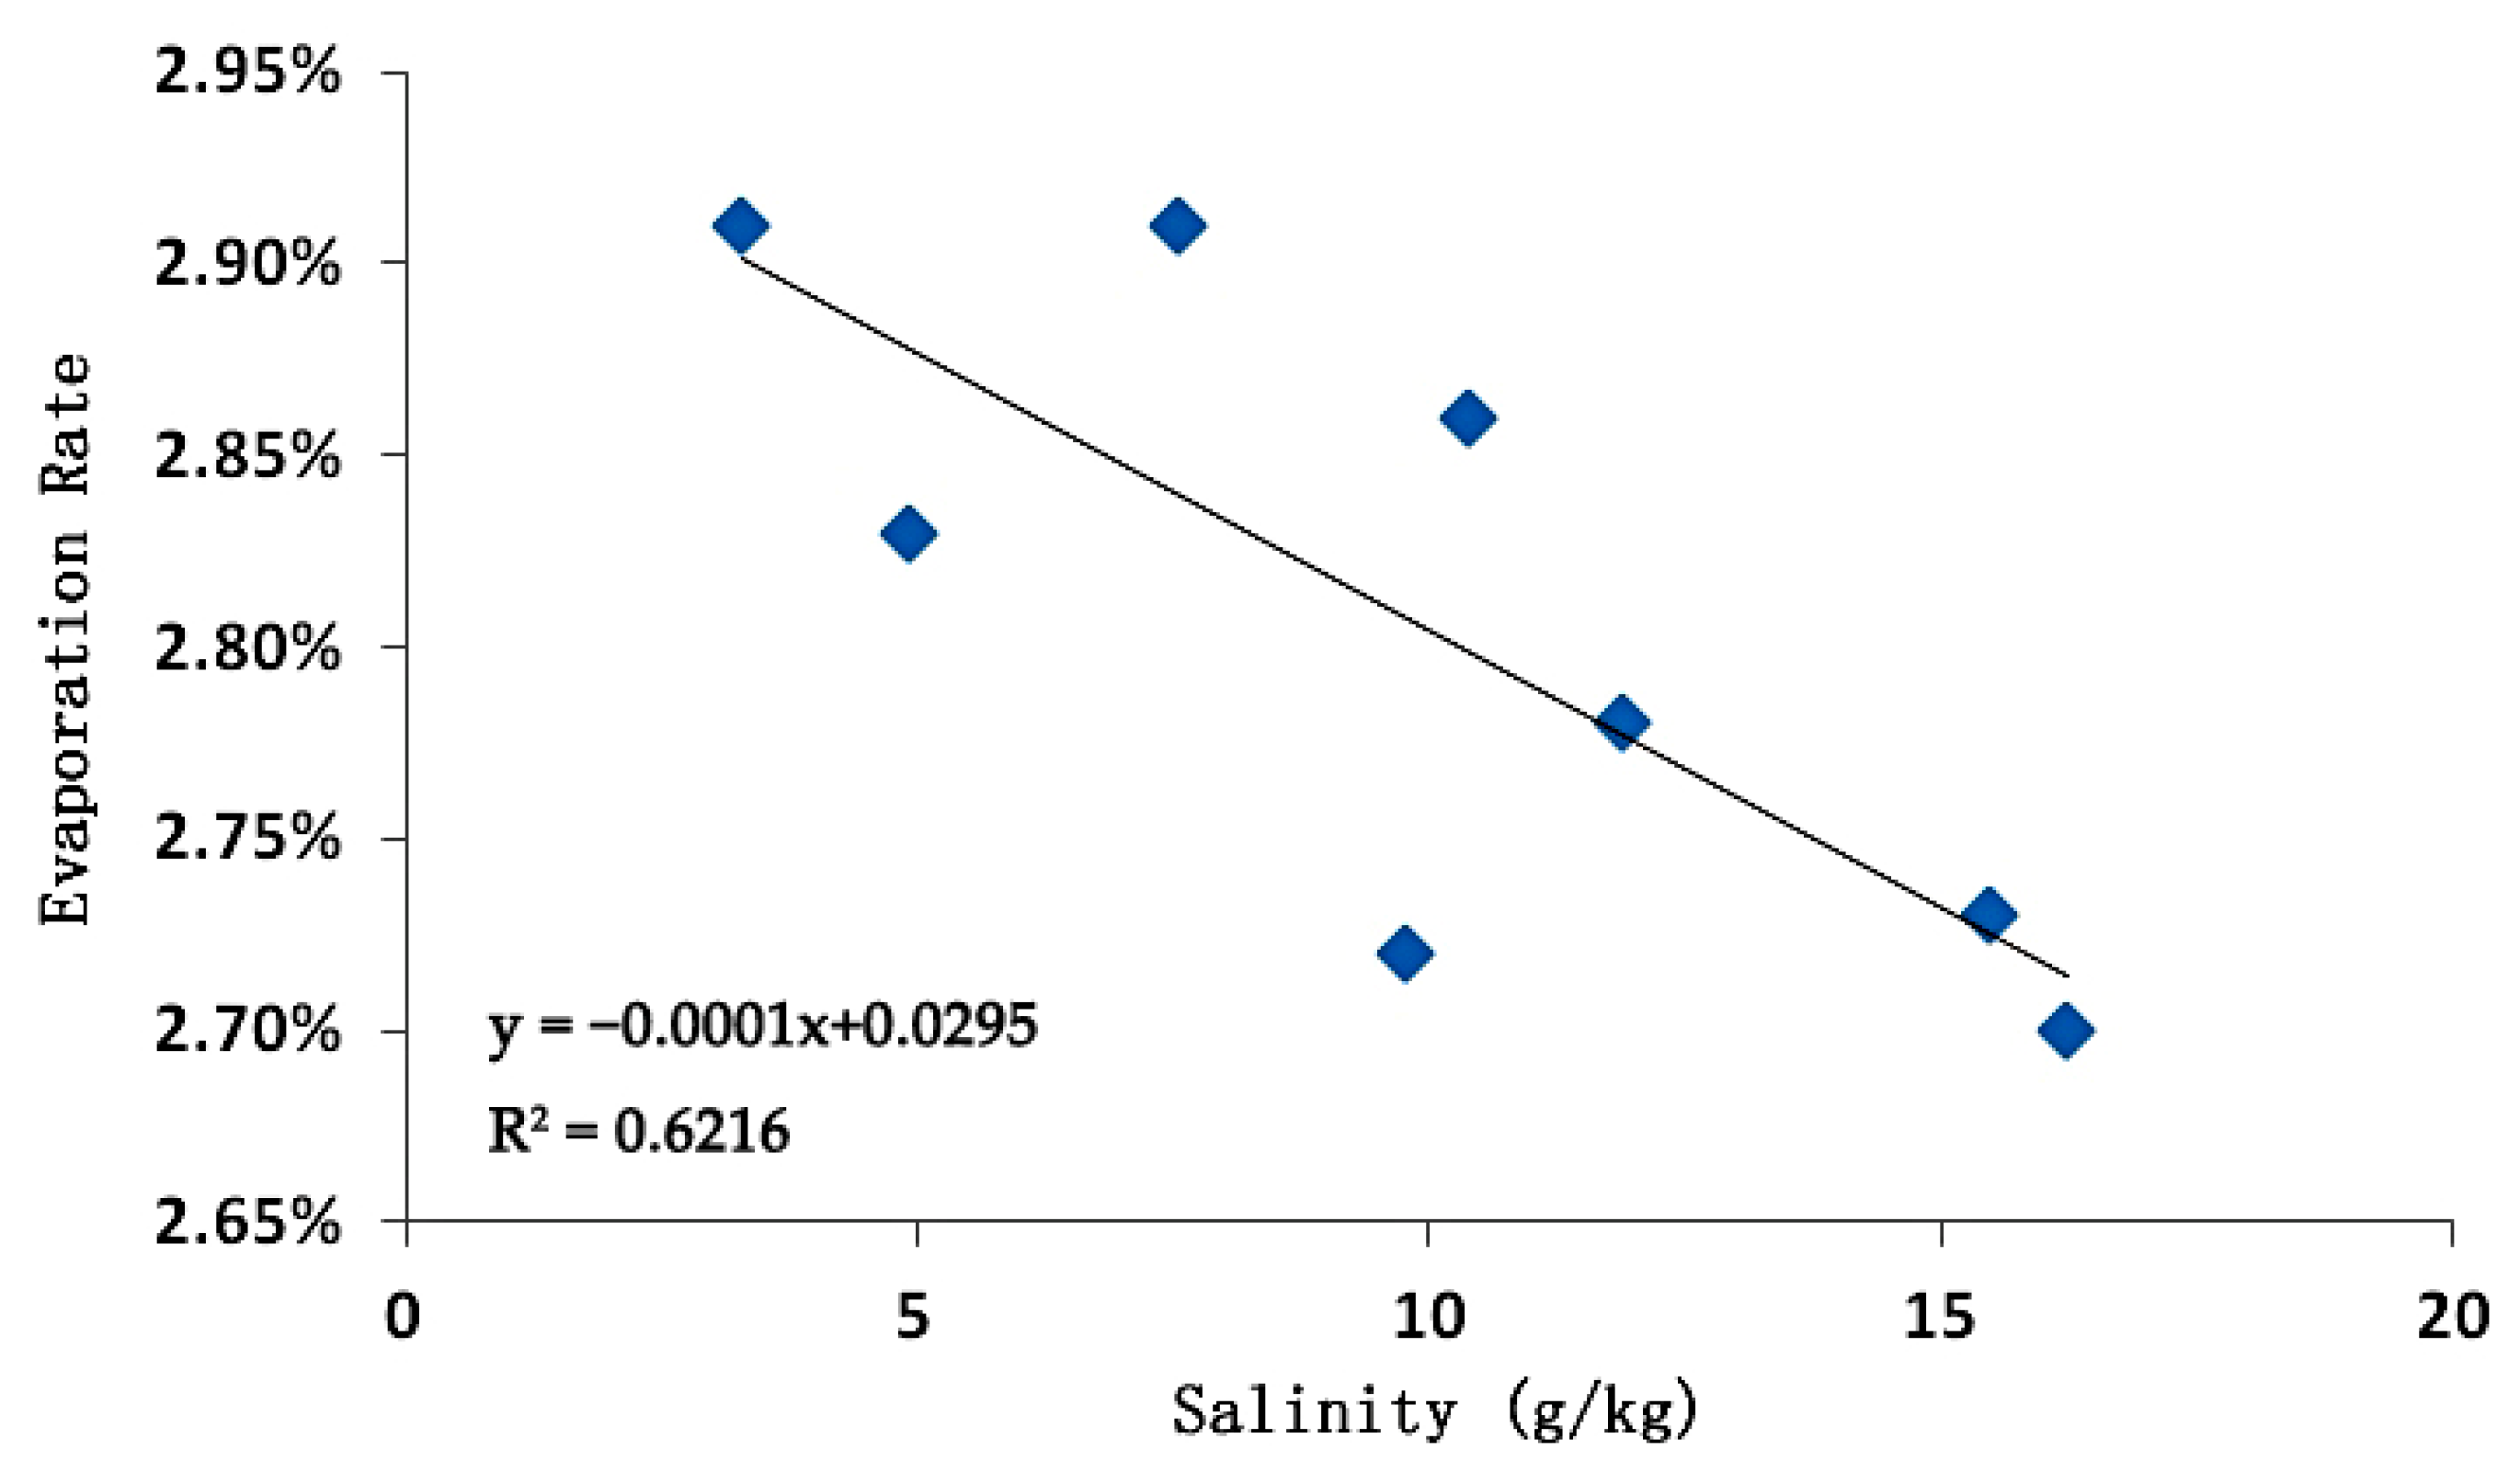
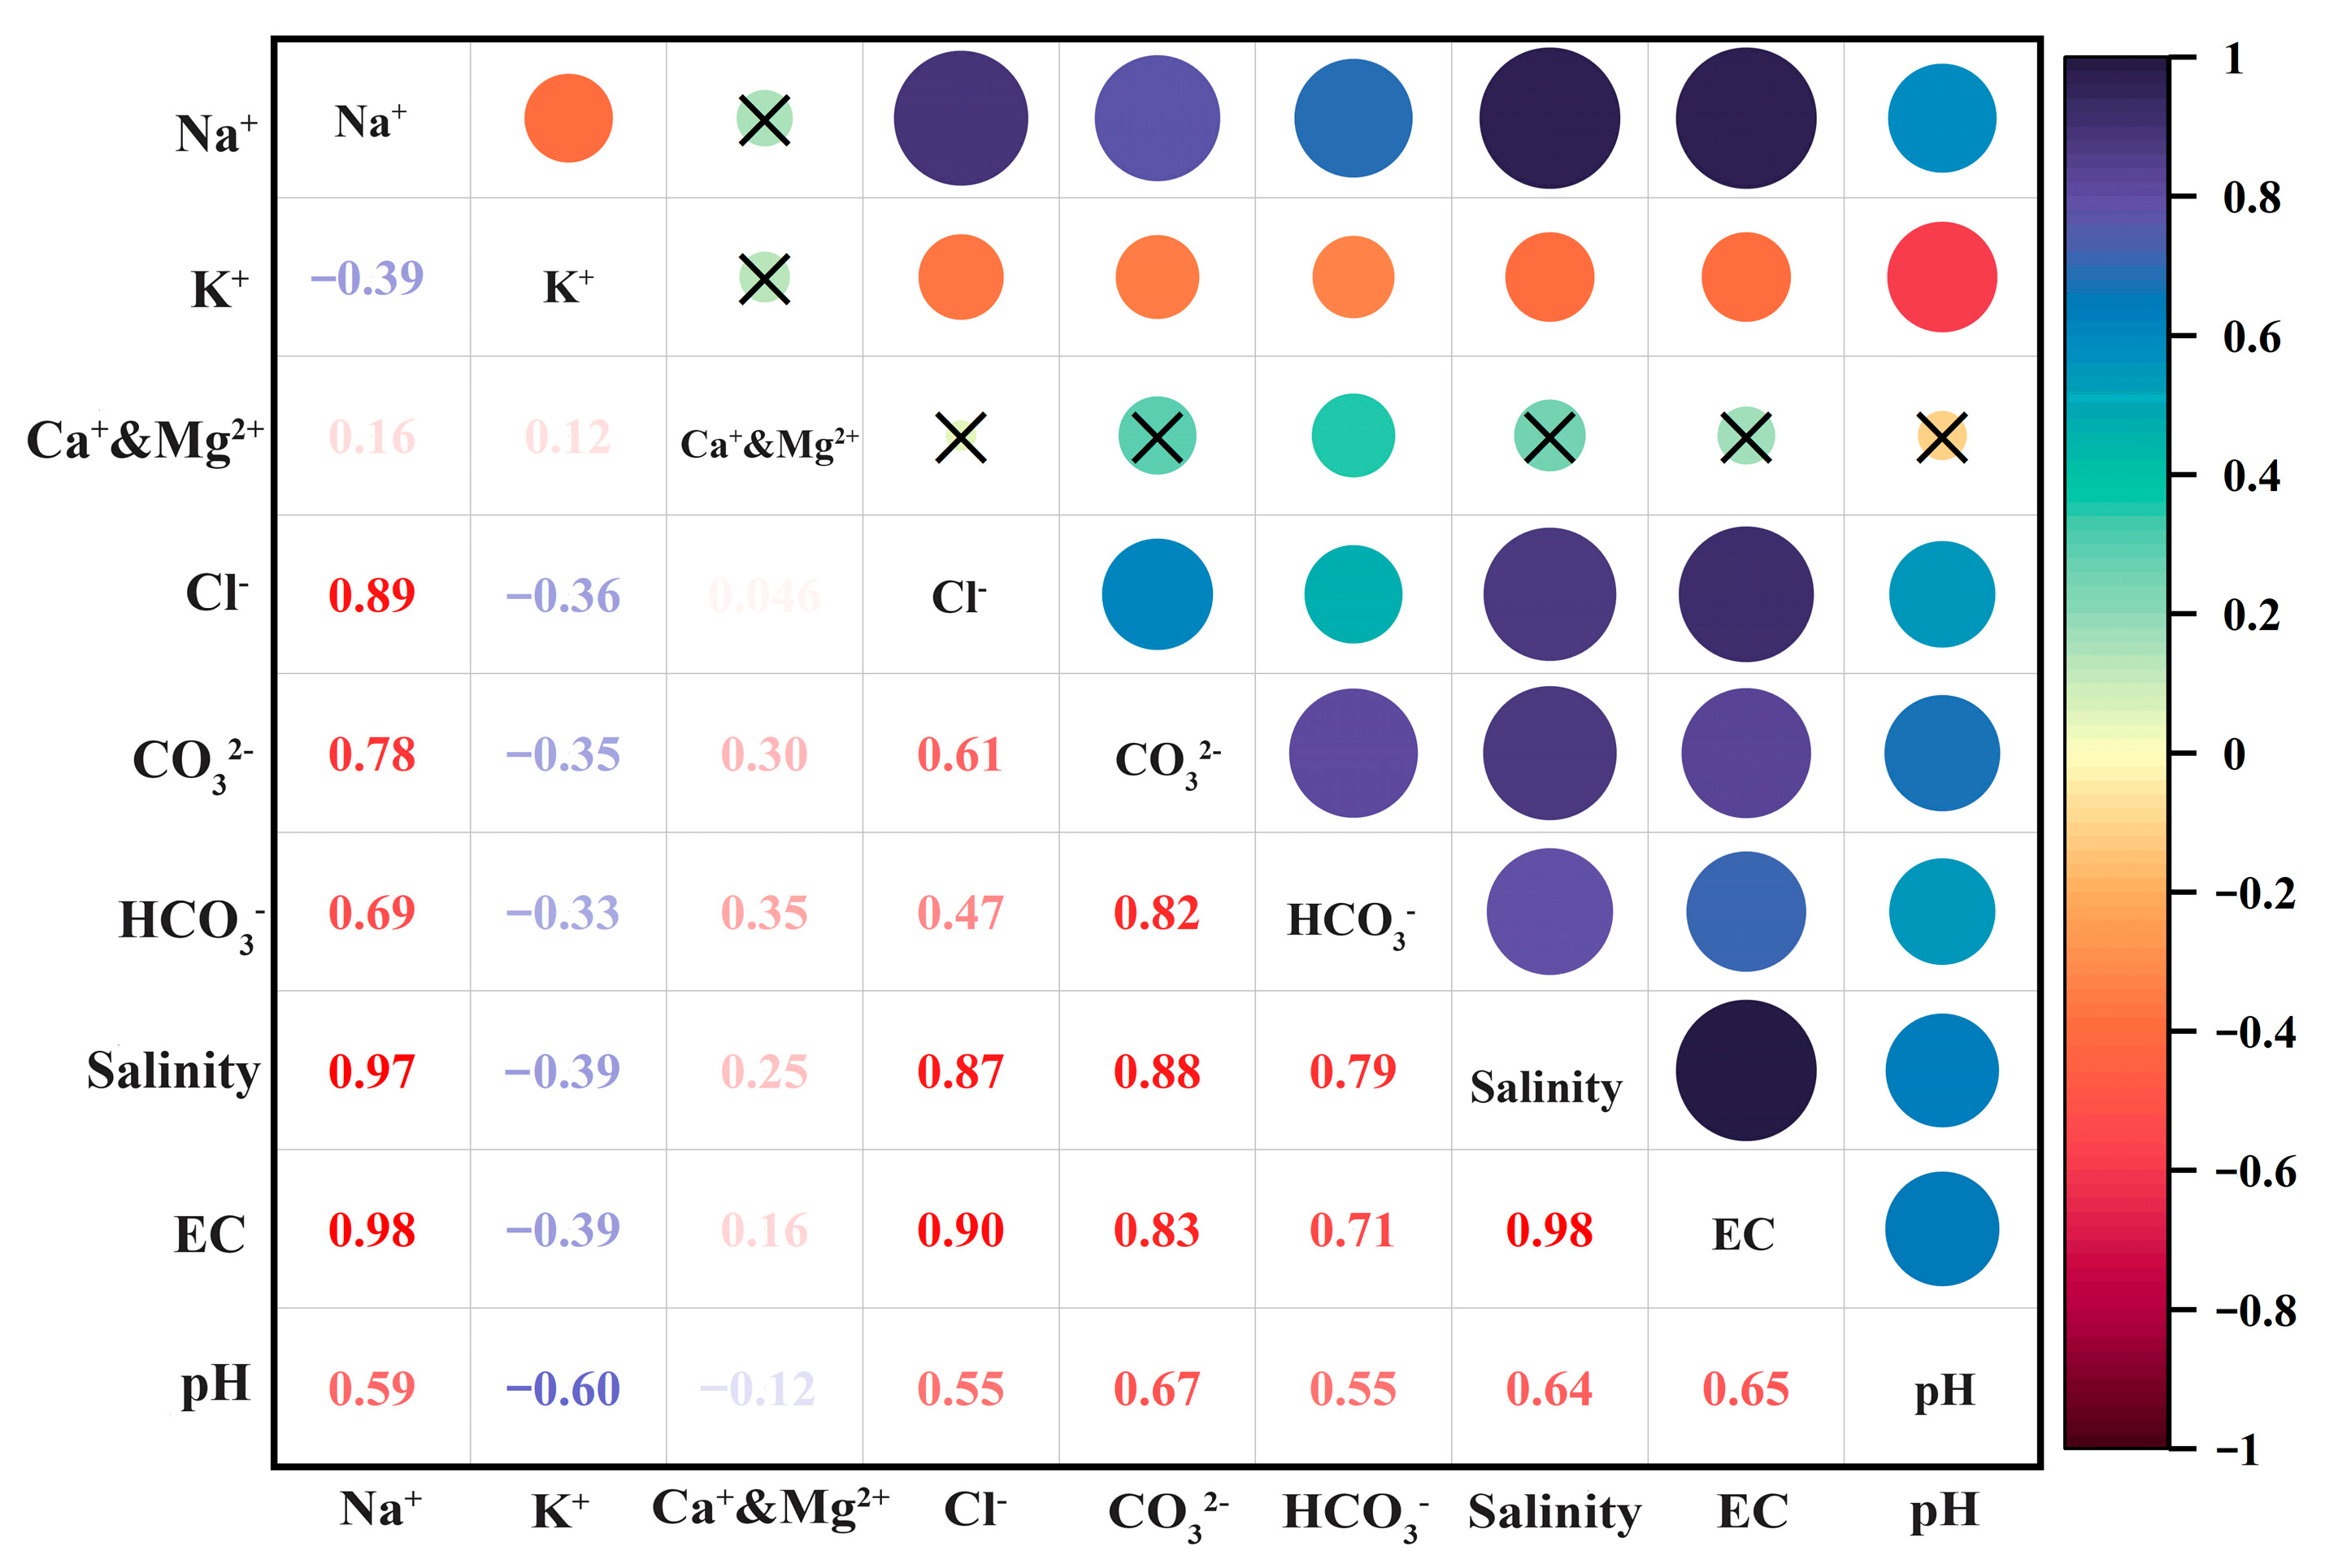
3.5. Correlation Analysis Results
3.6. Multiple Linear Regression Models
4. Discussion
5. Conclusions
Author Contributions
Funding
Institutional Review Board Statement
Data Availability Statement
Acknowledgments
Conflicts of Interest
References
- Stewart, R.D.; Abou Najm, M.R. Field measurements of soil cracks. Soil Sci. Soc. Am. J. 2020, 84, 1462–1476. [Google Scholar] [CrossRef]
- Jamalinia, E.; Vardon, P.J.; Steele-Dunne, S.C. The impact of evaporation induced cracks and precipitation on temporal slope stability. Comput. Geotech. 2020, 122, 103506. [Google Scholar] [CrossRef]
- Zhang, J.; Zhu, D.; Zhang, S. Shallow slope stability evolution during rainwater infiltration considering soil cracking state. Comput. Geotech. 2020, 117, 103285. [Google Scholar] [CrossRef]
- Yang, B.; Liu, J.; Zhao, X.; Zheng, S. Evaporation and cracked soda soil improved by fly ash from recycled materials. Land Degrad. Dev. 2021, 32, 2823–2832. [Google Scholar] [CrossRef]
- Hou, F.; Cheng, J.; Guan, N. Investigating the effect of soil cracks on preferential flow using a dye tracing infiltration experiment in karst in Southwest China. Land Degrad. Dev. 2023, 34, 1612–1628. [Google Scholar] [CrossRef]
- Poulsen, T.G.; Cai, W.; Garg, A. Water evaporation from cracked soil under moist conditions as related to crack properties and near-surface wind speed. Eur. J. Soil Sci. 2020, 71, 627–640. [Google Scholar] [CrossRef]
- Dai, Y.; Guan, Y.; Zhang, Q.; Sun, J.; He, X. Remote sensing monitoring and temporal and spatial characteristics of soil salinization in Aral Reclamation area. Arid Land. Geogr. 2022, 45, 1176–1185. [Google Scholar]
- Hassani, A.; Azapagic, A.; Shokri, N. Global predictions of primary soil salinization under changing climate in the 21st century. Nat. Commun. 2021, 12, 6663. [Google Scholar] [CrossRef]
- Masoud, A.A.; Koike, K.; Atwia, M.G.; El-Horiny, M.M.; Gemail, K.S. Mapping soil salinity using spectral mixture analysis of landsat 8 OLI images to identify factors influencing salinization in an arid region. Int. J. Appl. Earth Obs. 2019, 83, 101944. [Google Scholar] [CrossRef]
- Zhao, H.; Ma, Y.; Zhang, J.; Hu, Z.; Li, H.; Wang, Y.; Liu, J.; Li, Z. Effect of clay content on plastic shrinkage cracking of cementitious materials. Constr. Build. Mater. 2022, 342, 127989. [Google Scholar] [CrossRef]
- Puppala, A.J.; Manosuthikij, T.; Chittoori, B.C.S. Swell and shrinkage characterizations of unsaturated expansive clays from Texas. Eng. Geol. 2013, 164, 187–194. [Google Scholar] [CrossRef]
- Sridharan, A.; Jayadeva, M.S. Double-layer theory and compressibility of clays. Geotechnique 1982, 32, 133–144. [Google Scholar] [CrossRef]
- Tang, C.; Shi, B.; Liu, C.; Zhao, L.; Wang, B. Influencing factors of geometrical structure of surface shrinkage cracks in clayey soils. Eng. Geol. 2008, 101, 204–217. [Google Scholar] [CrossRef]
- Vail, M.; Zhu, C.; Tang, C.; Anderson, L.; Moroski, M.; Montalbo-Lomboy, M.T. Desiccation cracking behavior of MICP-treated bentonite. Geosciences 2019, 9, 385. [Google Scholar] [CrossRef]
- Tang, C.; Cui, Y.; Tang, A.; Shi, B. Shrinkage and desiccation cracking process of expansive soil and its temperature-dependent behaviour. Chin. J. Geotech. Eng. 2012, 34, 2182–2187. (In Chinese) [Google Scholar]
- Xie, Y.; Zhang, B.; Liu, B.; Zeng, Z.; Zhang, Y.; Zheng, Y. Shrinkage cracking and strength deterioration of red clay under cyclic drying and wetting. Alex. Eng. J. 2022, 61, 2574–2588. [Google Scholar] [CrossRef]
- Tian, B.; Cheng, Q.; Tang, C.; Zeng, H.; Xu, J.; Shi, B. Effects of compaction state on desiccation cracking behaviour of a clayey soil subjected to wetting-drying cycles. Eng. Geol. 2022, 302, 106650. [Google Scholar] [CrossRef]
- Meng, Y.; Wang, Q.; Su, W.; Ye, W.; Chen, Y. Effect of sample thickness on the self-sealing and hydration cracking of compacted bentonite. Eng. Geol. 2022, 307, 106792. [Google Scholar] [CrossRef]
- DeCarlo, K.F.; Shokri, N. Effects of substrate on cracking patterns and dynamics in desiccating clay layers. Water Resour. Res. 2014, 50, 3039–3051. [Google Scholar] [CrossRef]
- Inoue, H. Lateral flow in a clayey agricultural field with cracks. Geoderma 1993, 59, 311–325. [Google Scholar] [CrossRef]
- Dasog, G.S.; Shashidhara, G.B. Dimensional and volume of cracks in a vertisol under different crop covers. Soil Sci. 1993, 156, 424–428. [Google Scholar] [CrossRef]
- Ringrose-Voase, A.J.; Sanidad, W.B. A method for measuring the development of surface cracks in soils-application to crack development after lowland rice. Geoderma 1996, 71, 245–261. [Google Scholar] [CrossRef]
- Novak, V. Soil-crack characteristics-Estimation methods applied to heavy soil in the NOPEX area. Agric. For. Meteorol. 1999, 98, 501–507. [Google Scholar] [CrossRef]
- Samouelian, A.; Cousin, I.; Richard, G.; Tabbagh, A.; Bruand, A. Electrical resistivity imaging for detecting soil cracking at the centimetric scale. Soil Sci. Soc. Am. J. 2003, 63, 1319–1326. [Google Scholar] [CrossRef]
- Liu, C.; Tang, C.; Shi, B.; Suo, W. Automatic quantification of crack patterns by image processing. Comput. Geosci. 2013, 57, 77–80. [Google Scholar] [CrossRef]
- Wang, C.; Zhang, Z.; Liu, Y.; Fan, S. Geometric and fractal analysis of dynamic cracking patterns subjected to wetting-drying cycles. Soil Till. Res. 2017, 170, 1–13. [Google Scholar] [CrossRef]
- Liu, R.; Vail, M.; Koohbor, B.; Zhu, C.; Tang, C.; Xu, H.; Shi, X. Desiccation cracking in clay-bottom ash mixtures: Insights from crack image analysis and digital image correlation. Bull. Eng. Geol. Environ. 2022, 81, 139. [Google Scholar] [CrossRef]
- Tang, C.; Cheng, Q.; Lin, L.; Tian, B.; Zeng, H.; Shi, B. Study on the dynamic mechanism of soil desiccation cracking by surface strain/displacement analysis. Comput. Geotech. 2022, 152, 104998. [Google Scholar] [CrossRef]
- Taheri, S.; El-Zein, A. Desiccation cracking of polymer-bentonite mixtures: An experimental investigation. Appl. Clay Sci. 2023, 238, 106945. [Google Scholar] [CrossRef]
- Tang, L.; Zhao, Z.; Luo, Z.; Sun, Y. What is the role of tensile cracks in cohesive slopes? J. Rock Mech. Geotech. 2019, 11, 314–324. [Google Scholar] [CrossRef]
- Zhuo, Z.; Zhu, C.; Tang, C.; Xu, H.; Shi, X.; Mark, V. 3D characterization of desiccation cracking in clayey soils using a structured light scanner. Eng. Geol. 2022, 299, 106566. [Google Scholar] [CrossRef]
- An, R.; Wang, Y.; Zhang, X.; Chen, C.; Liu, X.; Cai, S. Quantitative characterization of drying-induced cracks and permeability of granite residual soil using micron-sized X-ray computed tomography. Sci. Total Environ. 2023, 876, 163213. [Google Scholar] [CrossRef] [PubMed]
- Sun, D.; Liu, X.; Yuan, S.; Pan, G.; Jiang, G.; Wang, H.; Hideo, K.; Buzzi, O. Three-dimensional characterization of cracks in undisturbed Mile expansive soil using X-ray computed tomography. Soils Found. 2023, 63, 101282. [Google Scholar]
- Zhang, X.; Chen, Y.; Ye, W.; Cui, Y.; Deng, Y.; Chen, B. Effect of salt concentration on desiccation cracking behavior of GMZ bentonite. Environ. Earth Sci. 2017, 76, 531. [Google Scholar] [CrossRef]
- Zhang, T.; Deng, Y.; Cui, Y.; Lan, H.; Zhang, F.; Zhang, H. Porewater salinity effect on flocculation and desiccation cracking behaviour of kaolin and bentonite considering working condition. Eng. Geol. 2019, 251, 11–23. [Google Scholar] [CrossRef]
- Xing, X.; Kuan, D.; Ma, X. Difference in loam water retention and shrinkage behavior: Effects of various types and concentrations of salt ions. Soil Till. Res. 2017, 167, 61–72. [Google Scholar] [CrossRef]
- Wang, C.; Feng, G.; Zhang, Z.; Huang, M.; Qi, W.; Ma, L. Geometrical and statistical analysis of dynamic crack morphology in shrink-swell soils with addition of maize roots or salinity (NaCl). Soil Till. Res. 2021, 212, 105057. [Google Scholar] [CrossRef]
- Li, D.; Yang, B.; Zhang, Z.; Hu, M. Effects of salt content on desiccation cracks in the clay. Environ. Earth Sci. 2021, 80, 671. [Google Scholar] [CrossRef]
- Eshel, G.; Levy, G.J.; Mingelgrin, U. Critical evaluation of the use of laser diffraction for particle-size distribution analysis. Soil Sci. Soc. Am. J. 2004, 68, 736–743. [Google Scholar] [CrossRef]
- Ren, J.; Li, X.; Zhao, K.; Fu, B.; Jiang, T. Study of an on-line measurement method for the salt parameters of soda-saline soils based on the texture features of cracks. Geoderma 2016, 263, 60–69. [Google Scholar] [CrossRef]
- Yang, F.; An, F.; Ma, H.; Wang, Z.; Zhou, X.; Liu, J. Variations on soil salinity and sodicity and its driving factors analysis under microtopography in different hydrological conditions. Water 2016, 8, 227. [Google Scholar] [CrossRef]
- Bai, Y.; Qin, Y.; Lu, X.; Zhang, J.; Chen, G.; Li, X. Fractal dimension of particle-size distribution and their relationships with alkalinity properties of soils in the western Songnen Plain, China. Sci. Rep. 2020, 10, 20603. [Google Scholar] [CrossRef]
- USSLS. Diagnose and Improvement of Saline and Alkali Soils; US Government Printing Office: Washington, DC, USA, 1954.
- Farifteh, J.; Van der Meer, F.; Atzberger, C.; Carranzza, E.J.M. Quantitative analysis of salt-affected soil reflectance spectra: A comparison of two adaptive methods (PLSR and ANN). Remote Sens. Environ. 2007, 110, 59–78. [Google Scholar] [CrossRef]
- Ouyang, B.; Tang, C.; Wang, D.; Xu, S.; Shi, B. Advances on soil moisture evaporation. Rock Soil Mech. 2016, 37, 625–636, 654. (In Chinese) [Google Scholar]
- Tang, C.; Wang, D.; Zhu, C.; Zhou, Q.; Xu, S.; Shi, B. Characterizing drying-induced clayey soil desiccation cracking process using electrical resistivity method. Appl. Clay Sci. 2018, 152, 101–112. [Google Scholar] [CrossRef]
- Sun, K.; Tang, C.; Wang, P.; Wang, D.; Chen, Z.; Xu, S. Effect of salt content on desiccation cracking behavior of soil. J. Eng. Geol. 2015, 23, 77–83. (In Chinese) [Google Scholar]
- Amarasiri, A.L.; Kodikara, J.K.; Costa, S. Numerical modeling of desiccation cracking. Int. J. Numer. Anal. Met. 2011, 35, 82–96. [Google Scholar] [CrossRef]
- Trabelsi, H.; Jamei, M.; Zenzri, H.; Olivella, S. Crack patterns in clayey soils: Experiments and modeling. Int. J. Numer. Anal. Met. 2012, 36, 1410–1433. [Google Scholar] [CrossRef]
- Cheng, Q.; Tang, C.; Chen, Z.; El-Maarry, M.R.; Zeng, H.; Shi, B. Tensile behavior of clayey soils during desiccation cracking process. Eng. Geol. 2020, 279, 105909. [Google Scholar] [CrossRef]
- Cordero, J.A.; Prat, P.C.; Ledesma, A. Experimental analysis of desiccation cracks on a clayey silt from a large-scale test in natural conditions. Eng. Geol. 2021, 292, 106256. [Google Scholar] [CrossRef]
- Zhang, G.; Yu, Q.; Wei, G.; Chen, B.; Yang, L.; Hu, C.; Li, J.; Chen, H. Study on the basic properties of the soda-saline soils in Songnen Plain. Hydrogeol. Eng. Geol. 2007, 2, 37–40. (In Chinese) [Google Scholar]
- Wang, W.; Wang, Q.; Zhang, J.; Chen, H. An experiment study of on the fundamental properties of the carbonate-saline soil in west of Jilin Province. J. Beijing Univ. Technol. 2011, 37, 217–224. (In Chinese) [Google Scholar]
- Zhang, G.; Li, J.; Yu, Q.; Zhang, B.; Yang, R.; Chen, H. Influence of salt content on shearing strength of the carbonate saline soil in Songnen Plain. Chin. J. Geol. Hazard Control 2008, 19, 128–131. (In Chinese) [Google Scholar]
- Li, X.; Zhao, K.; Ren, J.; Li, Y. Correlation between conductive, soluble sodium and crack of soil in west Jilin Province. Soils Crop. 2012, 1, 49–54. (In Chinese) [Google Scholar]
- DeCarlo, K.F.; Shokri, N. Salinity effects on cracking morphology and dynamics in 3-D desiccation clays. Water Resour. Res. 2014, 50, 3052–3072. [Google Scholar] [CrossRef]
- Ren, J.; Chen, Q.; Ma, D.; Xie, R.; Zhu, H.; Zang, S. Study on a fast EC measurement method of soda saline-alkali soil based on wavelet decomposition texture feature. Catena 2021, 203, 105272. [Google Scholar] [CrossRef]
- Shorkri, N.; Zhou, P.; Keshmiri, A. Patterns of desiccation cracks in saline bentonite layers. Transp. Porous. Med. 2015, 110, 333–344. [Google Scholar] [CrossRef]
- Tang, C.; Zhu, C.; Cheng, Q.; Zeng, H.; Xu, J.; Tian, B.; Shi, B. Desiccation cracking of soils: A review of investigation approaches, underlying mechanisms, and influencing factors. Earch-Sci. Rev. 2021, 216, 103586. [Google Scholar] [CrossRef]
- Wang, H.; Chen, X.; Wang, W. Effect of salt cation types on propagation and closure law of desiccation cracks in red soil. J. Drain. Irrig. Mach. Eng. 2021, 39, 285–291. [Google Scholar]
- Fujimaki, H.; Baki, H.M.F.A.E. Effect of bypass-flow on leaching of salts in a cracking soil in the Nile Delta. Water 2021, 13, 993. [Google Scholar] [CrossRef]
- Yang, B.; Yuan, J. Application of fractal theory to characterize desiccation cracks in contaminated clayey soil. Arab. J. Geosci. 2019, 12, 85. [Google Scholar] [CrossRef]


| Soil Parameter | Min | Max | Mean | SD | CV (%) | Skewness | Kurtosis |
|---|---|---|---|---|---|---|---|
| Na+ (g/kg) | 0.15 | 14.12 | 3.32 | 3.34 | 100.56 | 1.78 | 3.12 |
| K+ (g/kg) | 0.005 | 0.06 | 0.02 | 0.01 | 69.85 | 2.01 | 4.84 |
| Ca2+ & Mg2+ (g/kg) | 0.1 | 1.6 | 0.45 | 0.30 | 66.33 | 1.85 | 4.71 |
| Cl− (g/kg) | 0.1 | 5.25 | 1.42 | 1.42 | 100.21 | 1.32 | 0.96 |
| CO32− (g/kg) | 0.2 | 5.5 | 2.25 | 1.53 | 68.15 | 0.82 | −0.50 |
| HCO3− (g/kg) | 0.12 | 5 | 1.38 | 0.92 | 66.55 | 1.71 | 4.69 |
| Salinity (g/kg) | 1.06 | 29.73 | 8.83 | 6.63 | 75.12 | 1.34 | 1.79 |
| EC (ds/m) | 0.06 | 3.39 | 0.96 | 0.82 | 86.14 | 1.28 | 1.40 |
| pH | 8.01 | 10.77 | 9.77 | 0.76 | 7.82 | −1.12 | −0.02 |
| ESP | 1.14 | 47.30 | 10.86 | 10.26 | 94.44 | 2.02 | 4.51 |
| Clay (%) | 25.39 | 32.04 | 27.96 | 1.71 | 6.10 | 0.40 | −0.60 |
| Silt (%) | 28.72 | 40.4 | 35.11 | 3.24 | 9.24 | −0.12 | −0.82 |
| Sand (%) | 28.26 | 43.94 | 36.96 | 3.72 | 10.05 | −0.31 | −0.70 |
| Sample | Equations | R2 | RMSE (%) |
|---|---|---|---|
| 8 | Y = −2653.30X2 + 497.40X + 348.80 | 0.96 | 7.65 |
| 22 | Y = −2197.10X2 + 199.32X + 397.87 | 0.98 | 5.88 |
| 25 | Y = −2248.40X2 + 354.40X + 420.58 | 0.95 | 7.51 |
| 26 | Y = −851.83X2 − 189.48X + 288.19 | 0.98 | 7.19 |
| 31 | Y = −1558.60X2 − 79.70X + 373.86 | 0.95 | 8.95 |
| 35 | Y = −1977.50X2 + 24.38X + 406.03 | 0.98 | 7.39 |
| 39 | Y = −2082.10X2 + 433.09X + 286.40 | 0.99 | 4.83 |
| Minimum | Maximum | Mean | Variance | |
|---|---|---|---|---|
| Soil moisture (%) | 0.54 | 2.34 | 1.49 | 0.05 |
| Soil Parameter | Min | Max | Mean | SD | CV (%) | Skewness | Kurtosis |
|---|---|---|---|---|---|---|---|
| Crack Length (cm/2500 cm2) | 200 | 797.18 | 455.83 | 121.28 | 26.61 | 0.46 | 0.93 |
| Crack Area (cm2/2500 cm2) | 36.78 | 547.54 | 311.57 | 120.73 | 38.75 | −0.02 | −0.41 |
| CON | 0.01 | 0.34 | 0.12 | 0.08 | 65.45 | 0.83 | 0.75 |
| Fractal | 1.14 | 1.60 | 1.44 | 0.12 | 8.60 | −0.80 | −0.24 |
| Soil Parameter | Crack Length (cm) | Crack Area (cm2) | CON | Fractal |
|---|---|---|---|---|
| Na+ (g/kg) | 0.91 ** | 0.42 ** | 0.93 ** | 0.53 ** |
| K+ (g/kg) | −0.39 ** | −0.43 ** | −0.46 ** | −0.54 ** |
| Ca2+ & Mg2+ (g/kg) | 0.27 * | 0.08 | 0.21 | 0.20 |
| Cl− (g/kg) | 0.81 ** | 0.44 ** | 0.84 ** | 0.52 ** |
| CO32− (g/kg) | 0.80 ** | 0.34 * | 0.82 ** | 0.53 ** |
| HCO3− (g/kg) | 0.73 ** | 0.36 * | 0.74 ** | 0.51 ** |
| Salinity (g/kg) | 0.93 ** | 0.44 ** | 0.95 ** | 0.58 ** |
| EC (ds/m) | 0.92 ** | 0.44 ** | 0.95 ** | 0.58 ** |
| pH | 0.68 ** | 0.40 ** | 0.68 ** | 0.61 ** |
| ESP | 0.89 ** | 0.38 ** | 0.92 ** | 0.50 ** |
| Clay (%) | 0.15 | 0.23 | 0.13 | 0.24 * |
| Silt (%) | 0.25 * | 0.02 | 0.11 | 0.06 |
| Sand (%) | 0.29 * | 0.09 | 0.16 | 0.16 |
| Soil Parameters | Equations | R2 | RPD | RMSE (%) |
|---|---|---|---|---|
| Na+ (g/kg) | Y = 13.40 + 0.01X1 + 0.008X2 + 30.50X3 − 15.69X4 | 0.93 | 3.09 | 27.72 |
| K+ (g/kg) | Y = 0.064 − 0.11X3 − 0.04X4 | 0.35 | 1.42 | 55.81 |
| Ca2+ & Mg2+ (g/kg) | Y = −0.74 + 0.002X1 − 1.86X3 + 0.57X4 | 0.11 | 0.55 | 66.63 |
| Cl− (g/kg) | Y = 5.09 + 0.005X1 + 0.004X2 + 11.47X3 − 5.91X4 | 0.74 | 1.64 | 54.42 |
| CO32− (g/kg) | Y = −0.22 + 0.003X1 − 0.002X2 + 13.26X3 + 0.10X4 | 0.69 | 1.51 | 40.45 |
| HCO3− (g/kg) | Y = 0.21 + 0.003X1 + 4.03X3 − 0.67X4 | 0.55 | 0.95 | 47.90 |
| Salinity (g/kg) | Y = 17.81 + 0.026X1 + 0.01X2 + 57.28X3 − 21.66X4 | 0.94 | 3.66 | 20.17 |
| EC (ds/m) | Y = 2.19 + 0.003X1 + 0.001X2 + 7.78X3 − 2.67X4 | 0.93 | 3.40 | 25.07 |
| pH | Y = 4.25 + 0.001X1 − 0.002X2 + 2.99X3 + 3.84X4 | 0.53 | 1.09 | 5.73 |
Disclaimer/Publisher’s Note: The statements, opinions and data contained in all publications are solely those of the individual author(s) and contributor(s) and not of MDPI and/or the editor(s). MDPI and/or the editor(s) disclaim responsibility for any injury to people or property resulting from any ideas, methods, instructions or products referred to in the content. |
© 2023 by the authors. Licensee MDPI, Basel, Switzerland. This article is an open access article distributed under the terms and conditions of the Creative Commons Attribution (CC BY) license (https://creativecommons.org/licenses/by/4.0/).
Share and Cite
Zhang, Z.; Li, X.; Ren, J.; Zhou, S. Study on the Drying Process and the Influencing Factors of Desiccation Cracking of Cohesive Soda Saline-Alkali Soil in the Songnen Plain, China. Agriculture 2023, 13, 1153. https://doi.org/10.3390/agriculture13061153
Zhang Z, Li X, Ren J, Zhou S. Study on the Drying Process and the Influencing Factors of Desiccation Cracking of Cohesive Soda Saline-Alkali Soil in the Songnen Plain, China. Agriculture. 2023; 13(6):1153. https://doi.org/10.3390/agriculture13061153
Chicago/Turabian StyleZhang, Zhuopeng, Xiaojie Li, Jianhua Ren, and Shuang Zhou. 2023. "Study on the Drying Process and the Influencing Factors of Desiccation Cracking of Cohesive Soda Saline-Alkali Soil in the Songnen Plain, China" Agriculture 13, no. 6: 1153. https://doi.org/10.3390/agriculture13061153
APA StyleZhang, Z., Li, X., Ren, J., & Zhou, S. (2023). Study on the Drying Process and the Influencing Factors of Desiccation Cracking of Cohesive Soda Saline-Alkali Soil in the Songnen Plain, China. Agriculture, 13(6), 1153. https://doi.org/10.3390/agriculture13061153