Abstract
Plastic mulching reduces weeds, conserves soil water, and boosts crop yield. However, most studies are insufficient when determining how plastic mulching affects greenhouse gas (GHG) emissions, particularly when used in conjunction with fertilizers. The purpose of this study was to determine the combined effect of plastic mulching and fertilizers on GHG emissions in apple orchards. A 3-year field experiment was conducted with two factors: mulching and fertilizers; (1) mulching treatments: plastic film (PM) and no mulching (NM); and (2) four fertilizer treatments: control (CK), organic fertilizer (M), inorganic fertilizer (NPK), and organic combined with inorganic fertilizer (MNPK), arranged in a two factorial randomized complete block design. The results showed that the mean annual N2O emissions ranged from 0.87 to 5.07 kg ha−1 in PM and from 0.75 to 2.90 kg ha−1 in NM. The mean CO2 emissions ranged from 2.10 to 6.68 t ha−1 in PM and from 1.98 to 4.27 t ha−1 in NM. MNPK contributed more to N2O and CO2 emissions in both PM and NM. The mean CH4 uptake rate ranged from 1.19 to 4.25 kg ha−1 in PM and from 1.14 to 6.75 kg ha−1 in NM. M treatment contributed more to CH4 uptake in both PM and NM. NKP treatments had higher greenhouse gas intensity (GHGI) in PM and NM, while MNPK and NPK treatments had higher greenhouse gas potential (GWP) in PM and NM, respectively. These results suggest that plastic film mulching significantly raises the potential for soil GHG emissions and increases apple yield.
1. Introduction
Global warming, caused by greenhouse gas (GHG) emissions consisting of nitrous oxide (N2O), carbon dioxide (CO2), methane (CH4), hydrofluorocarbons (HFCs), sulphur hexafluoride (SF6), and nitrogen trifluoride (NF3), is one of the biggest threats to humanity and the ecosystem today. Agricultural activity is one of the leading causes of GHG emissions [1]. Farm management and control systems such as fertilizer application, irrigation, land management, and tillage are major contributors to GHG emissions [2]. GHG emissions caused by agricultural production account for 9 to 15% of total GHG emissions, which include CO2 (8%), N2O (81%), and CH4 (44%), and are expected to increase by 30% by 2050 [3,4].
Nowadays, plastic mulching using conventional, low-density polyethylene mulch films (PM) is widely used in crop production throughout the world [5]. It covers an area of 20 million ha−1 which accounts for 60% of the total global use, especially in upland areas [6,7,8]. China is the world’s largest user of PM, covering around 19, 320 ha−1 of farmland [9].
However, using PM in agriculture combined with fertilizer application is the major factor in the increase in yield and GHG emissions [10]. Thus, a good yield management system can assure food security by increasing yield and reducing GHG, GWP, and GHGI emissions in the production of sustainable agriculture and a friendly environment [11].
The Plateau region in China is the major apple cultivating region [12], covering 138.86 ha−1, which accounts for 55.20% and 45.00% of the Chinese and the world’s total farmland [13]. As a result of the lack of water in the production system and the limitation of agricultural development in plateau regions [14], using PM can help to increase soil temperature in order to suppress weed growth [15], promote decomposition and transformation of soil organic carbon (SOC), and improve soil nutrient content [16]. Moreover, it can help to promote plant growth which can solve the decrease in agricultural products in dryland [15,17]. Fang et al. [18] reported that biodegradable film mulch can increase water-filled pore space (WFPS) content. In addition, the results of Lee et al. [19] confirmed that the use of horticultural fabric mulching in apple orchards has significantly increased apple production.
However, the impact of PM use on GHG emissions is still unclear, and the issue has been raised for discussion. Some study results show that PM increases soil temperature and WFPS content in the soil, which promotes the nitrification and denitrification system in soil, speeds up soil breathing which affects the diffusion of N2O [20], and increases CO2 emissions [10]. Moreover, using PM impedes the exchange between soil air and atmospheric air, increases WPFS in soil, increases reparation in the root, and decreases the concentration of O2 in soil and methanotroph; therefore, it affects CH4 uptake [21]. Nevertheless, according to the report by Li et al. [22], the cumulative amount of CH4 uptake increased under soil PM. The study conducted by Guo et al. [23] found that PM can decrease CO2 emissions, which was consistent with other studies showing that transparent degradable mulching film reduces GHG emissions [24].
The number of inorganic fertilizer applications in apple orchards has been excessive over the past two decades. It has affected the rise of production costs due to rising fertilizer use in apple orchards. The decline in soil minerals affected soil acidity and increased GHG emissions [25,26]. Using organic combined with inorganic fertilizers, including animal manure and agricultural waste, instead of using inorganic fertilizers can improve soil health and increase yield [27]. Zhang et al. [28] explained that the integrated use of organic and inorganic fertilizers can increase the apple yield by 47.40% in comparison with CK. However, the effect on GHG emissions is still unknown. Some studies have shown that using organic combined with inorganic fertilizer increases nitrification and N2O emissions [29,30]. The N content in organic fertilizer is lower than that in inorganic fertilizer, which affects the reduction of N2O emissions [31,32]. According to the meta-analysis found in the study of mineral fertilizer with organic fertilizer in maize, organic fertilizer application increased CO2 emissions by 26.80% in comparison with using mineral fertilizer [33] because it could significantly increase SOC in soil [34]. On the contrary, the study of Zhang et al. [30] and Xie et al. [35] found that there is not any effect on CO2 emissions. The studies of rice conducted by Hou et al. [36] and Pandey et al. [37] found that organic fertilizer use can increase CH4 emissions, while the studies by Fan et al. [38] and Brenzinger et al. [39] found that organic fertilizer use in bean, wheat, and rice production can promote methane oxidant in soil and affect the increase of CH4 uptake. Thus, this indicates that different kinds of fertilizer affect soil CH4 flux differently.
There are no studies on using PM combined with the integrated use of organic and inorganic fertilizer in apple orchards. Therefore, this study is very important to help farmers understand how to manage their orchards properly and apply fertilizer appropriately during the production process to obtain the highest production capacity and decrease GHG emissions at the same time.
The objectives of this study were: (1) to determine the effect of organic and inorganic fertilizers on apple yield under plastic mulching; (2) to evaluate the effect of organic and inorganic fertilizers on greenhouse gas emissions of apple orchards; and (3) to assess the effect of organic and inorganic fertilizers on global warming potential and greenhouse gas intensity in apple orchards.
2. Materials and Methods
2.1. Experimental Area
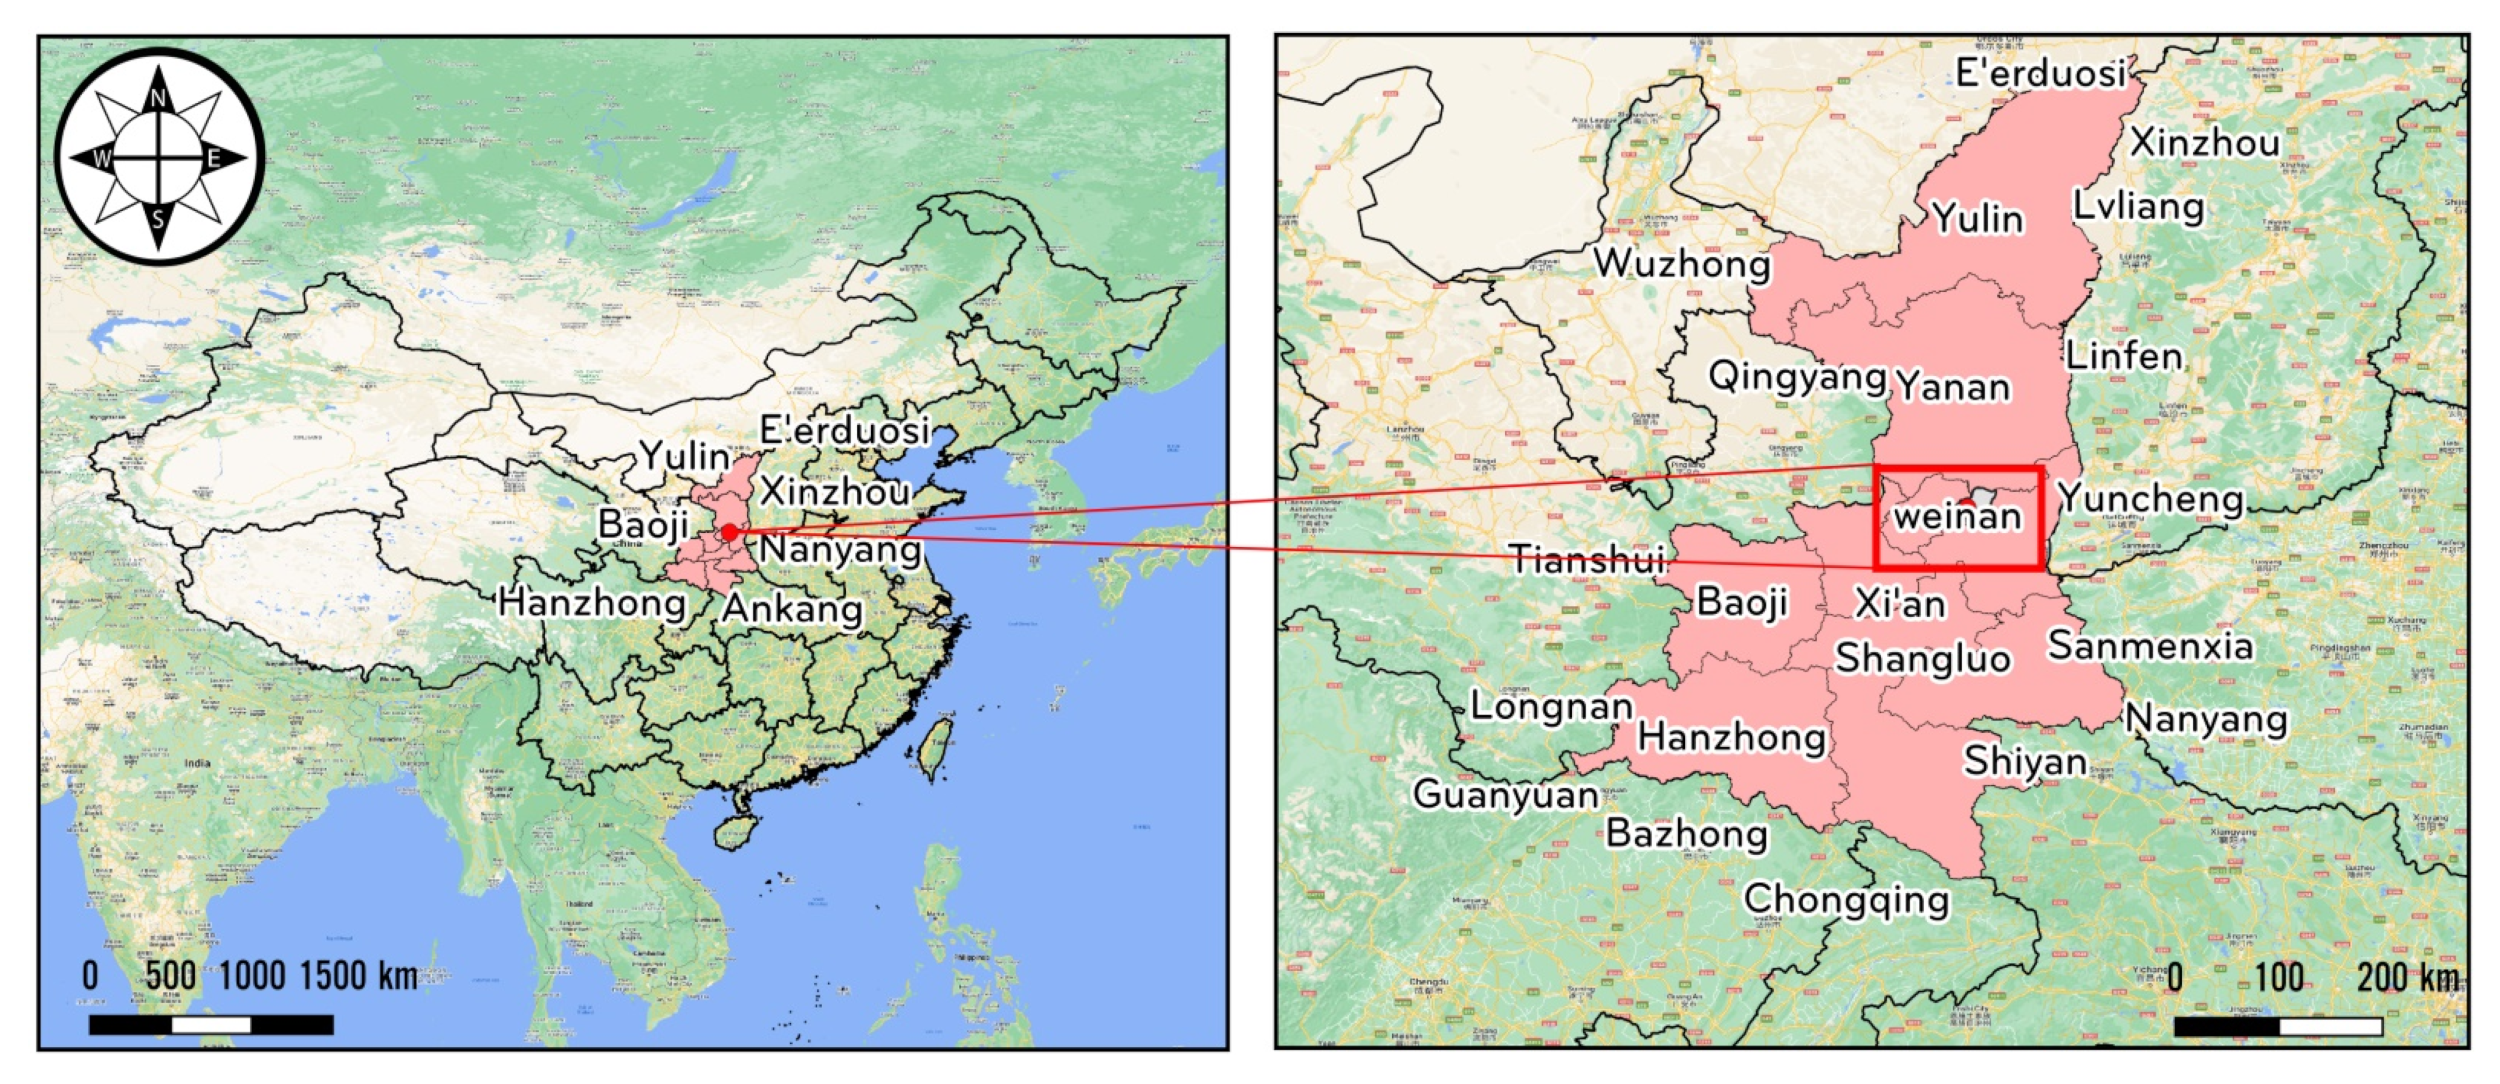
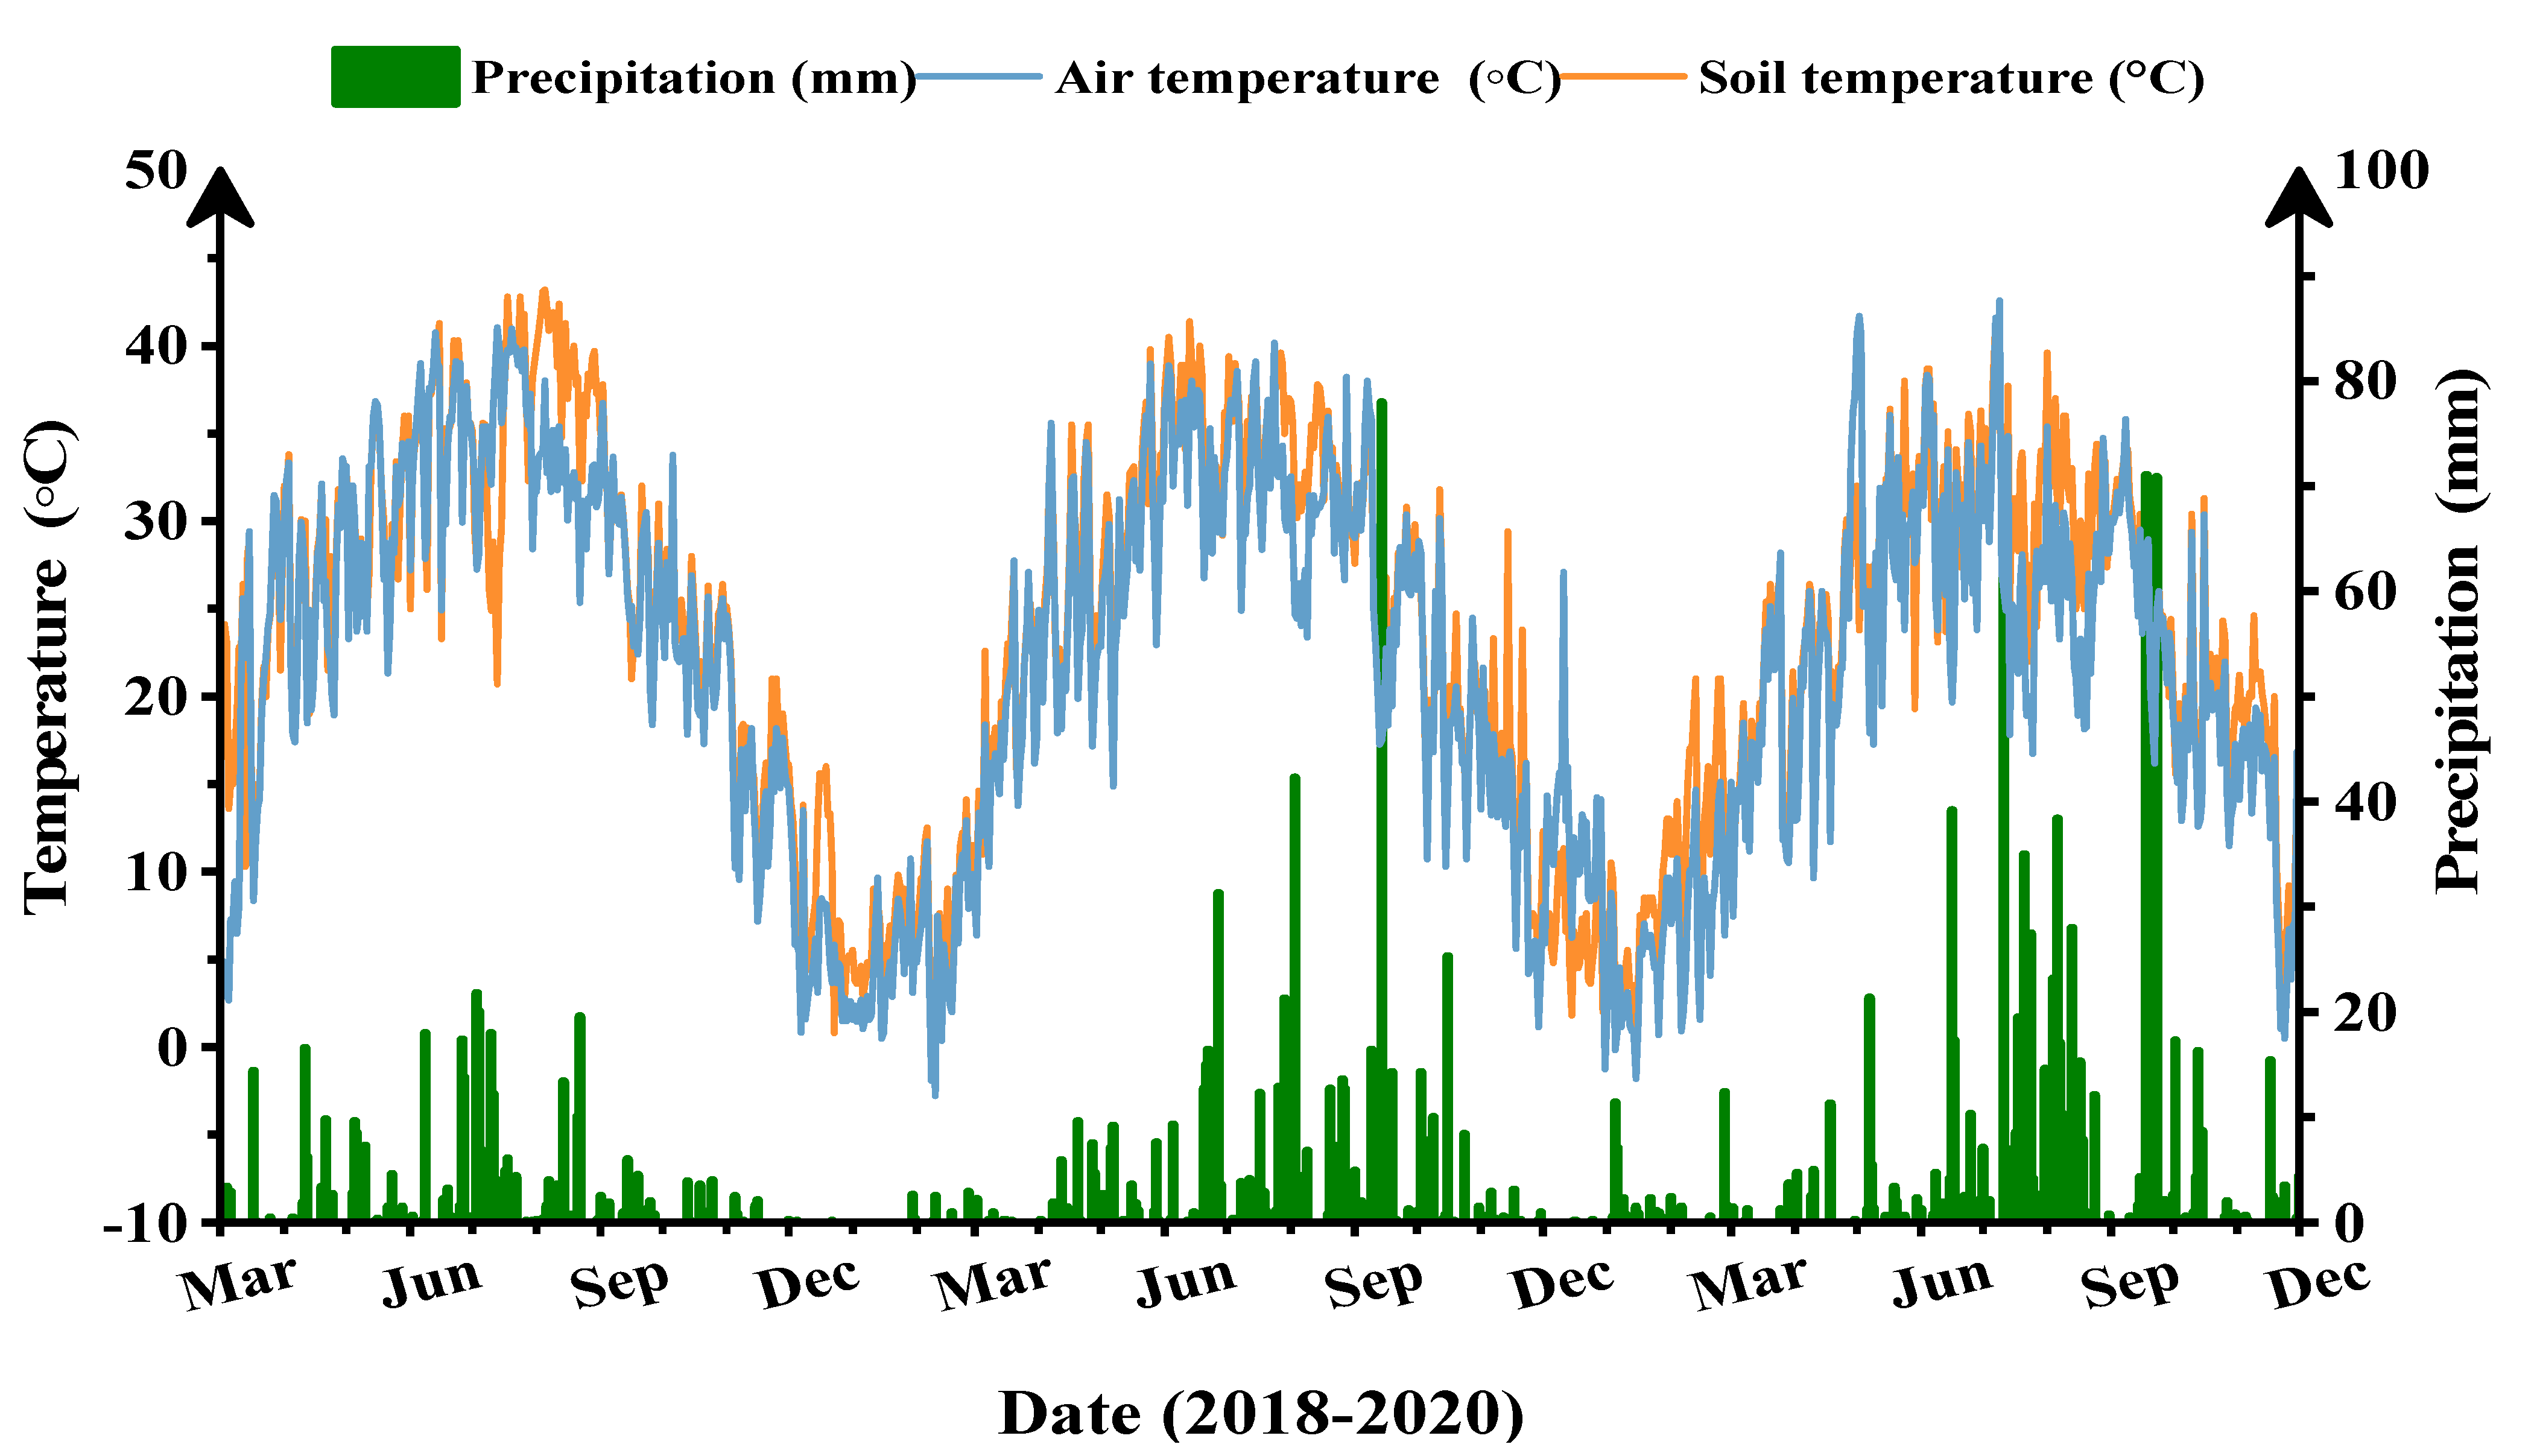
The experimental area is located at the Apple Test Station of Northwest Agriculture and Forestry University, Baishui County, Weinan, China (35°21′ N, 109°56′ E), at 850 m above sea level (Figure 1). The climate is humid subtropical, and dry in winter with a mean annual precipitation of 109.65 mm and a mean annual temperature of 10.04 °C. The average annual rainfall from 2018 to 1019 was around 390, 627, and 719.10 mm, and it increased in 2020, which was 9.00 and 26.20% higher than those in 2018 and 2019 (Figure 2). In January 2018, the lowest air temperature was −10 °C and the highest temperature was 42 °C in July 2020. The annual average temperature was 19.44, 19.23, and 18.02 °C from 2018 to 2020, respectively. The average soil temperatures in PM and NM in 0 to 20 cm soil depth were 24.60 to 22.61 °C, and 22.87 to 21.29 °C, respectively (Figure 2).
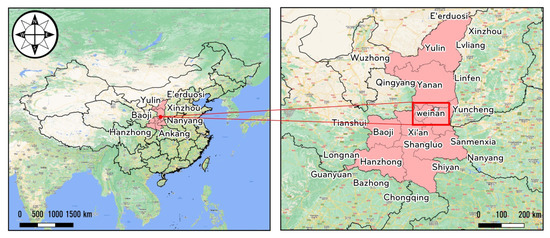
Figure 1.
A map of Baishui County, Weinan City, Shaanxi Province, China, showing the location of the sampling site in the experimental study area.
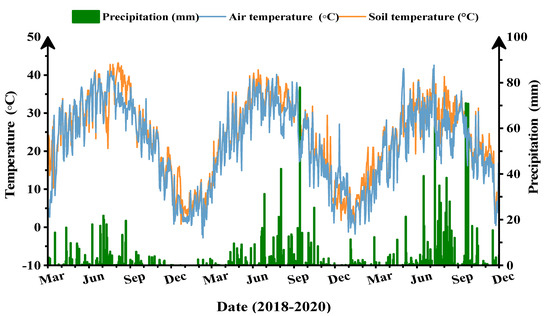
Figure 2.
Total precipitation and soil and air temperature of Apple Test Station of Northwest Agriculture and Forestry University, Baishui County, Weinan City, Shaanxi Province. Dark green: precipitation, blue: air temperature, and orange: soil temperature (0 to 20 cm depth, °C).
There was no irrigation system in the experimental area. The amount of WFPS mostly increased after rain. The WFPS content in PM in July was lower than in NM because PM sites lacked rain. The WFPS content in both PM and NM decreased after the rainy season. However, the evaporation of water in soil and water storage capacity in PM was higher than in NM. WFPS average content in PM and NM was around 17.38 to 31.49% and 16.44 to 26.23%, which increased from 3.74 to 27.81% in PM, compared to that in NM (Table S1).
According to the United States Department of Agriculture’s (USDA) soil classification, the experimental soil type is silty loam. The characteristic of soil at a depth of 0 to 20 cm was loam consisting of silt (67%), clay (25%), and sand (8%). The soil organic matter (SOM), total nitrogen (TN), superphosphate (P2O5), potassium sulfate (K2O), soil bulk density, and pH were 13.00, 1.00, 15.90, 151.30 g kg−1, 1.42 g cm−3, and 8.20, respectively.
2.2. Experimental Design
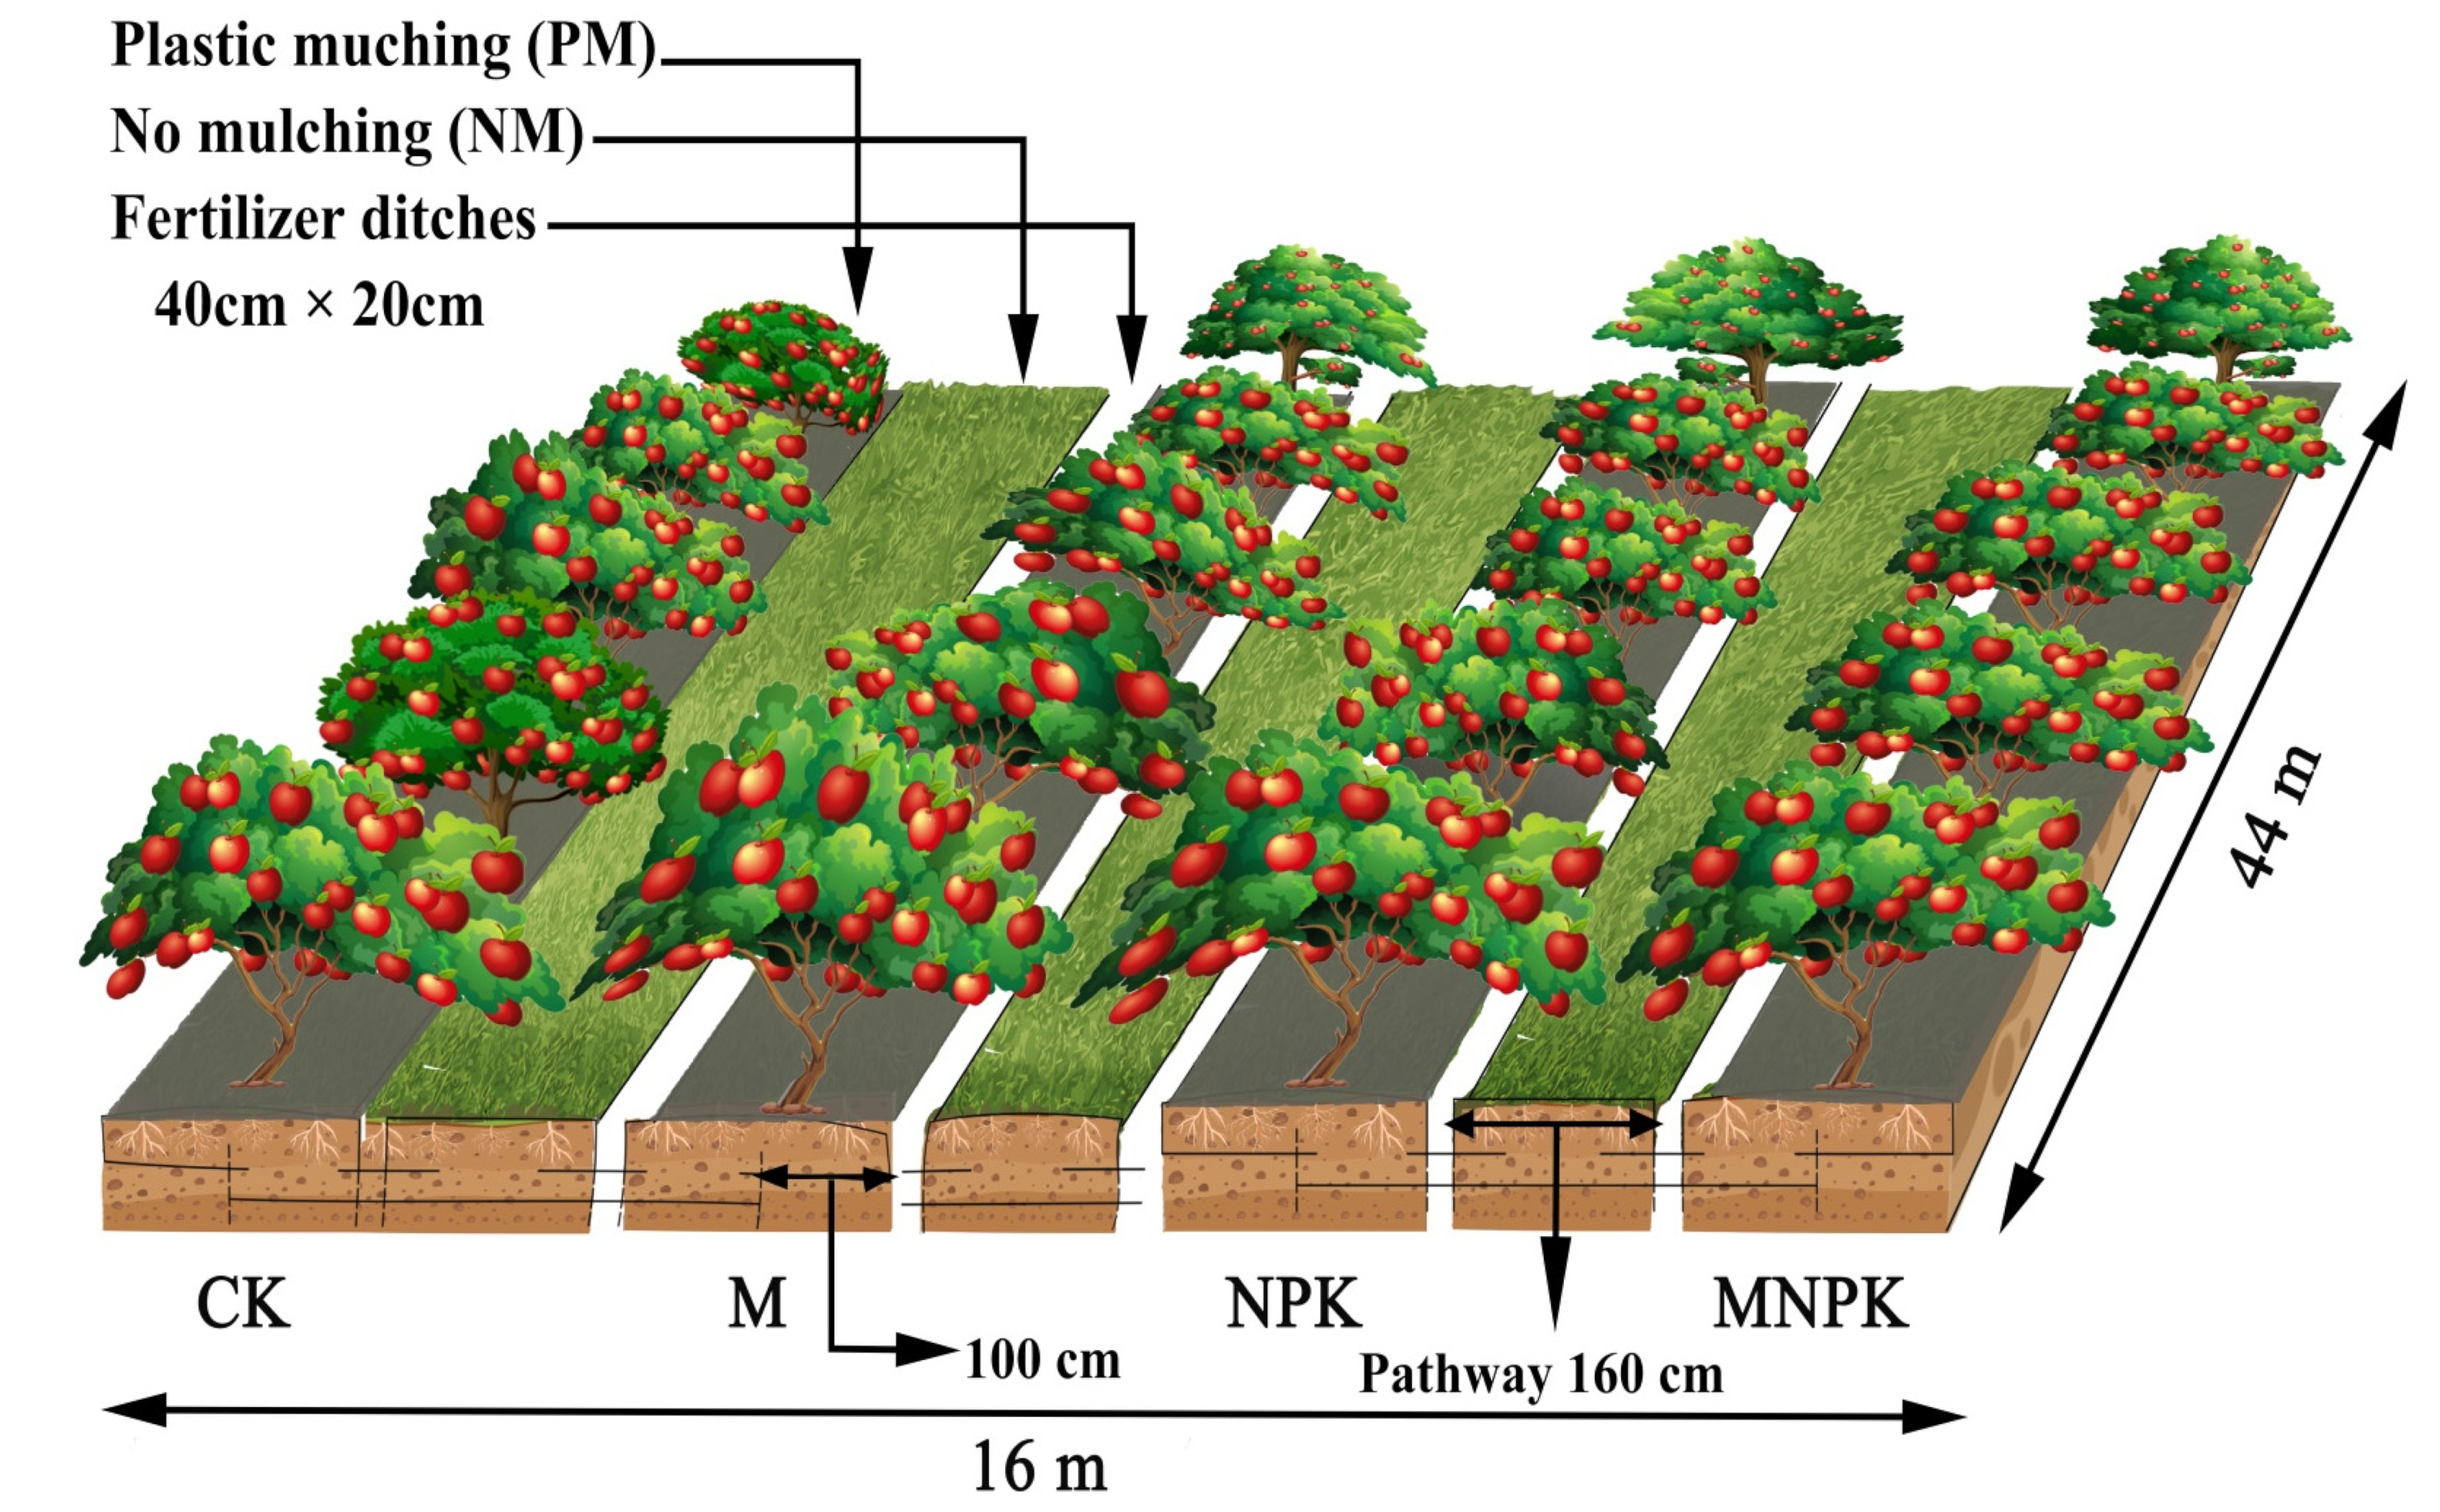
The Fuji apple tree (Malus domestica Borkh) was planted in this study, and the orchard was planted in 2008 and began bearing fruit in 2010. The plant density was 1200 apple trees ha−1, 22 were planted in a row and 2 × 4 m apart from one another. The experiment was laid out in a two factorial randomized complete block design with three replicates. The experiment was divided into two factors (mulching and fertilizers): (1) mulching treatments: plastic film (PM) and no mulching (NM); and (2) four fertilizer treatments: control (CK), organic fertilizer (M), inorganic fertilizer (NPK), and organic combined with inorganic fertilizer (MNPK) (Figure 3).
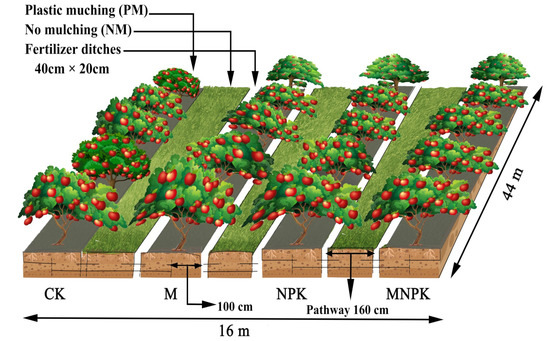
Figure 3.
Experimental layout of the apple orchard.
The soil was manually covered by black polyethylene plastic film with 0.02 mm thick on both sides of the tree, 1 m on each side. No mulching treatments covered the areas between apple tree rows, which had natural grass. The fertilization of the plant occurred by digging a ditch at 40 cm × 20 cm (depth × width) near the apple trees (Figure 3). The fertilizer application programs for the apple orchard during the growing season included: 1. Inorganic fertilizer, including urea containing 46% N (Shaanxi Coal and Chemical Industry Group Co., Ltd., Xi’an, China) was applied three times a year (65% in November for maintaining apple trees after harvesting, 15% in May for flowering, and 20% in August for crop growth). 2. Superphosphate containing 16% P2O5 (Shifang KonLon Chemical Co., Ltd., Liaocheng, Shifang, China) was applied three times a year (70% in November for maintaining apple trees after harvesting, 20% in May for flowering, and 10% in August for crop growth). 3. Potassium sulfate containing 50% K2O (Jiangsu Kolod Food Ingredients Co., Ltd., Lianyungang, China) was applied three times a year (40% in November for maintaining apple trees after harvesting, 20% in May for flowering, and 40% in August for crop growth). 4. Organic fertilizer from sheep manure (Hebei Fengnong Organic Fertilizer Manufacturing Co., Ltd., Baoding, China) was applied once a year in November to maintain apple trees after harvesting. The organic fertilizer included OM, TN, P2O5, and K2O, accounting for 35.05 g kg−1, 6.01 g kg−1, 39.05 mg kg−1, and 41.10 mg kg−1, respectively (Table 1).

Table 1.
The amount of fertilizer applied and different types of fertilizers used in different treatments (kg ha−1).
2.3. Collection and Calculation of Samples
2.3.1. Collection of Gas Samples
The experiment ran between March 2018 and December 2020. The collection of gas samples was conducted [40] by using the closed-chamber method (Beijing Rongxingxiai Design Studio, Beijing, China). The closed chamber made of stainless-steel was divided into two parts. The first part was the chamber base with a size of 41 × 21 × 17 cm (height × length × width). The lid was opened, and the top edge of the chamber was specially designed with a groove size of 2 × 3 cm (width × depth). The chamber was able to contain water to prevent gas leakage during the collection of gas samples.
The second part of the closed chamber was designed with a size of 40 × 20 × 15 cm (height × length × width). The lid was closed to cover the base of the upper part. The chamber was wrapped by insulation (Linguan Co., Ltd., Renqiu, China), to prevent temperature change caused by sunlight reflecting directly from outside to inside the closed chamber. Fans (Shenzhen Fluence Tech Co., Ltd., Shenzhen, China) were installed in the chamber. The airflow direction was formed by the fans for mixing gas within a closed chamber. A 5 mm hole was drilled on top of the chamber to install a thermometer (People’s Electrical Appliances Group., Ltd., Wenzhou, China), and a 10 mm hole was drilled on one side of the chamber to install a silicone tube (Dongguan Mingjing Silicone Products Co., Ltd., Dongguan, China) from inside to outside the chamber in order to suck out gas samples from the chamber.
The PM was removed a bit when the sample was collected in the PM, and the PM was put back after finishing collecting the samples.
The gas samples were normally collected once a week and were collected four times in one chamber within 0, 10, 20, and 30 min. However, it depended on suitability, such as after rain in summer and one to two days after fertilization. Gas could collected from 08.00 a.m. to 11.30 a.m. [41].
The stainless steel chamber was made up of two parts: the base and the cover. To prevent air leaks from the stainless steel base during gas sampling, a water trap was installed and gas samples were taken from the chamber using a needle and 50 mL syringe. Gas samples were kept in a 0.50 L air bag with aluminum foil to regulate the constant temperature and maintain the quality of the samples before being taken to the laboratory within 24 h for GHG analysis (Changde Beekman Biotechnology Co., Ltd., Changde, China).
A gas chromatograph-7890B (Agilent, Santa Clara, CA, USA) was used to analyze the concentrations and GHG fluxes by using the syringe to remove a gas sample from Dalian Pulaite and inject it into the gas chromatograph-7890B every 4 min. The N2O concentrations were measured by an electron capture detector (ECD), while the CO2 and CH4 concentrations were measured by an ion detector. GHG concentrations (N2O, CO2, and CH4) were measured in ppm then transformed to mg m−2 h−1 by using the following equation by Mehmood et al. [42]:
where F refers to the average flux of N2O, CO2, and CH4 (mg m−2 h−1) in the soil, μ refers to the molar mass of N2O, CO2, and CH4 (g mol−1) in the soil, H refers to the height of closed stainless-steel chamber (cm), P refers to the standard atmospheric pressure in the experimental area (1.01 × 10⁵ Pa), R refers to the value of gas constant (8.31 J mol−1 kg−1), T refers to the temperature inside the closed chamber measured during the sampling period (°C), and dc/dt refers to the exchange rate of concentrations of N2O, CO2, and CH4 in the closed stainless-steel chamber (mL m−3 h−1).
The total annual cumulative emissions of N2O, CO2, and CH4 in the apple orchard were measured by using the following equation by Liu et al. [43]:
where M refers to the average cumulative flux of N2O, CO2, and CH4 (kg ha−1) in the soil, F refers to the average fluxes of N2O, CO2, and CH4 (mg m−2 h−1) in the soil, i refers to the gas sampling, (ti+1 − ti) refers to the sampling period during which samples were continually collected for two to three days, n refers to the total number of sample collection, and 24 is used for unit conversion.
According to annual cumulative GHG emissions (N2O, CO2, and CH4), the carbon dioxide equivalent (CO2) based on the integrated global warming potential (GWP) of N2O, CO2, and CH4 emissions was calculated using the following equation by Liu et al. [43].
GWP refers to the measurement of how much heat is absorbed by N2O, CO2, and CH4 (kg CO2-eq ha−1). The GWP of N2O and CH4 emissions are 298 and 25 times that of CO2, with an average residence time of 100 years.
The GHGI was determined according to the method of Xu et al. [44]:
The direct N2O emission factor (EFd) was determined by a standard method of Toma et al. [45]:
where FN refers to the annual emissions of N2O in nitrogen (N) fertilizer treatment (kg ha−1) and FCK refers to the annual emissions of N2O in the treatment without fertilizer application (kg ha−1).
2.3.2. Soil Sample Collection Process
Soil samples were collected once a week. The sample collection processes were: digging soil at 0 to 40 cm soil depth with a soil auger (8 cm diameter), separating the refuse from the soil, packing the consequent soil samples in a 100 g plastic bag, and sending them to the laboratory for further analysis.
The soil samples were divided into two parts: fresh soil and air-dried soil. Air-dried soil was soil dried in the oven for 12 h at a temperature of 105 °C. After being dried, the air-dried soil was ground by a soil grinder mill and filtered by a 2 mm test sieve. The consequent soil was packed in a plastic bag for further analysis.
For soil moisture and soil bulk density analysis, the soil samples were put in aluminum moisture content tins (6 cm diameter and 5 cm depth) to weigh before being dried and then dried in the oven for one day at 100 to 120 °C to analyze soil bulk density and water-filled pore space. The formula of Weijie and Li [46] was used to calculate WFPS:
where wi refers to the water-filled pore space (%) in the experimental area, Wi refers to the soil water holding capacity (mm), ΔS refers to the moisture content in the soil (mm), Mi refers to the weight of the wet soil (g), Mi refers to the weight of the oven-dried soil (g), γi refers to the soil bulk density (g cm−3) in the experimental area, h refers to the depth of the sampling soil (cm), and Wo refers to the soil water.
To analyze the intensity of ammonium and nitrate (NO3−-N and NH4+-N), 5 g of fresh soil and potassium chloride (KCL) 2M solution (1:5 soil:solution) were put in a centrifuge (50 mL) and shaken at 250 rounds per minute. Then, the soil sample was put in the centrifuge refrigerator with a centrifugal speed of 5000 rounds per minute.
The consequent samples were filtered with a filter paper and stored at −10 °C. NO3−-N and NH4+-N were analyzed using the salicylate-nitroprusside-hypochlorite method, with the absorbance at 600 nm. NO3−-N reduced to NO2− was analyzed using the VCl3 salicylate-nitroprusside-hypochlorite method, with the absorbance at 540 nm [47].
To analyze the total nitrogen (TN) in the soil, the soil samples were divided using sulfuric acid (H2SO4) with the Kjeldahl method at a temperature of 360 °C, and then they were refined by N distillation system, Kjeltec™ 9. The distilled solution was titrated with a standard solution. The observation showed that the NO3−-N terminated when H2SO4 was around 0.02. The solution changed its color from purple to red, and the standard of H2SO4 was recorded to calculate the TN in the soil.
To analyze the intensity of phosphorus (P), the Bray II method was used; 1.00 g of air-dried soil and 10 mL of solution were put in an Erlenmeyer flask (50 mL) and shaken for 1 min. The consequent samples were filtered with 11 cm NO.5 filter paper. The extracted and working solutions (1:16) were sucked by pipette and put in a centrifuge and left for half an hour. The light absorption of the samples was measured using a spectrophotometer at the absorbance of 882 nm.
To analyze the potassium (K), 2.50 g of air-dried soil and 25 mL of 1 M ammonium acetate (NH4OAc) solution were put in an Erlenmeyer flask (50 mL), shaken for 30 min, and then filtered with 11 cm NO.5 filter paper. The consequent samples were analyzed using a Flame spectrophotometer.
To analyze the organic matter in the soil (SOM), the Walkley black modified method was used by mixing 1 g of air-dried soil, 10 mL of potassium dichromate (K2Cr2O7) 1.00 N solution, and 20 mL of H2SO4 solution in an Erlenmeyer flask (250 mL), and slightly shaking for 1 to 4 min. The solution was left until it reached room temperature, then, 50 mL of distilled water and five drops of O-phenanthroline were added. The samples were titrated using FAS 0.50 N solution. When the solution changed color from green to red-brown, the titration ended. The FAS content was recorded to calculate SOM in the soil.
To analyze the soil pH 1:1 (w/w), 20 g of air-dried soil and 20 mL of distilled water were put in a beaker and mixed with a glass rod for 30 min and left for 30 min.
Rainfall and temperature data are based on the Weinan meteorological bureau of Baishui County, which is about 2 km from the experimental area. The measurement of soil temperature was conducted using the meter (Dongguan Wanchuang Electronic Products Co., Ltd., Dongguan, China), at a depth of 0 to 20 cm.
2.4. Data Analysis and Evaluation
In this study, the primary data were organized and calculated by Microsoft Excel 2020 software (Microsoft Corporation, Washington, DC, USA). The statistical data were analyzed, and the normality of the data was tested by IBM SPSS 29.00 (SPSS Inc., Chicago, IL, USA). The differences in annual cumulative GHG emissions, GWP, GHGI, and apple yield in each treatment were evaluated using a one-way analysis of variance (ANOVA). The significant differences occurring between treatments at a significance level of 0.05 were determined by using Tukey’s multiple-range tests. The effects of each treatment and their interactions on GHG emissions, GWP, GHGI, and apple yield were analyzed by a two-way ANOVA. R version 4.3.0 software (R Core Team, Indianapolis, IN, USA) was used to determine the correlation between GHG emissions and soil properties (NH4+-N, NO3−-N, TN, SOM, WFPS content, and soil pH) and climate variables (rainfall and temperature). OriginPro software 2023.10 (OriginLab Corporation, Northampton, MA, USA) and Adobe Photoshop 2020.21.1.0 (Adobe Inc., San Jose, CA, USA) were used to create the graphs.
3. Results
3.1. Apple Yield
As shown in Table 2, throughout the study, the average apple yield ranged from 23.97 to 93.49 t ha−1. MNPK increased apple yield by approximately 51.72 to 93.43 t ha−1 in 2018 and 2019, with an overall average increase of 115.76% and 85.57% when compared to NPK. However, compared to M in 2020, apple yield in the MNPK treatment decreased by 4.12%.

Table 2.
Effects of different management practices on GHG emissions in the apple orchard.
This indicated that the integrated use of organic and inorganic fertilizer in MNPK treatment and the single use of organic fertilizer in M treatment were more effective for improving apple yield than NPK (p < 0.05).
3.2. Ammonium Nitrogen and Nitrate Nitrogen Dynamics and Greenhouse Gases in Apple Orchards
3.2.1. Ammonium Nitrogen and Nitrate Nitrogen Dynamics in Apple Orchards
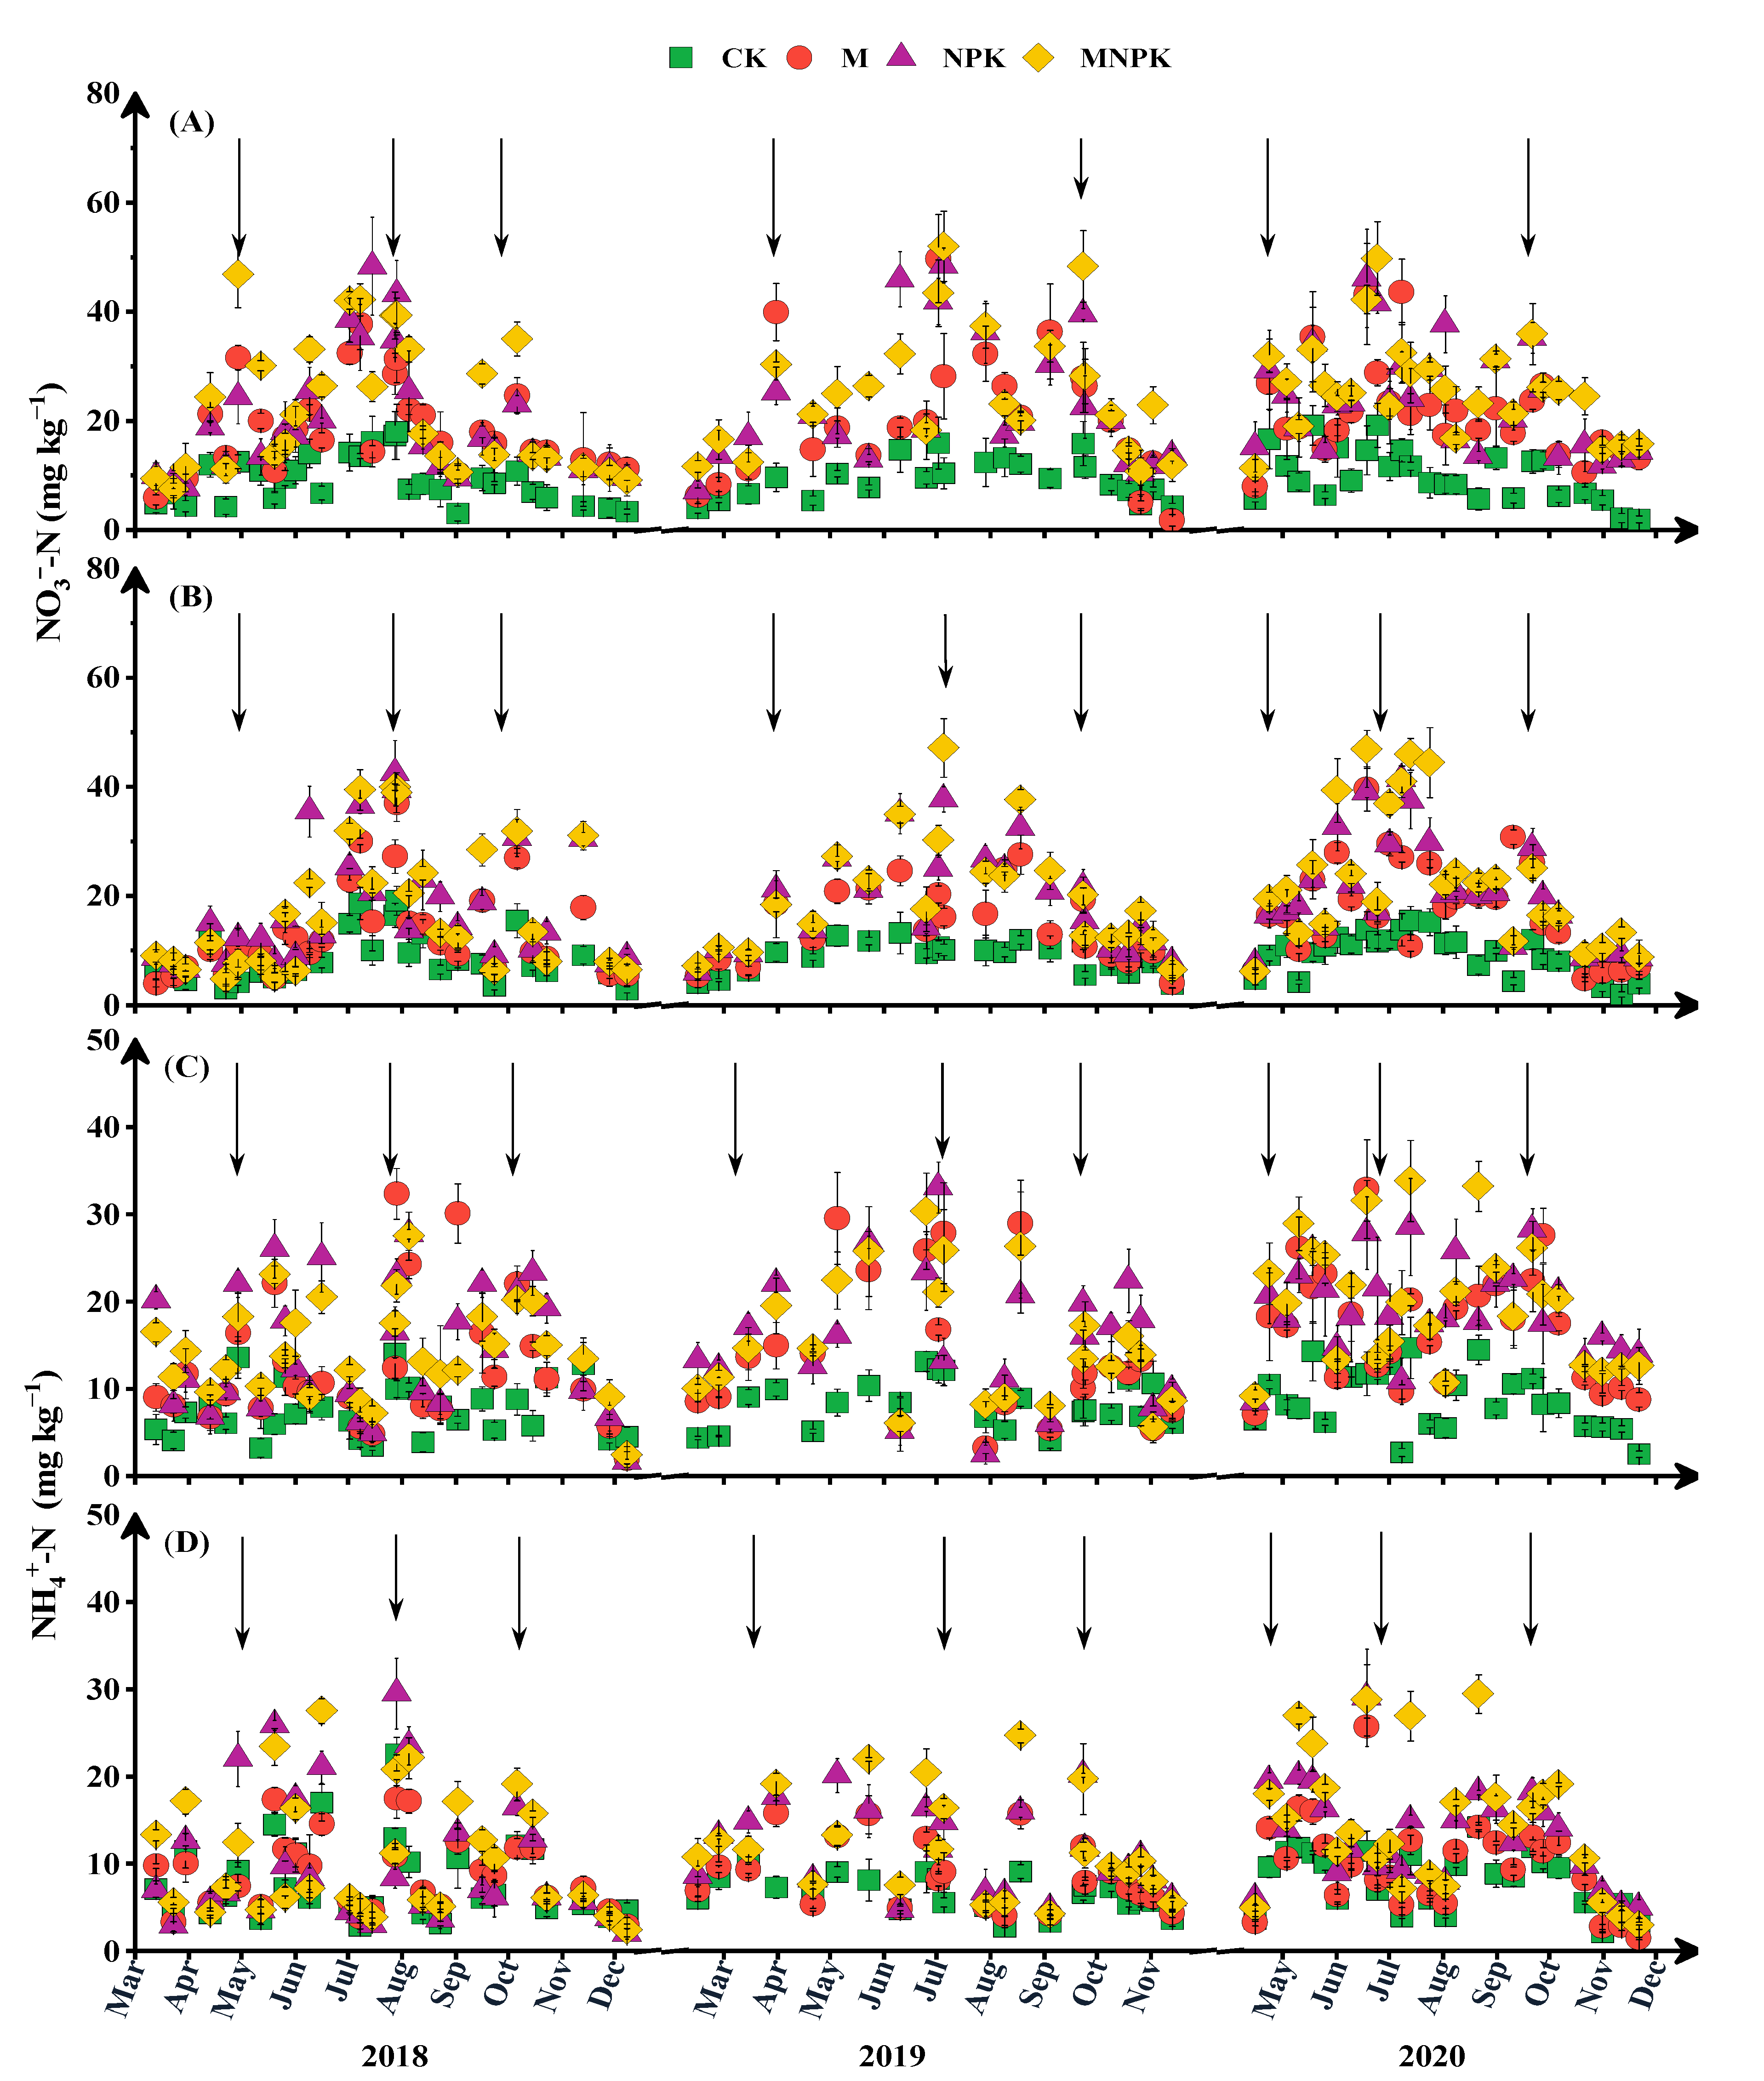
The highest NO3−-N content was observed mostly in July in MNPK and NPK treatments of both PM (49.78 mg kg−1) and NM (45.17 mg kg−1) from 2018 to 2020 (Figure 4A,B). The average content of NO3−-N in PM and NM ranged from 9.05 to 27.73 mg kg−1 in PM and from 8.65 to 23.13 mg kg−1 in NM. The highest NO3−-N content in different sub treatments was observed in MNPK in both PM and NM with 25.54 and 20.18 mg NO3−-N kg−1, respectively (Table S1).
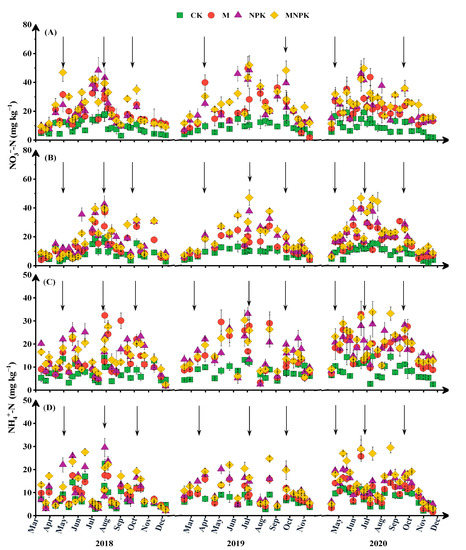
Figure 4.
The NO3−-N and NH4+-N content in the apple orchard under different management measures, (A) NO3−-N in the plastic mulching treatment, (B) NO3−-N in the no mulching treatment, (C) NH4+-N in the plastic mulching treatment, and (D) NH4+-N in the no mulching treatment, control CK, organic fertilizer M, inorganic fertilizer NPK, and organic combined with inorganic fertilizer MNPK. The black arrow pointing down indicates the time of fertilization.
The highest NH4+-N content was observed mostly in June in MNPK and NPK treatments of both PM (36.86 mg kg−1) and NM (30.56 mg kg−1) from 2018 to 2020 (Figure 4C,D). The cumulative amount of NH4+-N ranged from 7.64 to 22.42 mg kg−1 in PM and from 8.15 to 15.33 mg kg−1 in NM. The highest NH4+-N content in different sub treatments was observed in MNPK in both PM and NM with 18.61 and 12.83 mg NH4+-N kg−1, respectively (Table S1).
3.2.2. Greenhouse Gas Emissions in the Apple Orchard (N2O, CO2, and CH4)
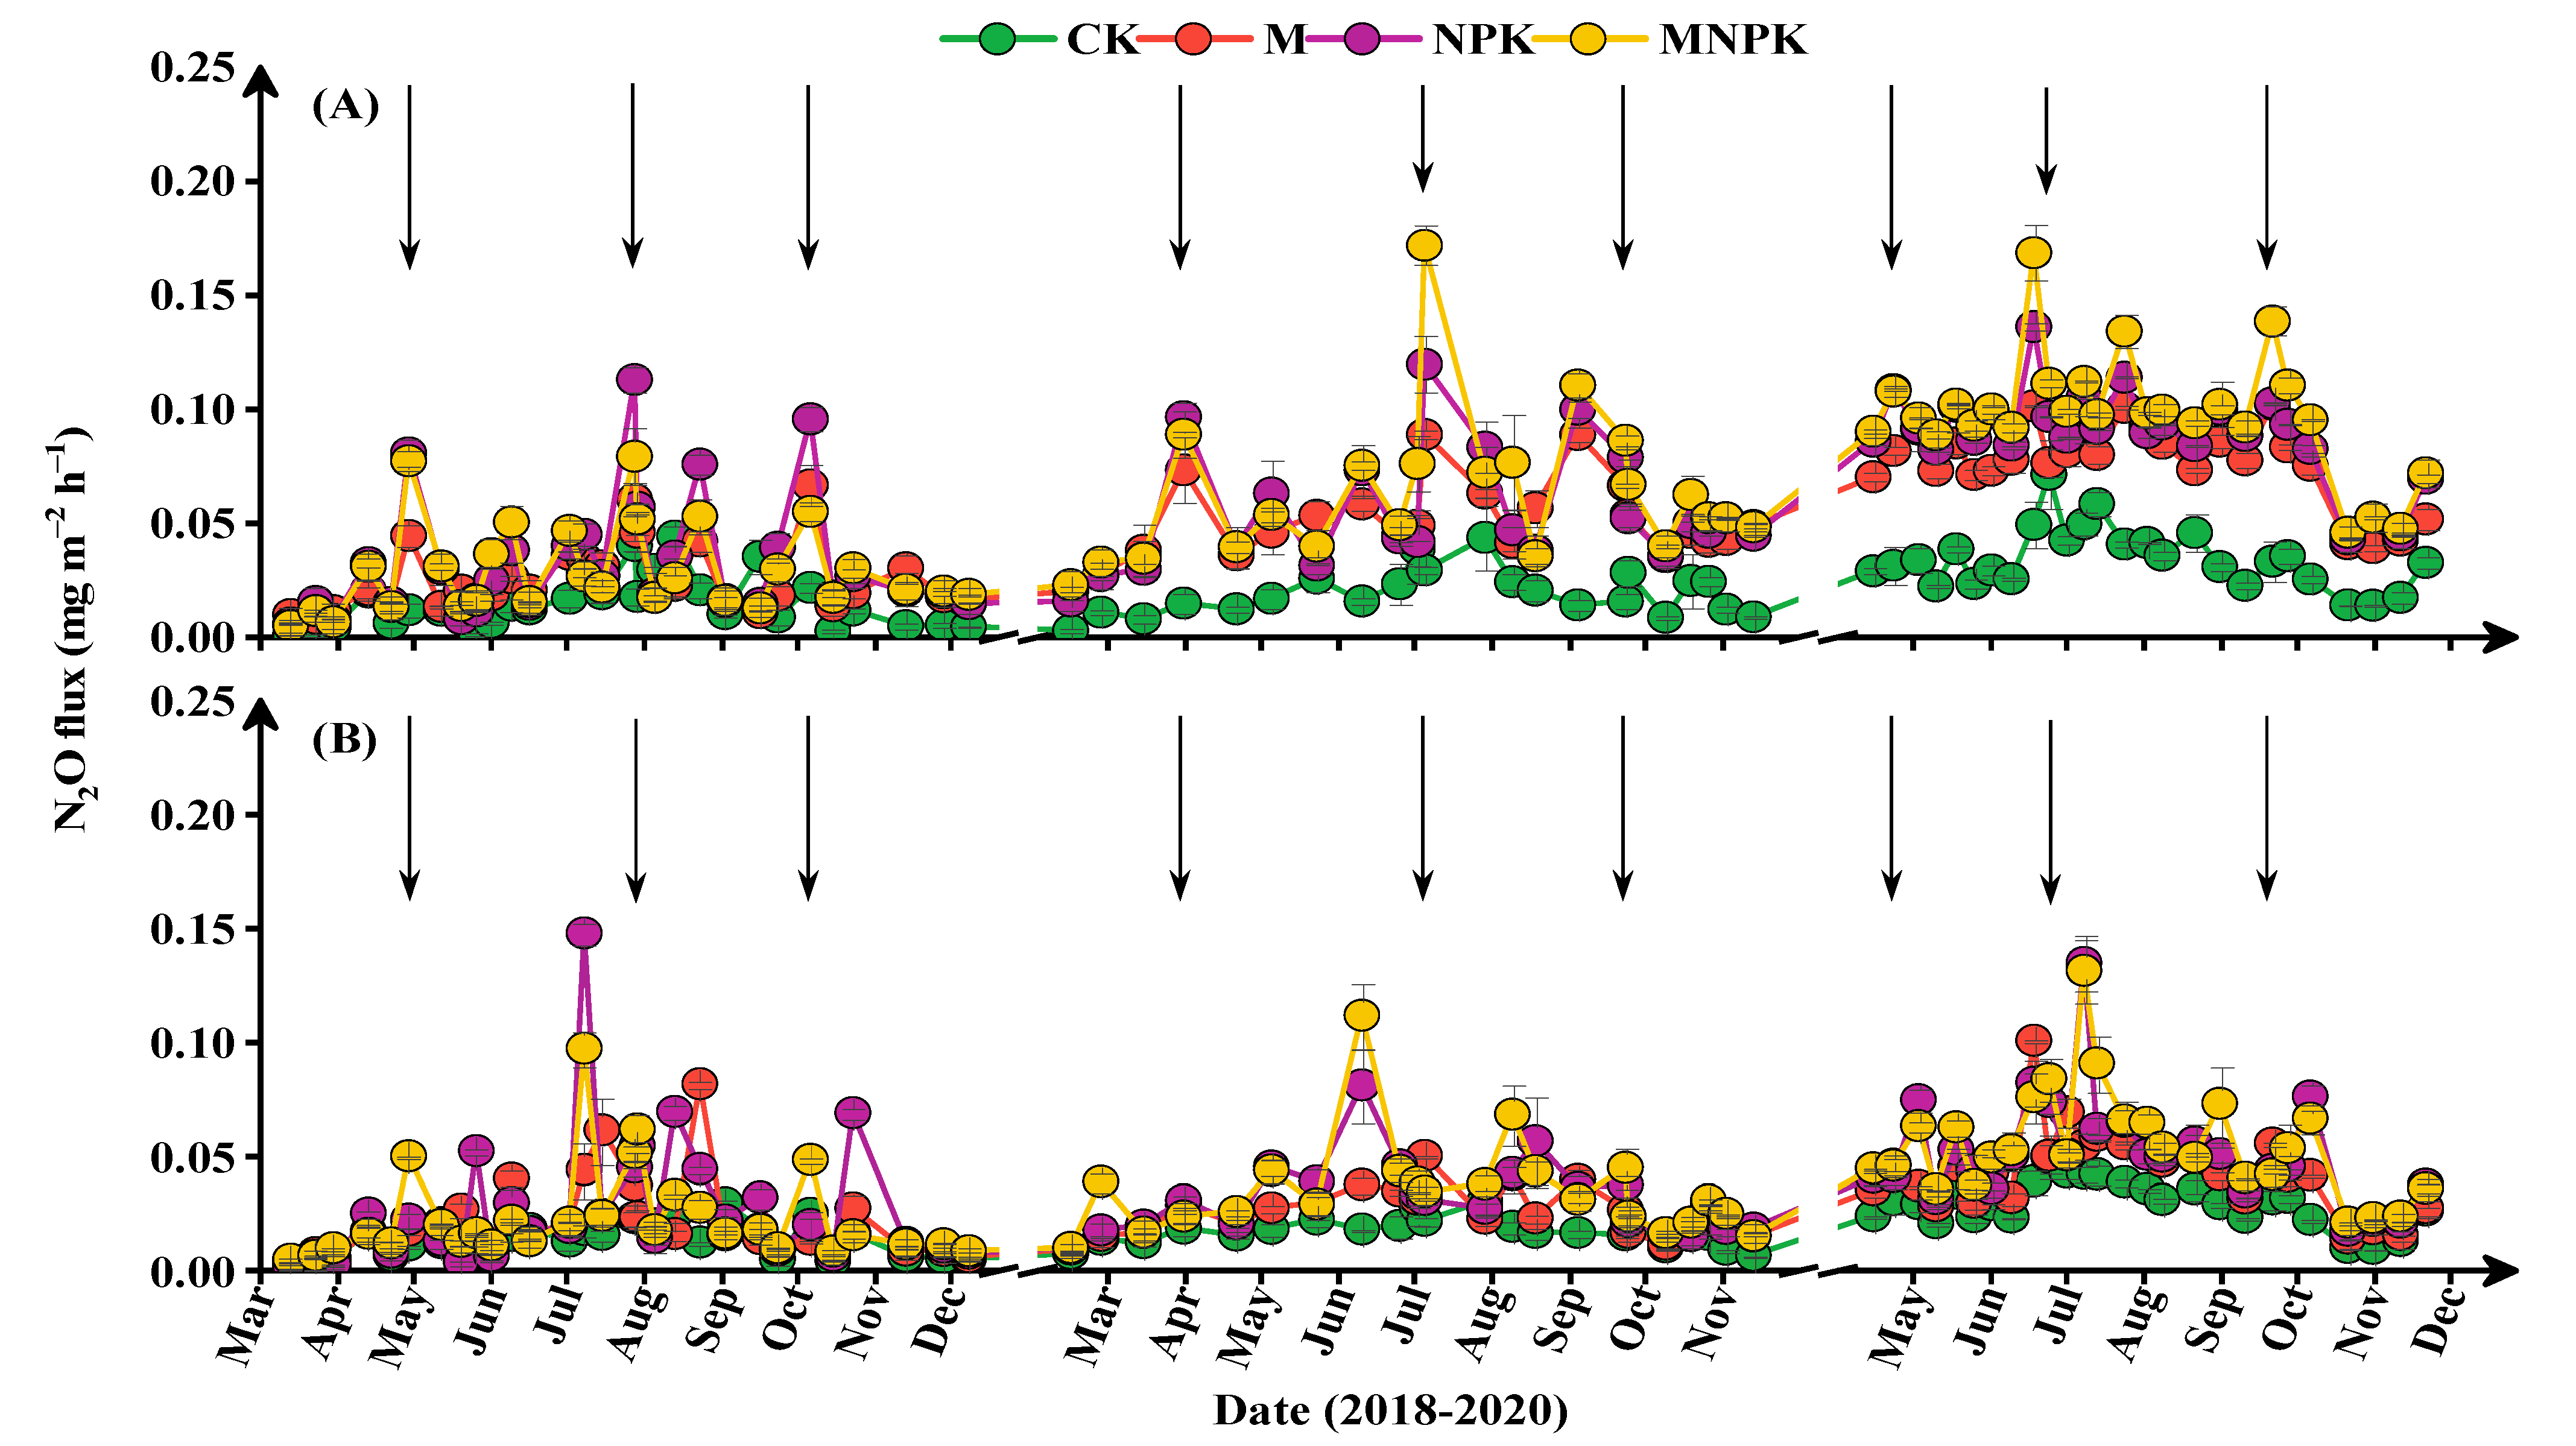
The highest N2O flux was observed in July of every season (2018 to 2020) in NPK and MNPK treatments under PM and NM. The highest N2O fluxes in PM were 0.11, 0.19, and 0.17 mg m−2 h−1 on 28 July 2018, 24 July 2019, and 7 July 2020, respectively, while the highest N2O fluxes in MN were 0.15, 0.11, and 0.13 mg m−2 h−1 on 8 July 2018, 29 June 2019, and 27 July 2020, respectively (Figure 5A,B).
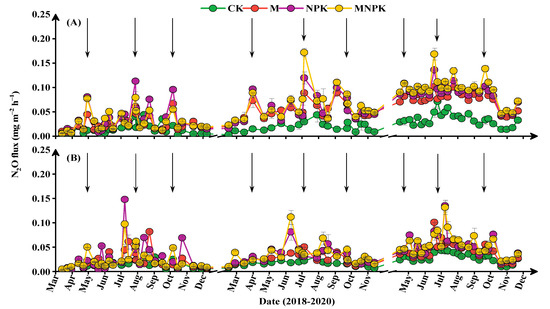
Figure 5.
Effect of the N2O emission rate in the apple orchard under different management measures, (A) plastic mulching PM, (B) no mulching NM, control CK, organic fertilizer M, inorganic fertilizer NPK, and organic combined with inorganic fertilizer MNPK. The black arrow pointing down indicates the time of fertilization.
The average annual N2O emissions ranged from 0.87 to 5.07 kg ha−1 in PM and from 0.75 to 2.90 kg ha−1 in NM. The N2O emissions in PM under MNPK (3.73 kg ha−1) were significantly different from 2.24 kg ha−1 in NM under MNPK, and the N2O emissions of different treatments were ranked as follows: MNPK > NPK > M > CK (Table 2).
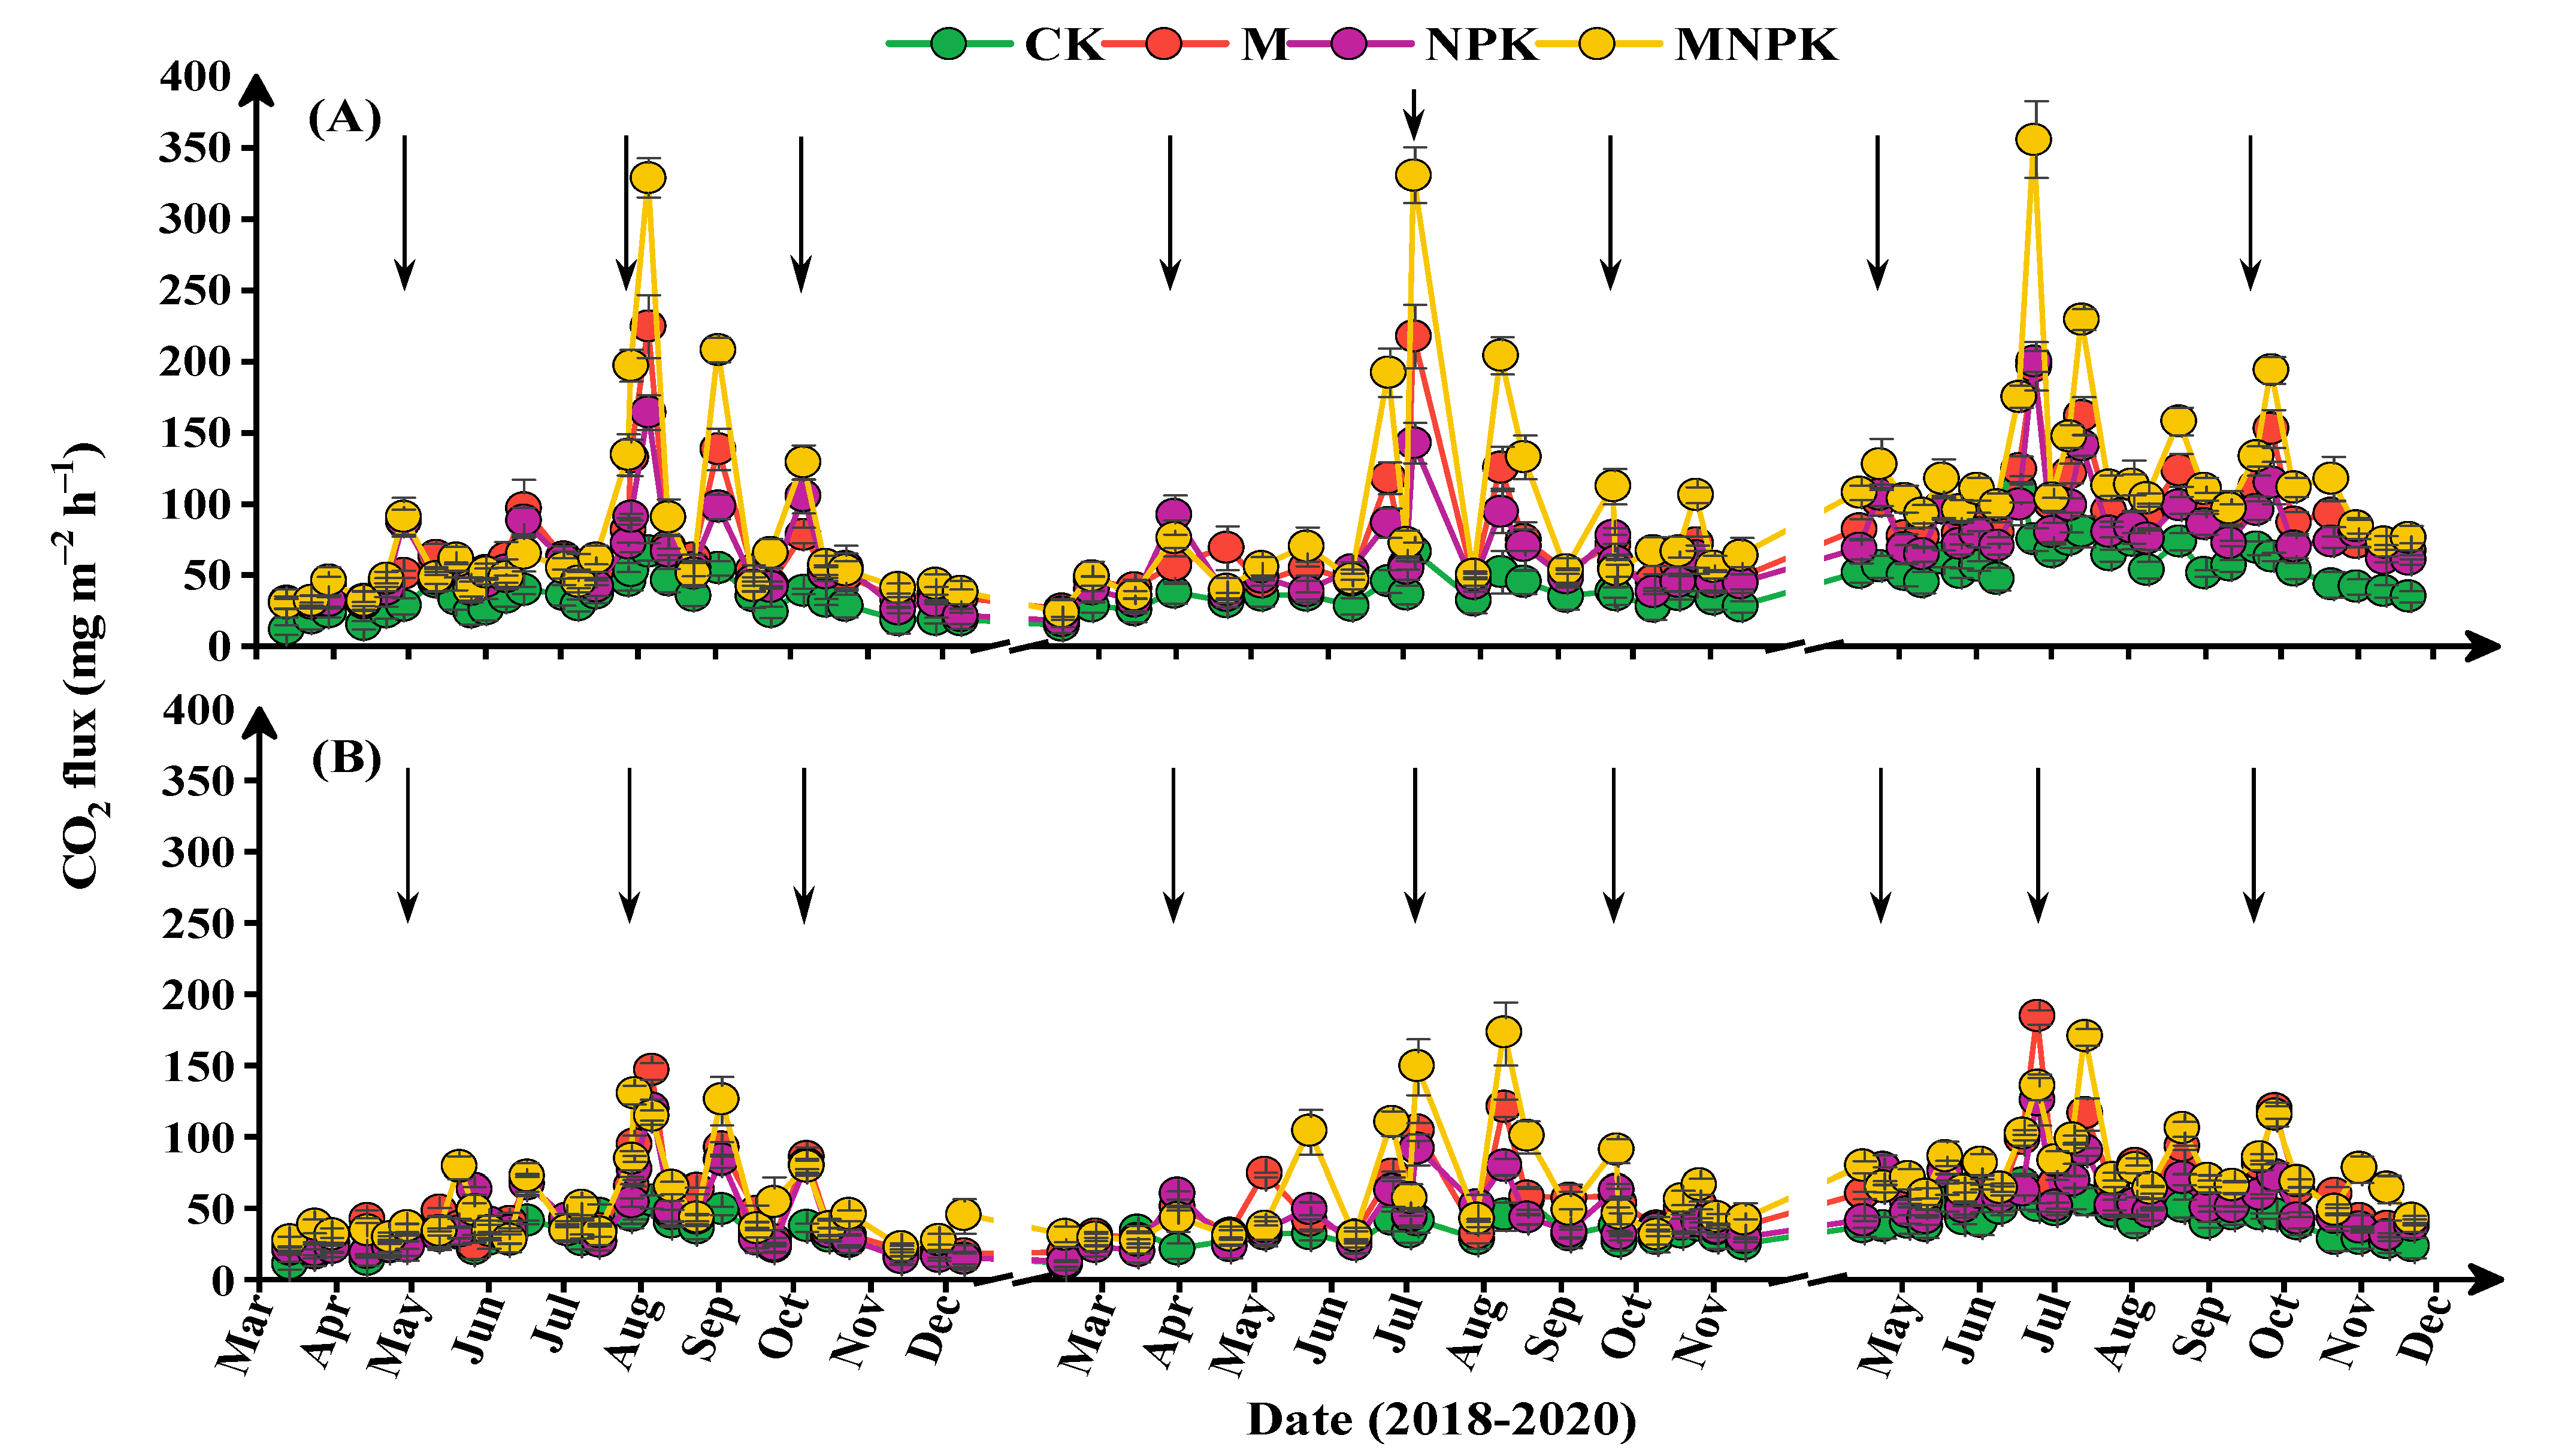
The average daily CO2 fluxes ranged from 12.20 to 356.09 mg m−2 h−1 in PM and from 11.24 to 185.00 mg m−2 h−1 in NM. The highest rise of CO2 fluxes appeared in MNPK treatment under PM after yearly fertilization and 2 to 3 days after rain, increasing by 329.25, 331.05, and 356.09 mg m−2 h−1 recorded on 5 August 2018, 24 July 2019, and 13 July 2020, respectively, while in NM, the highest CO2 fluxes were 147.12, 173.52, and 185.00 mg m−2 h−1 recorded on 5 August 2018, 28 August 2019, and 13 July 2020, respectively (Figure 6A,B).
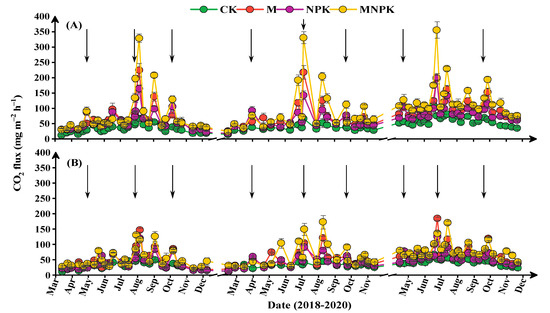
Figure 6.
Effect of the CO2 emission rate in the apple orchard under different management measures, (A) plastic mulching PM, (B) no mulching NM, control CK, organic fertilizer M, inorganic fertilizer NPK, and organic combined with inorganic fertilizer MNPK. The black arrow pointing down indicates the time of fertilization.
The average annual cumulative CO2 emissions ranged from 2.10 to 6.68 t ha−1 in PM and from 1.98 to 4.27 t ha−1 in NM. The MNPK treatment in both PM and NM differed considerably from other treatments and was ranked as follows: CK > MNPK > MNPK > NPK > CK. The average annual cumulative CO2 emissions in MNPK were 5.72 t ha−1 in MNPK under PM and 3.87 t ha−1 in MNPK under NM (Table 2).
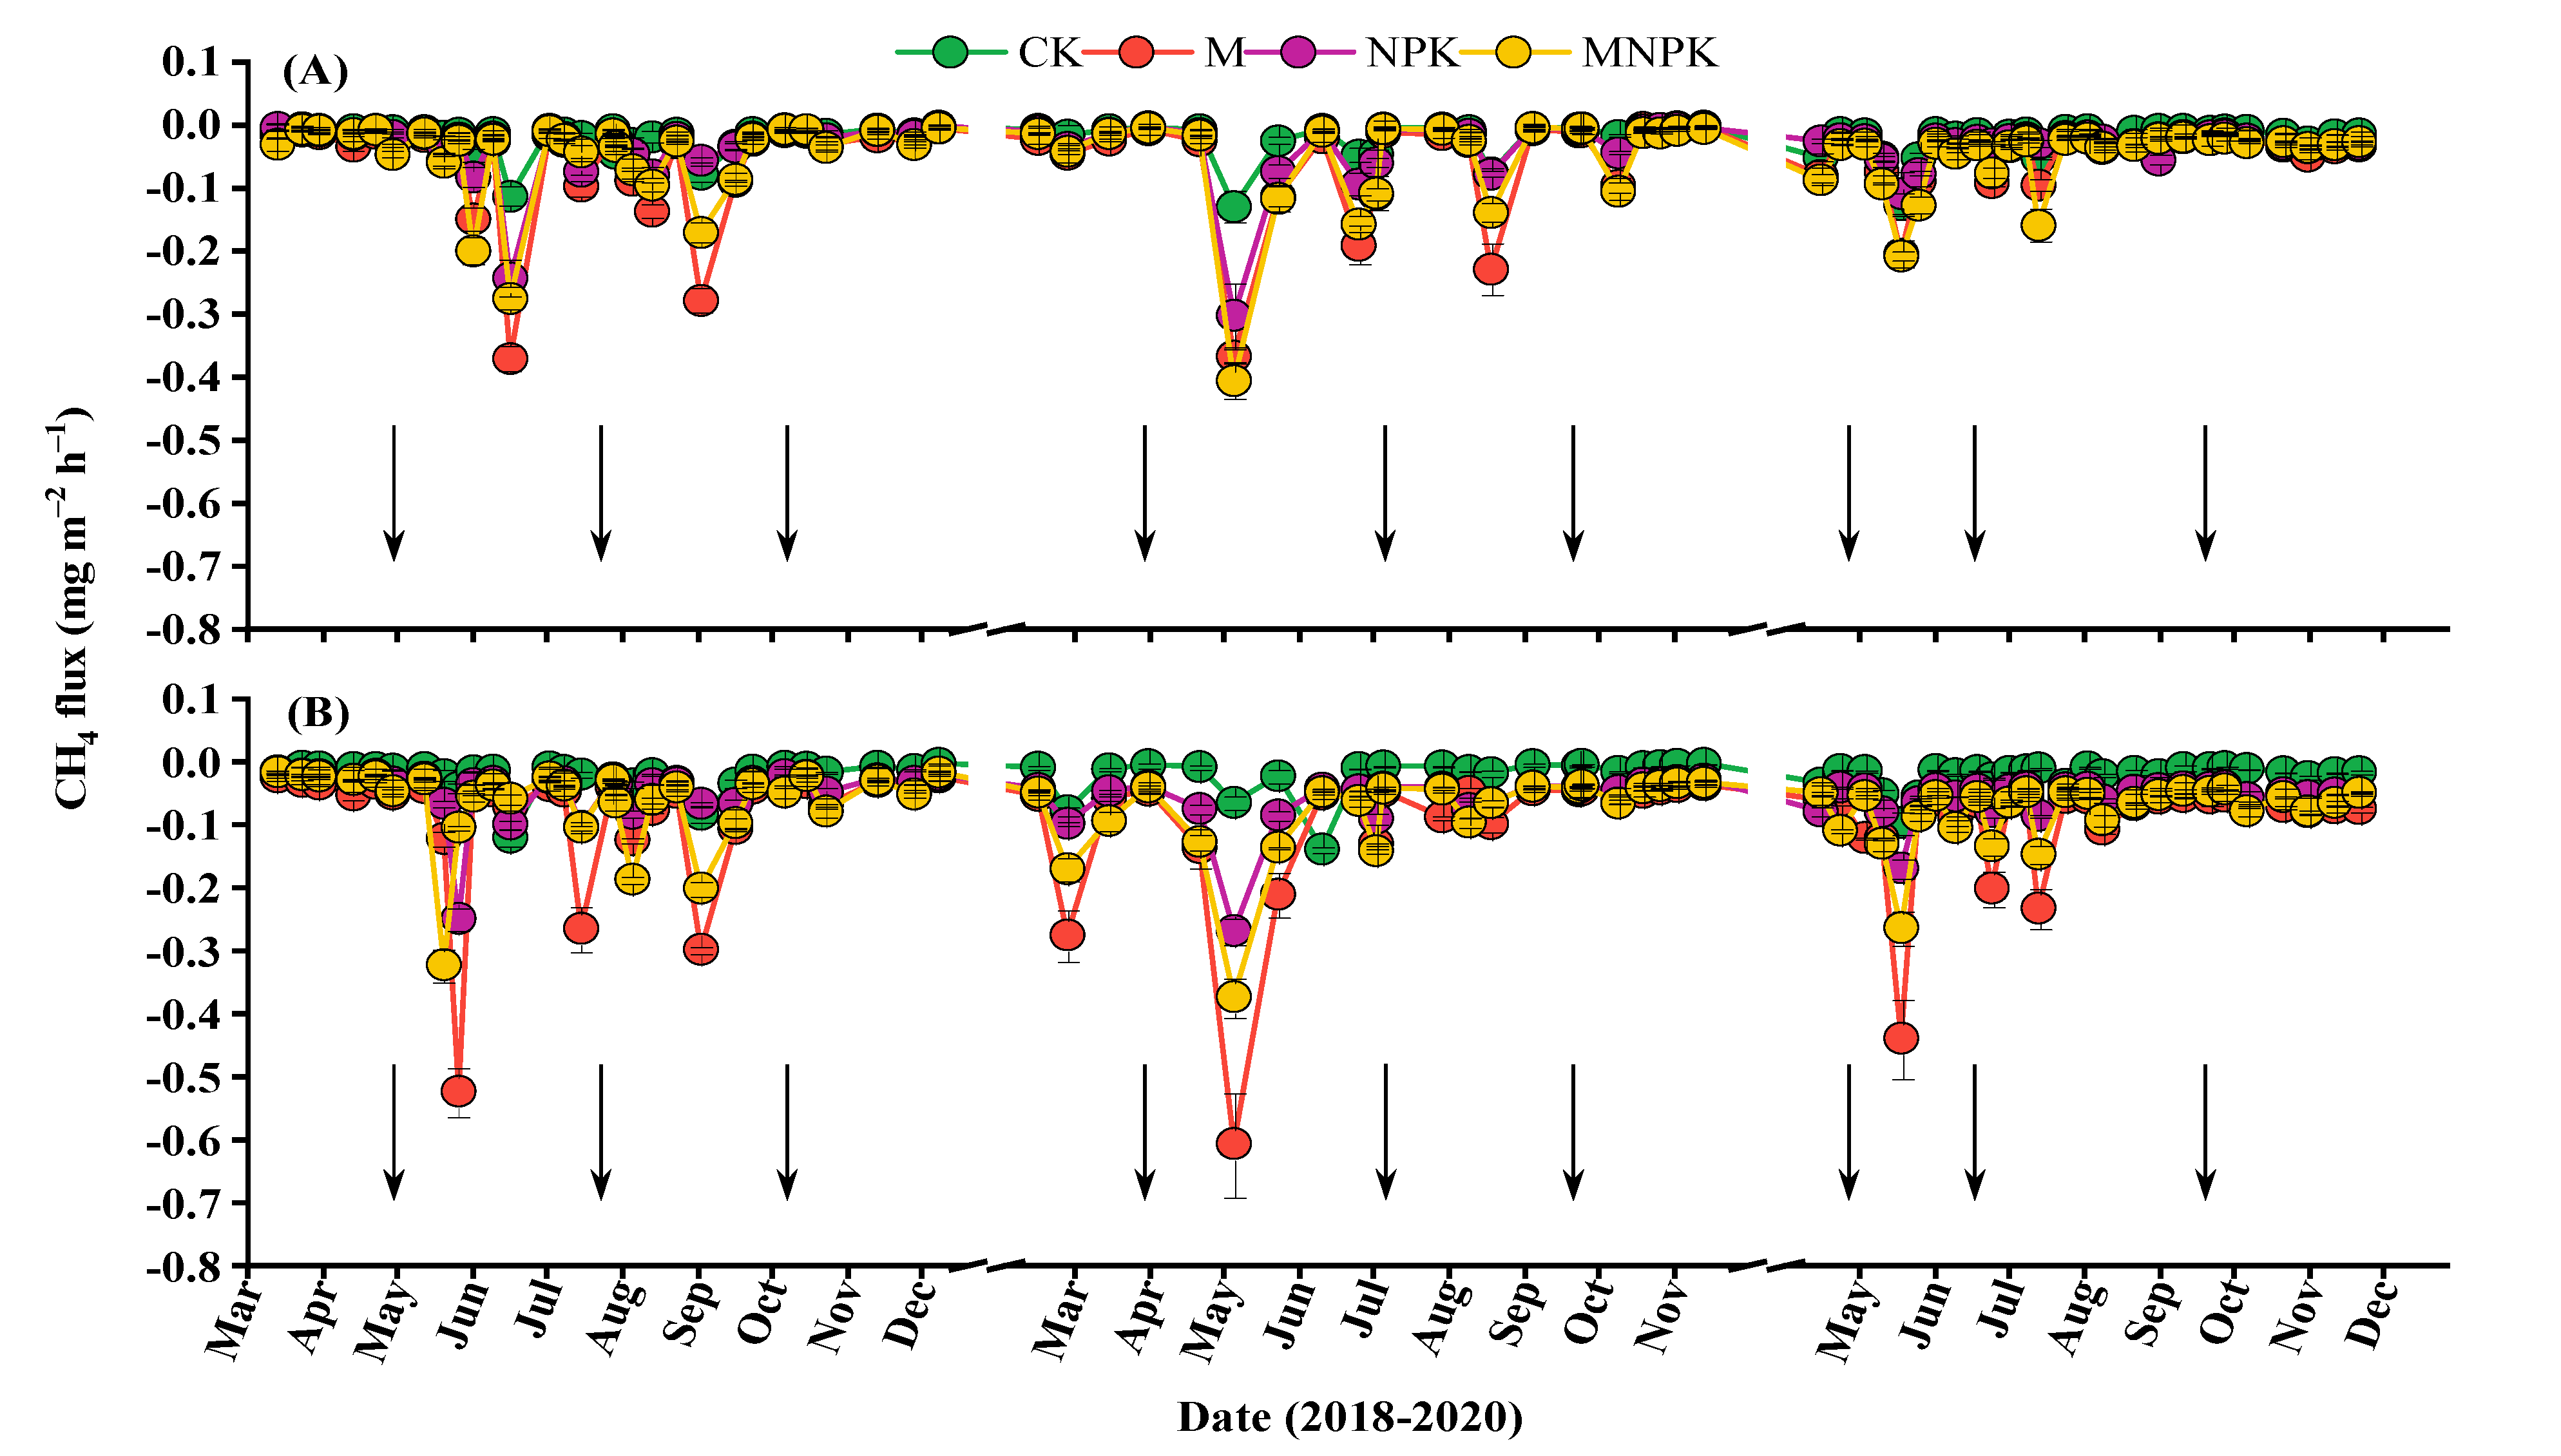
The average daily CH4 fluxes in the PM ranged from 0.01 to 0.41 mg m−2 h−1 and from 0.01 to 0.61 mg m−2 h−1 in the NM. CH4 fluxes increased between the end of June to the beginning of September throughout the experimental years. The CH4 fluxes in M treatment under NM were recorded as 0.52, 0.60, and 0.46 mg m−2 h−1 on 26 May 2018, 24 May 2019, and 6 June 2020, respectively, while 0.37, 0.40, and 0.21 mg m−2 h−1 were recorded on 16 June 2018, 24 May 2019, and 6 June 2020 in PM (Figure 7A,B).
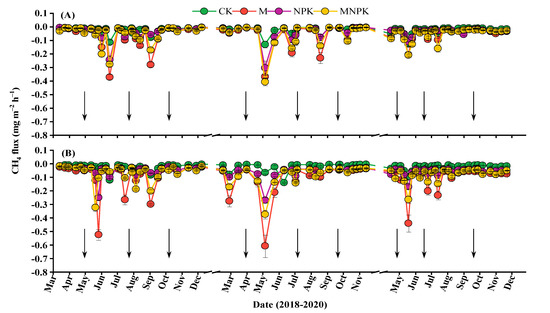
Figure 7.
Effect of the CH4 uptake rate in the apple orchard under different management measures, (A) plastic mulching PM, (B) no mulching NM, control CK, organic fertilizer M, inorganic fertilizer NPK, and organic combined with inorganic fertilizer MNPK. The black arrow pointing down indicates the time of fertilization.
The average annual cumulative CH4 uptake rate ranged from 1.19 to 4.25 kg ha−1 in PM and from 1.14 to 6.75 kg ha−1 in NM. In the PM and NM, the CH4 uptake was ranked as follows: M > MNPK > NPK > CK. The annual CH4 uptake in M under PM was 3.19 kg ha−1 and 5.71 kg ha−1 in M treatment under NM (Table 2).
3.3. Global Warming Potential (GWP) and Green House Gas Intensity (GHGI)
The GWP for PM in the years 2018–2020 was in the range of 227.68–1446.27 kg CO2-eq ha−1, while the GWP for NM was in the range of 184.64–763.78 kg CO2-eq ha−1. Treatments with higher GWPs include the MNPK treatment in PM (1030.62 kg CO2-eq ha−1) and the NPK treatment in NM (570.58 kg CO2-eq ha−1).
GHGI in PM ranged from 8.06 to 29.31 g kg−1 from 2018 to 2020, while GHGI in NM ranged from 5.42 to 18.31 g kg−1. NKP treatments had higher GHGI than other treatments in both PM and NM, with 24.99 and 15.08 g kg−1, respectively. The N2O emission factor was higher in MNPK in both PM and NM, with 0.40 and 0.19%, respectively, compared to the N2O emission factor of NPK treatments of PM and NM (Table 3).

Table 3.
Effects of different management practices on apple yield and GHG emissions in the apple orchard.
3.4. The Influence of Environmental Factors on GHG Emissions in Soil
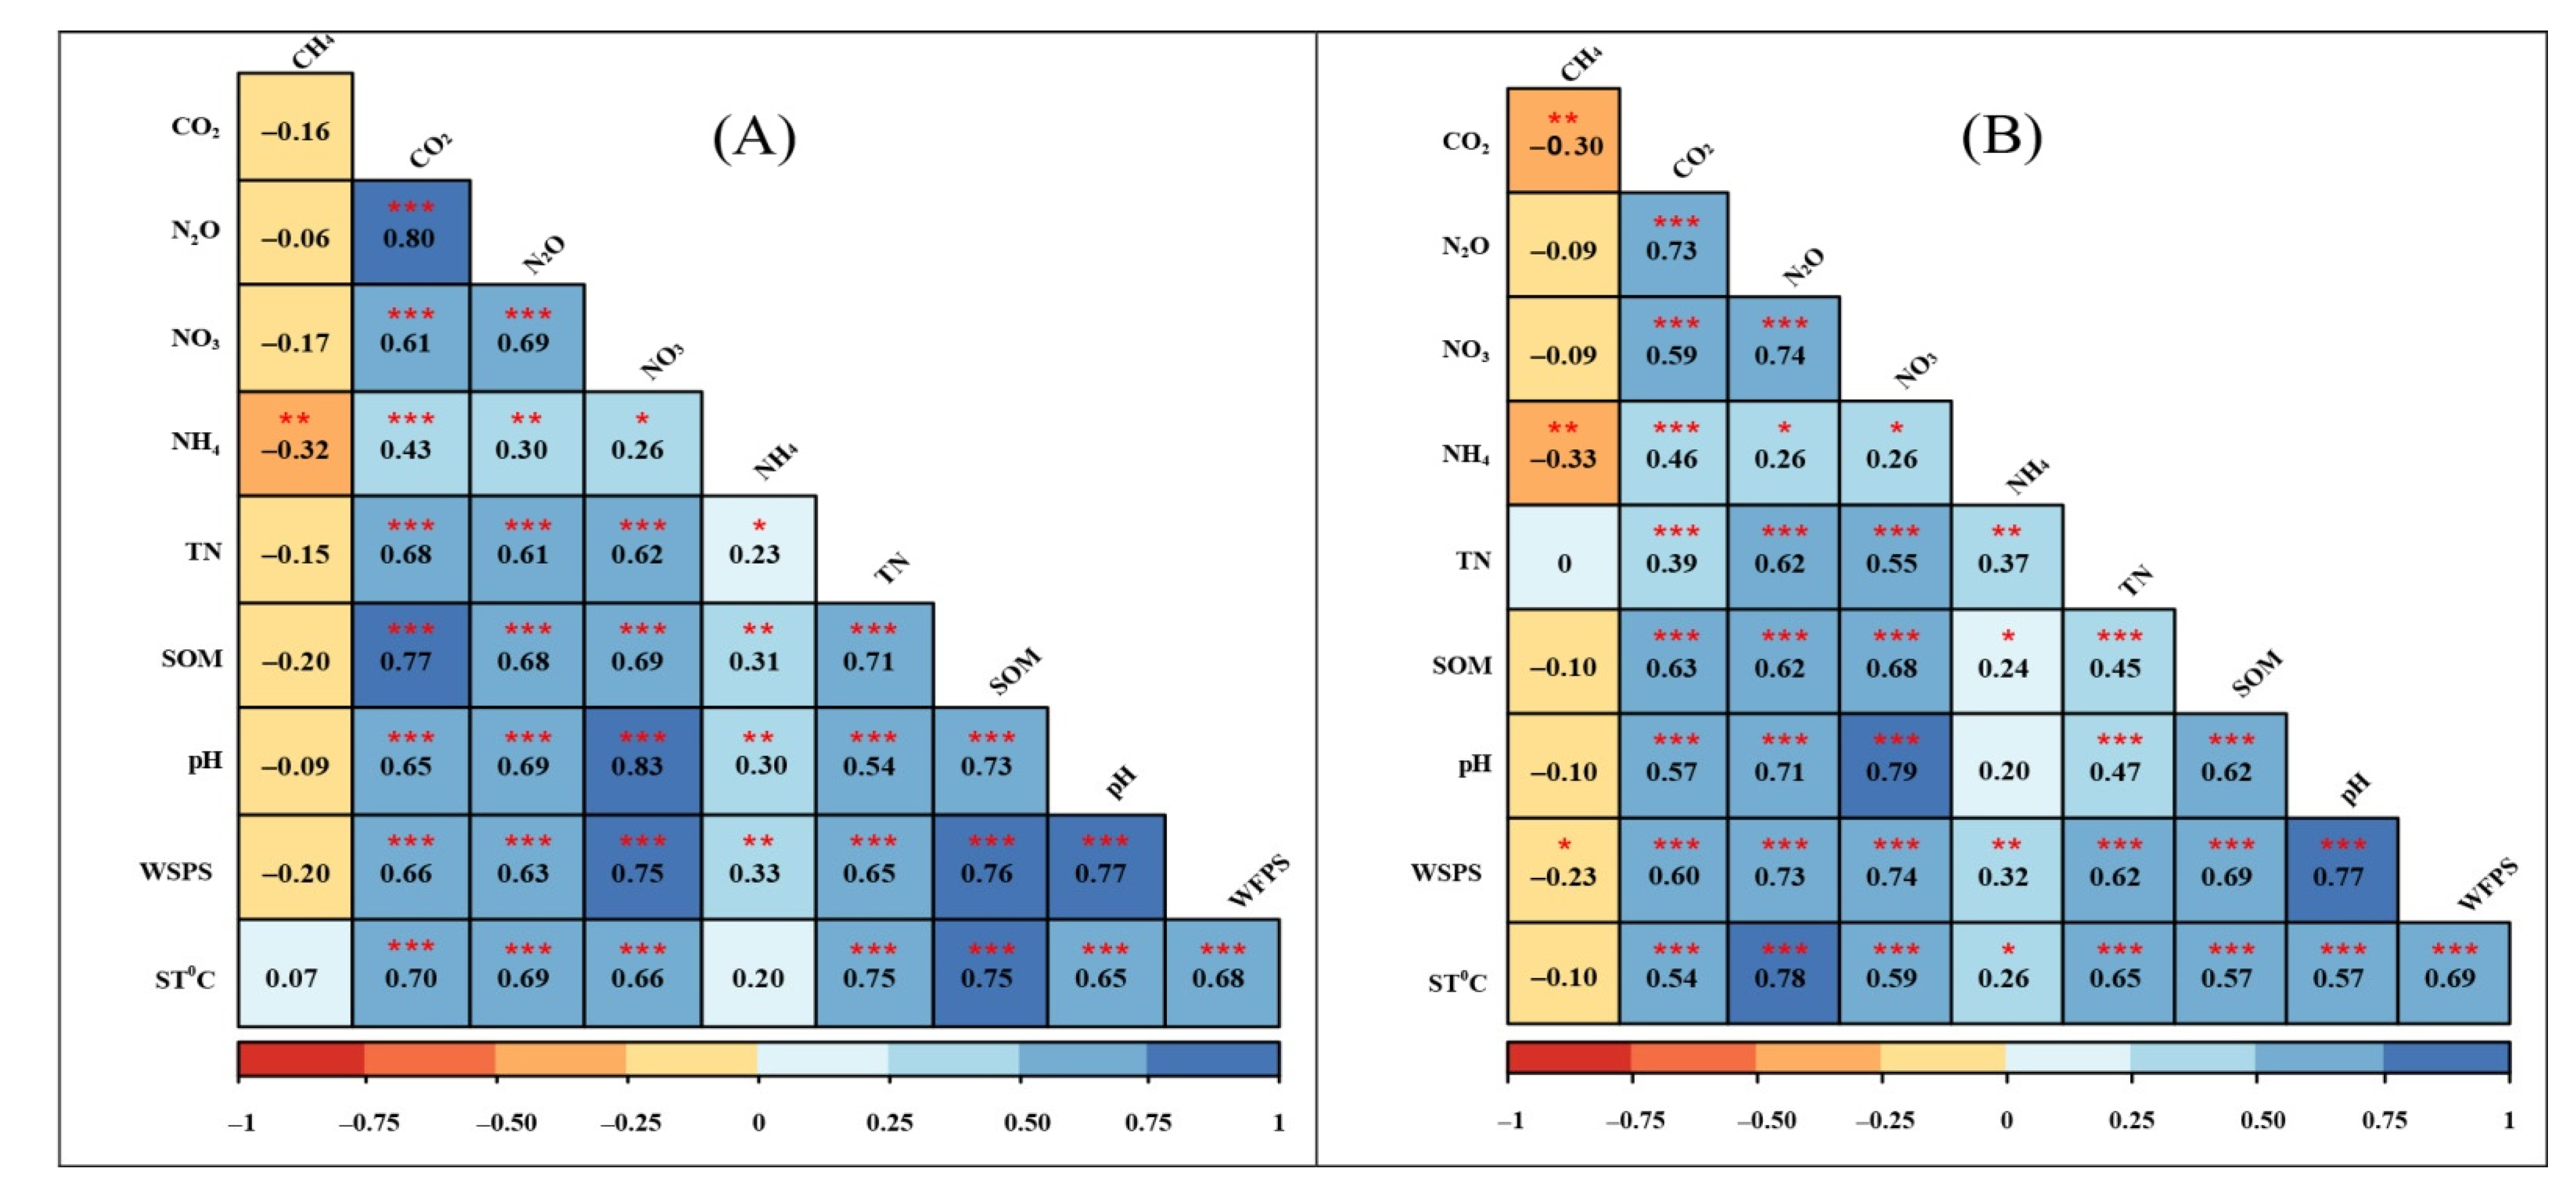
The analysis of the relationship between selected soil properties and climate variables with GHG emissions (N2O, CO2, and CH4) is shown in Figure 8. All selected properties of the soil (SOM, soil pH, TN, NO3−-N, WFPS, and soil temperature) except ammonium content in soil were significantly correlated to N2O in both PM and NM (Figure 8A,B). NO3−-N, soil pH, and soil temperature were more highly correlated with N2O than other soil properties with R2 of 0.69, while R2 of SOM, WFPS, and TN were 0.68, 0.63, and 0.61, respectively, in PM. This observation was also the same for NM, where NO3−-N, soil pH, and soil temperature were highly correlated with N2O followed by SOM, WFPS, and TN, but NH4+-N was not statistically correlated to N2O in both PM and NM.
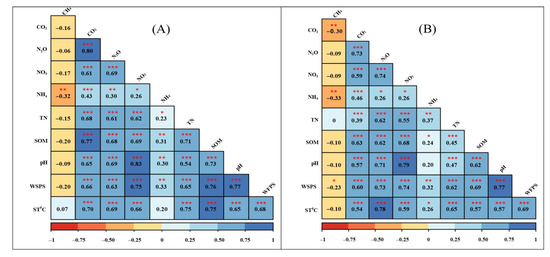
Figure 8.
Correlations between environmental factors and GHG emissions, (A) plastic mulching PM, (B) no mulching NM, CH4: methane, CO2: carbon dioxide, N2O: nitrous oxide, NH4+-N: ammonium nitrate, NO3−-N: nitrate nitrogen, TN: total nitrogen, SOM: soil organic matter, ST: soil temperature, WFPS: water-filled pore space. *, **, and *** indicate significant effects (p < 0.05), highly significant effects (p < 0.01), and extremely significant effects (p < 0.001), respectively.
The characteristics of CO2 emissions and increase and decrease periods were similar to those of N2O emissions, but there was a significant difference between treatments. The CO2 emissions were positively associated with soil temperature, WFPS, and SOM (p < 0.05), while CH4 uptake was positively associated with soil temperature but negatively associated with WFPS, NH4+-N, NO3−-N, and other environmental factors (p < 0.05; Figure 8A,B).
4. Discussion
4.1. The Effects of PM and NM Combined with Different Fertilizer Applications on Nitrous Oxide Emissions
Human activities and agricultural production directly affected N2O emissions [48]. Fertilizer application, temperature, and soil moisture were also the main factors causing gas emissions [49]. N2O emissions in soil were mostly caused by the microbial processes of nitrification and denitrification [50]. In PM, average annual N2O emissions increased from 9.16% to 98.31%, which was significantly higher than NM (p < 0.05; Figure 2), which was in line with the previous research [20].
Yu et al. [51] showed that PM increased N2O emissions by 23.90% in comparison with NM. Inversely, PM in paddy fields reduced the N2O emissions due to the low content of WFPS [41]. According to the study conducted by Abubakar et al. [52], WFPS in soil did not result in any significant N2O emissions in wheat fields. Some research showed that PM decreased N2O emissions because PM can improve root systems in plants for absorbing N in soil, which lowers N content in the soil. The N in soil was largely important for nitrification and denitrification [53]. The difference in temperature, WFPS content in the soil, and agricultural land management affected the difference in gas emissions [20]. In this study, N2O emissions reached the highest rate between June to August every year due to the higher temperature (30 to 35 °C) and rainfall and the increase in WFPS in soil (30 to 60%) which affected the increase in N2O fluxes (Figure 2 and Figure 5A,B). PM increased soil temperature, moisture, activities, and soil microbes. It also decreased oxygen levels in the soil and encouraged denitrification. Such factors had a positive association and affected the increase in N2O emissions in the soil (Figure 8) [54].
There have not been any obvious results for what kind of fertilizer and amount of fertilizer are appropriate for GHG emissions in current studies [55]. The overapplication of fertilizer directly affected N2O emissions because it promoted an increase in NO3−-N and NH4+-N [52]. The integrated use of organic and inorganic fertilizer significantly enhanced N2O in soil [56]. Das and Adhya [57] found that the combination of poultry manure and N fertilizer in rice fields increased N2O emissions more than either fertilizer alone because it promoted nitrification and denitrification and provided a carbon source for microorganisms to grow denitrifying bacteria. The report was in line with the study by Yang et al. [58] suggesting that the use of urea plus cow manure and urea plus pig manure increased N2O emissions by a greater amount than the single use of urea or manure. The present study indicated that compared to NPK, M, and CK treatments, PM and NM in MNPK treatment significantly increased N2O emissions by 6.06, 22.52, and 215.40%, respectively (p < 0.05, Table 2).
Because the amount of N content in fertilizer is one of the main factors causing N2O emissions, in addition, PM and NM in MNPK treatment increased soil porosity, permeability, and evaporation of NH4+-N and NO3−-N, which increased the N2O emissions in soil [59,60,61,62]. The highest rate of N2O emissions was found 2 to 7 days after fertilization [63].
During fertilization from May to July, NH4+-N and NO3-N in MNPK treatment were higher than those in NPK treatment, accounting for 3.51 and 9.44% in PM and 11.27 and 5.61% in NM, respectively. The increase in NH4+-N and NO3-N promoted the processes of nitrification and denitrification in soil and affected the increase in N2O emissions (Figure 5A,B), which was in line with the previous research. As shown in Figure 8, N2O emissions are positively associated with environmental factors, including NO3−-N and NH4+-N [49], soil temperature, and WPFS level in soil [64].
Inversely, the study by Wei et al. [33] on meta-analysis in corn production found that organic fertilizer did not result in any N2O and CH4 emissions. The study reported further that the integrated use of organic and inorganic fertilizer decreased N2O emissions by a greater amount than the single use of organic or inorganic fertilizer, as the use of organic fertilizer lowered N emissions in soil which suppressed the enzyme denitrification process and reduced the potential of nitrification, which means it decreased N2O emissions [65,66].
Most of the studies on the effects of GHG emissions mostly only focused on the use of N fertilizer application, and there are very few studies on the use of different fertilizers combined with PM. The results of this study showed that the average annual cumulative N2O emissions in the apple orchard ranged from 1.03 to 3.37 kg N ha−1 (Table 2), which was greater than previous research by Pang et al. [67].
Moreover, the results showed that the average annual N2O emissions in the apple orchard that applied different amounts of N fertilizer was around 2.40 kg N ha−1. Compared to the research by Xie et al. [68], the average annual N2O emissions were approximately 34.1 to 60.3 kg N ha−1, which were significantly higher than the results found in this study.
4.2. The Effects of PM and NM Combined with Different Fertilizer Applications on Carbon Dioxide Emissions
The processes of agricultural management and production, temperature change, and WFPS in soil are associated with the increase in CO2 emissions [42,69]. Those were the main factors causing soil respiration and improving soil microbial activities. When the soil temperature was sufficient, it promoted gas production and increased CO2 emissions. According to the observation, CO2 emissions increased at the temperature of 21.80 °C and WFPS content of 68.90% [70]. The CO2 emissions in the soil were mostly caused by SOM decomposition, microbial respiration in soil, root respiration, and rhizosphere microorganisms [71]. The amount of carbon (C) was the main source of food and energy for the microorganisms in the soil. Soil microbes obtained food and energy from C by using microbial enzymes, microbes decompose, and organic matter, which resulted in CO2 emissions [72].
According to the results of this study, the average annual CO2 emissions in PM ranged from 5.97 to 56.45%, which was significantly greater than in NM (p < 0.05; Table 2). The CO2 flux largely increased between July and September and decreased between November and April, especially 2 to 3 days after rain and yearly fertilization [34]. The characteristics and periods of CO2 emissions were similar to N2O emissions [73,74]. The results obtained in this research were in line with previous research [75]. Li et al. [22] and Chen and Wu [76] suggested that PM largely affected CO2 emissions. The higher temperature enhanced microbial growth and accelerated SOM decomposition and soil respiration, which affected CO2 emissions.
Figure 8 illustrates the positive association of CO2 emissions, soil temperature, and WFPS. On the contrary, some research suggested that PM enhanced soil moisture, causing soil porosity and decreasing the diffusion of gas, which caused a decrease in CO2 emissions [60,77].
Moreover, some previous research found that PM impeded CO2 emissions from the soil to the atmosphere, since the PM decreased turbulent wind blowing from the soil surface [75,78]. Compared to NM, the CO2 emissions were lower in PM. Both PM and NM, combined with the integrated use of organic and inorganic fertilizer in MNPK treatment, caused a large increase in CO2 emissions. Compared to NPK treatment, CO2 emissions in MNPK and M treatments were significantly higher, accounting for 42.34 and 14.22%, respectively (p < 0.05; Figure 6A,B; Table 2).
According to previous research, it has been shown that the use of organic fertilizer increased CO2 emissions by 26.80% in comparison with the use of inorganic fertilizer because the use of organic fertilizer effectively improved soil microbial activity and soil respiration [20,33]. Compared to the other treatments, SOM in the MNPK and M treatments was higher, which caused the decomposition of C and increased CO2 emissions [79]. Yang et al. [80] suggested that the integrated use of organic fertilizer (composted rapeseed cake) and N fertilizer increased CO2 emissions more greatly than the single use of N fertilizer because organic fertilizer had more potential for water-soluble organic matter emissions that made it easier for soil microbes to decompose and the CO2 emissions from soil to the atmosphere were greater in comparison with the use of N fertilizer. On the contrary, some researchers found that the integrated use of sheep manure and inorganic fertilizer showed a lower rate of CO2 emissions in comparison with inorganic fertilizer because inorganic fertilizer can increase the respiration of plants and promote the decomposition of C in soil [81].
According to the results reported in this study, using PM combined with the integrated use of organic and inorganic fertilizer in MNPK treatment affected the increase in N2O and CO2 emissions more greatly than both the single use of organic fertilizer in M treatment and the single use of inorganic fertilizer in NPK treatment. Besides the use of fertilizer, environmental factors including air temperature, soil temperature, WPFS, SOM, NH4+-N, and NO3−-N significantly affected the increase in N2O and CO2 emissions in the apple orchard.
4.3. The Effects of PM and NM Combined with Different Fertilizer Applications on Methane Uptake
In this study, CH4 fluxes were similar to most dryland farming in China; CH4 fluxes in the soil were low, and the CH4 flux value was negative. The negative value indicates the ability of the soil to sink the CH4 [38]. It could be the sink for atmospheric CH4 due to methanotrophs in agricultural soils oxidizing CH4 under relatively dry conditions [82].
The CH4 fluxes were the consequence of methanogens [83]. Moreover, soil moisture, temperature, fertilizers, oxygen diffusion in soil, and microbial activity were the major factors affected by the increase in CH4 fluxes [84]. In PM, the average annual CH4 uptake significantly decreased by 10.92% in comparison to NM, which accounted for 54.03% (p < 0.05; Table 2). This was in line with Yu et al. [51], who suggested that PM in upland agriculture decreased CH4 uptake by 16% because PM impeded the soil–atmosphere exchange of CH4 uptake [85]. Meanwhile, the findings of the study by Li et al. [22] conversely showed that PM increased CH4 uptake by 151.40% in comparison with NM.
Compared with NPK treatment, we found that in M treatment, the cumulative CH4 uptake increased by 65.01% in PM and 74.91% in NM, respectively (Table 2; p < 0.05), as a result of the higher SOM in soil. However, compared to the other treatments, N, NO3−-N, and NH4+-N in the soil in NPK were significantly lower, causing an increase in CH4 uptake ability [86].
The study on using manure fertilizer in potato fields by Meng et al. [85] found that CH uptake was 1.1 to 2.1 times higher than using inorganic fertilizer, while Macharia et al. [87] found that goat manure reduced the potential of oxidation in soil and the activity of methanotrophs, which suppressed CH4 uptake.
Figure 8 illustrates that CH4 uptake was positively but not significantly associated with soil temperature. CH4 uptake increased at a temperature of between 18 and 30 °C [49], but it was negatively associated with WFPS, SOM, NO3−-N, and NH4+-N in soil, which was in line with previous research [21]. Sullivan et al. [88] reported that the higher C level and soil temperature were the major controllers of CH4 emissions in dryland. In addition, some research reported that the increase in NO3−-N and NH4+-N in the soil can suppress CH4 uptake [89]. Therefore, CH4 uptake in NPK treatment decreased in comparison with M and MNPK treatments.
However, the results of this study showed that the integrated use of organic and inorganic fertilizer in M and MNPK treatment was the best way to reduce CH4 emissions.
4.4. The Effects of Plastic Mulching Combined with the Different Fertilizer Applications on Apple Yield, N2O EFd, GWP, and GHGI
In PM treatment, the type and amount of fertilizer were important for the quality of soil and the volume of yield [18]. Overfertilization led to soil deterioration and a decline in soil minerals and SOM [90]. However, PM combined with the integrated use of organic and inorganic fertilizer can improve soil physical properties, soil chemistry, and crop yield [91]. The average apple yield, the integrated use of organic and inorganic fertilizer in MNPK treatment, was more significantly effective for an increase in apple yield than NPK and CK treatment, accounting for 70.13% and 131.41%, respectively (p < 0.05; Table 2). This was in line with previous research conducted by Zhao et al. [92], who suggested that inorganic fertilizer combined with goat manure can improve soil structure, decrease soil water loss, increase water storage capacity, and increase apple yield.
The integrated use of inorganic fertilizer and organic fertilizer (oil residues, straw, manure) increased apple yield by 47.50% in comparison with CK treatment, which was in line with the research conducted by Zhang et al. [28], suggesting that the integrated use of MNPK can increase apple yield.
Using PM and NM combined with the integrated use of organic and inorganic fertilizers in MNPK treatment can improve the physical and chemical properties of soil and greatly increase apple yield. Nevertheless, it affected the increase in GHG emissions.
N2O EFd was the indicator measuring the standard value of the Intergovernmental Panel on Climate Change (IPCC) [93] by determining N2O EFd as 1%. The results showed that the average N2O EFd in PM and NM ranged from 0.35 to 0.40% and 0.17 to 0.19%, respectively, which were lower than IPCC and also lower than the results of N2O EFd found in the study by Xie et al. [68] accounting for 1.34%. Compared to NPK treatment, N2O EFd in MNPK treatment in both PM and NM increased by 14.91% and 9.77%, respectively (Table 3).
The GWP of farmlands was generally measured by GWP times for CH4 and N2O flux emissions on a time horizon of 100 years, which were estimated to have 25 and 298, respectively [94]. Comparing PM and NM during three seasons (2018–2020), GWP ranged from 227.68 to 1446.27 kg CO2-eq ha−1, which increased by 11.89 to 162.97%, since MNPK increased NH4+-N and NO3−-N in soil in the second and third seasons (Figure 4 and Table S1). In the first season, GWP was higher in NPK treatments in both PM and NM, while in the second and third seasons, GWP was higher in MNPK treatments for both PM and NM (Figure 5 and Table 3). Our results also confirmed the results of other studies which showed that combining organic manure and inorganic fertilizers increased NH4+-N, NO3−-N, and GWP in PM but not in NM [52].
The results were in line with previous research, suggesting that PM increased GWP from 12 to 82%, compared to the NM [95]. However, a meta-analysis by Yu et al. [51] reported that PM had slightly affected the increase in GWP in the uplands.
Yang et al. [96] reported that the integrated use of cow manure and inorganic fertilizer increased GWP more greatly than the single use of inorganic fertilizer, while Yang et al. [97] and Hongjun et al. [98] reported the converse results. In this study, the average GWP in the apple orchard was higher than those in previous research. For example, the average GWP in C oleifera and citrus orchards were 579.11 and 418.13 kg CO2 −eq ha−1 [49].
The increase in GWP is mostly caused by N2O emissions, while GHGI emissions are mostly caused by N2O emissions determined by apple yield [99]. The GHGI is associated with GHG emissions and crop yields. GHGI was one of the main indicators determining the appropriate standard of agricultural management in accordance with sustainable agriculture [100].
The average annual GHGI in PM ranged from 8.06 to 29.31 g kg−1, accounting for 12.01 to 162.88%, which was significantly higher than NM (p < 0.05; Table 3). However, it was found to be lower in comparison with the previous research on pineapple orchards [81]. The GHGI in MNPK treatment was 37.92% in PM and 43.73% in NM. It was significantly higher than those in the NPK treatment (p < 0.05; Table 3) because there were higher apple yield despite the increase in GWP [30].
The results found in this study were in line with some previous research. Therefore, using PM combined with the integrated use of organic and inorganic fertilizer in MNPK treatment was the most suitable method with regard to the theory for sustainable agriculture because using MNPK fertilizer can reduce the production cost, decrease GHGI, and increase apple yield [101].
5. Conclusions
Plastic mulching (PM) increased soil temperature, WFPS, SOM, TN, NO3−-N, and NH4+-N in soil so that it significantly increased N2O and CO2 emissions, increasing from 9.16 to 98.31% in PM and from 5.97 to 56.45% in NM (p > 0.05). Moreover, PM decreased CH4 uptake. In PM, CH4 uptake in the apple orchard decreased by 10.92%, while it decreased by 54.03% in NM (p > 0.05). Using PM and NM combined with the integrated use of organic and inorganic fertilizer in MNPK treatment affected the increase in N2O and CO2 emissions. It was significantly higher in comparison with NM treatment (p > 0.05). Compared to the other treatments, the use of organic fertilizer in M treatment decreased CH4 uptake from air into the soil by a larger amount (p > 0.05).
Besides PM, the major factors causing GHG emissions were soil temperature, WFPS, SOM, TN, NO3−-N, and NH4+-N, and these factors were positively associated with N2O and CO2 emissions. While there were only two factors, air and soil temperature, positively associated with CH4 uptake, other factors were found to have negative associations (p < 0.05).
The increase in GHG emissions (N2O and CO2) influenced the increase in GWP. GWP in PM was 11.89 and 162.97% in NM. In PM and NM, GHG emissions in the MNPK treatment increased by a larger amount in comparison with NPK and the other treatments (p > 0.05), while GHGI in MNPK was significantly lower than in NPK, accounting for 37.92% in PM and 43.37% in NM (p > 0.05).
Although using PM combined with the integrated use of organic and inorganic fertilizer in MNPK treatment significantly increased GHG emissions and GWP, it increased soil physical and chemical properties and apple yield. Moreover, it decreased GHGI. Therefore, it is the most appropriate way to be applied to apple orchard management to promote sustainable agriculture, which aims to increase crop yields and decrease GHGI.
Supplementary Materials
The following supporting information can be downloaded at: https://www.mdpi.com/article/10.3390/agriculture13061211/s1, Table S1: Effects of different management practices on soil properties in the apple orchard.
Author Contributions
Conceptualization, T.S., Z.L. and B.Z.; methodology, T.S., Z.L. and B.Z.; formal analysis, T.S.; investigation, T.S. and Y.M.; writing—original draft preparation, T.S.; writing—review and editing, T.S., Z.Z., E.S., A.Z., W.Z., Z.L. and B.Z.; visualization, Z.L. and B.Z.; supervision, Z.L. and B.Z.; project administration, B.Z.; funding acquisition, B.Z. and Z.L. All authors have read and agreed to the published version of the manuscript.
Funding
This study was supported by the China Agriculture Research System of MOF and MARA (CARS-27), Special Funds for the Science and Technology Innovation of Shaanxi Province (2020zdzx03-02-01), the National Natural Science Foundation of China (42007093), and the China Postdoctoral Science Foundation Funded Project (2020M638585).
Institutional Review Board Statement
Not applicable.
Informed Consent Statement
Not applicable.
Data Availability Statement
All data generated or analyzed during this study are included in this manuscript.
Conflicts of Interest
The authors declare no conflict of interest.
References
- Chen, X.; Cui, Z.; Fan, M.; Vitousek, P.; Zhao, M.; Ma, W.; Wang, Z.; Zhang, W.; Yan, X.; Yang, J. Producing more grain with lower environmental costs. Nature 2014, 514, 486–489. [Google Scholar] [CrossRef] [PubMed]
- Dencső, M.; Horel, Á.; Bogunovic, I.; Tóth, E. Effects of environmental drivers and agricultural management on soil CO2 and N2O emissions. Agronomy 2020, 11, 54. [Google Scholar] [CrossRef]
- Townsend, J.; Moola, F.; Craig, M. Indigenous Peoples are critical to the success of nature-based solutions to climate change. Facets 2020, 5, 551–556. [Google Scholar] [CrossRef]
- Tubiello, F.N.; Salvatore, M.; Cóndor Golec, R.D.; Ferrara, A.; Rossi, S.; Biancalani, R.; Federici, S.; Jacobs, H.; Flammini, A. Agriculture, Forestry and Other Land Use Emissions by Sources and Removals by Sinks; FAO: Rome, Italy, 2014. [Google Scholar] [CrossRef]
- Yuan, J.; Xiang, J.; Liu, D.; Kang, H.; He, T.; Kim, S.; Lin, Y.; Freeman, C.; Ding, W. Rapid growth in greenhouse gas emissions from the adoption of industrial-scale aquaculture. Nat. Clim. Chang. 2019, 9, 318–322. [Google Scholar] [CrossRef]
- Sun, D.; Li, H.; Wang, E.; He, W.; Hao, W.; Yan, C.; Li, Y.; Mei, X.; Zhang, Y.; Sun, Z. An overview of the use of plastic-film mulching in China to increase crop yield and water-use efficiency. Natl. Sci. Rev. 2020, 7, 1523–1526. [Google Scholar] [CrossRef]
- Steinmetz, Z.; Wollmann, C.; Schaefer, M.; Buchmann, C.; David, J.; Tröger, J.; Muñoz, K.; Frör, O.; Schaumann, G.E. Plastic mulching in agriculture. Trading short-term agronomic benefits for long-term soil degradation? Sci. Total Environ. 2016, 550, 690–705. [Google Scholar] [CrossRef]
- Yao, Z.; Zheng, X.; Liu, C.; Lin, S.; Zuo, Q.; Butterbach-Bahl, K. Improving rice production sustainability by reducing water demand and greenhouse gas emissions with biodegradable films. Sci. Rep. 2017, 7, 39855. [Google Scholar] [CrossRef]
- Gao, H.; Yan, C.; Liu, Q.; Ding, W.; Chen, B.; Li, Z. Effects of plastic mulching and plastic residue on agricultural production: A meta-analysis. Sci. Total Environ. 2019, 651, 484–492. [Google Scholar] [CrossRef]
- Guo, C.; Liu, X. Effect of soil mulching on agricultural greenhouse gas emissions in China: A meta-analysis. PLoS ONE 2022, 17, e0262120. [Google Scholar] [CrossRef]
- Lisson, S.; Tarbath, M.; Corkrey, R.; Pinkard, E.; Laycock, B.; Howden, S.; Acuña, T.B.; Makin, A. Ambient climate and soil effects on the headspace under clear mulch film. Agric. Syst. 2016, 142, 41–50. [Google Scholar] [CrossRef]
- Han, J.; Zhang, A.; Kang, Y.; Han, J.; Yang, B.; Hussain, Q.; Wang, X.; Zhang, M.; Khan, M.A. Biochar promotes soil organic carbon sequestration and reduces net global warming potential in apple orchard: A two-year study in the Loess Plateau of China. Sci. Total Environ. 2022, 803, 150035. [Google Scholar] [CrossRef] [PubMed]
- Canton, H. Food and agriculture organization of the United Nations—FAO. In The Europa Directory of International Organizations 2021; Routledge: London, UK, 2021; pp. 297–305. [Google Scholar]
- Zhang, B.; Hu, Y.; Hill, R.L.; Wu, S.; Song, X. Combined effects of biomaterial amendments and rainwater harvesting on soil moisture, structure and apple roots in a rainfed apple orchard on the Loess Plateau, China. Agric. Water Manag. 2021, 248, 106776. [Google Scholar] [CrossRef]
- Zheng, J.; Fan, J.; Zhang, F.; Zhuang, Q. Evapotranspiration partitioning and water productivity of rainfed maize under contrasting mulching conditions in Northwest China. Agric. Water Manag. 2021, 243, 106473. [Google Scholar] [CrossRef]
- Qin, W.; Hu, C.; Oenema, O. Soil mulching significantly enhances yields and water and nitrogen use efficiencies of maize and wheat: A meta-analysis. Sci. Rep. 2015, 5, 16210. [Google Scholar] [CrossRef] [PubMed]
- Lee, J.; Chae, H.; Cho, S.; Song, H.; Kim, P.; Jeong, S. Impact of plastic film mulching on global warming in entire chemical and organic cropping systems: Life cycle assessment. J. Clean. Prod. 2021, 308, 127256. [Google Scholar] [CrossRef]
- Fang, H.; Li, Y.; Gu, X.; Yu, M.; Chen, P.; Li, Y.; Liu, F. Optimizing the impact of film mulching pattern and nitrogen application rate on maize production, gaseous N emissions, and utilization of water and nitrogen in northwest China. Agric. Water Manag. 2022, 261, 107350. [Google Scholar] [CrossRef]
- Liao, Y.; Cao, H.; Liu, X.; Li, H.; Hu, Q.; Xue, W. By increasing infiltration and reducing evaporation, mulching can improve the soil water environment and apple yield of orchards in semiarid areas. Agric. Water Manag. 2021, 253, 106936. [Google Scholar] [CrossRef]
- Lee, J.G.; Cho, S.R.; Jeong, S.T.; Hwang, H.Y.; Kim, P.J. Different response of plastic film mulching on greenhouse gas intensity (GHGI) between chemical and organic fertilization in maize upland soil. Sci. Total Environ. 2019, 696, 133827. [Google Scholar] [CrossRef]
- Liu, J.; Chen, X.; Zhan, A.; Luo, S.; Chen, H.; Jiang, H.; Huang, X.; Li, S. Methane uptake in semiarid farmland subjected to different mulching and nitrogen fertilization regimes. Biol. Fertil. Soils 2016, 52, 941–950. [Google Scholar] [CrossRef]
- Li, Y.; Feng, H.; Wu, W.; Jiang, Y.; Sun, J.; Zhang, Y.; Cheng, H.; Li, C.; Siddique, K.H.; Chen, J. Decreased greenhouse gas intensity of winter wheat production under plastic film mulching in semi-arid areas. Agric. Water Manag. 2022, 274, 107941. [Google Scholar] [CrossRef]
- Guo, Y.; Yin, W.; Chai, Q.; Fan, Z.; Hu, F.; Fan, H.; Zhao, C.; Yu, A.; Coulter, J.A. No tillage with previous plastic covering increases water harvesting and decreases soil CO2 emissions of wheat in dry regions. Soil Tillage Res. 2021, 208, 104883. [Google Scholar] [CrossRef]
- Wang, W.; Han, L.; Zhang, X.; Wei, K. Plastic film mulching affects N2O emission and ammonia oxidizers in drip irrigated potato soil in northwest China. Sci. Total Environ. 2021, 754, 142113. [Google Scholar] [CrossRef]
- Hou, L.; Liu, Z.; Zhao, J.; Ma, P.; Xu, X. Comprehensive assessment of fertilization, spatial variability of soil chemical properties, and relationships among nutrients, apple yield and orchard age: A case study in Luochuan County, China. Ecol. Indic. 2021, 122, 107285. [Google Scholar] [CrossRef]
- Pörtner, H.; Roberts, D.; Adams, H.; Adler, C.; Aldunce, P.; Ali, E.; Begum, R.A.; Betts, R.; Kerr, R.B.; Biesbroek, R. Climate Change 2022: Impacts, Adaptation and Vulnerability; IPCC: Geneva, Switzerland, 2022. [Google Scholar]
- Lv, F.; Song, J.; Giltrap, D.; Feng, Y.; Yang, X.; Zhang, S. Crop yield and N2O emission affected by long-term organic manure substitution fertilizer under winter wheat-summer maize cropping system. Sci. Total Environ. 2020, 732, 139321. [Google Scholar] [CrossRef] [PubMed]
- Zhang, B.; Su, S.; Duan, C.; Feng, H.; Chau, H.W.; He, J.; Li, Y.; Hill, R.L.; Wu, S.; Zou, Y. Effects of partial organic fertilizer replacement combined with rainwater collection system on soil water, nitrate-nitrogen and apple yield of rainfed apple orchard in the Loess Plateau of China: A 3-year field experiment. Agric. Water Manag. 2022, 260, 107295. [Google Scholar] [CrossRef]
- Huang, R.; Wang, Y.; Gao, X.; Liu, J.; Wang, Z.; Gao, M. Nitrous oxide emission and the related denitrifier community: A short-term response to organic manure substituting chemical fertilizer. Ecotoxicol. Environ. Saf. 2020, 192, 110291. [Google Scholar] [CrossRef] [PubMed]
- Zhang, Y.; Nie, Y.; Liu, Y.; Huang, X.; Yang, Y.; Xiong, H.; Zhu, H.; Li, Y. Characteristics of Greenhouse Gas Emissions from Yellow Paddy Soils under Long-Term Organic Fertilizer Application. Sustainability 2022, 14, 12574. [Google Scholar] [CrossRef]
- Xiang, W.; Wang, L.; Liu, T.; Li, S.; Zhao, Z.; Li, C. Effects of biochar plus inorganic nitrogen on the greenhouse gas and nitrogen use efficiency from rice fields. Sci. Agric. Sin. 2021, 53, 4634–4645. [Google Scholar]
- Xie, L.; Li, L.; Xie, J.; Wang, J.; Anwar, S.; Du, C.; Zhou, Y. Substituting inorganic fertilizers with organic amendment reduced nitrous oxide emissions by affecting nitrifiers’ microbial community. Land 2022, 11, 1702. [Google Scholar] [CrossRef]
- Wei, Z.; Ying, H.; Guo, X.; Zhuang, M.; Cui, Z.; Zhang, F. Substitution of mineral fertilizer with organic fertilizer in maize systems: A meta-analysis of reduced nitrogen and carbon emissions. Agronomy 2020, 10, 1149. [Google Scholar] [CrossRef]
- Githongo, M.W.; Musafiri, C.M.; Macharia, J.M.; Kiboi, M.N.; Fliessbach, A.; Muriuki, A.; Ngetich, F.K. Greenhouse gas fluxes from selected soil fertility management practices in humic nitisols of upper Eastern Kenya. Sustainability 2022, 14, 1938. [Google Scholar] [CrossRef]
- Xie, Y.; Zhang, J.; Jiang, H.; Yang, J.; Deng, S.; Li, X.; Guo, J.; Li, L.; Liu, X.; Zhou, G. Effects of different fertilization practices on greenhouse gas emissions from paddy soil. J. Agro-Environ. Sci. 2015, 3, 578–584. [Google Scholar]
- Hou, A.; Wang, Z.; Chen, G.; Patrick, W. Effects of organic and N fertilizers on methane production potential in a Chinese rice soil and its microbiological aspect. Nutr. Cycl. Agroecosyst. 2000, 58, 333–338. [Google Scholar] [CrossRef]
- Pandey, A.; Dou, F.; Morgan, C.L.; Guo, J.; Deng, J.; Schwab, P. Modeling organically fertilized flooded rice systems and its long-term effects on grain yield and methane emissions. Sci. Total Environ. 2021, 755, 142578. [Google Scholar] [CrossRef] [PubMed]
- Fan, Y.; Hao, X.; Carswell, A.; Misselbrook, T.; Ding, R.; Li, S.; Kang, S. Inorganic nitrogen fertilizer and high N application rate promote N2O emission and suppress CH4 uptake in a rotational vegetable system. Soil Tillage Res. 2021, 206, 104848. [Google Scholar] [CrossRef]
- Brenzinger, K.; Drost, S.M.; Korthals, G.; Bodelier, P.L. Organic residue amendments to modulate greenhouse gas emissions from agricultural soils. Front. Microbiol. 2018, 9, 3035. [Google Scholar] [CrossRef] [PubMed]
- Fentabil, M.M.; Nichol, C.F.; Jones, M.D.; Neilsen, G.H.; Neilsen, D.; Hannam, K.D. Effect of drip irrigation frequency, nitrogen rate and mulching on nitrous oxide emissions in a semi-arid climate: An assessment across two years in an apple orchard. Agric. Ecosyst. Environ. 2016, 235, 242–252. [Google Scholar] [CrossRef]
- Zhao, M.; Jiang, C.; Li, X.; He, X.; Hao, Q. Variations in nitrous oxide emissions as manipulated by plastic film mulching and fertilization over three successive years in a hot pepper-radish rotated vegetable production system. Agric. Ecosyst. Environ. 2020, 304, 107127. [Google Scholar] [CrossRef]
- Mehmood, F.; Wang, G.; Gao, Y.; Liang, Y.; Zain, M.; Rahman, S.U.; Duan, A. Impacts of irrigation managements on soil CO2 emission and soil CH4 uptake of winter wheat field in the North China plain. Water 2021, 13, 2052. [Google Scholar] [CrossRef]
- Liu, D.; Sun, H.; Liao, X.; Luo, J.; Lindsey, S.; Yuan, J.; He, T.; Zaman, M.; Ding, W. N2O and NO emissions as affected by the continuous combined application of organic and mineral N fertilizer to a soil on the North China Plain. Agronomy 2020, 10, 1965. [Google Scholar] [CrossRef]
- Xu, P.; Han, Z.; Wu, J.; Li, Z.; Wang, J.; Zou, J. Emissions of greenhouse gases and NO from rice fields and a peach orchard as affected by N input and land-use conversion. Agronomy 2022, 12, 1850. [Google Scholar] [CrossRef]
- Toma, Y.; Higuchi, T.; Nagata, O.; Kato, Y.; Izumiya, T.; Oomori, S.; Ueno, H. Efflux of soil nitrous oxide from applied fertilizer containing organic materials in Citrus unshiu field in Southwestern Japan. Agriculture 2017, 7, 10. [Google Scholar] [CrossRef]
- Weijie, L.; Li, W. Effects of a cover crop on deep soil water and root characteristics in a dryland apple orchard on the Loess Plateau. Acta Prataculturae Sin. 2023, 32, 63. [Google Scholar]
- Sparks, D.L.; Page, A.L.; Helmke, P.A.; Loeppert, R.H. Methods of Soil Analysis, Part 3: Chemical Methods; John Wiley & Sons: Hoboken, NJ, USA, 2020; Volume 14. [Google Scholar]
- Li, Z. Progresses in the research on major greenhouse gas emissions in the northern dry farmland. Liaoning Agric. Sci. 2020, 2, 52–56. [Google Scholar]
- Yang, X.; Hou, H.; Xu, Y.; Raza, S.T.; Wang, L.; Wei, W.; Wu, J.; Chen, Z. Divergent pattern of soil CO2, CH4 and N2O emissions in 18-year citrus orchard and Camellia oleifera plantations converted from natural shrub forests. Appl. Soil Ecol. 2022, 175, 104447. [Google Scholar] [CrossRef]
- Wu, X.; Chen, Z.; Kiese, R.; Fu, J.; Gschwendter, S.; Schloter, M.; Liu, C.; Butterbach-Bahl, K.; Wolf, B.; Dannenmann, M. Dinitrogen (N 2) pulse emissions during freeze-thaw cycles from montane grassland soil. Biol. Fertil. Soils 2020, 56, 959–972. [Google Scholar] [CrossRef]
- Yu, Y.; Zhang, Y.; Xiao, M.; Zhao, C.; Yao, H. A meta-analysis of film mulching cultivation effects on soil organic carbon and soil greenhouse gas fluxes. Catena 2021, 206, 105483. [Google Scholar] [CrossRef]
- Abubakar, S.A.; Hamani, A.K.M.; Chen, J.; Sun, W.; Wang, G.; Gao, Y.; Duan, A. Optimizing N-fertigation scheduling maintains yield and mitigates global warming potential of winter wheat field in North China Plain. J. Clean. Prod. 2022, 357, 131906. [Google Scholar] [CrossRef]
- Berger, S.; Kim, Y.; Kettering, J.; Gebauer, G. Plastic mulching in agriculture—Friend or foe of N2O emissions? Agric. Ecosyst. Environ. 2013, 167, 43–51. [Google Scholar] [CrossRef]
- Akhtar, K.; Wang, W.; Ren, G.; Khan, A.; Enguang, N.; Khan, A.; Feng, Y.; Yang, G.; Wang, H. Straw mulching with inorganic nitrogen fertilizer reduces soil CO2 and N2O emissions and improves wheat yield. Sci Total Environ. 2020, 741, 140488. [Google Scholar] [CrossRef]
- Wu, H.; MacDonald, G.K.; Galloway, J.N.; Zhang, L.; Gao, L.; Yang, L.; Yang, J.; Li, X.; Li, H.; Yang, T. The influence of crop and chemical fertilizer combinations on greenhouse gas emissions: A partial life-cycle assessment of fertilizer production and use in China. Resour. Conserv. Recycl. 2021, 168, 105303. [Google Scholar] [CrossRef]
- Li, Y.; Zheng, Q.; Yang, R.; Zhuang, S.; Lin, W.; Li, Y. Evaluating microbial role in reducing N2O emission by dual isotopocule mapping following substitution of inorganic fertilizer for organic fertilizer. J. Clean. Prod. 2021, 326, 129442. [Google Scholar] [CrossRef]
- Das, S.; Adhya, T.K. Effect of combine application of organic manure and inorganic fertilizer on methane and nitrous oxide emissions from a tropical flooded soil planted to rice. Geoderma 2014, 213, 185–192. [Google Scholar] [CrossRef]
- Yang, Y.; Liu, H.; Lv, J. Response of N2O emission and denitrification genes to different inorganic and organic amendments. Sci. Rep. 2022, 12, 3940. [Google Scholar] [CrossRef] [PubMed]
- Zhou, B.; Wang, Y.; Feng, Y.; Lin, X. The application of rapidly composted manure decreases paddy CH4 emission by adversely influencing methanogenic archaeal community: A greenhouse study. J. Soils Sediments 2016, 16, 1889–1900. [Google Scholar] [CrossRef]
- Mukumbuta, I.; Shimizu, M.; Hatano, R. Mitigating global warming potential and greenhouse gas intensities by applying composted manure in cornfield: A 3-year field study in an andosol soil. Agriculture 2017, 7, 13. [Google Scholar] [CrossRef]
- Zhang, D.; Hu, X.; Ma, J.; Guo, Y.; Zong, J.; Yang, X. Effects of tillage and fertility on soil nitrogen balance and greenhouse gas emissions of wheat-maize rotation system in Central Henan Province, China. J. Appl. Ecol. 2021, 32, 1753–1760. [Google Scholar]
- Li, Y.; Wen, Y.; Lin, Z.; Zhao, B. Effect of different manures combined with chemical fertilizer on yields of crops and gaseous N loss in farmland. J. Plant Nutr. Fertil 2019, 25, 1835–1846. [Google Scholar]
- Wallman, M.; Lammirato, C.; Delin, S.; Klemedtsson, L.; Weslien, P.; Rütting, T. Nitrous oxide emissions from five fertilizer treatments during one year–High-frequency measurements on a Swedish Cambisol. Agric. Ecosyst. Environ. 2022, 337, 108062. [Google Scholar] [CrossRef]
- Yuying, W.; Xiaoxin, L.; Wenxu, D.; Yuming, Z.; Shuping, Q.; Chunsheng, H. Review on greenhouse gas emission and reduction in wheat-maize double cropping system in the North China Plain. Chin. J. Eco-Agric. 2018, 26, 167–174. [Google Scholar]
- Zheng, M.; Liu, J.; Jiang, P.; Wu, J.; Li, Y.; Li, S. Effects of nitrogen fertilizer management on CH4 and N2O emissions in paddy field. Environ. Sci. 2022, 43, 2171–2181. [Google Scholar]
- Guangbin, Z.; Kaifu, S.; Xi, M.; Qiong, H.; Jing, M.; Hua, G.; Yao, Z.; Keith, P.; Xiaoyuan, Y.; Hua, X. Nitrous oxide emissions, ammonia volatilization, and grain-heavy metal levels during the wheat season: Effect of partial organic substitution for chemical fertilizer. Agric. Ecosyst. Environ. 2021, 311, 107340. [Google Scholar] [CrossRef]
- Pang, J.; Wang, X.; Peng, C.; Mu, Y.; Ouyang, Z.; Lu, F.; Zhang, H.; Zhang, S.; Liu, W. Nitrous oxide emissions from soils under traditional cropland and apple orchard in the semi-arid Loess Plateau of China. Agric. Ecosyst. Environ. 2019, 269, 116–124. [Google Scholar] [CrossRef]
- Xie, B.; Gu, J.; Yu, J.; Han, G.; Zheng, X.; Xu, Y.; Lin, H. Effects of n fertilizer application on soil N2O emissions and CH4 uptake: A two-year study in an apple orchard in Eastern China. Atmosphere 2017, 8, 181. [Google Scholar] [CrossRef]
- Zhong, Y.; Li, J.; Xiong, H. Effect of deficit irrigation on soil CO2 and N2O emissions and winter wheat yield. J. Clean. Prod. 2021, 279, 123718. [Google Scholar] [CrossRef]
- Nan, W.; Yue, S.; Huang, H.; Li, S.; Shen, Y. Effects of plastic film mulching on soil greenhouse gases (CO2, CH4 and N2O) concentration within soil profiles in maize fields on the Loess Plateau, China. J. Integr. Agric. 2016, 15, 451–464. [Google Scholar] [CrossRef]
- Li, Y.; Xie, H.; Ren, Z.; Ding, Y.; Long, M.; Zhang, G.; Qin, X.; Siddique, K.H.; Liao, Y. Response of soil microbial community parameters to plastic film mulch: A meta-analysis. Geoderma 2022, 418, 115851. [Google Scholar] [CrossRef]
- Zhang, D.; Cai, D.; Dai, K.; Feng, Z.; Zhang, X.; Wang, X. Soil respiration and its responses to soil moisture and temperature under different tillage systems in dryland maize fields. Acta Ecol. Sin. 2013, 33, 1916–1925. [Google Scholar] [CrossRef][Green Version]
- Ge, P.; Chen, M.; Cui, Y.; Nie, D. The research progress of the influence of agricultural activities on atmospheric environment in recent ten years: A review. Atmosphere 2021, 12, 635. [Google Scholar] [CrossRef]
- Zhang, Z.; Yu, Z.; Zhang, Y.; Shi, Y. Finding the fertilization optimization to balance grain yield and soil greenhouse gas emissions under water-saving irrigation. Soil Tillage Res. 2021, 214, 105167. [Google Scholar] [CrossRef]
- Zhao, Z.; Shi, F.; Guan, F. Effects of plastic mulching on soil CO2 efflux in a cotton field in northwestern China. Sci. Rep. 2022, 12, 4969. [Google Scholar] [CrossRef]
- Chen, S.; Wu, J. The sensitivity of soil microbial respiration declined due to crop straw addition but did not depend on the type of crop straw. Environ. Sci. Pollut. Res. 2019, 26, 30167–30176. [Google Scholar] [CrossRef] [PubMed]
- Li, W.; Zhuang, Q.; Wu, W.; Wen, X.; Han, J.; Liao, Y. Effects of ridge–furrow mulching on soil CO2 efflux in a maize field in the Chinese Loess Plateau. Agric. For. Meteorol. 2019, 264, 200–212. [Google Scholar] [CrossRef]
- Li, Z.; Zhang, R.; Wang, X.; Chen, F.; Tian, C. Growing season carbon dioxide exchange in flooded non-mulching and non-flooded mulching cotton. PLoS ONE 2012, 7, e50760. [Google Scholar] [CrossRef] [PubMed]
- Liu, E.; Zhao, B.; Li, X.; Jiang, R.; Li, Y.; Hwat, B. Biological properties and enzymatic activity of arable soils affected by long-term different fertilization systems. Chin. J. Plant Ecol. 2008, 32, 176. [Google Scholar]
- Yang, M.; Li, Y.; Li, Y.; Chang, S.X.; Yue, T.; Fu, W.; Jiang, P.; Zhou, G. Effects of inorganic and organic fertilizers on soil CO2 efflux and labile organic carbon pools in an intensively managed Moso bamboo (Phyllostachys pubescens) plantation in subtropical China. Commun. Soil Sci. Plant Anal. 2017, 48, 332–344. [Google Scholar] [CrossRef]
- Liang, Z.; Jin, X.; Zhai, P.; Zhao, Y.; Cai, J.; Li, S.; Yang, S.; Li, C.; Li, C. Combination of organic fertilizer and slow-release fertilizer increases pineapple yields, agronomic efficiency and reduces greenhouse gas emissions under reduced fertilization conditions in tropical areas. J. Clean. Prod. 2022, 343, 131054. [Google Scholar] [CrossRef]
- Yu, K.; Fang, X.; Zhang, Y.; Miao, Y.; Liu, S.; Zou, J. Low greenhouse gases emissions associated with high nitrogen use efficiency under optimized fertilization regimes in double-rice cropping systems. Appl. Soil Ecol. 2021, 160, 103846. [Google Scholar] [CrossRef]
- Rongyan, B.; Min, L.; Shang, H.; Wenlong, C.; Hui, W.; Zhixiang, S.; Shan, T.; Ji, W. Comprehensive effects of combined application of organic and inorganic fertilizer on yield, greenhouse gas emissions, and soil nutrient in double-cropping rice systems. J. Appl. Ecol. 2021, 31, 145–153. [Google Scholar]
- Li, C.; Xiong, Y.; Huang, Q.; Xu, X.; Huang, G. Impact of irrigation and fertilization regimes on greenhouse gas emissions from soil of mulching cultivated maize (Zea mays L.) field in the upper reaches of Yellow River, China. J. Clean. Prod. 2020, 259, 120873. [Google Scholar] [CrossRef]
- Meng, C.; Wang, F.; Yang, K.; Shock, C.C.; Engel, B.A.; Zhang, Y.; Tao, L.; Gu, X. Small wetted proportion of drip irrigation and non-mulched treatment with manure application enhanced methane uptake in upland field. Agric. For. Meteorol. 2020, 281, 107821. [Google Scholar] [CrossRef]
- Song, L.; Tian, P.; Zhang, J.; Jin, G. Effects of three years of simulated nitrogen deposition on soil nitrogen dynamics and greenhouse gas emissions in a Korean pine plantation of northeast China. Sci. Total Environ. 2017, 609, 1303–1311. [Google Scholar] [CrossRef] [PubMed]
- Macharia, J.M.; Pelster, D.E.; Ngetich, F.K.; Shisanya, C.A.; Mucheru Muna, M.; Mugendi, D.N. Soil greenhouse gas fluxes from maize production under different soil fertility management practices in East Africa. J. Geophys. Res. Biogeosci. 2020, 125, e2019JG005427. [Google Scholar] [CrossRef]
- Sullivan, B.W.; Selmants, P.C.; Hart, S.C. Does dissolved organic carbon regulate biological methane oxidation in semiarid soils? Glob. Chang. Biol. 2013, 19, 2149–2157. [Google Scholar] [CrossRef]
- Yang, Y.; Fang, H.; Cheng, S.; Xu, L.; Lu, M.; Guo, Y.; Li, Y.; Zhou, Y. Soil enzyme activity regulates the response of soil C fluxes to N fertilization in a temperate cultivated grassland. Atmosphere 2022, 13, 777. [Google Scholar] [CrossRef]
- Liu, H.; Wang, Z.; Yu, R.; Li, F.; Li, K.; Cao, H.; Yang, N.; Li, M.; Dai, J.; Zan, Y. Optimal nitrogen input for higher efficiency and lower environmental impacts of winter wheat production in China. Agric. Ecosyst. Environ. 2016, 224, 1–11. [Google Scholar] [CrossRef]
- Liao, Y.; Guo, S.; Wang, F.; Ma, Y.; Liu, Y. Effects of combined application of organic and inorganic fertilizers on soil fertility and root functional traits in chestnut orchards. J. Nanjing For. Univ. 2021, 45, 84. [Google Scholar]
- Zhao, Z.; Zheng, W.; Ma, Y.; Wang, X.; Li, Z.; Zhai, B.; Wang, Z. Responses of soil water, nitrate and yield of apple orchard to integrated soil management in Loess Plateau, China. Agric. Water Manag. 2020, 240, 106325. [Google Scholar] [CrossRef]
- Pachauri, R.K.; Allen, M.R.; Barros, V.R.; Broome, J.; Cramer, W.; Christ, R.; Church, J.A.; Clarke, L.; Dahe, Q.; Dasgupta, P. Climate Change 2014: Synthesis Report. Contribution of Working Groups I, II and III to the Fifth Assessment Report of the Intergovernmental Panel on Climate Change; IPCC: Geneva, Switzerland, 2014. [Google Scholar]
- Yuan, J.; Sha, Z.; Hassani, D.; Zhao, Z.; Cao, L. Assessing environmental impacts of organic and inorganic fertilizer on daily and seasonal greenhouse gases effluxes in rice field. Atmos. Environ. 2017, 155, 119–128. [Google Scholar] [CrossRef]
- Cuello, J.P.; Hwang, H.Y.; Gutierrez, J.; Kim, S.Y.; Kim, P.J. Impact of plastic film mulching on increasing greenhouse gas emissions in temperate upland soil during maize cultivation. Appl. Soil Ecol. 2015, 91, 48–57. [Google Scholar] [CrossRef]
- Yang, D.; Ye, Z.; Xiao, X.; Yan, Y.; Liu, M.; Xie, G. Effects of chemical fertilizer reduction and organic fertilizer use on the greenhouse gas emissions of early rice fields. J. Agro-Environ. Sci. 2018, 37, 2443–2450. [Google Scholar]
- Yang, B.; Xiong, Z.; Wang, J.; Xu, X.; Huang, Q.; Shen, Q. Mitigating net global warming potential and greenhouse gas intensities by substituting chemical nitrogen fertilizers with organic fertilization strategies in rice–wheat annual rotation systems in China: A 3-year field experiment. Ecol. Eng. 2015, 81, 289–297. [Google Scholar] [CrossRef]
- Gao, H.; Zhang, W.; Peng, C.; Zhang, X.; Qiang, L.; Ping, Z. Emission characteristics of greenhouse gas from maize field of black soil region under long-term fertilization. J. Agric. Resour. Environ. 2017, 34, 422. [Google Scholar]
- Chen, H.; Liu, J.; Zhang, A.; Chen, J.; Cheng, G.; Sun, B.; Pi, X.; Dyck, M.; Si, B.; Zhao, Y. Effects of straw and plastic film mulching on greenhouse gas emissions in Loess Plateau, China: A field study of 2 consecutive wheat-maize rotation cycles. Sci. Total Environ. 2017, 579, 814–824. [Google Scholar] [CrossRef] [PubMed]
- He, G.; Wang, Z.; Li, S.; Malhi, S.S. Plastic mulch: Tradeoffs between productivity and greenhouse gas emissions. J. Clean. Prod. 2018, 172, 1311–1318. [Google Scholar] [CrossRef]
- Fang, P.; Abler, D.; Lin, G.; Sher, A.; Quan, Q. Substituting organic fertilizer for chemical fertilizer: Evidence from apple growers in China. Land 2021, 10, 858. [Google Scholar] [CrossRef]
Disclaimer/Publisher’s Note: The statements, opinions and data contained in all publications are solely those of the individual author(s) and contributor(s) and not of MDPI and/or the editor(s). MDPI and/or the editor(s) disclaim responsibility for any injury to people or property resulting from any ideas, methods, instructions or products referred to in the content. |
© 2023 by the authors. Licensee MDPI, Basel, Switzerland. This article is an open access article distributed under the terms and conditions of the Creative Commons Attribution (CC BY) license (https://creativecommons.org/licenses/by/4.0/).

