Abstract
The objective of this study was to investigate the feeding value of sheepgrass, including its chemical composition, dry matter intake, nutrient digestibility, and available energy, as well as the prediction equations of dry matter intake (DMI), neutral detergent fiber digestibility (NDFD), dry matter digestibility (DMD), digestible energy (DE), and metabolizable energy (ME). Two independent experiments based on a completely randomized experimental design were performed to evaluate the feeding value. The results showed that there were significant relationships between chemical composition and DMI, digestibility, and available energy. The best-fit equations were as follows: DMI (g/d·W0.75) = 121.75 + 0.06CP (%) − 0.24EE (%) − 0.10ADF (%) − 0.60NDF (%) − 0.15OM (%) (R2 = 0.85, p < 0.01), DMD (%) = −1.37 + 0.23CP (%) + 2.96EE (%) + 0.32ADF (%) − 0.82NDF (%) + 1.27OM (%) (R2 = 0.83, p < 0.01), NDFD (%) = 225.58 − 0.59CP (%) + 0.04EE (%) + 0.09ADF (%) − 2.46NDF (%) + 0.12OM (%) (R2 = 0.67, p < 0.01), DE (MJ/kg) = −5.19 + 0.38OM (%) − 0.26NDF (%) − 0.03ADF (%) + 0.16CP (%) (R2 = 0.91, p < 0.01), and ME (MJ/kg) = 5.55 + 0.67DE (MJ/kg) + 0.01CP (%) − 0.01ADF (%) − 0.08NDF (%) + 0.02OM (%) (R2 = 0.98, p < 0.01). This study found the energy value of sheepgrass to be 11 MJ/kg, which is similar to that of millet grass silage. The NDF was the main component that affected DMI and digestibility. Using a hay replacement ratio of 28.5% to determine the forage value of sheepgrass allowed accurate prediction equations to be established. The NDF demonstrated the strongest correlation with DMI, NDFD, OMD, DE, and ME. DE was estimated to be the best single predictor of ME.
1. Introduction
Cold and drought often lead to a lack of quality forage. Northeastern China experiences a feed demand gap of approximately 10 million tons in winter every year, and the lack of high-quality forage, and the risk of cold temperatures often leads to nutritional deficiencies, weight loss, and even the death of livestock in the winter [1,2]. In such circumstances, it is particularly vital to select a suitable forage to alleviate local forage deficiencies.
As an economically and ecologically important grass, sheepgrass (Leymus chinensis) is widely planted all over the world, especially in Eastern Europe and northeastern China [3]. Owing to its balanced nutritional value and resistance to cold, semiarid environmental conditions, it is utilized as a feed for ruminants in cold areas and seasons [4,5]. Previous research has studied its ecological values and characteristics, and determined that sheepgrass has different environmental adaptations and that the highest seed germination rate can be obtained at specific temperatures [6,7]. Additionally, past research studies have examined its chemical components, and found that sheepgrass is a naturally preferred feed with a high NDF content [8,9]. Some studies have shown that the use of sheepgrass to replace part of the whole corn silage significantly reduces rumen acidosis in dairy cows [10]. However, relatively little research has been conducted to determine the nutritional and feeding values, digestibility, and energy availability of sheepgrass. Because of the differences in the nutritional values of sheepgrasses from different regions and the lack of past research on their nutritional values, people cannot make reasonable use of them.
To ensure the accurate feeding of animals and wise usage of sheepgrass, we determined its feeding value through this study, especially its dry matter intake (DMI), available energy value, and nutrient digestibility. In practice, to decrease the production costs, information about its nutritional value is essential. However, measuring the DMI and energy value of sheepgrass and testing its nutrient content are time-consuming and costly processes. The use of prediction equations is a well-known and highly economical method. To maximize feed efficiency and minimize production and input costs, estimating the DMI, nutritional digestibility, and energy value of sheepgrass is essential. Therefore, the objective of this study was to investigate the nutritional value of sheepgrass, including its chemical composition, DMI, nutrient digestibility, and available energy, as well as to establish prediction equations. Previous studies have established prediction equations using in vitro methods [11]. However, the actual environmental changes in vitro vary greatly compared with the environmental changes in vivo. Therefore, in this study, to predict nutrients accurately and reliably, we established prediction equations for DMI, nutrient digestibility, digestible energy (DE), and metabolizable energy (ME) in vivo.
2. Materials and Methods
The Animal Ethics Committee of China Agricultural University approved all procedures involving animals in the present study. The sampling procedures followed the Guidelines on the Ethical Treatment of Experimental Animals (2006) No. 398 set by the Ministry of Science and Technology, Bejing, China.
The sheepgrass hay production areas and species in China were investigated before sheep-feeding trials were conducted, and the main production areas of sheepgrass were determined to be in the northern part of China. The samples were collected at the ripening stage. Table 1 shows the chemical composition of the reference grass (miller silage) and the experimental grass (sheepgrass hay). Table 2 lists the provinces from which the 10 most representative sheepgrass hay samples were collected. Figure 1 shows the locations of these regions in China. The 10 samples were selected based on their cultivation area, nutritional composition, and other factors, but it was somewhat difficult to identify the exact varieties used in the present study. To determine the difference in the digestibility of these samples, we selected those that covered a range of nutrient compositions with the goal of building accurate prediction equations through the subsequent sheep-feeding trials.

Table 1.
Chemical composition of sheepgrass and wheat silage (%, dry matter basis).
Table 2.
Origin provinces of representative sheepgrass hay collected in China.
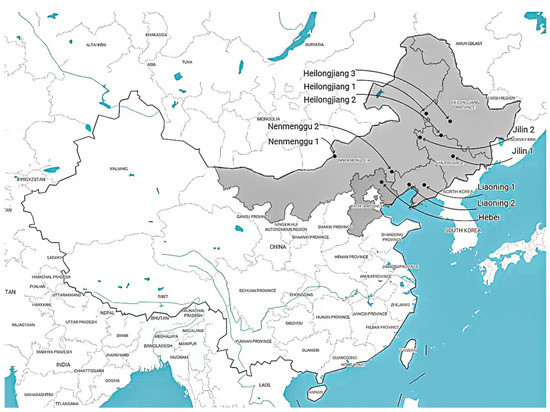
Figure 1.
The locations of the origin provinces in China.
2.1. Experimental Animals and Diets
A total of 30 healthy Chinese Han sheep with initial weights of 20 ± 0.5 kg were individually placed in 30 metabolic cages (1.5 m × 0.5 m × 1.2 m) and individually fed the same basal diet (Table 3) with free access to water. During the experimental period, all sheep were fed daily at 08:30 and 15:30 in equal amounts.
Table 3.
Ingredient composition of the experimental (Exp.) diets (%, dry matter basis).
The reference diets were designed to satisfy metabolizable energy, protein, calcium, phosphorus, and other nutrient requirements at the maintenance level (NRC, 2007) [12]. A completely randomized experimental design was applied, and 30 sheep were randomly assigned to six experimental dietary treatments, with 5 animal replicates per treatment. The study was divided into two experiments. The first experiment had two consecutive experimental runs; in each run, five sheepgrass hays were fed to the sheep, and the casual intake of sheepgrass hay was measured. The second experiment involved 10 sheepgrass diets, and the feeding trial was completed in two consecutive experimental runs. In each run, one reference diet containing 50% millet grass silage and five tested sheepgrass experimental diets were arranged, as shown in Table 3, such that the tested sheepgrass replaced 28.5% of the millet grass silage in the reference diet. Table 4 lists the intakes, fecal excretion, and digestion coefficients, and their energy values for the reference diet and the 10 experimental diets.
Table 4.
Influence of sheepgrass hay on characteristics of total tract digestion and its estimated energy value 1.
In each experimental run, the feeding trial period lasted for 17 days. During a five-day adaptation period, each animal was fed the same reference diet and subsequently placed in a metabolic cage. The animals on the experimental diets shifted to the diets containing the tested sheepgrass for 12 days. During the last five days, all the feces and urine of each animal in the metabolic cages were collected separately on a daily basis for subsequent sample analysis.
2.2. Sample Collection, Storage, and Chemical Analysis
During the last five days of each experimental run, daily diet offers and daily leftovers in the cages were weighed to calculate the feed intake on an as-fed basis and evenly pooled and homogenized for sample collection per animal. The representative samples (approximately 250 g per animal) were oven-dried at 65 °C for 24 h to calculate moisture content, ground to pass through a 40-mesh sieve, and stored at −20 °C for subsequent feed analysis.
During the fecal and urine collection period, all of the feces excreted by each sheep in the metabolic cages were collected separately on a daily basis and kept at −4 °C. The feces were weighed, pooled, and homogenized per animal after the five-day collection period. Representative feces samples per animal (approximately 300 g) were oven-dried at 65 °C for 72 h to calculate the initial moisture content. Afterward, the feces samples were placed at room temperature for 24 h, ground to pass through a 40-mesh sieve, and stored in plastic bags at −4 °C for subsequent chemical analysis.
Along with the feces collection, the urine excretion volume per animal was recorded daily, and 10% tartaric acid (Sinopharm Chemical Reagent Co. Ltd., Shanghai, China) was added to avoid N loss. The entire urine volume was pooled and homogenized per animal after the five-day collection. The representative urine sample per animal (approximately 100 mL) was stored in a −20 °C refrigerator pending measurement.
Following the determination procedure specified by the methods of the Association of Official Analytical Chemists (AOAC) [13], representative samples of tested sheepgrass, diets, leftovers, and feces were analyzed for crude protein (CP; Procedure 990.03), dry matter (DM) (Procedure 934.01), ash (Procedure 942.05), and ether extract (EE; Procedure 920.39). Acid deter fiber (ADF) and neutral detergent fiber (NDF) were determined using a distributed boiling and timing system for fiber analysis (China Agricultural University, Beijing, China), following the adaptation of the procedure described by Van Soest et al. [14]. A heat-stable amylase was used in the assay for NDF determination (Aladdin Inc., Shanghai, China).
2.3. Energy Determination
A sample of 1 g was used in an oxygen bomb calorimeter (Shanghai Mitong Electromechanical Technology Co. Ltd., Shanghai, China) to determine gross energy and manure energy. The urine energy values of each of the five pieces of quantitative filter paper were determined using an oxygen bomb calorimeter, and the average energy value was calculated. For each urine sample, 10 mL of urine was dropped several times on filter paper and dried at 65 °C, and the gross energy of the filter paper with urine was determined using an oxygen bomb calorimeter. Subsequently, the urine energy was calculated as the difference between the gross energy value and the average energy value of the filter paper. Three replicates were conducted for each urine sample.
2.4. Calculations
Based on the method of Adeola et al., we calculated DE and ME for each diet [15], according to the following equations:
where DEd and MEd are the values of DE and ME, respectively, for each diet; and GEi is the total amount of GE intake of per sheep (MJ/kg) calculated as the product of GE content of each diet over Mi, which is the actual feed intake over the five-day collection period. Ef and Eu are the GEs of feces and urine collected per sheep over 5 days, respectively; Em is the methane energy produced per sheep over 5 days. DEb and MEb are the adjusted values of DE and ME in the basal diet, respectively, and 0.95 is the percentage of the ingredients that supplied energy in the diet.
DEd = (GEi − Ef)/Mi,
DEb = DEd/0.95,
MEd = (GEi − Ef − Eu − Em)/Mi
MEb = MEd/0.95,
The methane energy (Em) is derived from the formula of Blaxter et al. [16], according to the following equation:
where Em is the methane energy produced per sheep over 5 days and D is the apparent digestibility of the gross energy of the sheep in each diet.
Em as a percentage of GEi (%) = 3.67 + 0.062D,
The DE and ME of the sheepgrass were calculated using the method of Yang et al. [17], according to the following equations:
where DEr and MEr are the values of DE and ME, respectively, for each type of sheepgrass, and X% is the percentage of the base diet supplied with energy from sheepgrass.
DEr = (DEd − (100% − X%) × DEb)/X%,
MEr = (MEd − (100% − X%) × MEb)/X%,
The digestibility of the nutrients in sheepgrass was determined using the following equation [17,18]:
where Db, Dt, and Dl represent the digestibility (%) of the component in the basal diet, test diet, and test ingredient (sheepgrass), respectively, and X% is the proportional contribution of the component in the test ingredient to the test diet. Digestibility coefficients were then determined by dividing the grams of component digested by the grams of component consumed.
Dl = (Dt − (100% − X%) × Db)/X%,
2.5. Statistical Data Analysis
All data were analyzed in four independent experiments, after a completely randomized experimental design was performed. UNIVARIATE software of SAS 9.4 (SAS Inst. Inc., Cary, NC, USA) was used for all data checks for normality and outlier detection. No outliers were found. The PROC CORR program of SAS 9.4 (SAS Inst. Inc., Cary, NC, USA) was used to analyze the correlation coefficients between the chemical composition and the DE or ME of sheepgrass. Predictive equations for DMI, digestibility, DE, and ME of sheepgrass were established using the PROC REG program (SAS Inst. Inc., Cary, NC, USA) of SAS 9.4, and Tukey’s multiple range test was used to distinguish the statistical differences between treatments. The LSMEANS values were calculated to determine the treatment means. If p < 0.05, the differences were considered significant. Different chemical components were evaluated for their effects on DMI, nutrient digestibility, and energy values using stepwise regression. Best-fit equations were determined using root mean square error (RMSE), R2 value Bayesian information criterion (BIC), and Akaike’s information criterion (AIC). As the best-fit model, we selected the equation with the greatest R2 value and the lowest RMSE, AIC, and BIC.
3. Results
3.1. Chemical Compositions of Sheepgrass
Table 5 shows the chemical compositions of the sheepgrass. The average DM content of the 10 samples was estimated to be 93.65%. On a DM basis, the concentrations of crude protein (CP), ash, ether extract (EE), acid detergent fiber (ADF), neutral detergent fiber (NDF), and organic matter (OM) were estimated to have average values of 8.34% (7.15 to 9.23%), 1.20% (1.17 to 1.24%), 1.44% (0.87 to 2.53%), 41.06% (38.34 to 45.09%), 72.36% (70.32 to 74.19%), and 92.45% (90.92 to 93.08%), respectively. The change in hay GE content, which was estimated to be 1.42 MJ/kg, was not significant (CV = 2.67). The contents of the hay EE were relatively variable (CV > 10), while the other chemical components were not significantly variable.
Table 5.
Chemical compositions of 10 sheepgrass hays (%, dry matter basis) 1.
3.2. The DMI, Digestibility, and Energy Values of Sheepgrass
Table 6 lists the DMI, digestibility, and energy values of the sheepgrass. As it shows, the average DMI value was found to be 59.95 g/d·W0.75. The change in DMI was not significant (CV < 10). However, there were significant differences in the DMI of the hay between regions. Among them, the DMI of the No. 1 sheepgrass was significantly higher than those of the other regions.
Table 6.
DMI, digestibility, and energy values of sheepgrass (dry matter basis) 1.
The digestibility of sheepgrass does not vary significantly from region to region. The average dry matter digestibility (DMD) and neutral detergent fiber digestibility (NDFD) of sheepgrass were 78.00% and 58.10%, respectively. The DMD values of the No. 1, No. 3, and No. 8 sheepgrasses were significantly higher than those of the other regions.
The DE and ME values of sheepgrass from different sources were significantly different. The mean, maximum, and minimum values of the DE were 11.05 MJ/kg, 12.20 MJ/kg, and 9.95 MJ/kg, respectively. The mean, maximum, and minimum values of the ME content were 8.90 MJ/kg, 8.02 MJ/kg, and 9.88 MJ/kg, respectively. The DE of the No. 2 sheepgrass was significantly lower than those of the other regions.
3.3. Correlation between Chemical Compositions and DMI, Digestibility, and Energy Values of Sheepgrass
Table 7 lists the correlation coefficients between DMI and the chemical composition factors of sheepgrass. As the results showed, a significant correlation was observed between DMI and chemical composition. The DMI of sheepgrass showed a significant negative correlation with NDF content (R = −0.69, p < 0.01) and ADF content (R = −0.69, p < 0.01), and a significant positive correlation with CP (R = 0.67, p < 0.01), EE (R = 0.57, p < 0.01), and OM (R = 0.77, p < 0.01).
Table 7.
Correlation coefficients among chemical compositions and DMI 1.
In Table 8, as was expected, there was a significant correlation between DMD, NDFD, and the chemical composition of sheepgrass. The DMD of sheepgrass showed a significant negative correlation with NDF content (R = −0.87, p < 0.01) and ADF content (R = −0.70, p < 0.01), and a significant positive correlation with CP (R = 0.64, p < 0.01), EE (R = 0.69, p < 0.01), and OM (R = 0.77, p < 0.01).
Table 8.
Correlation coefficients among chemical compositions and digestibility 1.
The NDFD of sheepgrass showed a significant negative correlation with NDF content (R = −0.80, p < 0.01) and ADF content (R = −0.54, p < 0.01), and a significant positive correlation with CP (R = 0.44, p < 0.05), EE (R = 0.48, p < 0.01), and OM (R = 0.67, p < 0.01).
Table 9 shows that there was a significant correlation between DE, ME, CP, EE, ADF, NDF, and OM. DE demonstrated a significant positive correlation with CP, EE, and OM, with the correlation coefficients of 0.74, 0.52 and 0.90, respectively. The ADF and NDF showed significant negative correlations, with correlation coefficients of −0.74 and −0.92, respectively. ME showed significant positive correlations with CP, EE, and OM, with correlation coefficients of 0.73, 0.54, and 0.89, respectively. ME demonstrated significant negative correlations of –0.74 and –0.92 with ADF and NDF, respectively.
Table 9.
Coefficients of correlation between chemical compositions and energy 1.
3.4. Prediction Equation
From the above study, it was shown that the DMI, DMD, NDFD, DE, and ME of sheepgrass were significantly correlated with CP, EE, ADF, NDF, and OM contents. Therefore, these conventional nutrients were used as predictors to establish prediction equations for the DMI, DMD, MDFD, DE, and ME of sheepgrass, and the equations are shown in Table 10, Table 11, Table 12 and Table 13.
Table 10.
Prediction equations for dry matter intake (DMI) in sheepgrass and chemical characteristics 1.
Table 11.
Prediction equations for dry matter digestibility (DMD) in sheepgrass and chemical characteristics 1.
Table 12.
Prediction equations for NDF digestibility (NDFD) in sheepgrass and chemical characteristics 1.
Table 13.
Sheepgrass digestible energy (DE) and metabolizable energy (ME) prediction equations 1.
Table 10, Table 11, Table 12 and Table 13 showed that the R2 values of the prediction equations for DMI, DMD, NDFD, DE, and ME were relatively small when a single chemical component was used as a predictor and increased with increases in the influencing factors. However, when only one chemical component was selected as a predictor, NDF was the best choice. The equations were as follows: DMI (g/d·W0.75) = 104.04 − 0.61NDF (%) (R2 = 0.83, p < 0.01), DMD (%) = 221.61 − 2.02NDF (%) (R2 = 0.76, p < 0.01), NDFD (%) = 208.72 − 2.07NDF (%) (R2 = 0.64, p < 0.01), DE (MJ/kg) = 56.51 − 0.63NDF (%) (R2 = 0.82, p < 0.01), and ME (MJ/kg) = 46.93 − 0.52NDF (%) (R2 = 0.85, p < 0.01).
The equations with the greatest R2 and minimum values of RESM, AIC, and BIC were DMI (g/d·W0.75) = 121.75 + 0.06CP (%) − 0.24EE (%) − 0.10ADF (%) − 0.60NDF (%) − 0.15OM (%) (R2 = 0.85, p < 0.01), DMD (%) = −1.37 + 0.23CP (%) + 2.96EE (%) + 0.32ADF (%) − 0.82NDF (%) + 1.27OM (%) (R2 = 0.83, p < 0.01), NDFD (%) = 225.58 − 0.59CP (%) + 0.04EE (%) + 0.09ADF (%) − 2.46NDF (%) + 0.12OM (%) (R2 = 0.67, p < 0.01), DE (MJ/kg) = −5.19 + 0.38OM (%) − 0.26NDF (%) − 0.03ADF (%) + 0.16CP (%) (R2 = 0.91, p < 0.01), and ME (MJ/kg) = 5.55 + 0.67DE (MJ/kg) + 0.01CP (%) − 0.01ADF (%) − 0.08NDF (%) + 0.02OM (%) (R2 = 0.98, p < 0.01).
Furthermore, the accuracy of the best-fit prediction equations for DMI (g/d·W0.75), DMD (%), NDFD (%), DE (MJ/kg DM) and ME (MJ/kg DM) in sheepgrass samples is presented in Figure 2, Figure 3 and Figure 4.
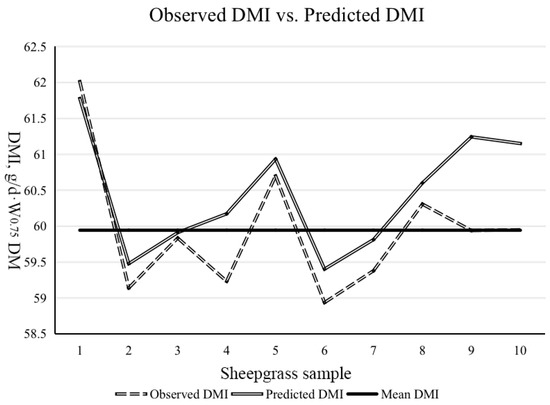
Figure 2.
The distribution of observed dry matter intake (DMI) of sheepgrass and DMI of sheepgrass calculated from best-fit equation.
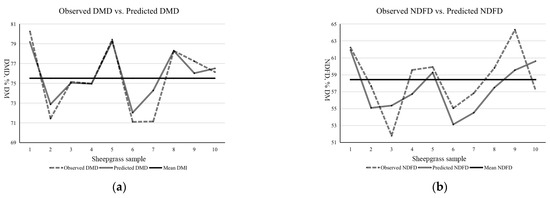
Figure 3.
(a) The distribution of observed dry matter digestibility (DMD) and DMD of sheepgrass calculated from best-fit equation; (b) the distribution of observed detergent fiber digestibility (NDFD) and NDFD of sheepgrass calculated from best-fit equation.
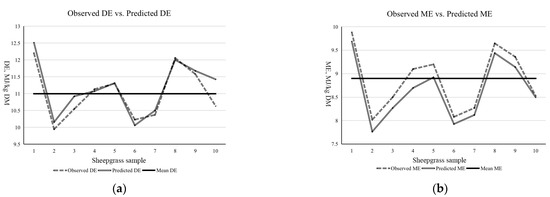
Figure 4.
(a) The distribution of observed digestible energy (DE) and DE of sheepgrass calculated from best-fit equation; (b) the distribution of observed metabolizable energy of sheepgrass (ME) and ME of sheepgrass calculated from best-fit equation.
4. Discussion
4.1. Chemical Composition of Sheepgrass
Some of the chemical components of the sheepgrass in this study were the same as those in previous studies [8,9], with the differences being that the NDF content (72.36%) of the sheepgrass in this study was slightly higher (9.21%) and the ash content (1.20%) was lower (13.47%). The difference in the NDF may be due to the different mowing periods [19] and the stubble height of sheepgrass [20]. Some studies have found differences in the chemical composition of feed from different regions, which could explain the different results [21,22], because the sheepgrass used came from different regions of China. The low ash content may be due to the fact that, in this study, the sheepgrass was cut and demixed by us before feeding and the sheepgrass had low soil content. The EE content (0.87 to 2.53%) was highly variable (CV = 34.87), which could have been caused by the large differences in the chemical compositions of different species of sheepgrass [23].
Based on the few reports on the energy value of sheepgrass, we chose wheat hay and oat hay, which have similar nutritional compositions to sheepgrass, for comparative discussion. The NRC (2007) reported [12] that their DE values are 10.46 MJ/kg and 10.04 MJ/kg, respectively, which are slightly below the value for sheepgrass.
A past study has shown the DM digestibility of oat hay to be 71%, which is slightly lower than that of sheepgrass. One possible reason for this could be that the energy levels of this diet are maintenance levels, which cause increased digestibility of nutrients. However, the NDF digestibility determined in the study was 58.36%, which is similar to that of sheepgrass [24].
4.2. Correlation between the Chemical Characteristics and DMI, DE, ME, and Nutrient Digestibility of Sheepgrass
The DMI, DE, ME, and digestibility of the ration are important parameters for assessing its nutritional value. There are many factors affecting these parameters, mainly the animal, the ration composition, processing and modulation of the ration, feeding level, etc. Analyzing the conditions of this test, except for the base ration in the substitution (sheepgrass), all other parts could be considered consistent. Therefore, the differences in DMI, DE, ME, and digestibility were mainly due to differences in the chemical composition of the sheepgrass.
Plant characteristics, such as structure and chemical composition, are thought to have a significant effect on livestock feed intake [25,26,27]. A correlation has been reported between DMI and CP and the NDF of roughage in sheep [28]. Forage with a higher CP content and lower fiber content has high digestibility; this was also observed in the results of this study. Feed intake is thought to be determined by the NDF content and digestion rate because the rate of NDF digestion and degradation affects the volume of rumen surimi. In the case of high effective NDF (eNDF, which is the minimum amount of NDF that stimulates rumination), roughage fermentation and efflux rates decrease, thereby reducing livestock feed intake and satiating them [29]. The present study also found a negative correlation between DMI and ADF content; ADF may cause a decrease in DMI, similar to NDF. A significant positive correlation between digestibility and EE and OM was also observed in the present study.
According to the results, the sheepgrass NDFD and DMD correlated with its chemical composition. The NDFD and DMD demonstrated significant correlations with CP, ADF, and NDF. The ADF and NDF values demonstrated the best relationship, whereas the CP values showed the weakest relationship. This is consistent with previous research [30]. The ADF and NDF content affects the digestibility of the nutrients, and the DMD and NDFD values of the ration decrease as the NDF content increases. This could be because an increase in the fiber level results in faster emptying of the DM and NDF in the digestive tract. This undoubtedly also decreases the time available for enzymes to act upon the feed and the chances of it being absorbed by the intestine. A significant positive correlation between digestibility and EE and OM was also demonstrated in the present study.
It has been shown that there is a significant correlation between the effective energy of the feed and its nutrient content [31]. In the present study, the correlation coefficients between EE and DE showed a positive relationship. This could be because dietary lipids (fat) are an important source of metabolizable energy. The DE or ME content was significantly correlated with the NDF or ADF, which aligns with the results of past studies [32,33]. There is a possibility that cellulose and lignin work as diluents, thereby displacing more digestible fractions, such as OM, and lowering the energy content. The dilution effect alone cannot fully explain the changes in energy content. It may be that fiber reduces the digestibility of nutrients [34]. Animals need to consume more of the diet to maintain their needs when the fiber content in the diet is high, and the increase in intake increases the rate of passage of the surimi through the digestive tract, thereby reducing the dry matter digestibility of the diet [35]. Therefore, the DE and ME content are reduced. The results showed a significant positive correlation between DE and ME content, which is consistent with previous studies [34].
4.3. Prediction Equations for DMI, DE, ME, and Nutrient Digestibility of Sheepgrass
Conducting experiments to measure DMI can be laborious and costly [36]. As an alternative, equations have been developed to predict DMI [37]. Using the NDF and ADF values alone may often result in inaccurate estimates of DMI and DDM, both for grasses and for legumes [38]. Therefore, we considered additional factors in chemical composition for DMI in the equations. As the results showed, there were significant relationships between DMI and CP, EE, ADF, NDF, and OM. The NDF showed the strongest correlation with DMI, and it could act as the best single predictor. The corresponding equation was MI (g/d·W0.75) =104.04 − 0.61NDF (%) (R2 = 0.83, p < 0.01). With a higher number of predictors, the value of R2 increases, whereas the RESM, AIC, and BIC values decrease. The equation with the highest R2 value and the lowest values of RESM, AIC, and BIC was DMI (g/d·W0.75) = 121.75 + 0.06CP (%) − 0.24EE (%) − 0.10ADF (%) − 0.60NDF (%) − 0.15OM (%) (R2 = 0.85, p < 0.01). As SCA (1990) reported, they established prediction equations about the intake of an all-grass diet [39]. The equation was as follows: I = 0.04 A Z (1.7-Z). The DMI we obtained using this equation was 67.14 g/d·W0.75. However, the DMI we determined in the present study was 59.95 g/d·W0.75. The difference between these two results is 11.99%. Therefore, our equations for sheepgrass only predicted the DMI more accurately than this equation for all forages.
It has been shown that there is a significant regression relationship between the digestibility and nutrient content of the ration [40,41,42]. In this study, we analyzed the correlation between the digestibility of nutrients and their content in raw materials. CP, EE, ADF, NDF, and OM were the five factors with a strong correlation between digestibility and chemical composition. The NDF demonstrated the strongest correlation with digestibility; therefore, the NDF was determined to be the best single predictor of DMD and NDFD. The corresponding equations were as follows: DMD (%) = 221.61 − 2.02NDF (%) (R2 = 0.76, p < 0.01) and NDFD (%) = 208.72 − 2.07NDF (%) (R2 = 0.64, p < 0.01). With a higher number, the value of R2 increases, whereas the RESM, AIC, and BIC values decrease. The equations with the highest R2 values and the lowest RESM, AIC, and BIC values were the following: DMD (%) = −1.37 + 0.23CP (%) + 2.96EE (%) + 0.32ADF (%) − 0.82NDF (%) + 1.27OM (%) (R2 = 0.83, p < 0.01) and NDFD (%) = 225.58 − 0.59CP (%) + 0.04EE (%) + 0.09ADF (%) − 2.46NDF (%) + 0.12OM (%) (R2 = 0.67, p < 0.01). Zhao, M.M., et al. established prediction equations for the DMD and NDFD of roughages, with NDF, CP, and OM as the factors. The developed prediction equations were as follows: DMD = 87.91 − 0.57NDF and NDFD = −144.11 − 0.39NDF + 2.38OM [43]. Compared with these equations, the equations developed in this study used more factors. However, the energy levels of the diets fed to the sheep in this study differed from those in their study, resulting in large differences in the digestibility of the nutrients. Therefore, the accuracy of these prediction equations could not be compared.
Prediction equations are widely used to predict a feed’s DE and ME content due to their ability to effectively predict energy values and reduce the cost and time of metabolizable experiments. The reasonableness of the predictors selected for the model construction ensures the objectivity and reliability of the prediction model. Therefore, this method is more effective and faster and can be suitably used in production [44,45,46]. In the present study, CP, EE, ADF, NDF, and OM were chosen as the main predictors for DE and ME. Nutrients (CP, EE, ADF, NDF, and OM) have a significant correlation with DE or ME, which may explain this phenomenon. When the energy value was predicted using only one factor, NDF was the best predictor. The corresponding equation was determined to be as follows: DE (MJ/kg) = 56.51 − 0.63NDF (%) (R2 = 0.82, p < 0.01). With a higher number of predictors, the R2 value increases, whereas the RESM, AIC, and BIC values decrease. The equation with the highest R2 value and the lowest RESM, AIC, and BIC values was found to be as follows: DE (MJ/kg) = −5.19 + 0.38OM (%) − 0.26NDF (%) − 0.03ADF (%) + 0.16CP (%) (R2 = 0.91, p < 0.01). The DE was considered the best single predictor of ME, and the corresponding equation was estimated to be the following: ME (MJ/kg) = −0.08 + 0.81DE (MJ/kg) (R2 = 0.97, p < 0.01). The best-fit equation of ME was determined to be the following: ME (MJ/kg) = 5.55 + 0.67DE (MJ/kg) + 0.01CP (%) − 0.01ADF (%) − 0.08NDF (%) + 0.02OM (%) (R2 = 0.98, p < 0.01). The authors of a previous study established an optimal ME prediction equation by determining the nutrient contents of 11 roughages, as follows: ME = −49.59 + 0.59OM − 0.11NDF (R2 = 0.95, p < 0.01) [47]. Compared with their equation, ours used more factors. However, the equation established in this study has a lower R2 (0.91) than the equation developed in [47]. This may be due to the greater variety of forage they used.
5. Conclusions
In summary, there are differences in the chemical compositions of sheepgrasses from different regions, but these differences are not significant. This study found the energy value of sheepgrass to be 11 MJ/kg, which is similar to that of millet grass silage. The NDF was determined to be the main component affecting DMI and digestibility. Using a hay replacement ratio of 28.5% to determine the forage value of sheepgrass allowed the establishment of accurate prediction equations. Furthermore, the nutritional composition and feeding value of sheepgrass were similar to those of oat hay and wheat hay. In practice, when oat hay and wheat hay make up approximately 30% of the diet, sheepgrass hay can be used to replace them. The chemical composition content could be used to predict the DMI, digestibility, and available energy of sheepgrass. The NDF demonstrated the strongest correlation with DMI, NDFD, OMD, DE, and ME. The DE value was estimated to be the best single predictor of ME. The obtained prediction equations were validated to ensure that they accurately predicted the values of the available energy, DMI, and digestibility of some nutrients found in sheepgrass. The best-fit equations for sheepgrass were DMI (g/d·W0.75) = 121.75 + 0.06CP (%) − 0.24EE (%) − 0.10ADF (%) − 0.60NDF (%) − 0.15OM (%) (R2 = 0.85, p < 0.01), DMD (%) = −1.37 + 0.23CP (%) + 2.96EE (%) + 0.32ADF (%) − 0.82NDF (%) + 1.27OM (%) (R2 = 0.83, p < 0.01), NDFD (%) = 225.58 − 0.59CP (%) + 0.04EE (%) + 0.09ADF (%) − 2.46NDF (%) + 0.12OM (%) (R2 = 0.67, p < 0.01), DE (MJ/kg) = −5.19 + 0.38OM (%) − 0.26NDF (%) − 0.03ADF (%) + 0.16CP (%) (R2 = 0.91, p < 0.01), and ME (MJ/kg) = 5.55 + 0.67DE (MJ/kg) + 0.01CP (%) − 0.01ADF (%) − 0.08NDF (%) + 0.02OM (%) (R2 = 0.98, p < 0.01).
Author Contributions
Conceptualization, H.C. and H.Y.; methodology, F.X.; software, H.C.; validation, Q.W., F.X. and Y.L.; formal analysis, and L.L.; investigation, W.W.; resources, Y.B. and L.Z.; data curation, Z.C. and F.Z.; writing—original draft preparation, H.C.; writing—review and editing, H.C., W.W., Y.W. and H.Y.; project administration, H.Y.; funding acquisition, H.Y. All authors have read and agreed to the published version of the manuscript.
Funding
This project was funded by the Science and Technology Project, which is commissioned by the Bureau of Animal Husbandry, Ministry of Agriculture and Rural Affairs, China (Campus number: 202105510410447).
Institutional Review Board Statement
Every procedure involving animals was approved by the Animal Ethics Committee of China Agricultural University. The sampling procedures followed the Guidelines on Ethical Treatment of Experimental Animals (2006) No. 398 set by the Ministry of Science and Technology, China.
Data Availability Statement
Not applicable.
Conflicts of Interest
The authors declare no conflict of interest.
References
- Wang, D.L.; Fang, J.; Xing, F.; Yang, L. Alfalfa as a supplement of dried cornstalk diets: Associative effects on intake, digestibility, nitrogen metabolisation, rumen environment and hematological parameters in sheep. Livest. Sci. 2008, 113, 87–97. [Google Scholar] [CrossRef]
- Khounsy, S.; Nampanya, S.; Inthavong, P.; Yang, M.; Khamboungheung, B.; Avery, M.; Bush, R.; Rast, L.; Windsor, P.A. Signifificant mortality of large ruminants due to hypothermia in northern and central Lao PDR. Trop. Anim. Health Prod. 2012, 44, 835–842. [Google Scholar] [CrossRef] [PubMed]
- Liu, Z.P.; Li, X.F.; Li, H.J.; Yang, Q.C.; Liu, G.S. The Genetic Diversity of Perennial Leymus chinensis Originating from China. Grass Forage Sci. 2007, 62, 27–34. [Google Scholar] [CrossRef]
- Xianjun, P.; Xingyong, M.; Weihong, F.; Man, S.; Liqin, C.; Alam, I.; Lee, B.-H.; Dongmei, Q.; Shihua, S.; Gongshe, L. Improved Drought and Salt Tolerance of Arabidopsis Thaliana by Transgenic Expression of a Novel DREB Gene from Leymus chinensis. Plant Cell Rep. 2011, 30, 1493–1502. [Google Scholar] [CrossRef]
- Liu, B.; Kang, C.; Wang, X.; Bao, G. Tolerance Mechanisms of Leymus chinensis to Salt-Alkaline Stress. Acta Agric. Scand. Sect. B-Soil Plant Sci. 2015, 65, 723–734. [Google Scholar] [CrossRef]
- Li, X.; Liu, Z.; Liu, P.; Yuan, G.; Liu, S. Seed Traits and Germination Characteristics of Sheepgrass (Leymus chinensis); Liu, G., Li, X., Zhang, Q., Eds.; Springer-Verlag Singapore Pte Ltd: Singapore, 2019; pp. 101–115. ISBN 9789811386336. [Google Scholar]
- Chen, S.; Huang, X.; Yan, X.; Zhang, L.; Zhao, P. Advances on Gene Resource Mining in Sheepgrass (Leymus chinensis). In Sheepgrass (Leymus chinensis): An Environmentally Friendly Native Grass for Animals; Liu, G., Li, X., Zhang, Q., Eds.; Springer Singapore: Singapore, 2019; pp. 231–245. ISBN 9789811386329. [Google Scholar]
- Hao, W.; Tian, P.; Zheng, M.; Wang, H.; Xu, C. Characteristics of Proteolytic Microorganisms and Their Effects on Proteolysis in Total Mixed Ration Silages of Soybean Curd Residue. Asian-Australas. J. Anim. Sci. 2020, 33, 100–110. [Google Scholar] [CrossRef]
- Zhang, X.Q.; Jiang, C.; Jin, Y.M.; Li, P.; Zhong, J.F. The Effect of Substitution of Mixed Grass Hay with Urtica Cannabina Hay and/or Leymus chinensis Hay on Blood Biochemical Profile, Carcass Traits, and Intramuscular Fatty Acid Composition in Finishing Lambs. Anim. Feed Sci. Technol. 2021, 272, 114780. [Google Scholar] [CrossRef]
- Bender, R.W.; Lopes, F.; Cook, D.E.; Combs, D.K. Effects of Partial Replacement of Corn and Alfalfa Silage with Tall Fescue Hay on Total-Tract Digestibility and Lactation Performance in Dairy Cows. J. Dairy Sci. 2016, 99, 5436–5444. [Google Scholar] [CrossRef]
- Menke, K.H.; Raab, L.; Salewski, A.; Steingass, H.; Fritz, D.; Schneider, W. The Estimation of the Digestibility and Metabolizable Energy Content of Ruminant Feedingstuffs from the Gas Production When They Are Incubated with Rumen Liquor in Vitro. J. Agric. Sci. 1979, 93, 217–222. [Google Scholar] [CrossRef]
- National Research Council (NRC). Nutrient Requirements of Small Ruminants: Sheep, Goats, Cervids and New World Camelids, 7th ed.; National Academy Press: Washington, DC, USA, 2007; pp. 1–347. [Google Scholar]
- AOAC Int. AOAC Official Methods of Analysis of AOAC International, 18th ed.; Hortwitz, W., Latimer, G.W., Jr., Eds.; Rev. 2; AOAC Int.: Gaithersburg, MD, USA, 2007. [Google Scholar]
- Van Soest, P.J.; Robertson, J.B.; Lewis, B.A. Methods for Dietary Fiber, Neutral Detergent Fiber, and Nonstarch Polysaccharides in Relation to Animal Nutrition. J. Dairy Sci. 1991, 74, 3583–3597. [Google Scholar] [CrossRef]
- Adeola, O. Digestion and Balance Techniques in Pigs; CRC Press: Boca Raton, FL, USA, 2000; ISBN 978-0-8493-0696-9. [Google Scholar]
- Blaxter, K.L.; Clapperton, J.L. Prediction of the Amount of Methane Produced by Ruminants. Br. J. Nutr. 1965, 19, 511–522. [Google Scholar] [CrossRef]
- Yang, P.; Fan, Y.; Zhu, M.; Yang, Y.; Ma, Y. Energy Content, Nutrient Digestibility Coefficient, Growth Performance and Serum Parameters of Pigs Fed Diets Containing Tomato Pomace. J. Appl. Anim. Res. 2018, 46, 1483–1489. [Google Scholar] [CrossRef]
- Kong, C.; Adeola, O. Evaluation of Amino Acid and Energy Utilization in Feedstuff for Swine and Poultry Diets. Asian-Australas. J. Anim. Sci. 2014, 27, 917–925. [Google Scholar] [CrossRef] [PubMed]
- Fisher, D.S.; Mayland, H.F.; Burns, J.C. Variation in Ruminants’ Preference for Tall Fescue Hays Cut Either at Sundown or at Sunup. J. Anim. Sci. 1999, 77, 762–768. [Google Scholar] [CrossRef] [PubMed]
- Volesky, J.D.; Anderson, B.E. Defoliation Effects on Production and Nutritive Value of Four Irrigated Cool-Season Perennial Grasses. Agron. J. 2007, 99, 494–500. [Google Scholar] [CrossRef]
- Leeson, S.; Yersin, A.; Volker, L. Nutritive Value of the 1992 Corn Crop. J. Appl. Poult. Res. 1993, 2, 208–213. [Google Scholar] [CrossRef]
- Latham, R.E.; Williams, M.P.; Flores, C.; Masey O’Neill, H.V.; York, T.W.; Lee, J.T. Impact of Variable Corn Nutrient Content, AME Prediction, and Xylanase Inclusion on Growth Performance. J. Appl. Poult. Res. 2016, 25, 338–351. [Google Scholar] [CrossRef]
- Noblet, J.; Perez, J.M. Prediction of Digestibility of Nutrients and Energy Values of Pig Diets from Chemical Analysis. J. Anim. Sci. 1993, 71, 3389–3398. [Google Scholar] [CrossRef]
- An, X.; Zhang, L.; Luo, J.; Zhao, S.; Jiao, T. Effects of Oat Hay Content in Diets on Nutrient Metabolism and the Rumen Microflora in Sheep. Animals 2020, 10, 2341. [Google Scholar] [CrossRef]
- Cooper, S.D.B.; Kyriazakis, I.; Oldham, J.D. The Effect of Late Pregnancy on the Diet Selections Made by Ewes. Livest. Prod. Sci. 1994, 40, 263–275. [Google Scholar] [CrossRef]
- Owen-Smith, N. Foraging Responses of Kudus to Seasonal Changes in Food Resources: Elasticity in Constraints. Ecology 1994, 75, 1050–1062. [Google Scholar] [CrossRef]
- Molle, G.; Decandia, M.; Giovanetti, V.; Cabiddu, A.; Fois, N.; Sitzia, M. Responses to Condensed Tannins of Flowering Sulla (Hedysarum coronarium L.) Grazed by Dairy Sheep: Part 1: Effects on Feeding Behaviour, Intake, Diet Digestibility and Performance. Livest. Sci. 2009, 123, 138–146. [Google Scholar] [CrossRef]
- Yang, Z.; Wang, Y.; Yuan, X.; Wang, L.; Wang, D. Forage Intake and Weight Gain of Ewes Is Affected by Roughage Mixes during Winter in Northeastern China. Anim. Sci. J. Nihon Chikusan Gakkaiho 2017, 88, 1058–1065. [Google Scholar] [CrossRef]
- Mertens, D.R.; Ely, L.O. Relationship of Rate and Extent of Digestion to Forage Utilization-A Dynamic Model Evaluation. J. Anim. Sci. 1982, 54, 895–905. [Google Scholar] [CrossRef]
- Adesogan, A.T.; Owen, E.; Givens, D.I. Prediction of the in Vivo Digestibility of Whole Crop Wheat from in Vitro Digestibility, Chemical Composition, in Situ Rumen Degradability, in Vitro Gas Production and near Infrared Reflectance Spectroscopy. Anim. Feed Sci. Technol. 1998, 74, 259–272. [Google Scholar] [CrossRef]
- Detmann, E.; Valadares Filho, S.C.; Pina, D.S.; Henriques, L.T.; Paulino, M.F.; Magalhães, K.A.; Silva, P.A.; Chizzotti, M.L. Prediction of the Energy Value of Cattle Diets Based on the Chemical Composition of the Feeds under Tropical Conditions. Anim. Feed Sci. Technol. 2008, 143, 127–147. [Google Scholar] [CrossRef]
- Li, Q.; Zang, J.; Liu, D.; Piao, X.; Lai, C.; Li, D. Predicting Corn Digestible and Metabolizable Energy Content from Its Chemical Composition in Growing Pigs. J. Anim. Sci. Biotechnol. 2014, 5, 11. [Google Scholar] [CrossRef]
- Ma, D.; Li, J.; Huang, C.; Yang, F.; Wu, Y.; Liu, L.; Jiang, W.; Jia, Z.; Zhang, P.; Liu, X.; et al. Determination of the Energy Contents and Nutrient Digestibility of Corn, Waxy Corn and Steam-Flaked Corn Fed to Growing Pigs. Asian-Australas. J. Anim. Sci. 2019, 32, 1573–1579. [Google Scholar] [CrossRef]
- Yang, P.; Ni, J.J.; Zhao, J.B.; Zhang, G.; Huang, C.F. Regression Equations of Energy Values of Corn, Soybean Meal, and Wheat Bran Developed by Chemical Composition for Growing Pigs. Animals 2020, 10, 1490. [Google Scholar] [CrossRef]
- Brunette, T.; Baurhoo, B.; Mustafa, A.F. Effects of Replacing Grass Silage with Forage Pearl Millet Silage on Milk Yield, Nutrient Digestion, and Ruminal Fermentation of Lactating Dairy Cows. J. Dairy Sci. 2016, 99, 269–279. [Google Scholar] [CrossRef]
- Cheng, L.; Wheadon, N.; Woodward, S.; Edwards, G.; Dewhurst, R. Evaluation of Equations to Predict Dry Matter Intake and Nitrogen Use Efficiency for Dairy Cows on Pasture Feeding Experiments. In Proceedings of the 5th Australasian Dairy Science Symposium, Melbourne, Australia, 13–15 November 2012; pp. 450–451. [Google Scholar]
- Gallo, S.; Tedeschi, L. Developing a Continuous Adjustment Factor for Dry Matter Intake of Gestating and Lactating Ewes. Sci. Agric. 2021, 78, e20190082. [Google Scholar] [CrossRef]
- Moore, J.E.; Coleman, S. Forage Intake, Digestibility, NDF, and ADF: How Well Are They Related? Proc. Am. Forage Grassl. Counc. 2001, 10, 238–242. [Google Scholar]
- Agriculture and Resource Management Council of Australia and New Zealand; Standing Committee on Agriculture and Resource Management; Ruminants Sub-Committee. Feeding Standards for Australian Livestock: Ruminants; CSIRO Publishing: Clayton, Australia, 1990.
- Nousiainen, J.; Rinne, M.; Hellämäki, M.; Huhtanen, P. Prediction of the Digestibility of Primary Growth and Regrowth Grass Silages from Chemical Composition, Pepsin-Cellulase Solubility and Indigestible Cell Wall Content. Anim. Feed Sci. Technol. 2003, 110, 61–74. [Google Scholar] [CrossRef]
- Ammar, H.; López, S.; González, J.S.; Ranilla, M.J. Seasonal Variations in the Chemical Composition and in Vitro Digestibility of Some Spanish Leguminous Shrub Species. Anim. Feed Sci. Technol. 2004, 115, 327–340. [Google Scholar] [CrossRef]
- Owens, F.N.; Sapienza, D.A.; Hassen, A.T. Effect of Nutrient Composition of Feeds on Digestibility of Organic Matter by Cattle: A Review. J. Anim. Sci. 2010, 88, E151–E169. [Google Scholar] [CrossRef] [PubMed]
- Zhao, M.; Tao, M.A.; Junnan, M.A.; Mao, J.; Zhao, J.; Deng, K.; Yang, K.; Diao, Q. Prediction and Equation of Effective Energy Values of Common Roughages for Mutton Sheep. Chin. J. Anim. Nutr. 2016, 28, 2385–2395. [Google Scholar]
- Theriez, M.; Castrillo, C.; Villette, Y. Influence of Metabolizable Energy Content of the Diet and of Feeding Level on Lamb Performances II. Utilization of Metabolizable Energy for Growth and Fattening. Livest. Prod. Sci. 1982, 9, 487–500. [Google Scholar] [CrossRef]
- Deaville, E.R.; Humphries, D.J.; Givens, D.I. Whole Crop Cereals: 2. Prediction of Apparent Digestibility and Energy Value from in Vitro Digestion Techniques and near Infrared Reflectance Spectroscopy and of Chemical Composition by near Infrared Reflectance Spectroscopy. Anim. Feed Sci. Technol. 2009, 149, 114–124. [Google Scholar] [CrossRef]
- Losada, B.; García-Rebollar, P.; Álvarez, C.; Cachaldora, P.; Ibáñez, M.A.; Méndez, J.; De Blas, J.C. The Prediction of Apparent Metabolisable Energy Content of Oil Seeds and Oil Seed By-Products for Poultry from Its Chemical Components, in Vitro Analysis or near-Infrared Reflectance Spectroscopy. Anim. Feed Sci. Technol. 2010, 160, 62–72. [Google Scholar] [CrossRef]
- Zhao, M.; Tao, M.A.; Junnan, M.A.; Jia, P.; Zhao, J.; Deng, K.; Yang, K.; Diao, Q. A Study on Prediction Models of Dietary Nutrient Digestibility and Metabolizable Energy of Mutton Sheep. Chin. J. Anim. Nutr. 2017, 29, 416–425. [Google Scholar]


Disclaimer/Publisher’s Note: The statements, opinions and data contained in all publications are solely those of the individual author(s) and contributor(s) and not of MDPI and/or the editor(s). MDPI and/or the editor(s) disclaim responsibility for any injury to people or property resulting from any ideas, methods, instructions or products referred to in the content. |
© 2023 by the authors. Licensee MDPI, Basel, Switzerland. This article is an open access article distributed under the terms and conditions of the Creative Commons Attribution (CC BY) license (https://creativecommons.org/licenses/by/4.0/).