Abstract
Wheat, which is scientifically known as Triticum aestivum L., is a very nutritious grain that serves as a key component of the human diet. The use of mutation breeding as a tool for crop improvement is a reasonably rapid procedure, and it generates a variety that may be used in selective breeding programs as well as functional gene investigations. The present experiment was used to evaluate the potential application of a conventional chemical mutagenesis technique via sodium azide (NaN3) for the germination and seedling growth stage in wheat. Experiments with NaN3 mutagenesis were conducted using four different treatment periods (0, 1, 2, and 3 h) and five different concentrations (0, 0.5, 1, 1.5, and 2 mM). The genomic instability and cytosine methylation of wheat using its seeds were investigated after they were treated. In order to evaluate the genomic instability and cytosine methylation in wheat that had been treated, interprimer binding site (iPBS) markers were used. The mutagenic effects of NaN3 treatments had considerable polymorphism on a variety of impacts on the cytosine methylation and genomic instability of wheat plants. The results of the experiment showed considerable changes in the iPBS profiles produced by the administration of the same treatments at different dosages and at different times. Coupled restriction enzyme digestion interprimer binding site (CRED-iPBS) assays identified changes in gDNA cytosine methylation. The highest polymorphism value was obtained during 1 h + 2 mM NaN3, while the lowest (20.7%) was obtained during 1 h + 1.5 mM NaN3. Results showed that treatments with NaN3 had an effect on the level of cytosine methylation and the stability of the genomic template in wheat plants in the germination stage. Additionally, an integrated method can be used to for mutation-assisted breeding using a molecular marker system in wheat followed by the selection of desired mutants.
1. Introduction
In addition to being the birthplace of numerous plant species, Türkiye also serves as their genetic origin. In this group, wheat stands out as the most significant plant [1]. Wheat is a vital dietary staple. It has the largest cultivation area and output in the world [2]. Environmental stressors hinder product output worldwide [3]. Given recent climate changes, stable, highly productive wheat types with high lodging, biotic, and abiotic tolerance are the most essential breeding goals [4]. Hence, efficiency and quality factors are examined jointly in today’s breeding studies, which seek to raise unit area efficiency and improve consumer segment quality. It is the responsibility of the plant breeder to either discover new varieties that have a greater capacity for ecological adaptation, better qualities in terms of production and quality, or to improve upon the drawbacks of already existing kinds. In order to achieve this goal, breeders make use of the variants that already exist in nature as well as the new tools and approaches that they have devised [5,6]. Traditional breeding is one of these approaches and is the fundamental building block of breeding. With traditional breeding, many different types of wheat have been developed and put to use in agriculture [7]. Nonetheless, these time-honored practices come with a number of drawbacks. The need for a significant amount of time, work, and resources are among the most significant drawbacks associated with cultivar development. As a result, plant breeders are contemplating fresh, cutting-edge, and contemporary methods of breeding that will make the process of variety more expedient and accessible. The mutation breeding technique is one of these breeding approaches [8,9]. Mutation is the process through which the genetic structure of living organisms may undergo changes that are stable over time. This process can take place in either reproductive cells or somatic cells [10,11]. There is a very small chance that a plant may undergo a spontaneous mutation that will result in the development of desirable qualities. As a result, physical or chemical mutagens have been used in these types of breeding research in order to boost the mutation frequency [12].
A mutation is a change that may be passed down through generations, that takes place at random, and can be caused by natural processes or by exposure to mutagenic substances [13]. Combining research on mutation breeding with in vitro and in vivo methods makes it possible to create a wide variety of mutants at very high frequencies. The kind and variation of the chosen mutation, as well as the applied region of the plant and the application dosage and duration, all have a role in determining the effectiveness of the mutation [14].
Plants may be bred to have increased resistance to biotic and abiotic stressors via the process of mutant breeding. In order to enhance the frequency of mutations, numerous breeding research studies have utilized physical or chemical mutagens [15]. Chemical mutagens cause base pair substitutions, notably from GC to AT, resulting in amino acid alterations that modify protein function but do not eliminate it, as is the case for deletions or frame shift mutations [16]. One of the most potent chemical mutagens that may be found in cultivated plants is sodium azide. Both the concentration of the mutagen and the amount of time that it is applied for play a significant role in the process of mutation induction [17]. With every given level of mutagen concentration and period of exposure, an abnormally high number of mutations will develop in comparison to what would be expected under normal circumstances. Nevertheless, if the concentration is increased to a very high level and the application period is prolonged, negative outcomes, such as increased seedling mortality and damage, may take place [18].
Epigenetic effects are those that take place despite the fact that the DNA sequence remains unchanged. In other words, changes in gene expression may be referred to as epigenetic modifications, and they can occur not just with mitotic inheritance but also with meiotic inheritance without a change in the DNA sequence [19]. C (cytosine) methylation, which occurs at particular sites in the DNA molecule, is the most well-studied epigenetic modification [20]. In plants, cytosine methylation regulates gene expression throughout tissue and organ development and in response to biotic and abiotic stimuli, allowing for evolutionary adaptation to new environments without altering the DNA sequence [21,22]. Researchers have looked at how methylation reacts to a variety of environmental stressors, including cold, drought, salt, and metals. Numerous studies have shown that exposure to various pressures results in either an increase in methylation (referred to as hypermethylation) or a decrease in methylation (referred to as hypomethylation) as a response [23,24,25,26]. There are a variety of approaches used to investigate epigenetic modifications. One of these approaches involves using PCR in conjunction with enzymes that are sensitive to cytosine methylation in order to identify alterations in the DNA [27]. Enzymes sensitive to cytosine methylation make it possible to do high-throughput analysis of this epigenetic control mechanism, and the procedure is simple and cost-effective [28,29]. NaN3 has become an important tool to enhance agronomic traits of crop plants for different biotic and abiotic stress. Up to now, there have been several studies on the detection of conditions of seed treatment with NaN3 and germination studies, the application of NaN3 and crop improvement, and the effects of NaN3 on the mitotic index and chromosomes. Additionally, there are several studies in detection methods for mutations caused by NaN3, such as amplified fragment length polymorphism, protein truncation test, southern hybridization, enzymatic cleavage of nucleic acid heteroduplexes, nucleotide sequencing, sanger’s dideoxy nucleotide method and DNA microarray technology [17]. Based on the latest literature reviews, Türkoğlu et al. [30] conducted a study on the effect of sodium azide on in vitro mutagenesis, polymorphism and genomic instability in wheat. However, researchers have not conducted any studies on epigenetic alterations. To reiterate, previous research has shown that our study is the first one to look at genetic instability and epigenetic studies on the influence that sodium azide has during the germination stage. The objective of this research was to investigate the impact of sodium azide, a chemical mutagen, on genomic instability and cytosine methylation in the Kirik variety of bread wheat (Triticum aestivum L.) in the seedling growth stage, as well as the optimal dosage and application period that may be used in wheat mutation breeding.
2. Materials and Methods
2.1. Plant Material, Seed Germination and Treatments
As study material, seeds from the Kirik type of bread wheat (Triticum aestivum L.) were used. After counting 2000 seeds and rinsing them with tap water, they were combined in 70% ethyl alcohol (EtOH) for 3 min, rinsed four times with sterile distilled water in a sterile cabinet, then surface sterilized by mixing them in 20% sodium hypochlorite with a few drops of Tween for 20 min. The seeds were stored in aerated water for 24 h after being washed with sterile distilled water. The seeds were treated with sodium azide at five different concentrations (0 (control), 0.5 mM, 1 mM, 1.5 mM and 2 mM) and for four different times (control, 1, 2, and 3 h). Hence, 5 × 4 = 20 combinations/applications were created. Following application, the seeds were rinsed for 20 min in tap water to eliminate the mutagen. To evaluate variables associated with germination and seedling, 100 groups of chemical-mutagen-treated seeds were separated into four replications and placed in Petri dishes for a germination study. Each Petri dish received 14 mL of distilled water. During germination, the temperature was set at 25 °C, and 16 h of light and 8 h of dark were administered. Then, at the end of the 14th day, the germinated plants were collected for DNA isolation.
2.2. Isolation of Genomic DNA
DNA was isolated in accordance with Zeinalzadehtabrizi et al. [31]. Using a Nanodrop spectrophotometer and electrophoresis on a 1.5% agarose gel, the concentration and purity of genomic DNA were evaluated.
2.3. iPBS and CRED-iPBS PCR Assays
Using 10 iPBS primers, iPBS and CRED-iPBS (coupled restriction enzyme digestion-interprimer binding site) analyses were performed [32]. In order to perform an iPBS analysis, a PCR reaction was performed in a total volume of 20 µL containing 10× PCR buffer, 25 mM MgCl2, 10 mM dNTP mix, ddH2O, 10 pmol random primer, 1 U Taq DNA polymerase, and 50 ng/mL sample DNA. The reaction was carried out in a PCR mix that contained 10× PCR buffer. After the completion of the vortexing step, the tubes were transferred to a thermocycler for the purpose of amplification. The first step of the PCR process was a pre denaturation step that lasted for five minutes at a temperature of ninety-five °C. This was followed by forty cycles of one minute of denaturing at ninety-five °C, one minute of annealing at fifty-one to fifty-six °C, and two minutes of extension at seventy-two °C. In order to conduct the CRED-iPBS analysis, 1000 ng of sample DNA from each treatment was individually digested at 37 °C for 2 h with 1 µL of HpaII (Thermo Scientific, Waltham, MA, USA) and 1 µL of MspI (Thermo Scientific), in accordance with the instructions provided by the manufacturer. In place of nondigested gDNA, digested DNA (corresponding to each endonuclease) was used in the PCR mix. The amplification process was carried out using the primers that are shown in Table 1. The processes of PCR were identical to those of the iPBS analysis mentioned before. An electrophoresis technique was used to distinguish iPBS and CRED-iPBS PCR products according to their base size [8,27,30,33,34,35]. The (-) a sign in Table 2 and Table 3 indicates that there was no difference between the control and experimental groups in terms of band increase or band decrease.

Table 1.
iPBS-retrotransposons primer names, sequence, the melting temperature (Tm), CG content (%) and annealing temperature used in this study.
Table 2.
Molecular sizes (bp) of appeared/disappeared bands in iPBS profiles of NaN3-treated wheat of varying time and concentration.
Table 3.
Results of CRED-iPBS analysis; molecular size of bands and polymorphism percentage.
3. Results
3.1. Morphological Responses under NaN3 Application
Experimentation on seedling growth of the wheat plant with varying NaN3 mutagen concentration (0.5, 1, 1.5 and 2 mM) for different duration (0, 1, 2, and 3 h) treatments indicated that an increase in concentration and duration of NaN3 treatment leads to a decrease in root and shoot length. This result was obviously among experimental groups. According to Figure 1, the highest root and shoot length was observed in the control treatment and the lowest were showed in the 3 h + 2 mM NaN3 treatment for 14 days.
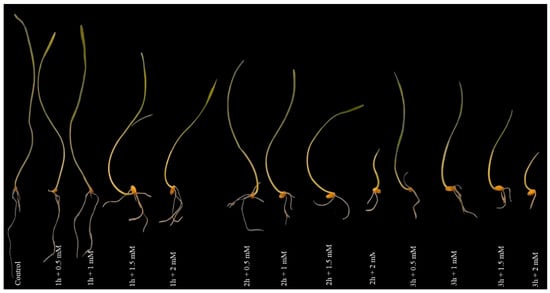
Figure 1.
The appearance of roots and shoots at different times and concentrations of sodium azide; 1: control; 2: 1 h + 0.5 mM NaN3 treatment; 3: 1 h + 1 mM NaN3 treatment; 4: 1 h + 1.5 mM NaN3 treatment; 5: 1 h + 2 mM NaN3 treatment; 6: 2 h + 0.5 mM NaN3 treatment; 7: 2 h + 1 mM NaN3 treatment; 8: 2 h + 1.5 mM NaN3 treatment; 9: 2 h + 2 mM NaN3 treatment; 10: 3 h + 0.5 mM NaN3 treatment; 11: 3 h + 1 mM NaN3 treatment; 12: 3 h + 1.5 mM NaN3 treatment; 13, 3 h + 2 mM NaN3 treatment.
3.2. iPBS Assays
The objective of the iPBS analysis was to ascertain the impact of the co-application of NaN3 on wheat gDNA according to different application times. Ten selected primers produced adequate polymorphism, and specific and stable band profiles in all treatments using the iPBS method.
As indicated in Table 2, a total of 43 bands were seen in the control treatment; iPBS-2391 (10 bands) produced the maximum number of bands, while iPBS-2389 (1 band) produced the fewest. Polymorphic bands had widths ranging from 262 (iPBS-2391) to 1466 (iPBS-2383) base pairs on the molecular scale. The results of the NaN3 mutagenesis experiment showed that experiment found considerable changes in the iPBS profiles produced by administrations of the same treatment at different dosages and at different times. These distinctions manifested themselves as either the reappearance (+) or the disappearance (−) of the bands (as shown in Table 2 and Figure 2). When compared to the control group, the experimental groups saw a total of 61 new bands emerge and 75 old bands vanish. There was neither a steady drop nor a rise in polymorphism seen in plants subjected to increasing amounts of NaN3 for longer periods of time or at higher concentrations (Table 2 and Figure 3A).
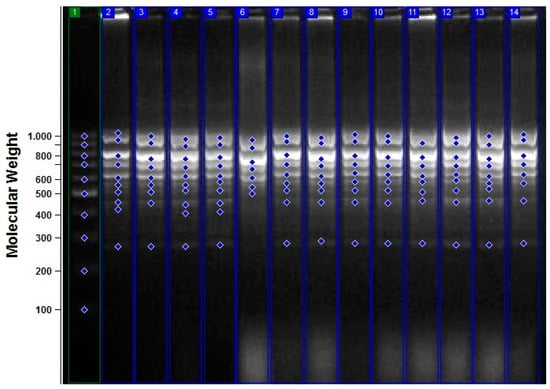
Figure 2.
iPBS profiles for various experimental groups with 2391 primers. 1: M 100–1000 bp DNA ladder; 2: control; 3: 1 h + 0.5 mM NaN3 treatment; 4: 1 h + 1 mM NaN3 treatment; 5: 1 h + 1.5 mM NaN3 treatment; 6: 1 h + 2 mM NaN3 treatment; 7: 2 h + 0.5 mM NaN3 treatment; 8: 2 h + 1 mM NaN3 treatment; 9: 2 h + 1.5 mM NaN3 treatment; 10: 2 h + 2 mM NaN3 treatment; 11: 3 h + 0.5 mM NaN3 treatment; 12: 3 h + 1 mM NaN3 treatment; 13: 3 h + 1.5 mM NaN3 treatment; 14, 3 h + 2 mM NaN3 treatment.
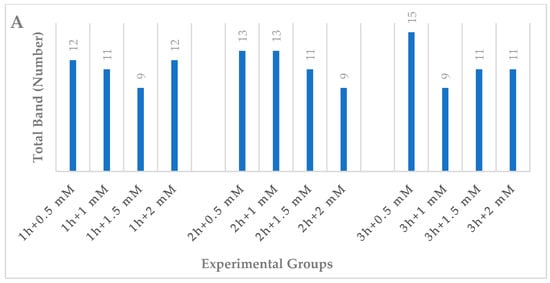
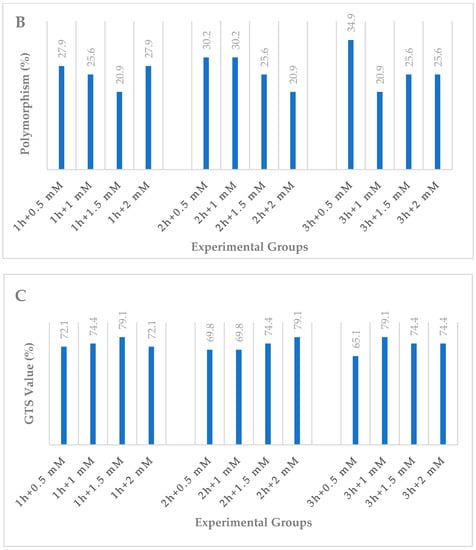
Figure 3.
DNA damage levels and DNA methylation changes in the wheat exposed to NaN3. (A) Total band, (B) polymorphism, (C) GTS value as estimated using different NaN3 experimental groups.
Plants displayed diverse responses to the duration and concentrations of NaN3. The polymorphism rates ranged from 20.9% (1 h + 1.5 mM treatment; 2 h + 2 mM treatment; 3 h + 1 mM treatment) to 34.9% (3 h + 0.5 mM treatment) (Table 2 and Figure 3B).
Genomic template stability (GTS) was also used to quantify the alterations in iPBS profiles. GTS values (%) changed in response to NaN3 mutagens of varying duration and concentration. The highest GTS value (79.1%) was observed in 1 h + 1.5 mM, 2 h + 2 mM and 3 h + 1 mM NaN3 treatments, whereas the lowest value (65.1%) was observed in 3 h + 0.5 mM NaN3 treatment (Table 2 and Figure 3C).
3.3. CRED-iPBS Assays
The ten primers given in Table 1 were used in the CRED-iPBS analysis to identify changes in gDNA cytosine methylation. The findings of the CRED-iBPS study were shown in terms of the average polymorphism percentage of cytosine methylation for each concentration of NaN3 mutagen in the different durations of application. We observed DNA methylation patterns in wheat in different experimental groups (Figure 4).
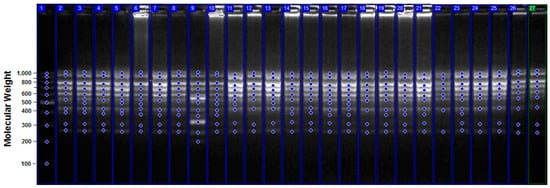
Figure 4.
CRED-iPBS profiles for various experimental groups with iPBS 2391 primer. 1: M, 100–1000 bp DNA ladder; 2: control Hpa II; 3: control Msp I; 4: 1 h + 0.5 mM NaN3 treatment Hpa II; 5: 1 h + 0.5 mM NaN3 treatment Msp I; 6: 1 h + 1 mM NaN3 treatment Hpa II; 7: 1 h + 1 mM NaN3 treatment Msp I; 8: 1 h + 1.5 mM NaN3 treatment Hpa II; 9: 1 h + 1.5 mM NaN3 treatment Msp I; 10: 1 h + 2 mM NaN3 treatment Hpa II; 11: 1 h + 2 mM NaN3 treatment Msp I; 12: 2 h + 0.5 mM NaN3 treatment Hpa II; 13: 2 h + 0.5 mM NaN3 treatment Msp I; 14: 2 h + 1 mM NaN3 treatment Hpa II; 15: 2 h + 1 mM NaN3 treatment Msp I; 16: 2 h + 1.5 mM NaN3 treatment Hpa II; 17: 2 h + 1.5 mM NaN3 treatment Msp I; 18: 2 h + 2 mM NaN3 treatment Hpa II; 19, 2 h + 2 mM NaN3 treatment Msp I; 20: 3 h + 0.5 mM NaN3 treatment Hpa II; 21: 3 h + 05 mM NaN3 treatment Msp I; 22: 3 h + 1 mM NaN3 treatment Hpa II; 23: 3 h + 1 mM NaN3 treatment Msp I; 24: 3 h + 1.5 mM NaN3 treatment Hpa II; 25: 3 h + 1.5 mM NaN3 treatment Msp I; 26: 3 h + 2 mM NaN3 treatment Hpa II; 27: 3 h + 2 mM NaN3 treatment Msp I.
According to the results of CRED-iPBS analysis, the highest polymorphism (35.5%) value was obtained at 1 h + 2 mM NaN3 treatment, and the lowest (14.5%) value was obtained in the 1 h + 0.5 mM NaN3 treatment for MspI. In the experimental groups for MspI, 48 new bands emerged compared to the control group, whereas 134 old bands vanished. Furthermore, hypermethylation occurred at increasing NaN3 doses for MspI in the 1 h and 2 h experimental groups. For HpaII, the highest polymorphism value (39.7%) was achieved in the 1 h + 1 mM NaN3 treatment, while the lowest value (20.7%) was obtained during 1 h + 1.5 mM NaN3 and 3 h + 2 mM NaN3 treatments. Furthermore, hypomethylation occurred at increasing doses of NaN3 in the 3 h experimental group for HpaII. When compared to the control group, the experimental groups for HpaII had a total of 46 new bands develop, while 152 of the previously observed bands vanished. In addition, cytosine methylation changes in response to NaN3 mutagens of varying duration and concentration have been determined (Table 3 and Figure 5).
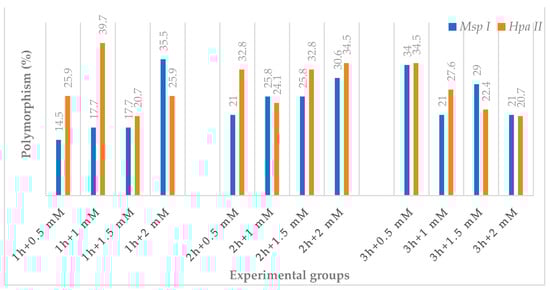
Figure 5.
The effect of NaN3 on polymorphism percentage in different experimental groups of wheat in seedling growth stage.
4. Discussion
Plant breeding is a complicated field that focuses on the goal-oriented and ongoing production of new plant varieties that have increased yields, improved quality features, and increased economic worth [36]. It takes advantage of the genetic variety that exists among the individuals of a plant species and attempts to integrate as many “better features” as possible within a single genotype or to maximize the presence of such qualities within a single population [37]. Utilizable genetic diversity is the single most important factor in determining the level of success in plant breeding. The development of novel variants is of the utmost significance for the purpose of incorporating previously unavailable characteristics into cultivars. Nevertheless, in situations in which a certain genetic characteristic cannot be directly introduced into breeding materials, genetic variation may still be achieved by the use of alternative approaches, such as chemical or physical mutagenesis [38,39]. Mutation breeding differs from conventional breeding. When plant DNA is uncovered to mutagens, the likelihood of unique genetic material increases. Mutations induced in plants have produced novel and beneficial plant traits and increased yield potential. Rapid variation in qualitative and quantitative characteristics may be produced by crop mutations [40]. Mutagenesis may be induced by physical (ionizing radiation, gamma radiation), chemical (alkylating agents and azides), and biological (transformation, transposons, and retrotransposons) means. Diethyl sulfate, EMS (ethyl methanesulfonate), MMS (methyl methanesulfonate) and NaN3 may induce mutations in many plants without costly apparatus [40,41].
The compound NaN3 is a powerful mutagen that may lead to point mutations. NaN3 also induces nucleotide alterations, which may affect the function of phenotypes and proteins. These nucleotide changes go from AT to GC. Its mutagenicity is caused by an organic metabolite that is derived from the azide chemical that is formed by the O-acetylserine sulfhydrylase enzyme. This metabolite is analogous to L-azidoalanine [42]. This azide metabolite, when it enters the nucleus of the cell, has an interaction with DNA, which results in the formation of point mutations in the genome. In addition to this, it may result in chromosomal abnormalities, primarily displacements, delayed chromosomes, bridges and sticky chromosomes, and polyploidization [41,43]. Yet, SOS replication stress response is not triggered by these DNA structural defects, hence replication is not halted [44]. NaN3 has been used to improve a wide range of agriculturally valuable traits in plants, including stress resistance, such as in maize, pea, barley, oat, rise, soybean [17,45]. Mutational standards really vary with exposure duration, dose, and tissue [46]. The present findings revealed that NaN3 treatments, when applied at different durations and concentrations, alter iPBS band profiles, thereby causing DNA damage (Table 2). In addition, it has been determined that it has an effect on cytosine methylation and causes hyper- or hypomethylation (Table 3). Band alterations are described as the sudden emergence or disappearance of previously undetectable bands of varying intensities [8,27,30,33,34,35]. In point of fact, the outcomes of this research indicated that when the iPBS band profiles were reviewed and compared to the control, a total of 61 new bands were produced in the experimental groups, while 75 old bands were eliminated. These differences were seen when the experimental groups were analyzed in comparison to the control group. The iPBS marker is an appropriate identifier that may be used for the purpose of identifying these modifications in plant DNA that have been subjected to NaN3 treatments [35]. In a study performed by Ilhan et al. [41], nine RAPD primers were utilized to investigate the impact on DNA structural changes of quinoa under NaN3 treatments. It has been reported that the azide ion promotes mutations and alters the RAPD band profile via interactions with enzymes and DNA in the cell. In a similar vein, based on the findings of the present research, it is possible to draw the conclusion that the change in the iPBS band profile is supported by the interactions that the azide ion has with the DNA in the cell; however, the interaction with the enzyme will need to be investigated in a separate set of investigations. iPBS is a marker system with interchangeable components. During normal growth stages, retrotransposons, which represent stress-induced molecular modifications in plants, are typically inactive [47]. In plants, mutagens such as NaN3 can reactivate LTR retrotransposons [48,49]. In research that was carried out by Türkoğlu [30], it was found that the NaN3 treatment consisting of 2 h + 2 mM produced the greatest GTS value of 77.0% and the lowest polymorphic band of 33.0% in wheat based on iPBS findings. In contrast to the findings reported by Türkoğlu [30], we found that the NaN3 treatments lasting 1 h and 1.5 mM, 2 h and 2 mM, and 3 h and 1 mM produced the greatest GTS values (79.1%) in our investigation. It’s possible that the differences in the results are related to the varying dosages of NaN3 that were used. Using the iPBS marker, Türkoğlu et al. [35] evaluated ethyl methanesulfonate (EMS)-induced polymorphism and genomic instability in wheat (Triticum aestivum L.). They reported that chemical mutagens altered the polymorphism, that the genomic instability of the mature wheat embryo was more pronounced in EMS processes, and that the iPBS marker could be used to ascertain this. The high genetic variation in the NaN3-treated seed in the germination stage at different doses and durations may be explained by the disappearance of normal bands and the appearance of new bands due to the effects of NaN3 mutagens. Our results demonstrated that NaN3 alters the iPBS band profile and cytosine methylation, and that the iPBS marker is sensitive enough to detect these modifications, as well as the hyper- and hypomethylations that occur with increasing dosages
5. Conclusions
The study of how genes operate, the creation of diverse genetic populations, and the advancement of superior breeding lines are all examples of areas in which mutations have shown to be useful tools. Nonetheless, there is a relatively limited chance that plants may spontaneously mutate on their own. Because of this, chemical and physical mutagens are commonly utilized in order to enhance the incidence of mutations. Studies on induced mutagenesis take into account the mutagen of choice, the amount of that mutagen, and the length of time it is administered. In addition to DNA damage and cytosine methylation, the current research is the first to demonstrate the use of iPBS markers to analyze NaN3-induced polymorphism in wheat in germination stage. It was concluded that the iPBS technique can be used in the detection of retrotransposon polymorphism, and can be used in the detection of DNA damage and retrotransposon movement. These findings suggest that induced retrotransposon polymorphism should be considered in crop breeding for different stress tolerances. The current results demonstrated that treatments with NaN3 had an effect on the level of cytosine methylation as well as the stability of the genomic template in wheat plants. In different experimental groups with the NaN3 mutagen, hypomethylations can be helped to possess the ability to biotic and abiotic tolerate stress, whereas, hypermethylations can be identified as susceptible to different abiotic and biotic stress in wheat breeding studies. The iPBS and CRED-iPBS methodologies have been proficiently employed for genetic scrutiny in wheat that has been subjected to mutagenesis. It is advisable to conduct additional research to elucidate the various facets of phytotoxicity induced by mutagenicity in plants. Lastly, it is advised that the genomic areas implicated in response to NaN3 treatments be studied using fragments having methylation pattern variety following recovery and sequencing. The future generations of the analyzed in different genotype should be bred and examined to learn more about the heritability of the methylation pattern of stable alterations.
Author Contributions
Conceptualization, A.T., K.H. and M.T.; methodology, A.T., B.E., F.D., H.K., G.N. and G.Ö.; software, A.T. and G.Ö.; validation, A.T., K.H., M.T., H.B., P.S., M.S. and G.N.; formal analysis, A.T., K.H., M.T., H.B., P.S., M.S. and G.N.; investigation, A.T. and K.H.; resources, A.T., K.H. and G.Ö.; data curation, A.T., K.H. and G.Ö.; writing—original draft preparation, A.T., K.H., F.D., H.B., P.S., M.S. and G.N; writing—review and editing, A.T., K.H., B.E., H.B., P.S., M.S. and G.N.; visualization, K.H., M.T. and A.T.; supervision, K.H., M.T. and G.N.; project administration, K.H. and A.T.; funding acquisition K.H. and A.T. All authors have read and agreed to the published version of the manuscript.
Funding
This research received no external funding.
Institutional Review Board Statement
Not applicable.
Data Availability Statement
All data supporting the conclusions of this article are included in this article.
Acknowledgments
The in vivo mutagenesis section of this manuscript was from the outcome of the Ph.D. dissertation of Aras Turkoglu and was supported by the Scientific and Technological Research Council of Turkey (TÜBİTAK, Project No: TOVAG 113O940).
Conflicts of Interest
The authors declare no conflict of interest.
References
- Yaman, H.M.; Ordu, B.; Zencirci, N.; Kan, M. Coupling socioeconomic factors and cultural practices in production of einkorn and emmer wheat species in Turkey. Environ. Dev. Sustain. 2020, 22, 8079–8096. [Google Scholar] [CrossRef]
- Tadesse, W.; Bishaw, Z.; Assefa, S. Wheat production and breeding in Sub-Saharan Africa: Challenges and opportunities in the face of climate change. Int. J. Clim. Chang. Strateg. Manag. 2019, 11, 696–715. [Google Scholar] [CrossRef]
- Hasanuzzaman, M.; Bhuyan, M.B.; Parvin, K.; Bhuiyan, T.F.; Anee, T.I.; Nahar, K.; Hossen, M.S.; Zulfiqar, F.; Alam, M.M.; Fujita, M. Regulation of ROS metabolism in plants under environmental stress: A review of recent experimental evidence. Int. J. Mol. Sci. 2020, 21, 8695. [Google Scholar] [CrossRef]
- Raza, A.; Razzaq, A.; Mehmood, S.S.; Zou, X.; Zhang, X.; Lv, Y.; Xu, J. Impact of climate change on crops adaptation and strategies to tackle its outcome: A review. Plants 2019, 8, 34. [Google Scholar] [CrossRef]
- Demirel, F.; Gürcan, K.; Taner, A. Molecular Characterization and Assessment of Population Structure of Hulled Wheats. J. Agric. Nat. 2022, 25, 192–199. [Google Scholar] [CrossRef]
- Kuzmanović, L.; Rossini, F.; Ruggeri, R.; Pagnotta, M.A.; Ceoloni, C. Engineered durum wheat germplasm with multiple alien introgressions: Agronomic and quality performance. Agronomy 2020, 10, 486. [Google Scholar] [CrossRef]
- Qaim, M. Role of new plant breeding technologies for food security and sustainable agricultural development. Appl. Econ. Perspect. Policy 2020, 42, 129–150. [Google Scholar] [CrossRef]
- Hosseinpour, A.; Tosun, M.; Haliloğlu, K. Effects of ethyl methanesulfonate (ems) applied at different times and doses on some germination and seedling characteristics in wheat (Triticum aestivum L.). J. Atatürk Uni. Fac. Agri. 2021, 52, 190–200. [Google Scholar]
- Karakoca, T.A.; Akgün, İ. Determination of the mutagenic effects of different gamma radiation dose applications on some agricultural traits in M2 generation. J. Suleyman Demirel Uni. Grad. Sch. Natur. App. Sci. 2020, 24, 96–104. [Google Scholar]
- de Oliveira Collet, S.A.; Collet, M.A.; Maria de Fátima, P. Differential gene expression for isozymes in somatic mutants of Vitis vinifera L. (Vitaceae). Biochem. Syst. Ecol. 2005, 33, 691–703. [Google Scholar] [CrossRef]
- Pandit, R.; Bhusal, B.; Regmi, R.; Neupane, P.; Bhattarai, K.; Maharjan, B.; Acharya, S.; Kc, B.; Poudel, M.R. Mutation breeding for crop improvement: A review. Rev. Food Agric. 2021, 2, 31–35. [Google Scholar] [CrossRef]
- Saleem, M.; Mukhtar, Z.; Cheema, A.; Atta, B. Induced mutation and in vitro techniques as a method to induce salt tolerance in Basmati rice (Oryza sauva L.). Int. J. Environ. Sci. Technol. 2005, 2, 141–145. [Google Scholar] [CrossRef]
- Öztürk, İ.; Ayşe, Ş.; Kiliç, T.H.; Şahinde, Ş. Selection of advanced mutant wheat (Triticum aestivum L.) lines based on yield and quality parameters. Turkish J. Agric. Nat. Sci. 2020, 7, 87–95. [Google Scholar] [CrossRef]
- Kim, S.H.; Kim, S.W.; Ahn, J.W.; Ryu, J.; Kwon, S.J.; Kang, B.C.; Kim, J.B. Frequency, spectrum, and stability of leaf mutants induced by diverse γ-ray treatments in two Cymbidium hybrids. Plants 2020, 9, 546. [Google Scholar] [CrossRef]
- Hewawasam, W.; Bandara, D.; Aberathne, W. New phenotypes of Crossandra infundibuliformis var. Danica through in vitro culture and induced mutations. Trop. Agric. Res. 2004, 16, 253–270. [Google Scholar]
- Ikhajiagbe, B.; Omoregie, U.E. Growth, yield, genetic parameters and random amplified polymorphic DNA (RAPD) of five rice varieties treated with sodium azide and sown under different saline conditions. Bull. Natl. Res. Cent. 2020, 44, 89. [Google Scholar] [CrossRef]
- Khan, S.; Al-Qurainy, F.; Anwar, F. Sodium azide: A chemical mutagen for enhancement of agronomic traits of crop plants. Environ. We Int. J. Sci. Technol. 2009, 4, 1–21. [Google Scholar]
- Jenks, M.A.; Hasegawa, P.M.; Jain, S.M.; Foolad, M. Advances in Molecular Breeding toward Drought and Salt Tolerant Crops; Springer: New York, NY, USA, 2007. [Google Scholar]
- Wu, C.T.; Morris, J.R. Genes, genetics, and epigenetics: A correspondence. Science 2001, 293, 1103–1105. [Google Scholar] [CrossRef]
- Bird, A. DNA methylation patterns and epigenetic memory. Genes Dev. 2002, 16, 6–21. [Google Scholar] [CrossRef]
- Karaca, M.; Ince, A.; Gocer, E.; Aydin, A. Exonic and intronic DNA methylation differences in a fiber specific gene of Pima cotton (Gossypium barbadense L.). J. Sci. Eng. Res. 2016, 3, 478–486. [Google Scholar]
- Osabe, K.; Clement, J.D.; Bedon, F.; Pettolino, F.A.; Ziolkowski, L.; Llewellyn, D.J.; Finnegan, E.J.; Wilson, I.W. Genetic and DNA methylation changes in cotton (Gossypium) genotypes and tissues. PLoS ONE 2014, 9, e86049. [Google Scholar] [CrossRef] [PubMed]
- Al-Harrasi, I.; Al-Yahyai, R.; Yaish, M.W. Differential DNA methylation and transcription profiles in date palm roots ex-posed to salinity. PLoS ONE 2018, 13, e0191492. [Google Scholar] [CrossRef] [PubMed]
- Fan, H.H.; Wei, J.; Li, T.C.; Li, Z.P.; Guo, N.; Cai, Y.P.; Lin, Y. DNA methylation alterations of upland cotton (Gossypium hirsutum) in response to cold stress. Acta Physiol. Plant. 2013, 35, 2445–2453. [Google Scholar] [CrossRef]
- Feng, S.J.; Liu, X.S.; Tao, H.; Tan, S.K.; Chu, S.S.; Oono, Y.; Zhang, X.D.; Chen, J.; Yang, Z.M. Variation of DNA methylation patterns associated with gene expression in rice (Oryza sativa) exposed to cadmium. Plant Cell Environ. 2016, 39, 2629–2649. [Google Scholar] [CrossRef]
- Li, R.; Hu, F.; Li, B.; Zhang, Y.; Chen, M.; Fan, T.; Wang, T. Whole genome bisulfite sequencing methylome analysis of mulberry (Morus alba) reveals epigenome modifications in response to drought stress. Sci. Rep. 2020, 10, 8013. [Google Scholar] [CrossRef] [PubMed]
- Haliloğlu, K.; Türkoğlu, A.; Balpınar, Ö.; Nadaroğlu, H.; Alaylı, A.; Poczai, P. Effects of Zinc, Copper and Iron Oxide Nanoparticles on Induced DNA Methylation, Genomic Instability and LTR Retrotransposon Polymorphism in Wheat (Triticum aestivum L.). Plants 2022, 11, 2193. [Google Scholar] [CrossRef] [PubMed]
- Oda, M.; Glass, J.L.; Thompson, R.F.; Mo, Y.; Olivier, E.N.; Figueroa, M.E.; Selzer, R.R.; Richmond, T.A.; Zhang, X.; Dannenberg, L.; et al. High-resolution genome-wide cytosine methylation profiling with simultaneous copy number analysis and optimization for limited cell numbers. Nucleic Acids Res. 2009, 37, 3829–3839. [Google Scholar] [CrossRef]
- Olkhov-Mitsel, E.; Bapat, B. Strategies for discovery and validation of methylated and hydroxymethylated DNA biomarkers. Cancer Med. 2012, 1, 237–260. [Google Scholar] [CrossRef]
- Türkoğlu, A.; Tosun, M.; Haliloğlu, K. Mutagenic effects of sodium azide on in vitro mutagenesis, polymorphism and genomic instability in wheat (Triticum aestivum L.). Mol. Biol. Rep. 2022, 49, 10165–10174. [Google Scholar] [CrossRef]
- Zeinalzadehtabrizi, H.; Hosseinpour, A.; Aydin, M.; Haliloglu, K. A modified genomic DNA extraction method from leaves of sunflower for PCR based analyzes. J. Biodivers. Environ. Sci. 2015, 7, 222–225. [Google Scholar]
- Kalendar, R.; Antonius, K.; Smýkal, P.; Schulman, A.H. iPBS: A universal method for DNA fingerprinting and retrotransposon isolation. Theor. Appl. Genet. 2010, 121, 1419–1430. [Google Scholar] [CrossRef] [PubMed]
- Turkoglu, A. Effects of mammalian sex hormones on regeneration capacity, retrotransposon polymorphism and genomic instability in wheat (Triticum aestivum L.). Plant Cell Tissue Organ Cult. 2023, 152, 647–659. [Google Scholar] [CrossRef]
- Türkoğlu, A.; Haliloğlu, K.; Balpinar, Ö.; Öztürk, H.I.; Özkan, G.; Poczai, P. The effect of mammalian sex hormones on polymorphism and genomic instability in the common bean (Phaseolus vulgaris L.). Plants 2022, 11, 2071. [Google Scholar] [CrossRef] [PubMed]
- Türkoğlu, A.; Tosun, M.; Haliloğlu, K. Evaluation of ethyl methanesulfonate-induced in vitro mutagenesis, polymorphism and genomic instability in wheat (Triticum aestivum L.). J. Crop Sci. Biotechnol. 2023, 26, 199–213. [Google Scholar] [CrossRef]
- Moose, S.P.; Mumm, R.H. Molecular plant breeding as the foundation for 21st century crop improvement. Plant Physiol. 2008, 147, 969–977. [Google Scholar] [CrossRef] [PubMed]
- Louwaars, N.P. Plant breeding and diversity: A troubled relationship? Euphytica 2018, 214, 114. [Google Scholar] [CrossRef]
- Holme, I.B.; Gregersen, P.L.; Brinch-Pedersen, H. Induced genetic variation in crop plants by random or targeted mutagenesis: Convergence and differences. Front. Plant Sci. 2019, 10, 1468. [Google Scholar] [CrossRef]
- Oladosu, Y.; Rafii, M.Y.; Abdullah, N.; Malek, M.A.; Rahim, H.A.; Hussin, G.; Ismail, M.R.; Latif, M.A.; Kareem, I. Genetic variability and diversity of mutant rice revealed by quantitative traits and molecular markers. Agrociencia 2015, 49, 249–266. [Google Scholar]
- Sikora, P.; Chawade, A.; Larsson, M.; Olsson, J.; Olsson, O. Mutagenesis as a tool in plant genetics, functional genomics, and breeding. Int. J. Plant Genom. 2011, 2011, 314829. [Google Scholar] [CrossRef]
- Ilhan, E.; Kasapoglu, A.G.; Turkoglu, A.; Aygoren, A.S.; Muslu, S.; Aydin, M.; Aldaif, M.; Haliloglu, K. Evaluation of sodium azide as a chemical mutagen in developing cold-tolerant quinoa (Chenopodium quinoa Willd.) lines. Iran. J. Sci. 2023, 47, 663–671. [Google Scholar] [CrossRef]
- Grúz, P.; Yasui, M.; Ukai, A.; Horibata, K.; Honma, M.; Sugiyama, K.-I. Potent mutagenicity of an azide, 3-azido-1, 2-propanediol, in human TK6 cells. Mutat. Res. Genet. Toxicol. Environ. Mutagen. 2022, 876–877, 503475. [Google Scholar] [CrossRef]
- Deh Sheikh, A.A.; Moradnejad, M. Mutagenesis in olive (Olea europaea L.) calli caused by sodium azide and detection of mutants using ISSR and RAPD markers. J. Hortic. Sci. Biotechnol. 2014, 89, 153–158. [Google Scholar] [CrossRef]
- Grúz, P.; Juříček, M.; Ẑák, P.; Velemínský, J. Mutagenicity of 3-azido-1,2-propanediol and 9-(3-azido-2-hydroxypropyl)-adenine in repair deficient strains of Escherichia coli. Mutat. Res. Lett. 1993, 303, 1–9. [Google Scholar] [CrossRef] [PubMed]
- Ahmed, M.; Abdelaziem, T.; Nower, A. In vitro mutagenesis and propagation of paulownia tomentosa (thumb) for salt tolerance. SABRAO J. Breed. Genet. 2022, 54, 305–320. [Google Scholar] [CrossRef]
- Parry, M.A.; Madgwick, P.J.; Bayon, C.; Tearall, K.; Hernandez-Lopez, A.; Baudo, M.; Rakszegi, M.; Hamada, W.; Al-Yassin, A.; Ouabbou, H.; et al. Mutation discovery for crop improvement. J. Exp. Bot. 2009, 60, 2817–2825. [Google Scholar] [CrossRef] [PubMed]
- Haliloğlu, K.; Türkoğlu, A.; Öztürk, A.; Niedbała, G.; Niazian, M.; Wojciechowski, T.; Piekutowska, M. Genetic Diversity and Population Structure in Bread Wheat Germplasm from Türkiye Using iPBS-Retrotransposons-Based Markers. Agronomy 2023, 13, 255. [Google Scholar] [CrossRef]
- Mansour, A. Water deficit induction of Copia and Gypsy genomic retrotransposons. Plant Stress 2009, 3, 33–39. [Google Scholar]
- Ramakrishnan, M.; Satish, L.; Kalendar, R.; Narayanan, M.; Kandasamy, S.; Sharma, A.; Emamverdian, A.; Wei, Q.; Zhou, M. The dynamism of transposon methylation for plant development and stress adaptation. Int. J. Mol. Sci. 2021, 22, 11387. [Google Scholar] [CrossRef]
Disclaimer/Publisher’s Note: The statements, opinions and data contained in all publications are solely those of the individual author(s) and contributor(s) and not of MDPI and/or the editor(s). MDPI and/or the editor(s) disclaim responsibility for any injury to people or property resulting from any ideas, methods, instructions or products referred to in the content. |
© 2023 by the authors. Licensee MDPI, Basel, Switzerland. This article is an open access article distributed under the terms and conditions of the Creative Commons Attribution (CC BY) license (https://creativecommons.org/licenses/by/4.0/).