

Greenhouse Gas Emissions in the Agricultural and Industrial Sectors—Change Trends, Economic Conditions, and Country Classification: Evidence from the European Union

Abstract
:1. Introduction
2. Literature Review
3. Methodological Approach
- Indicators characterizing the total greenhouse gas emissions by industry (P) and agriculture (A) as a % of the total emissions (Y01P, Y05A) and, in particular, the release of gases such as carbon dioxide CO2 (Y02P, Y06A), methane CH4 (Y03P, Y07A), and nitrous oxide N2O (Y04P, Y08A), and the total greenhouse gas emissions in tonnes per capita (Y09) (dependent variables);
- Economic indicators such as GDP per capita (X01), the share of business investment in GDP (X02P), R&D expenditures in the corporate sector (X03P) and agriculture (X04A), and the agricultural factor income per annual work unit (X05A), as well as the stocking rate (X06A) (independent variables);
- Indicators characterizing employment in the sectors of industry (X07P), agriculture (X08A), and services (X09U) (independent variables) (Table 1).
4. Results
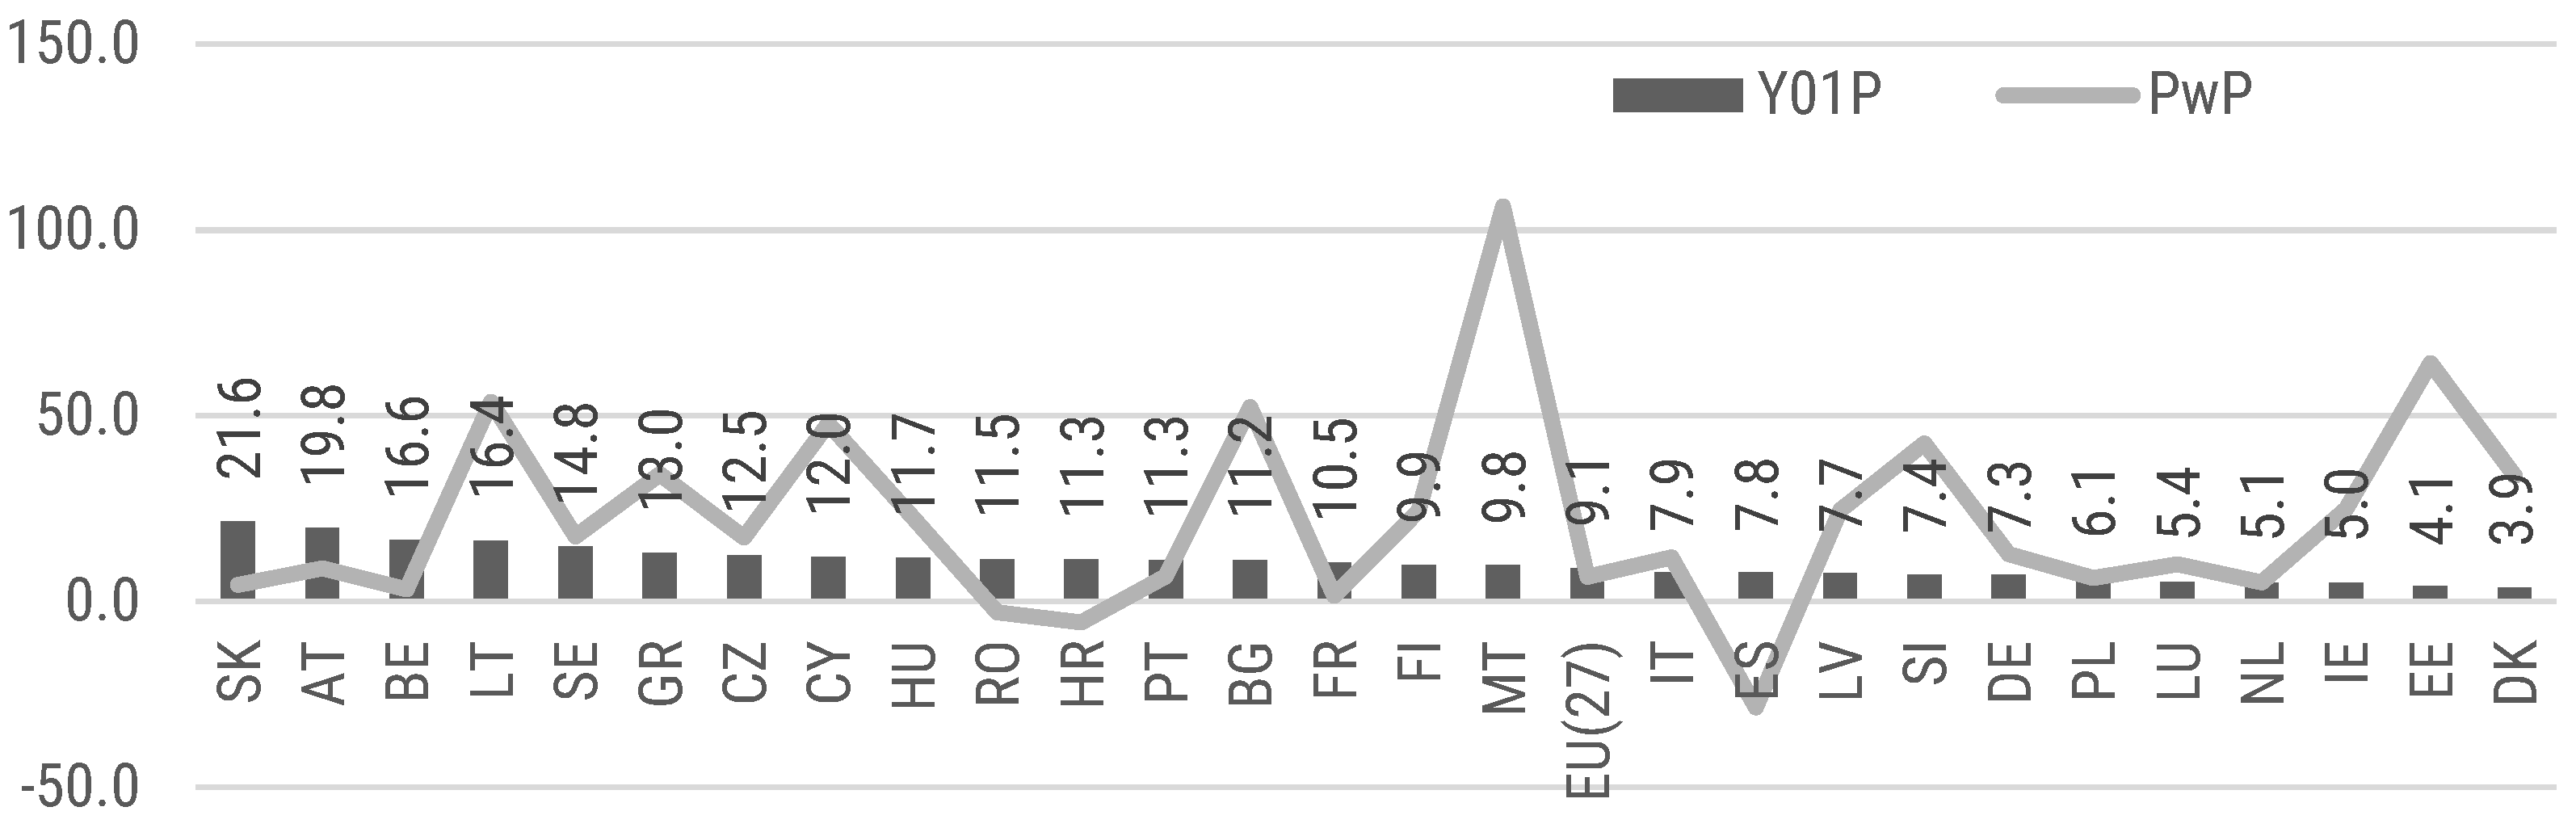
4.1. Comparison of Greenhouse Gas Emissions from Industry and Agriculture in the European Union Countries: Diversity and Changes in 2010–2019
4.2. Comparison of CO2, CH4, and N2O Emissions from Industry and Agriculture in the European Union Countries: Diversity and Changes in 2010–2019
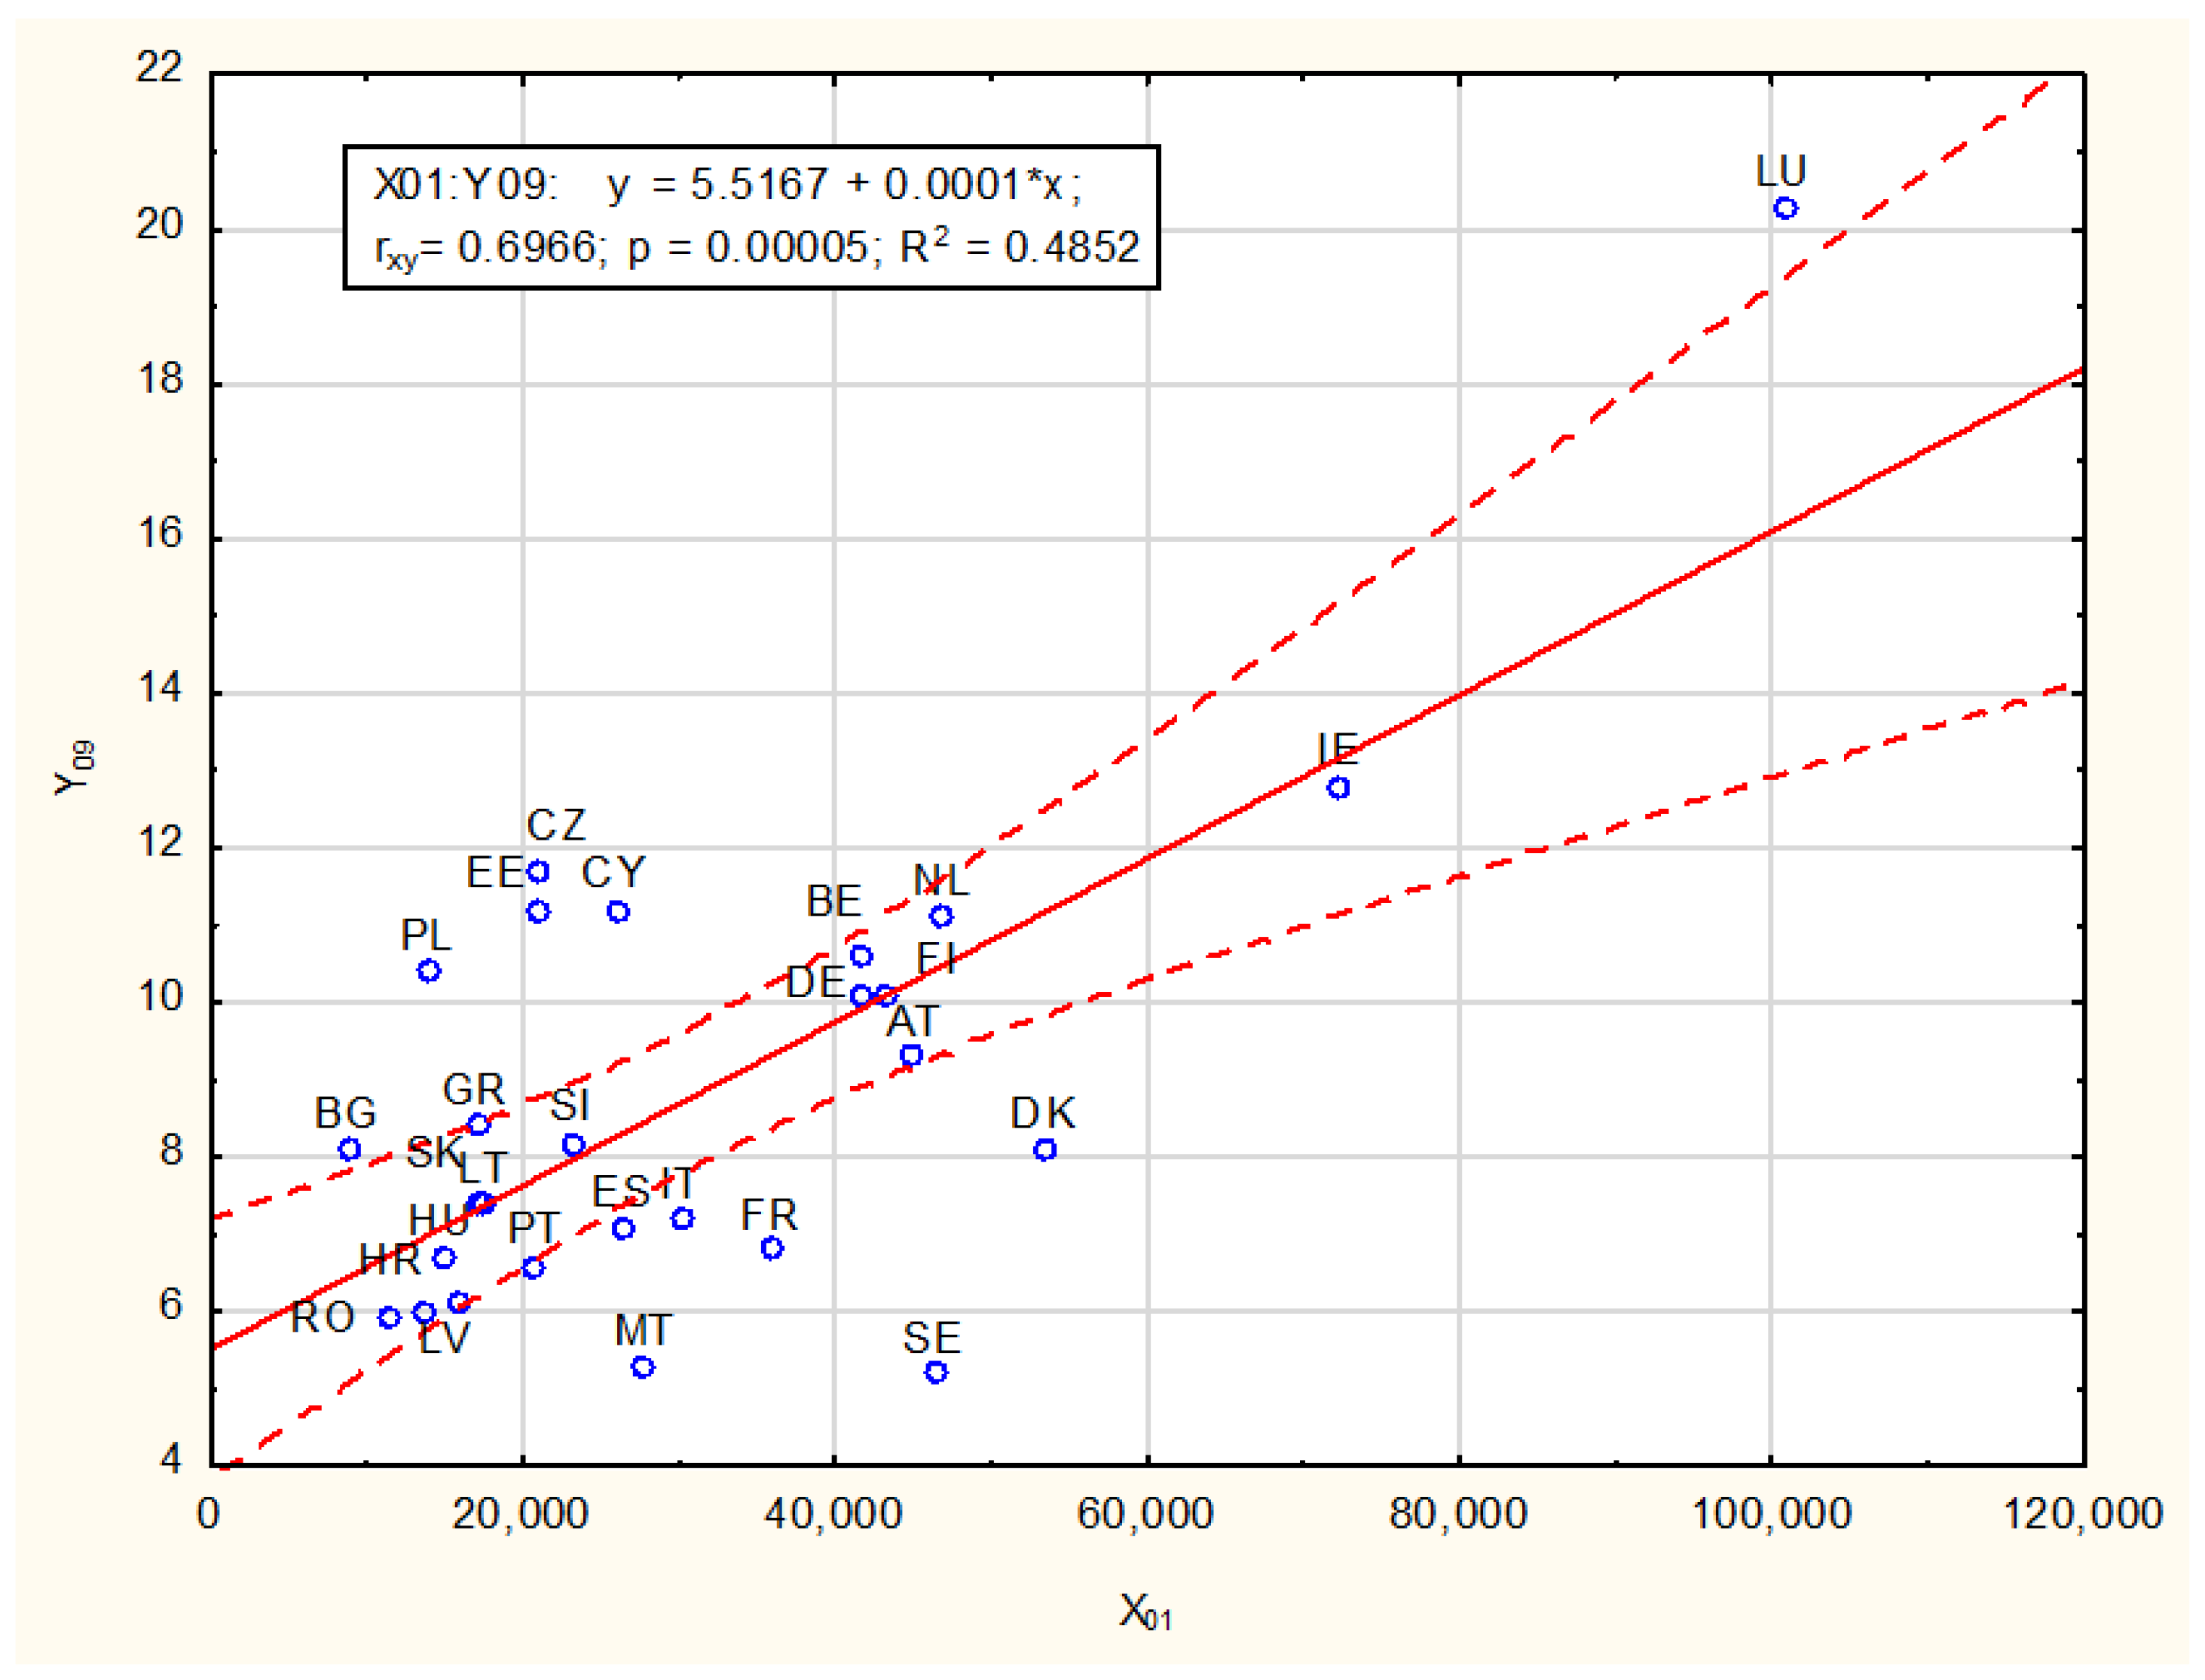
4.3. Relationships between GHG Emissions from Industry and Agriculture and Their Changes in 2010–2019
4.4. Classification of EU Countries in Terms of GHG Emissions from Industry and Agriculture and Their Economic Conditions: Characteristics of Class Averages
4.5. The Impact of the Selected Economic Conditions on GHG Emissions from Industry and Agriculture: Analysis of Correlation and Multiple Regression
5. Discussion
6. Conclusions
Author Contributions
Funding
Institutional Review Board Statement
Data Availability Statement
Conflicts of Interest
References
- ESCOT. European State of the Climate 2022 Summary; Copernicus Climate Change Service: Brno, Czechia, 2022. [Google Scholar]
- ESCOT. European State of the Climate 2019 Summary; Copernicus Climate Change Service: Brno, Czechia, 2019. [Google Scholar]
- IPCC. Report—Global Warming of 1.5 °C; IPCC: Geneva, Switzerland, 2018.
- IPCC. AR6 Climate Change 2022: Impacts, Adaptation and Vulnerability; IPCC: Geneva, Switzerland, 2022.
- World Meteorological Organization (WMO). WMO Statement on the State of the Global Climate in 2019; World Meteorological Organization (WMO): Geneva, Switzerland, 2020. [Google Scholar]
- Chen, J.; Liu, Y.; Pan, T.; Ciais, P.; Ma, T.; Liu, Y.; Yamazaki, D.; Ge, Q.; Peñuelas, J. Global Socioeconomic Exposure of Heat Extremes under Climate Change. J. Clean. Prod. 2020, 277, 123275. [Google Scholar] [CrossRef]
- Lembrechts, J.J.; van den Hoogen, J.; Aalto, J.; Ashcroft, M.B.; De Frenne, P.; Kemppinen, J.; Kopecký, M.; Luoto, M.; Maclean, I.M.D.; Crowther, T.W.; et al. Global Maps of Soil Temperature. Glob. Change Biol. 2022, 28, 3110–3144. [Google Scholar] [CrossRef] [PubMed]
- Halbritter, A.H.; De Boeck, H.J.; Eycott, A.E.; Reinsch, S.; Robinson, D.A.; Vicca, S.; Berauer, B.; Christiansen, C.T.; Estiarte, M.; Grünzweig, J.M.; et al. The Handbook for Standardized Field and Laboratory Measurements in Terrestrial Climate Change Experiments and Observational Studies (ClimEx). Methods Ecol. Evol. 2020, 11, 22–37. [Google Scholar] [CrossRef] [Green Version]
- Bajan, B.; Mrówczyńska-Kamińska, A.; Poczta, W. Economic Energy Efficiency of Food Production Systems. Energies 2020, 13, 5826. [Google Scholar] [CrossRef]
- ERRIN. European Green Deal. Available online: https://errin.eu/tags/european-green-deal (accessed on 23 June 2023).
- Farm to Fork Strategy. Available online: https://food.ec.europa.eu/horizontal-topics/farm-fork-strategy_en (accessed on 23 June 2023).
- FAO; IFAD; UNICEF; WFP; WHO. The State of Food Security and Nutrition in the World 2020; FAO: Rome, Italy, 2020. [Google Scholar]
- Paris Agreement on Climate Change. Available online: https://www.consilium.europa.eu/en/policies/climate-change/paris-agreement/ (accessed on 23 June 2023).
- Hamit-Haggar, M. Greenhouse Gas Emissions, Energy Consumption and Economic Growth: A Panel Cointegration Analysis from Canadian Industrial Sector Perspective. Energy Econ. 2012, 34, 358–364. [Google Scholar] [CrossRef]
- Jovanović, M.; Kašćelan, L.; Despotović, A.; Kašćelan, V. The Impact of Agro-Economic Factors on GHG Emissions: Evidence from European Developing and Advanced Economies. Sustainability 2015, 7, 16290–16310. [Google Scholar] [CrossRef] [Green Version]
- Pajewski, T. Zmiany poziomu emisji gazów cieplarnianych w produkcji rolnej (Changes in greenhouse gas emissions in agricultural production). Ann. Pol. Assoc. Agric. Agribus. Econ. 2016, 18, 214–218. [Google Scholar]
- Pawlak, J. Założenia metodyczne do oceny ekonomicznych skutków redukcji emisji gazów cieplarnianych w rolnictwie (Assessment of economic effects of GHG emission reduction on the example of field crop farms). Probl. Agric. Econ. 2017, 2, 138–151. [Google Scholar]
- Von Storch, H.; Omstedt, A.; Pawlak, J.; Reckermann, M. Introduction and Summary. In Second Assessment of Climate Change for the Baltic Sea Basin; Springer: Cham, Switzerland, 2015; pp. 1–22. ISBN 978-3-319-16005-4. [Google Scholar]
- Abudureheman, M.; Jiang, Q.; Dong, X.; Dong, C. CO2 Emissions in China: Does the Energy Rebound Matter? Energies 2022, 15, 4279. [Google Scholar] [CrossRef]
- Etminan, M.; Myhre, G.; Highwood, E.J.; Shine, K.P. Radiative Forcing of Carbon Dioxide, Methane, and Nitrous Oxide: A Significant Revision of the Methane Radiative Forcing. Geophys. Res. Lett. 2016, 43, 12614–12623. [Google Scholar] [CrossRef]
- Li, M.; Meng, B.; Gao, Y.; Wang, Z.; Zhang, Y.; Sun, Y. Tracing CO2 Emissions in Global Value Chains: Multinationals vs. Domestically-Owned Firms; Research Network Sustainable Global Supply Chains: Bonn, Germany, 2022; 33p. [Google Scholar] [CrossRef]
- Salemdeeb, R.; Reynolds, C.; Rivera, X.S. Chapter 9. Environmental Impacts of Different Waste to Food Approaches. In Waste to Food; Wageningen Academic Publishers: Wageningen, The Netherlands, 2022; pp. 209–233. ISBN 978-90-8686-377-8. [Google Scholar]
- Teske, S.; Nagrath, K. Global Sector-Specific Scope 1, 2, and 3 Analyses for Setting Net-Zero Targets: Agriculture, Forestry, and Processing Harvested Products. SN Appl. Sci. 2022, 4, 221. [Google Scholar] [CrossRef]
- Wang, S.; Chen, J.; Ter-Mikaelian, M.T.; Levasseur, A.; Yang, H. From Carbon Neutral to Climate Neutral: Dynamic Life Cycle Assessment for Wood-Based Panels Produced in China. J. Ind. Ecol. 2022, 26, 1437–1449. [Google Scholar] [CrossRef]
- Wang, T.; Teng, F.; Deng, X.; Xie, J. Climate Module Disparities Explain Inconsistent Estimates of the Social Cost of Carbon in Integrated Assessment Models. One Earth 2022, 5, 767–778. [Google Scholar] [CrossRef]
- Pajewski, T.; Gołębiewska, B. Rolnictwo a Środowisko. Efekty Zewnętrzne w Systemach Produkcji Rolnej (Agriculture and the Environment. External Effects in Agricultural Production Systems); SGGW: Warszawa, Poland, 2018; pp. 9–10. [Google Scholar]
- Schläpfer, F. External Costs of Agriculture Derived from Payments for Agri-Environment Measures: Framework and Application to Switzerland. Sustainability 2020, 12, 6126. [Google Scholar] [CrossRef]
- Shi, F.; Liao, X.; Shen, L.; Meng, C.; Lai, Y. Exploring the Spatiotemporal Impacts of Urban Form on CO2 Emissions: Evidence and Implications from 256 Chinese Cities. Environ. Impact Assess. Rev. 2022, 96, 106850. [Google Scholar] [CrossRef]
- Murawska, A. Variation, Changes, and Economic Conditions of Greenhouse Gas Emissions from Industry and Agriculture in European Union States. In Proceedings of the 11th International Conference on Applied Economics: Economics, Torun, Poland, 17–18 June 2021. [Google Scholar] [CrossRef]
- Komarnicka, A.; Murawska, A. Comparison of Consumption and Renewable Sources of Energy in European Union Countries—Sectoral Indicators, Economic Conditions and Environmental Impacts. Energies 2021, 14, 3714. [Google Scholar] [CrossRef]
- Database—Eurostat. Available online: https://ec.europa.eu/eurostat/data/database (accessed on 15 July 2022).
- Kim, K.-H.; Kabir, E.; Jahan, S.A. Exposure to Pesticides and the Associated Human Health Effects. Sci. Total Environ. 2017, 575, 525–535. [Google Scholar] [CrossRef]
- Poore, J.; Nemecek, T. Reducing Food’s Environmental Impacts through Producers and Consumers. Science 2018, 360, 987–992. [Google Scholar] [CrossRef] [Green Version]
- Potter, C.; Pechey, R.; Clark, M.; Frie, K.; Bateman, P.; Cook, B.; Stewart, C.; Piernas, C.; Lynch, J.; Rayner, M.; et al. Effects of Environmental Impact Labels on the Sustainability of Food Purchases: Two Randomised Controlled Trials in an Experimental Online Supermarket. PLoS ONE 2022, 17, e0272800. [Google Scholar] [CrossRef]
- Radwan, A.; Hongyun, H.; Achraf, A.; Mustafa, A.M. Energy Use and Energy-Related Carbon Dioxide Emissions Drivers in Egypt’s Economy: Focus on the Agricultural Sector with a Structural Decomposition Analysis. Energy 2022, 258, 124821. [Google Scholar] [CrossRef]
- Pieńkowski, D. Sustainable Development as a Concept of Fairness from the Perspective of Energy Consumption Policy. Ekon. Sr.-Econ. Environ. 2019, 70, 180–196. [Google Scholar] [CrossRef]
- Pretty, J.N.; Brett, C.; Gee, D.; Hine, R.E.; Mason, C.F.; Morison, J.I.L.; Raven, H.; Rayment, M.D.; van der Bijl, G. An Assessment of the Total External Costs of UK Agriculture. Agric. Syst. 2000, 65, 113–136. [Google Scholar] [CrossRef]
- IPCC. Summary for Policymakers—Special Report on Climate Change and Land; IPCC: Geneva, Switzerland, 2019.
- Batini, N. Transforming Agri-Food Sectors to Mitigate Climate Change: The Role of Green Finance. Vierteljahrsh. Zur Wirtsch. 2019, 88, 7–42. [Google Scholar] [CrossRef]
- Bajan, B.; Łukasiewicz, J.; Mrówczyńska-Kamińska, A. Energy Consumption and Its Structures in Food Production Systems of the Visegrad Group Countries Compared with EU-15 Countries. Energies 2021, 14, 3945. [Google Scholar] [CrossRef]
- Batini, N. Reaping What We Sow: Smart Changes to How We Farm and Eat Can Have a Huge Impact on Our Planet. In Finance & Development, December 2019: The Economics of Climate; International Monetary Fund: Washington, DC, USA, 2019; Volume 56. [Google Scholar]
- United Nations. The Paris Agreement. Available online: https://unfccc.int/process-and-meetings/the-paris-agreement/the-paris-agreement (accessed on 3 March 2023).
- United Nations. The Sustainable Development Agenda—United Nations Sustainable Development. Available online: https://www.un.org/sustainabledevelopment/development-agenda/ (accessed on 15 July 2022).
- Li, Z.; Zeng, Z.; Song, Z.; Tian, D.; Huang, X.; Nie, S.; Wang, J.; Jiang, L.; Luo, Y.; Cui, J.; et al. Variance and Main Drivers of Field Nitrous Oxide Emissions: A Global Synthesis. J. Clean. Prod. 2022, 353, 131686. [Google Scholar] [CrossRef]
- UN Land Report: Five Key Takeaways for Climate Change, Food Systems and Nature Loss. Available online: https://www.carbonbrief.org/un-land-report-five-key-takeaways-for-climate-change-food-systems-and-nature-loss (accessed on 6 May 2022).
- Blok, K.; Afanador, A.; van der Hoorn, I.; Berg, T.; Edelenbosch, O.Y.; van Vuuren, D.P. Assessment of Sectoral Greenhouse Gas Emission Reduction Potentials for 2030. Energies 2020, 13, 943. [Google Scholar] [CrossRef] [Green Version]
- Mo, W.; Balen, D.; Moura, M.; Gardner, K.H. A Regional Analysis of the Life Cycle Environmental and Economic Tradeoffs of Different Economic Growth Paths. Sustainability 2018, 10, 542. [Google Scholar] [CrossRef] [Green Version]
- Maas, R.; Grennfelt, P. (Eds.) Towards Cleaner Air. Scientific Assessment Report 2016; EMEP Steering Body and Working Group on Effects of the Convention on Long-Range Transboundary Air Pollution: Oslo, Norway, 2016; xx+50pp. [Google Scholar]
- Mukumbuta, I.; Shimizu, M.; Hatano, R. Mitigating Global Warming Potential and Greenhouse Gas Intensities by Applying Composted Manure in Cornfield: A 3-Year Field Study in an Andosol Soil. Agriculture 2017, 7, 13. [Google Scholar] [CrossRef] [Green Version]
- Głodowska, M.; Gałązka, A. Intensyfikacja rolnictwa a środowisko naturalne (Unsustainable Agriculture and its Environmental Consequences). Zesz. Probl. Postępów Nauk. Rol. 2018, 592, 3–13. [Google Scholar] [CrossRef]
- Murawska, A.; Prus, P. The Progress of Sustainable Management of Ammonia Emissions from Agriculture in European Union States Including Poland—Variation, Trends, and Economic Conditions. Sustainability 2021, 13, 1035. [Google Scholar] [CrossRef]
- Jadczyszyn, T.; Kopiński, J. Productive and environmental aspects of nitrogen fertilization. Stud. Rap. IUNG-PIB 2013, 34, 27–45. [Google Scholar] [CrossRef]
- Veysset, P.; Lherm, M.; Bébin, D.; Roulenc, M.; Benoit, M. Variability in Greenhouse Gas Emissions, Fossil Energy Consumption and Farm Economics in Suckler Beef Production in 59 French Farms. Agric. Ecosyst. Environ. 2014, 188, 180–191. [Google Scholar] [CrossRef]
- Meyer-Aurich, A.; Karatay, Y.N.; Nausediene, A.; Kirschke, D. Effectivity and Cost Efficiency of a Tax on Nitrogen Fertilizer to Reduce GHG Emissions from Agriculture. Atmosphere 2020, 11, 607. [Google Scholar] [CrossRef]
- Tian, H.; Xu, R.; Canadell, J.G.; Thompson, R.L.; Winiwarter, W.; Suntharalingam, P.; Davidson, E.A.; Ciais, P.; Jackson, R.B.; Janssens-Maenhout, G.; et al. A Comprehensive Quantification of Global Nitrous Oxide Sources and Sinks. Nature 2020, 586, 248–256. [Google Scholar] [CrossRef]
- Janiszewska, D.A.; Ossowska, L. Zróżnicowanie rolnictwa krajów Unii Europejskiej na podstawie wybranych cech (Diversification of agriculture in the European Union on the basis of selected features). Sci. J. Wars. Univ. Life Sci.—SGGW Probl. World Agric. 2014, 14, 44–54. [Google Scholar]
- Świtek, S.; Gazdecki, M.; Sawinska, Z.; Goryńska-Goldmann, E. The Costs and Intensity of Chemical Protection in the Production of Winter Wheat in Poland Depending on the Wheat Production Scale on Farm. Ann. Pol. Assoc. Agric. Agribus. Econ. 2022, XXIV, 283–299. [Google Scholar] [CrossRef]
- Communication from the Commission to the European Parliament, the Council, the European Economic and Social Committee and the Committee of the Regions Stepping up Europe’s 2030 Climate Ambition Investing in a Climate-Neutral Future for the Benefit of Our People. 2020. Available online: https://eur-lex.europa.eu/legal-content/EN/TXT/?uri=CELEX%3A52020DC0562 (accessed on 8 March 2023).
- Czudec, A.; Mis, T.; Zajac, D.; Bogucki Wydawnictwo Naukowe. Zrównoważony Rozwój Obszarów Wiejskich w Wymiarze Regionalnym (Sustainable Rural Development on a Regional Level); Bogucki Wydawnictwo Naukowe: Poznan, Poland, 2018; ISBN 978-83-7986-199-6. [Google Scholar]
- Kalinowski, S. Problem ubóstwa i wykluczenia społecznego w krajach Unii Europejskiej w kontekście zrównoważonego rozwoju (The Problem of Poverty and Social Exclusion in the European Union Member States in the Context of Sustainable Development). Village Agric. 2018, 180, 93–112. [Google Scholar] [CrossRef]
- Klepacki, B. Zrównoważony rozwój terenów wiejskich—Wybrane aspekty teoretyczne (Sustainable development in rural area—Some theoretical aspects). Ann. Pol. Assoc. Agric. Agribus. Econ. 2000, 2, 8–13. [Google Scholar]
- Śmiglak-Krajewska, M.; Wojciechowska-Solis, J. Consumption Preferences of Pulses in the Diet of Polish People: Motives and Barriers to Replace Animal Protein with Vegetable Protein. Nutrients 2021, 13, 454. [Google Scholar] [CrossRef]
- UNECE. Virtual Workshop—UNFC Europe: Ensuring Sustainable Raw Material Management to Support the European Green Deal; UNECE: Geneva, Switzerland, 2020. [Google Scholar]
- Communication from the Commission to the European Parliament, the European Council, the Council, the European Economic and Social Committee and the Committee of The Regions The European Green Deal; 2019. Available online: https://eur-lex.europa.eu/legal-content/EN/TXT/?uri=COM%3A2019%3A640%3AFIN (accessed on 1 March 2023).
- Leyen, U. A Union That Strives for More. My Agenda for Europe. Politi-Cal Guidelines for the next European Commission 2019–2024; Publications Office of the European Union: Luxembourg, 2019. [Google Scholar]
- New Deal—Programs, Social Security & FDR. Available online: https://www.history.com/topics/great-depression/new-deal (accessed on 23 June 2023).
- ILOSTAT Data Tools to Find and Download Labour Statistics. Available online: https://ilostat.ilo.org/data/ (accessed on 15 May 2023).
- Shapiro, S.S.; Wilk, M.B. An Analysis of Variance Test for Normality (Complete Samples). Biometrika 1965, 52, 591–611. [Google Scholar] [CrossRef]
- Luszniewicz, A.; Słaby, T. Statystyka z Pakietem Komputerowym Statistica PL Teoria i Zastosowania (Statistics with the Computer Package STATISTICA PL Theory and Applications); C.H. Beck: Warsaw, Poland, 2003. [Google Scholar]
- Wysocki, F.; Lira, J. Statystyka Opisowa (Descriptive Statistics); Akademii Rolnicza im. Augusta Cieszkowskiego: Poznan, Poland, 2005. [Google Scholar]
- Aczel, A.D.; Sounderpandian, J. Statystyka w Zarządzaniu (Statistics in Management); PWN: Warsaw, Poland, 2021. [Google Scholar]
- EST. StatSoft Electronic Statistics Textbook. 2023. Available online: https://www.statsoft.pl/textbook/stathome.html (accessed on 15 May 2023).
- Creutzig, F.; Callaghan, M.; Ramakrishnan, A.; Javaid, A.; Niamir, L.; Minx, J.; Müller-Hansen, F.; Sovacool, B.; Afroz, Z.; Andor, M.; et al. Reviewing the Scope and Thematic Focus of 100 000 Publications on Energy Consumption, Services and Social Aspects of Climate Change: A Big Data Approach to Demand-Side Mitigation. Environ. Res. Lett. 2021, 16, 033001. [Google Scholar] [CrossRef]
- Kopeć, E. Regulacje Unii Europejskiej a Wskaźniki Gospodarki o obieguu zamkniętym w Polsce. In Wskaźniki Monitorowania Gospodarki o Obiegu Zamkniętym; Kulczycka, J., Ed.; Instytut Gospodarki Surowcami Mineralnymi i Energią Polskiej Akademii Nauk IGSMiE PAN: Krakow, Poland, 2020. [Google Scholar]
- Yang, Y.; Li, Y.; Guo, Y. Impact of the Differences in Carbon Footprint Driving Factors on Carbon Emission Reduction of Urban Agglomerations given SDGs: A Case Study of the Guanzhong in China. Sustain. Cities Soc. 2022, 85, 104024. [Google Scholar] [CrossRef]
- Matyka, M. Stan rolnictwa w Polsce na tle Unii Europejskiej (The state of agriculture in Poland compared to the European Union). Stud. Rap. IUNG-PIB 2014, 40, 14. [Google Scholar] [CrossRef]
- Kuznets, S. Economic Growth and Income Inequality. Am. Econ. Rev. 1955, 45, 1–28. [Google Scholar]
- Fodha, M.; Zaghdoud, O. Economic Growth and Pollutant Emissions in Tunisia: An Empirical Analysis of the Environmental Kuznets Curve. Energy Policy 2010, 38, 1150–1156. [Google Scholar] [CrossRef]
- Ozcan, B. The Nexus between Carbon Emissions, Energy Consumption and Economic Growth in Middle East Countries: A Panel Data Analysis. Energy Policy 2013, 62, 1138–1147. [Google Scholar] [CrossRef]
- Grossman, G.M.; Krueger, A.B. Economic Growth and the Environment. Q. J. Econ. 1995, 110, 353–377. [Google Scholar] [CrossRef] [Green Version]
- Wawrzyniak, D. Weryfikacja środowiskowej krzywej Kuznetsa dla krajów Unii Europejskiej (Testing Environmental Kuznets Curve in European Union Countries). Ekonomista 2018, 3, 318–334. [Google Scholar]
- Narayan, P.K.; Narayan, S. Carbon Dioxide Emissions and Economic Growth: Panel Data Evidence from Developing Countries. Energy Policy 2010, 38, 661–666. [Google Scholar] [CrossRef]
- Zafeiriou, E.; Mallidis, I.; Galanopoulos, K.; Arabatzis, G. Greenhouse Gas Emissions and Economic Performance in EU Agriculture: An Empirical Study in a Non-Linear Framework. Sustainability 2018, 10, 3837. [Google Scholar] [CrossRef] [Green Version]
- Ziolo, M.; Kluza, K.; Spoz, A. Impact of Sustainable Financial and Economic Development on Greenhouse Gas Emission in the Developed and Converging Economies. Energies 2019, 12, 4514. [Google Scholar] [CrossRef] [Green Version]
- Laborde, D.; Mamun, A.; Martin, W.; Piñeiro, V.; Vos, R. Agricultural Subsidies and Global Greenhouse Gas Emissions. Nat. Commun. 2021, 12, 2601. [Google Scholar] [CrossRef]
- Yasmeen, R.; Tao, R.; Shah, W.U.H.; Padda, I.U.H.; Tang, C. The Nexuses between Carbon Emissions, Agriculture Production Efficiency, Research and Development, and Government Effectiveness: Evidence from Major Agriculture-Producing Countries. Environ. Sci. Pollut. Res. 2022, 29, 52133–52146. [Google Scholar] [CrossRef] [PubMed]
- Genstwa, N. Economic Development of Regions in Poland and Changes in Greenhouse Gas Emissions (Studies in the Context of the Environmental Kuznets Curve). Ph.D. Thesis, Poznan University of Life Sciences, Poznan, Poland, 2022. Available online: https://wes.up.poznan.pl/sites/default/files/u90/Natalia%20Genstwa_doktorat.pdf (accessed on 10 March 2023).
- Sadowski, A. Agriculture in the World of Change—Challenges for Advice. Agric. Advis. Serv. 2020, 4, 7–19. [Google Scholar]
- McKinsey Global Institute. Digital Europe: Pushing the Frontier, Capturing the Benefits; McKinsey & Company: Atlanta, GA, USA, 2016; p. 11. [Google Scholar]
- ITU; FAO. International Telecommunication Union and Food and Agriculture Organization of the United Nations Status of Digital Agriculture in 18 Countries of Europe and Central Asia; FAO: Geneva, Switzerland, 2020. [Google Scholar]


| Variable | Year | Variable Name |
|---|---|---|
| Variables characterizing the total emissions of greenhouse gas, emissions of carbon dioxide CO2, methane CH4, and nitrous oxide N2O from industry (industrial processes and product applications) | ||
| Y01P | 2010–2019 | Greenhouse gas emissions from industrial processes and product applications in % of the total greenhouse gas emissions (CO2, N2O in CO2 equivalent, CH4 in CO2 equivalent, HFC in CO2 equivalent, PFC in CO2 equivalent, SF6 in CO2 equivalent, and NF3 in CO2 equivalent) |
| Y02P | 2010–2019 | CO2 emissions from the industrial processes and product applications in % of total CO2 emissions |
| Y03P | 2010–2019 | CH4 emissions from the industrial processes and product applications in % of total CH4 emissions |
| Y04P | 2010–2019 | N2O emissions from the industrial processes and product applications in % of total N2O emissions |
| Variables characterizing total emissions of greenhouse gas, emissions of carbon dioxide CO2, methane CH4, and nitrous oxide N2O from agriculture | ||
| Y05A | 2010–2019 | Greenhouse gas emissions from agriculture in % of total greenhouse gas emissions (CO2, N2O in CO2 equivalent, CH4 in CO2 equivalent, HFC in CO2 equivalent, PFC in CO2 equivalent, SF6 in CO2 equivalent, and NF3 in CO2 equivalent) |
| Y06A | 2010–2019 | CO2 emissions from agriculture in % of total CO2 emissions |
| Y07A | 2010–2019 | CH4 emissions from agriculture in % of total CH4 emissions |
| Y08A | 2010–2019 | N2O emissions from agriculture in % of total N2O emissions |
| General variable characterizing greenhouse gas emissions | ||
| Y09 | 1990–2019 | Greenhouse gas emissions in tonnes per capita |
| Variables characterizing economic conditions of industry and agriculture | ||
| X01 | 2000–2021 | Real GDP per capita in EUR |
| X02P | 2000–2020 | Share of business investment in % of GDP |
| X03P | 2000–2020 | Gross domestic expenditures on R&D in the corporate sector in % of GDP |
| X04A | 2004–2020 | Government support to agricultural research and development in EUR per capita |
| X05A | 2001–2020 | Agricultural factor income in EUR per annual work unit (AWU) |
| X06A | 2005–2016 | Stocking rate—number of livestock animals per ha |
| Variables characterizing employment in the industry, agriculture, and services sectors | ||
| X07P | 2010–2020 | Share of employees in the industrial sector in % of all working people |
| X08A | 2010–2020 | Share of employees in the agricultural sector in % of the total working population |
| X09S | 2010–2020 | Share of people employed in the service sector in % of all working people |
| Greenhouse Gas Emissions from Industry in % of Total Emissions (Y01P) | Greenhouse Gas Emissions from Agriculture in % of Total Emissions (Y05A) | ||||||||||
|---|---|---|---|---|---|---|---|---|---|---|---|
| Statistics/Year | 2010 | 2015 | 2017 | 2018 | 2019 | Statistics/Year | 2010 | 2015 | 2017 | 2018 | 2019 |
| EU(27) | 8.5 | 8.8 | 9.0 | 9.0 | 9.1 | EU(27) | 8.9 | 9.9 | 9.9 | 10.0 | 10.3 |
| Y01P min Estonia | 2.5 | 2.8 | 3.0 | 3.1 | 3.9 * | Y05A min Malta | 2.5 | 3.0 | 3.0 | 3.0 | 2.8 |
| Y01P max Slovakia | 20.7 | 22.2 | 22.6 | 22.5 | 21.6 | Y05A max Ireland | 28.5 | 30.8 | 31.6 | 32.4 | 32.4 |
| Vs | 49.9 | 47.0 | 47.0 | 45.5 | 44.1 | Vs | 56.4 | 55.2 | 56.3 | 56.2 | 55.0 |
| Carbon Dioxide (CO2) Emissions from the Industry in % of CO2 Emissions(Y02P) | Carbon Dioxide (CO2) Emissions from the Agriculture in % of CO2 Emissions (Y06A) | ||||||||||
|---|---|---|---|---|---|---|---|---|---|---|---|
| Statistics/Year | 2010 | 2015 | 2017 | 2018 | 2019 | Statistics/Year | 2010 | 2015 | 2017 | 2018 | 2019 |
| EU(27) | 7.2 | 7.5 | 7.8 | 7.9 | 8.1 | EU(27) | 0.3 | 0.3 | 0.3 | 0.3 | 0.3 |
| Y02P min Malta | 0.1 | 0.5 | 0.3 | 0.4 | 0.3 | Y06A min * | 0.0 | 0.0 | 0.0 | 0.0 | 0.0 |
| Y02P max Slovakia | 20.4 | 23.5 | 24.0 | 24.0 | 23.1 | Y06A max Ireland | 1.3 | 1.2 | 1.1 | 1.4 | 1.2 |
| Vs | 61.1 | 61.9 | 60.6 | 57.7 | 56.7 | Vs | 113.1 | 87.2 | 81.8 | 94.0 | 85.3 |
| Methane (CH4) Emissions from the Industry in % of Total CH4 Emissions (Y03P) | Methane (CH4) Emissions from the Agriculture in % of Total CH4 Emissions (Y07A) | ||||||||||
|---|---|---|---|---|---|---|---|---|---|---|---|
| Statistics/Year | 2010 | 2015 | 2017 | 2018 | 2019 | Statistics/Year | 2010 | 2015 | 2017 | 2018 | 2019 |
| EU(27) | 0.4 | 0.4 | 0.4 | 0.4 | 0.4 | EU(27) | 49.1 | 52.2 | 53.0 | 53.5 | 54.1 |
| Y03P min * | 0.0 | 0.0 | 0.0 | 0.0 | 0.0 | Y07A min Malta | 26.4 | 25.5 | 24.2 | 23.5 | 22.4 |
| Y03P max Netherlands | 1.7 | 1.9 | 1.9 | 1.9 | 2.0 | Y07A max Ireland | 94.6 | 92.3 | 92.8 | 93.0 | 93.2 |
| Vs | 149.7 | 154.7 | 148.7 | 147.7 | 152.0 | Vs | 36.2 | 36.0 | 36.1 | 35.8 | 35.7 |
| Nitrous Oxide (N2O) Emissions from Industry in % of Total N2O Emissions | Nitrous Oxide (N2O) Emissions from Agriculture in % of Total N2O Emissions | ||||||||||
|---|---|---|---|---|---|---|---|---|---|---|---|
| Statistics/Year | 2010 | 2015 | 2017 | 2018 | 2019 | Statistics/Year | 2010 | 2015 | 2017 | 2018 | 2019 |
| EU(27) | 8.4 | 4.8 | 4.5 | 4.2 | 4.4 | EU(27) | 75.4 | 79.2 | 79.4 | 79.4 | 79.4 |
| Y04P min Latvia | 0.2 | 0.0 | 0.0 | 0.0 | 0.2 | Y08A min Italy | 55.4 | 58.7 | 59.1 | 58.6 | 58.7 |
| Y04P max Cyprus | 38.8 | 20.4 | 19.1 | 18.0 | 18.2 | Y08A max Ireland | 91.9 | 92.5 | 92.4 | 92.6 | 92.2 |
| Vs | 109.8 | 107.8 | 105.3 | 98.0 | 95.2 | Vs | 15.2 | 10.7 | 10.2 | 9.8 | 10.9 |
| Correlations rxy–Emission from Industry | Correlations rxy–Emission from Agriculture | ||||||||
|---|---|---|---|---|---|---|---|---|---|
| Variable | Y01P | Y02P | Y03P | Y04P | Variable | Y05A | Y06A | Y07A | Y08A |
| Y05P | 1.00 | 0.96 * | −0.16 | 0.03 | Y05A | 1.00 | 0.76 * | 0.46 * | 0.70 * |
| Y06P | 0.96 * | 1.00 | −0.17 | −0.02 | Y06A | 0.76 * | 1.00 | 0.38 | 0.59 * |
| Y07P | −0.16 | −0.17 | 1.00 | 0.50 * | Y07A | 0.46 * | 0.38 | 1.00 | 0.09 |
| Y08P | 0.03 | −0.02 | 0.50 * | 1.00 | Y08A | 0.70 * | 0.59 * | 0.09 | 1.00 |
| PwY05P | −0.12 | −0.19 | −0.15 | −0.06 | PwY05A | 0.05 | 0.05 | 0.04 | 0.20 |
| PwY06P | −0.33 | −0.24 | −0.19 | −0.14 | PwY06A | 0.20 | 0.29 | −0.03 | 0.17 |
| PwY07P | 0.22 | 0.24 | 0.42 | −0.11 | PwY07A | −0.24 | −0.15 | −0.01 | −0.06 |
| PwY08P | −0.29 | −0.30 | 0.05 | 0.27 | PwY08A | −0.12 | −0.09 | −0.25 | −0.04 |
| PaY05P | 0.25 | 0.14 | −0.08 | −0.06 | PaY05A | 0.62 * | 0.52 * | 0.35 | 0.54 * |
| PaY06P | 0.30 | 0.35 | −0.20 | 0.03 | PaY06A | 0.18 | 0.33 | −0.04 | 0.25 |
| PaY07P | −0.03 | −0.02 | 0.80 | 0.14 | PaY07A | −0.22 | −0.20 | 0.34 | −0.19 |
| PaY08P | −0.59 * | −0.60 * | 0.20 | −0.20 | PaY08A | −0.06 | −0.09 | −0.23 | 0.04 |
| Specification | Class Name, GHG Emission Level, and Economic Conditions | |||
|---|---|---|---|---|
| Class I—Low | Class II—Lower Middle | Class III—Upper Middle | Class IV—High | |
| Countries Qualified for the Class | ||||
| Denmark Estonia Ireland Netherlands Luxembourg Poland Germany | Slovenia Latvia Spain Italy Malta Finland France | Bulgaria Portugal Croatia Romania Hungary Cyprus | Czechia Greece Sweden Lithuania Belgium Austria Slovakia | |
| Class Averages | ||||
| Greenhouse gas emissions from industrial processes and product applications in % of total greenhouse gas emissions (X01P) | 5.3 | 8.7 | 11.5 | 16.4 |
| Real GDP per capita in EUR (X01) | 50,019 | 29,000 | 15,980 | 29,394 |
| Share of business investments in % of GDP (X02P) | 17.5 | 12.9 | 13.1 | 14.3 |
| Gross domestic expenditures on R&D in the corporate sector in % of GDP (X03P) | 1.2 | 1.0 | 0.6 | 1.4 |
| Share of employees in the industrial sector in % of all working people (X07P) | 21.4 | 23.5 | 27.1 | 25.3 |
| Share of employees in the agricultural sector in % of the total working population (X08A) | 3.3 | 3.8 | 7.8 | 4.2 |
| Share of people employed in the service sector in % of all working people (X09S) | 73.0 | 72.3 | 65.0 | 69.2 |
| Specification | Class Name, GHG Emission Level, and Economic Conditions | |||
|---|---|---|---|---|
| Class I—Low | Class II—Lower Middle | Class III—Upper Middle | Class IV—High | |
| Countries Qualified for the Class | ||||
| Malta Cyprus Luxembourg Czechia Italy Slovakia Germany | Belgium Poland Austria Greece Netherlands Slovenia Estonia | Portugal Hungary Bulgaria Croatia Spain Finland | Sweden France Romania Latvia Lithuania Denmark Ireland | |
| Class Averages | ||||
| Greenhouse gas emissions from agriculture in % of total greenhouse gas emissions (Y05A) | 5.9 | 8.9 | 11.1 | 20.1 |
| Real GDP per capita in EUR (X01) | 37,867 | 29,767 | 21,355 | 36,171.4 |
| Government support for agricultural research and development in EUR per capita (X04A) | 5.0 | 5.0 | 5.3 | 8.2 |
| Agricultural factor income in EUR per annual work unit (AWU) (X05A) | 20,785 | 20,376 | 15,518 | 20,054.7 |
| Stocking rate—number of livestock animals per ha (X06A) | 1.2 | 1.4 | 0.5 | 0.7 |
| Share of employees in the industrial sector in % of all working people (X07P) | 24.9 | 24.2 | 26.1 | 22.2 |
| Share of employees in the agricultural sector in % of the total working population (X08A) | 2.1 | 5.0 | 5.1 | 6.5 |
| Share of people employed in the service sector in % of all working people (X09S) | 72.1 | 68.3 | 68.7 | 70.9 |
| Correlations rxy—Emission from Industry | Correlations rxy—Emission from Agriculture | |||||||
|---|---|---|---|---|---|---|---|---|
| Variable | X01 | X02P | X03P | Variable | X01 | X04A | X05A | X06A |
| Y05P | −0.13 | 0.38 | 0.04 | Y05A | 0.18 | 0.60 * | −0.02 | −0.09 |
| Y06P | −0.08 | 0.52 * | 0.07 | Y06A | 0.28 | 0.63 * | 0.07 | −0.10 |
| Y07P | 0.40 | 0.10 | 0.33 | Y07A | 0.80 * | 0.52 * | 0.57 * | 0.45 * |
| Y08P | 0.11 | −0.02 | 0.15 | Y08A | −0.05 | 0.39 | −0.05 | −0.25 |
| Variables | Correlations rxy | ||
|---|---|---|---|
| X07P | X08A | X09S | |
| Y01P | 0.27 | 0.06 | −0.19 |
| Y05A | −0.12 | 0.24 | 0.03 |
| Y09 | −0.31 | −0.31 | 0.30 |
| N = 27 | Dependent Variable Regression: Y01P: rxy= 0.376; R2 = 0.142 Corrected R2 = ----- F(4,21) = 0.866; p < 0.501; Standard Error of Estimation (SEE): 4.735 | |||||
|---|---|---|---|---|---|---|
| b* | SEE from b* | b | SEE from b | t(21) | p | |
| Free word | – | – | 10.23 | 5.93 | 1.72 | 0.10 |
| X01 | −0.33 | 0.33 | 0.00 | 0.00 | −1.02 | 0.32 |
| X02P | −0.03 | 0.23 | −0.02 | 0.14 | −0.12 | 0.90 |
| X03P | 0.22 | 0.23 | 1.51 | 1.54 | 0.98 | 0.34 |
| X07P | 0.07 | 0.29 | 0.05 | 0.19 | 0.25 | 0.80 |
| N = 27 | Dependent Variable Regression: Y05A: rxy = 0.785; R2 = 0.617 Corrected R2 = 0.526 F(5.21) = 6.768; p < 0.001 Standard Error of Estimation (SEE): 4.3558 | |||||
|---|---|---|---|---|---|---|
| b* | SEE from b* | b | SEE from b | t(21) | p | |
| Free word | – | – | 3.75 | 2.95 | 1.27 | 0.22 |
| X01 | 0.26 | 0.17 | 0.00 | 0.00 | 1.50 | 0.15 |
| X04A | 0.75 | 0.16 | 1.05 | 0.23 | 4.65 | 0.00 |
| X05A | −0.22 | 0.20 | 0.00 | 0.00 | −1.07 | 0.30 |
| X06A | −0.17 | 0.17 | −1.24 | 1.18 | −1.05 | 0.31 |
| X08A | 0.37 | 0.17 | 0.55 | 0.25 | 2.18 | 0.04 |
Disclaimer/Publisher’s Note: The statements, opinions and data contained in all publications are solely those of the individual author(s) and contributor(s) and not of MDPI and/or the editor(s). MDPI and/or the editor(s) disclaim responsibility for any injury to people or property resulting from any ideas, methods, instructions or products referred to in the content. |
© 2023 by the authors. Licensee MDPI, Basel, Switzerland. This article is an open access article distributed under the terms and conditions of the Creative Commons Attribution (CC BY) license (https://creativecommons.org/licenses/by/4.0/).
Share and Cite
Murawska, A.; Goryńska-Goldmann, E. Greenhouse Gas Emissions in the Agricultural and Industrial Sectors—Change Trends, Economic Conditions, and Country Classification: Evidence from the European Union. Agriculture 2023, 13, 1354. https://doi.org/10.3390/agriculture13071354
Murawska A, Goryńska-Goldmann E. Greenhouse Gas Emissions in the Agricultural and Industrial Sectors—Change Trends, Economic Conditions, and Country Classification: Evidence from the European Union. Agriculture. 2023; 13(7):1354. https://doi.org/10.3390/agriculture13071354
Chicago/Turabian StyleMurawska, Anna, and Elżbieta Goryńska-Goldmann. 2023. "Greenhouse Gas Emissions in the Agricultural and Industrial Sectors—Change Trends, Economic Conditions, and Country Classification: Evidence from the European Union" Agriculture 13, no. 7: 1354. https://doi.org/10.3390/agriculture13071354
APA StyleMurawska, A., & Goryńska-Goldmann, E. (2023). Greenhouse Gas Emissions in the Agricultural and Industrial Sectors—Change Trends, Economic Conditions, and Country Classification: Evidence from the European Union. Agriculture, 13(7), 1354. https://doi.org/10.3390/agriculture13071354