Article

Experimental Study on the Influence of Working Parameters of Centrifugal Fan on Airflow Field in Cleaning Room

1
School of Agricultural Engineering and Food Science, Shandong University of Technology, Zibo 255000, China
2
Shandong Provincial Key Laboratory of Dry Farming Machinery and Information, Zibo 255000, China
3
Shandong Shifeng Group Company Limited, Liaocheng 252800, China
*
Author to whom correspondence should be addressed.
Agriculture 2023, 13(7), 1368; https://doi.org/10.3390/agriculture13071368
Submission received: 24 June 2023 / Revised: 3 July 2023 / Accepted: 6 July 2023 / Published: 10 July 2023
(This article belongs to the Section Agricultural Technology)

Abstract

:
The air distribution and speed uniformity of the cleaning fan in the cleaning room have a great influence on the working quality of the cleaning system of the harvester. In view of the problem of uneven air distribution in the cleaning room caused by improper adjustment of the main operating parameters of the cleaning fan in the cleaning device of the corn combine harvester, this paper takes the self-developed air screen cleaning test bench as the object. The main working parameters of the cleaning centrifugal fan (air supply distance, fan speed, and number of blades) were simulated and the Fluent simulation software was used to carry out the single-factor and multi-factor optimization tests, explore the influence law of each test factor on the air velocity in front of the screen, in the middle and behind the screen and the deviation degree of the airflow at the back of the screen surface, and find the optimal parameter combination. The data were systematically analyzed by multiple regression method and variance analysis method. The regression model of air velocity at the front, middle, and back of the screen and the air deviation degree at the back of the screen surface for the three working parameters of the cleaning fan were established. The optimal working parameter combination was obtained, that is, when the air supply distance is 580 mm, the fan speed is 1000 r/min, and the number of blades is 10, the airflow velocity in front of the screen is 10.8 m/s, the airflow velocity in the middle of the screen surface is 11.8 m/s, the airflow velocity at the back of the screen surface is 11.2 m/s, and the airflow deviation degree at the back of the screen surface is 13.5%. The relative errors were 1.9%, 0, 2.8%, and 3.0%, respectively. A combined test of the fan and the cleaning screen body with a feeding capacity of 8 kg/s was carried out, and the loss rate was 1.15% and the impurities rate was 1.24%. The regression model was reliable, and the optimal operation parameter combination performed well, meeting the technical requirements of cleaning operation, and providing theoretical guidance for the adjustment of fan structure and operation parameters in the cleaning system of the grain harvester.

1. Introduction

As a key component of the air screen cleaning device [1,2,3], the fan mainly provides stable airflow for the cleaning room, and its air distribution and speed uniformity in the cleaning room have a great influence on the working quality of the cleaning system of the harvester.
Scholars at home and abroad have conducted a lot of research on the distribution of airflow field in cleaning equipment. Liang Zhenwei et al. [4] designed a four-channel cleaning centrifugal fan, tested the working parameters of the cleaning fan with CFD simulation software(Ansys15.0 and Hyper Work 14.0.), predicted the wind speed of the air outlet according to the load degree of the screen surface, and obtained the wind speed of each air outlet. Zhao Lei et al. [5]. used the CFD-DEM coupled simulation method to study the influence of air velocity at the outlet of the cleaning fan and the inclination angle of the screen surface on the distribution of the air field inside the cleaning device, and optimized the air field to reduce the impurity and loss rate of the rice cleaning device. Wang Jun et al. [6] studied the effects of the volute structure and the number and structure of blades on the performance of the flow field in the centrifugal fan. Jin Chengqian et al. [7] carried out a study on the influence of factors such as air door opening, fan speed, and deflector angle on the cleaning system of grain combine harvester on the working quality of the cleaning system, and determined the optimal working parameter combination. Aiming at the “double high” problem in the cleaning loss rate and clutter rate of the Ward Triomron 4LZ-3.0E rice combine harvester(China Jiangsu WORLD Group), Wang Hanhao et al. [8] carried out a study on the distribution of the airflow field in the cleaning chamber by combining CFD simulation and test prototype, and put forward some suggestions on improving the structure of cleaning fan and cleaning screen. Aiming at the uneven distribution of airflow on the screen surface of the cleaning chamber of the combine harvester, Leng Jun et al. [9] carried out a simulation study on the distribution of the airflow field in the cleaning chamber with the help of Hyper Work software 14.0, optimized the angle of the fan deflector and the structure of the cleaning chamber, and improved the operation effect of the cleaning system.
Although many scholars have conducted a large number of studies on the structure and parameters of the gas-screen type combined cleaning device, most of them focus on a single flow field in the cleaning fan and the conductivity of the screen structure, as well as the simulation test of gas-solid two-phase flow. There are insufficient studies on the influence of the fan structure and its working parameters on the distribution of the air field in the cleaning room, and the matching between the fan working parameters and the cleaning device. For the combined air screen cleaning device, the cleaning fan is the source of the wind factor of the cleaning device, and the air distribution in the cleaning room has a great influence on the harvest quality of the harvester. Therefore, this paper carries out a study on the influence of fan structure and working parameters on the airflow field distribution in the cleaning chamber with the help of Fluent simulation software. It carries out bench tests on the results, providing theoretical guidance for the adjustment of fan structure and operating parameters in the cleaning system of the grain harvester.

2. Cleaning Test Bed Structure and Working Principle

2.1. Structural Parameters of Cleaning Test Bed

The combined cleaning test bed is mainly composed of a centrifugal fan, cleaning chamber, hopper, shaking plate, cleaning screen, and other components, as shown in Figure 1. The centrifugal structure with two side air intake and a backward blade is selected for the fan [10]. In order to make the airflow from the two sides of the air intake flow better to the middle of the fan blade, the outer end of the blade is treated with angle cutting. In order to improve the uniformity of airflow leaving the outlet, a deflector with an adjustable angle is set in the outlet [11]. The specific structural dimensions are shown in Table 1.
The upper screen is used for the first-order screening of the ejection, which bears a large load [12], adopts the fish scale screen with strong adaptability, low clogging probability, and guiding effect on the airflow, and the lower screen adopts the punching screen with a simple structure.

2.2. Working Principle of the Test Bench

During operation, the extractile material is sent to the jigger plate with a stable and uniform thickness of the material layer through the feed roller at the bottom of the hopper. It is then uniformly sent to the fish scale screen under the action of the jigger plate to realize the preliminary stratification of the material on the screen. Further with the reciprocating motion of the screen box, the material on the screen is layered and distributed on the screen surface, and under the action of the airflow of the fan, the light debris is blown away from the screen surface and moves to the back of the screen, and the grain is successively passed through the fish scale screen—punching screen into the receiving device at the lower part of the screen, to achieve the separation of the grain and the light debris [13].

3. Test Method and Determination of Suspension Velocity of Ejection

3.1. Selection of Experimental Factors

The key structure and working parameters of the cleaning fan mainly include the horizontal distance from the air outlet to the upper screen (air supply distance), the fan speed, and the number of blades [14,15]. The above three key parameters are selected as test factors, and the screen surface wind speed is taken as a test index to carry out a simulation single-factor test and multi-factor test. Based on the structural parameters of the existing agricultural centrifugal fans in China and the operation experience of the harvester cleaning device [16,17], the value range of the single factor test is selected as follows: fan speed n = 800–1100 r/min, blade number N = 4–10, air supply distance L = 340–700 mm. In the single factor test, the values of fixed factors are, respectively, supply air distance 580 mm, fan speed 1000 r/min, and number of blades 4. In the case of no outfall in the cleaning room, the influence law of different working parameters of the fan on the air field in the cleaning room is explored, and the structural diagram of the test factors is shown in Figure 2.

3.2. Determination of Suspension Velocity of Ejection

In order to carry out the simulation test of airflow field more accurately, the suspension velocity of different components of corn extract was determined by using the material suspension test bench. The corn variety was Zhengdan 958, which was widely planted in the Huang-Huaihai area, and the test results were shown in Table 2. The wind speed measured on the measuring plane can be measured and calibrated by adjusting the working parameters of the fan according to the measured suspending velocity data [18,19,20].

4. Numerical Simulation of Airflow Field of Cleaning Device

4.1. Simulation Model Establishment and Grid Division of Cleaning Device

Considering that the internal structure of the cleaning test bench is complex, which will affect the grid division of the system and the subsequent calculation workload, the three-dimensional model is simplified in this paper under the condition of ensuring that the internal flow field structure is not affected. The simplified model structure mainly includes a fan, cleaning chamber, shaking plate, receiving device, upper screen, and lower screen. In order to explore the influence of the number of fan blades and the distance of air supply on the airflow field distribution of the cleaning unit, the three-dimensional models of 8 cleaning units with the number of fan blades 4, 6, 8, 10 and the distance of air supply 340, 460, 580, 700 mm were established, respectively. The simplified and adjusted cleaning device model was imported into Space Cliam software(Ansys 2021R1), and the rotation domain and fluid domain of the cleaning device were divided by Boolean operation. The segmented model was imported into the Mesh module, and its boundary name and boundary size were adjusted [21]. Considering that the mesh quality will affect the calculation accuracy, cost, convergence, and time cost of the airflow field model, combined with the structural complexity of the cleaning device, the unstructured tetrahedral mesh is selected to mesh the airflow field model.

4.2. Air Field Model Fluent Simulation Parameter Settings

The flow field model after grid division is imported into the parameter setting module of Fluent. The calculation model selects the Realizable K-ε model, which is more accurate for jet and rotational flow prediction. The Multiple Reference Frame Model (MRF) is used to solve the dynamic region model. The impeller region of the fan was set as the rotation domain, and the whole cleaning device region was set as the fluid domain. In order to explore the influence of the fan speed on the distribution law of the airflow field, the rotation domain of 800, 900, 1000, and 1100 r/min were set, respectively, and the interface contact surface was used to transfer data between the solving domains. Considering the large scope of the cleaning chamber and the external transparency, its working pressure was set to 1 atmosphere. In order to make the calculation results more accurate, the residual error of the solver was set to 0.00001. After initializing all conditions, iterative calculation was performed [22,23,24,25].

4.3. Establishment of Wind Speed Observation Point on Screen Surface of Cleaning Screen

In order to facilitate the observation of the airflow velocity distribution in the cleaning chamber, considering that the screen surface is always in a reciprocating motion during the operation process, combined with the space requirement of placing detection sensors, a measurement plane was established 120 mm above the screen surface of the fish scale screen in the cleaning chamber with the right apex of the front end of the fish scale screen as the origin. Since the cleaning operation is mainly carried out on the upper cleaning screen, the upper screen surface bears a large amount of material load, so this paper mainly studies the airflow of the upper cleaning screen surface and the airflow of the lower cleaning screen surface is not studied. The position of the observation plane is shown in Figure 3a. In order to facilitate the description of the flow field of the screen surface, the measuring plane was divided into three areas: the front part of the screen (zone A), the middle part of the screen surface (zone B), and the back part of the screen surface (zone C). Nine velocity measurement points were uniformly set in the measuring plane, and eight velocity measurement points were uniformly set in the longitudinal plane, totaling 72 velocity measurement points. The distribution of velocity measurement points is shown in Figure 3b.

4.4. Numerical Simulation Analysis

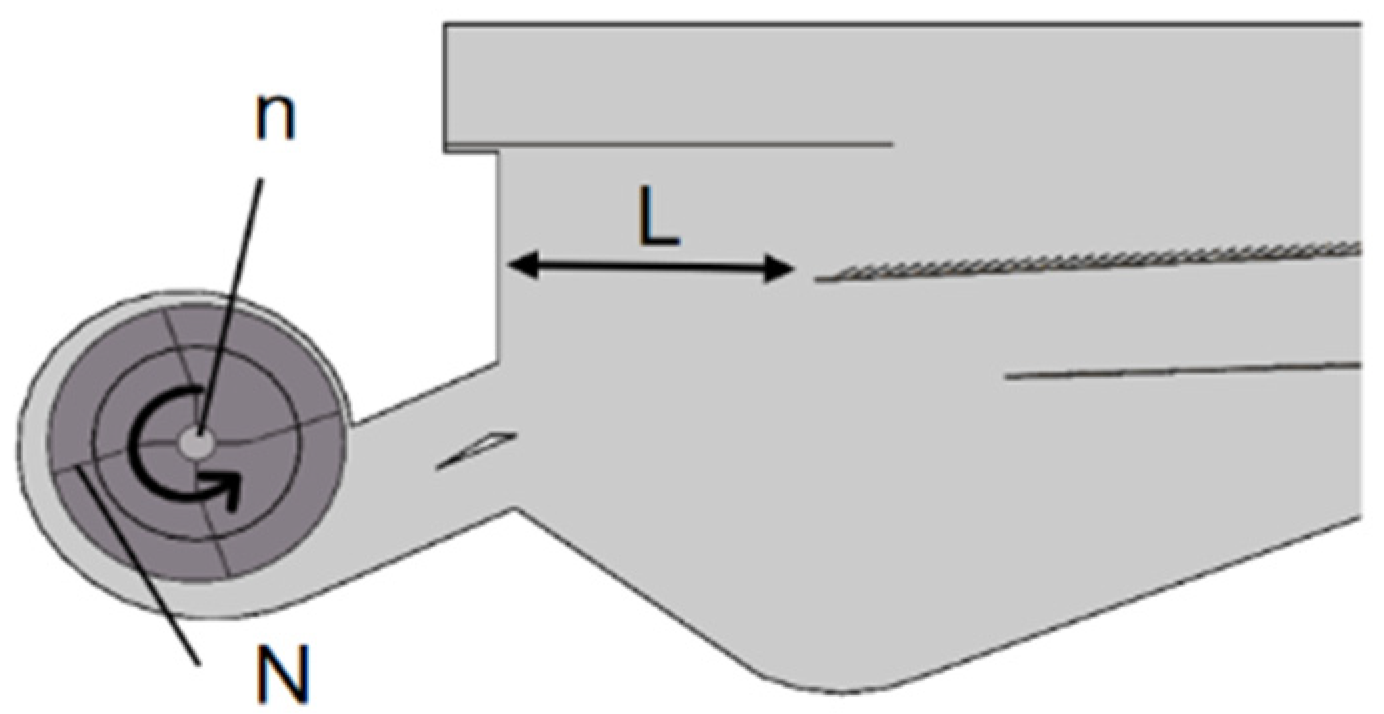
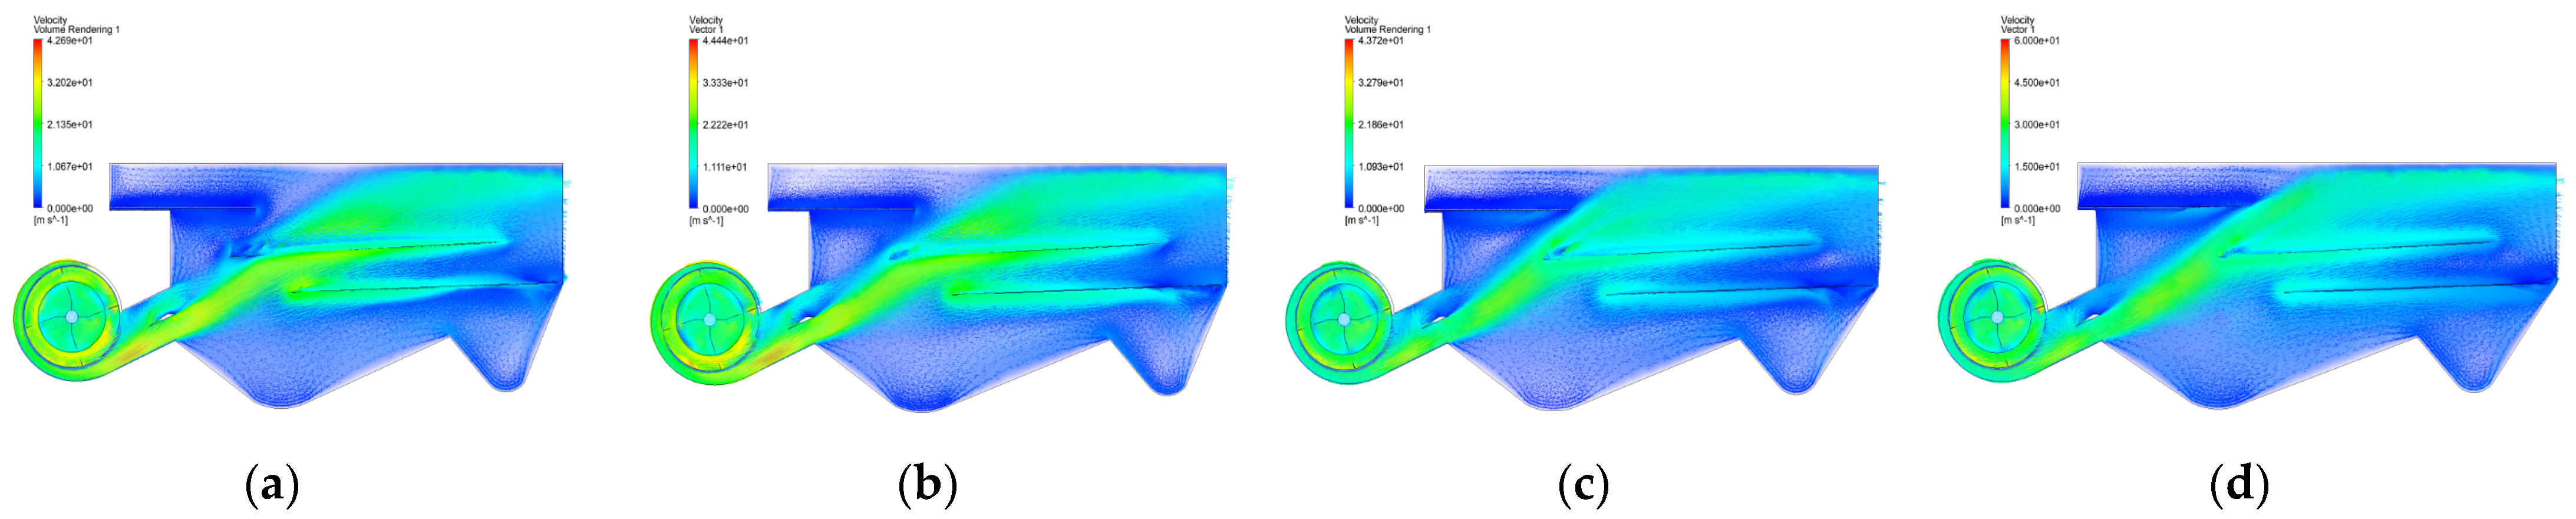
4.4.1. Influence of Air Supply Distance on Airflow Field of Cleaning Chamber

Four airflow field models with the distance between the fan outlet and the front end of the screen being 340, 460, 580, and 700 mm were established, respectively. The velocity vector diagram of the airflow field and the velocity cloud image of the observation plane above the screen surface were shown in Figure 4 and Figure 5. As can be seen from Figure 4, under the action of fan blades, the airflow in the volute is divided into two streams of air, which are, respectively, sent to the front of the top screen, the middle, and the back of the top screen by the action of the baffle plate. With the increase in air supply distance, the airflow speed in front of the screen gradually increases. However, hindered by the shaking plate, the airflow under the shaking plate will form a gradually obvious vortex with the longer air supply distance, causing local airflow loss. When the air supply distance is 340 mm and 460 mm, although the local air loss in the front of the upper screen is small, the air volume in the front of the screen is not sufficient, which is not conducive to the dispersion and stratification of a large number of fallen objects in the front of the screen. When the air supply distance is 580 mm, although the vortex loss in the front of the upper screen increases, the high speed just flows through the rear end of the shaking plate, and maintains a relatively sufficient air volume in the front of the screen, which is conducive to the dispersion and stratification of the material on the screen. Thus, the effective contact area between the ejection and the screen increases, and the probability of the seed penetration is increased. When the air supply distance is 700 mm, the air volume in front of the screen is very abundant, but the vortex loss under the shaking plate is high, which is not conducive to airflow diffusion and is not conducive to cleaning work.
According to the airflow velocity cloud Figure 5a–d of the observed plane, a high-efficiency airflow cleaning area is formed above the fish-scale screen, and the high-efficiency airflow cleaning area of the screen surface will move about 60–80 mm to the direction of the fan when the air supply distance increases by 120 mm. From the fan to the outlet, the airflow on the upper screen surface approximately presents a “W” type distribution. The reason for this distribution is that on the one hand, the airflow into the fan first enters from both sides of the fan, and the airflow into the fan will gradually converge from both ends of the blade to the middle part of the blade and is sent out of the volute. The airflow speed at both ends of the blade is higher than other areas of the outlet. On the other hand, because the air supply form of the centrifugal fan is a jet movement, when there is a wall on one side of the jet, it is affected by the wall, resulting in a Kornda effect. This leads to a higher airflow speed near the two walls of the cleaning chamber. This phenomenon makes it difficult to produce material accumulation on both sides of the screen surface under the condition of low fan speed, which is beneficial to cleaning. However, when the fan speed is high, there will be a phenomenon of “running grain” near the left and right walls, which is not conducive to cleaning operations. When the air supply distance is 460 mm and 700 mm, it can be clearly observed that a large number of low-speed areas are generated in the middle and back of the fish scale above the screen, resulting in poor airflow uniformity throughout the screen surface. In comparison, when the air supply distance is 580 mm, there are fewer low-speed areas in the middle and back of the screen surface, the airflow distribution is more uniform than that of other controls, and the airflow on the screen surface is sufficient. It is conducive to cleaning operations. The above analysis shows that the air supply distance affects the longitudinal air distribution of the super cleaning screen, and the air supply distance of 460–700 mm is the best operating range to meet the requirements of the cleaning fan.

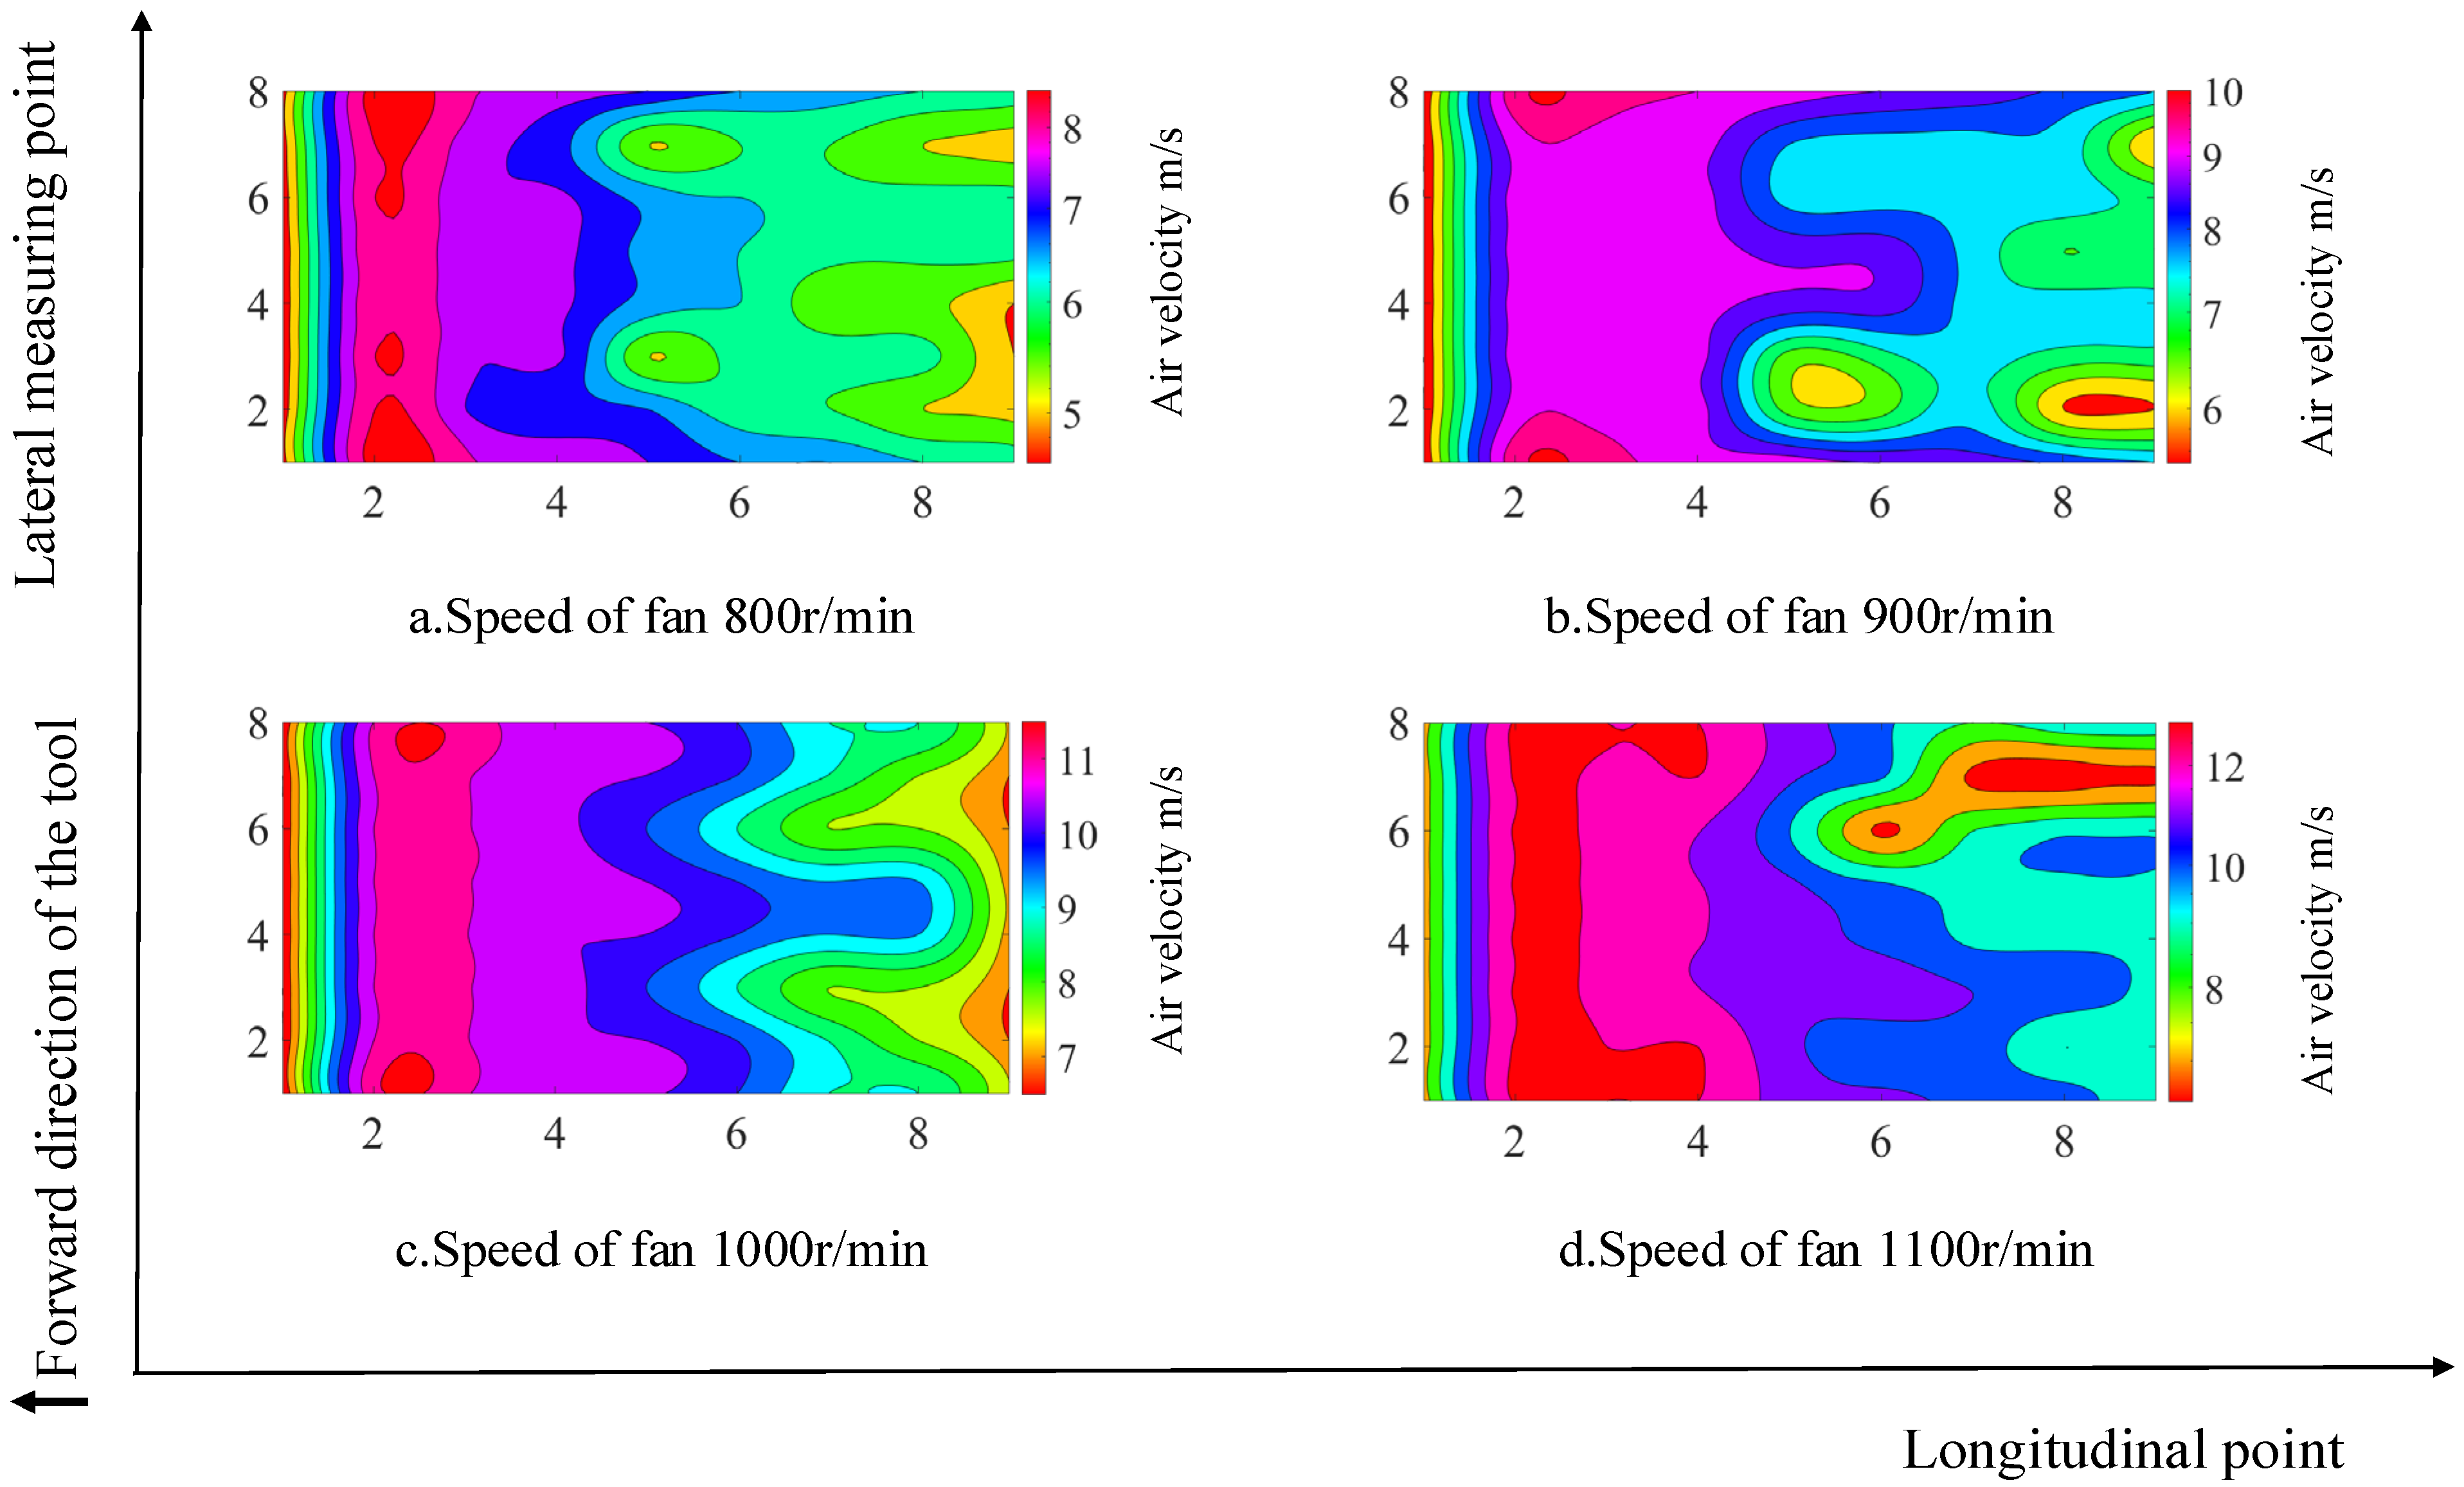
4.4.2. Influence of Fan Speed on Airflow Field in Cleaning Chamber

In order to explore the influence of fan speed on the airflow field of the cleaning chamber, the airflow field of the cleaning chamber was simulated when the fan speed was 800, 900, 1000, and 1100 r/min, and the results were shown in Figure 6, Figure 7 and Figure 8.
As can be seen from Figure 6, in the direction of the height of the outlet, the air supply state shows a decreasing trend from the bottom of the outlet to the top of the outlet. Due to the influence of fan width, airflow disturbance occurs in the width direction of the outlet, as shown in Figure 7, resulting in uneven distribution of transverse airflow velocity in the outlet.
On the whole, when the fan speed is 900 r/min, the speed of the air outlet on the fan is 2.8–16.1 m/s, and the degree of uniformity between the wind speed and the air speed on the left side is slightly higher than that on the right side. The velocity of the lower outlet is 8.5–28.7 m/s, that is, the airflow of the lower outlet has a great influence on the flow field distribution in the cleaning room. When the fan speed is less than 900 r/min, the wind speed of the upper and lower outlet does not change significantly. When the fan speed increases to 1000 r/min, the wind speed of the upper and lower outlet changes significantly in the width and height direction, and the low-speed area is supplemented by airflow. The wind speed of the upper outlet ranges from 3.1 to 18.7 m/s, and the wind speed of the lower outlet ranges from 10.4 to 31.2 m/s. As the fan speed increases, the wind speed of the outlet tends to be stable. Moreover, the uniformity of wind speed in the outlet has also been greatly improved.
It can be seen from Figure 8 that the airflow in front of the screen is relatively uniform, and the airflow in the middle and back of the screen presents a longitudinal “W” pattern of layer-by-layer decreasing distribution. It is the most obvious in Figure 8a,d. In the process of cleaning, if the fan speed is too low, the airflow speed of the screen surface is too low, which cannot meet the conditions of grain and grass separation, so the grain impurity content increases. If the fan speed is too high, the airflow speed of the screen surface will be higher than the suspension speed of the grain, resulting in an increase in the loss rate of the grain. Therefore, the airflow speed above the screen surface should be greater than the suspension speed of the impurities in the ejection and less than the suspension speed of the grain in order to meet the separation conditions of grain and grass. When the rotating speed of the fan is 800 r/min, the airflow velocity of the screen surface is generally low, which cannot meet the demand of efficient cleaning. When the fan speed is 900 r/min and 1000 r/min, the maximum air velocity of the measuring plane is 10.4 m/s and 11.6 m/s, respectively, which does not exceed the minimum suspension velocity of seeds, and is suitable for cleaning operation. When the fan speed is 1100 r/min, the airflow in front of the screen is larger, and the maximum airflow speed at the two walls can reach 13.1 m/s, which has exceeded the minimum suspension speed of the seeds, and it is easy to blow the seeds out of the machine, resulting in entrainment loss. The above analysis shows that the fan speed affects the air velocity of the fan outlet and the cleaning room, and a fan speed of 900–1000 r/min is the best operating range to meet the requirements of the cleaning fan.

4.4.3. Influence of the Number of Fan Blades on the Airflow Field of Cleaning Chamber

In order to explore the influence of the number of fan blades on the airflow field of the cleaning chamber, the airflow field of the cleaning chamber with the number of fan blades 4, 6, 8, and 10 was simulated, and the results are shown in Figure 9. As shown in Figure 9a–d, as the number of blades increases, the contact area between the blades and the gas increases, the work done by the airflow increases, and the uniformity of the airflow velocity on the upper screen surface is improved as a whole.
According to Figure 9b–d, a low-speed “W” and “U” shaped area is formed in the front and back of the screen, and a high-speed “arch” shaped area is formed in the middle of the screen surface. As the airflow enters from both sides of the fan, it first flows into both ends of the blade and finally gathers in the middle. Due to the large transverse width of the centrifugal fan, an axial vortex is caused in the width direction of the outlet of the centrifugal fan, thus forming a “W” type low-speed area. Due to the continuous accumulation of the middle airflow and the continuous supplement of the rear airflow, an “arch” type high-speed area is formed in the middle of the screen surface. As the wall effect in the cleaning room and the airflow at the back of the screen surface decrease, the two are superimposed, and a “U-shaped” low-speed area is formed at the back of the screen surface. When the number of blades is 4, the airflow on the screen surface decreases rapidly, and the air velocity in the middle and back is low, which has a small blowing effect on the material, which is not conducive to the cleaning operation. When the number of blades is 6, the airflow of the whole screen surface fluctuates greatly. The airflow velocity in the low-speed area of “W” formed in front of the screen is as low as 9.5 m/s, and the airflow velocity value on both sides is as high as 11.7 m/s. Due to the influence of airflow velocity difference and pressure difference in the front of the screen, it is more conducive to the dispersion and stratification of the extracted material on the screen surface. However, the “U” shaped low-speed zone formed at the back of the screen surface has a maximum airflow velocity of 10.9 m/s and a minimum airflow velocity of 7.3 m/s, and the airflow velocity difference between the left and right regions is large, which makes it easy for material to accumulate in the low-speed zone. This results in entrain loss, which is not conducive to cleaning operations. When the number of blades is 8, it can be obviously seen that the fluctuation amplitude of airflow on the screen surface is significantly reduced, and the rear “U” low-speed area is supplemented by airflow, but the airflow velocity in the “arch” area in the middle of the screen surface is significantly different from the airflow on both sides of the screen surface. In the cleaning operation, the material load in the middle of the screen surface is the heaviest, although the high-speed airflow will improve the cleaning rate of the harvest when the fan speed is higher, the airflow in the middle of the screen surface will increase the cleaning rate. It will not only produce material accumulation on both sides of the screen surface, but also produce entrainment loss. When the number of blades is 10, the airflow stability of the screen surface is obviously improved, and the airflow velocity of the three regions is not different, and the range of the “arch” type high-speed area in the middle of the screen surface is expanded. This is conducive to reducing the load of the screen surface and beneficial to cleaning. The above analysis shows that the number of blades affects the uniformity of airflow in the cleaning room, and a number of blades ranging from 6 to 10 is the best operating range to meet the requirements of the cleaning fan.

5. Orthogonal Optimization of Airflow Field of Cleaning Device

5.1. Experimental Design

Considering that fan performance is the result of the comprehensive action of multiple factors, combined with the single-factor test results of the selected parameters above, orthogonal optimization tests are carried out with air supply distance, impeller speed, and blade number as test factors. The level coding table of test factors is shown in Table 3.
According to the previous division of the observation plane above the fish scale sieve, the observation plane was divided into three regions: the front of the sieve (zone A), the middle of the sieve surface (zone B), and the back of the sieve surface (zone C), with 24 observation points set in each region, as shown in Figure 3b. Considering the operation process of the grain harvester, the load of the screen surface will gradually decrease along the length direction due to the continuous separation of grains, which determines the difference of air velocity demand at different longitudinal positions of the screen surface. As for the width direction of the cleaning chamber, the load distribution can be approximately considered, so the assessment index here is expressed by means of longitudinal partition and horizontal mean calculation. Therefore, the average wind speed Y1 and Y2 of the two regions A and B are taken as two evaluation indexes to investigate the airflow field. Because area C is close to the outlet, if the air velocity in area C is too high, the entrained loss is easy to be caused. It can be observed from the simulation results in the early stage that the airflow behind the screen surface is greatly affected by the change in the working parameters of the centrifugal fan. Therefore, the average wind speed Y3 in area C and the deviation degree of air velocity Y4 are taken as the other two evaluation indexes to investigate the airflow field, with a total of 4 evaluation indexes. The calculation method of airflow velocity deviation is as follows:
P = v max v min v m 100 %
In the formula
  • P —Shaker back deviation, m / s ;
  • v max —Maximum air velocity behind the screen surface, m / s ;
  • v min —Minimum air velocity behind screen surface, m / s ;
  • v m —Average airflow behind the screen surface, m / s .
Reasonable wind speed is conducive to the cleaning of the ejectors, which requires that the air velocity of the screen surface should be less than the suspension velocity of the kernel and greater than the suspension velocity of the core shaft [8,26]. It can be concluded that the air velocity of the three areas of the screen surface should meet 9.1 m/s < v < 12.2 m/s, and effective air cleaning can be achieved at this time.
The average airflow velocity at the front, middle, and back of the screen and the deviation of airflow at the back of the screen were used as evaluation indexes to investigate the airflow field. The test plan arrangement and results are shown in Table 4. Each group of tests was repeated three times, and the average value of the three test results was taken as the final test result.

5.2. Analysis of Test Results

According to the test results in Table 4, the airflow velocity in the front, middle, and back of the screen and the airflow deviation degree in the back of the screen surface were analyzed by variance analysis, and the insignificant items were removed. The results are shown in Table 5. The regression equations of airflow velocity in the front, middle, and back of the screen and airflow deviation in the back of the screen surface are shown in Equations (2)–(5).
Y 1 = 10.48 + 0.825 a + 0.7375 b + 0.5375 c + 0.275 a b 0.0326 a 2 0.315 b 2 0.0219 c 2
Y 2 = 11.38 + 0.2375 a + 0.7375 b + 0.625 c + 0.25 b c 0.4275 a 2 + 0.3725 b 2 + 0.1975 c 2
Y 3 = 10.18 + 0.7 a + 0.4 b + 0.825 c + 0.3 a c 1.01 a 2 + 0.385 c 2
Y 4 = 16.46 + 3.04 a 1.69 b 5.08 c 1.31 a c + 5.05 a 2 + 1.39 c 2
It can be seen from Table 5 that the P values of the model of airflow velocity in the front and middle of the screen, as well as that behind the screen, and airflow deviation degree at the back of the screen surface were all <0.01, indicating that the regression model is extremely significant. The determination coefficients R2 were 0.9827, 0.9794, 0.9797, and 0.9838, respectively, indicating that the variation of response values could be explained by models Y1, Y2, Y3, and Y4. The P values of the air velocity in the front, middle, and back of the screen and the air deviation degree in the back of the screen were 0.4247, 0.6921, 0.3099, and 0.1337, respectively, all of which are greater than 0.05, indicating that the error generated by the test is small and the model is reasonable. Models Y1, Y2, Y3, and Y4 can be used to predict the airflow velocity in the front, middle, and back of the screen and the variation trend of airflow deviation degree at the back of the screen.
According to the F value, the influence degree of operation parameters of the cleaning fan on the airflow velocity in the front, middle, and back of the screen and airflow deviation in the back of the screen surface can be judged. The order of the influence of each factor on the air velocity in front of the screen is as follows: supply air distance > fan speed > blade number. The main order of influence on the air velocity in the middle of the screen surface is: fan speed > blade number > air supply distance. The order of influence on the airflow velocity at the back of the screen surface is as follows: number of blades > distance of air supply > fan speed. The main and secondary order of influencing degree of airflow deviation at the back of screen surface is: number of blades > distance of air supply > fan speed.
The response surface of the interaction between fan speed and air supply distance on the airflow velocity in zone A is shown in Figure 10a. It can be seen from Figure 10a that the airflow velocity in zone A is higher when the fan speed is 1000–1100 r/min and the air supply distance is 580–700 mm. At each level of fan speed, with the increase in air supply distance, the airflow velocity in zone A increases. At each level of the air supply distance, with the increase in the fan speed, the airflow speed in zone A shows an upward trend. The response surface of the interaction between the number of blades and the speed of the fan on the air velocity in zone B is shown in Figure 10b. It can be seen from Figure 10b that when the number of blades is 8 to 10 and the speed of the fan is 1000 to 1100 r/min, the air velocity in zone B is higher. At each level of the number of blades, with the increase in fan speed, the airflow velocity in zone B increases. At each level of fan speed, with the increase in the number of blades, the airflow velocity in zone B shows an upward trend. The response surface of the interaction between air supply distance and the number of blades on the airflow velocity in zone C is shown in Figure 10c. As can be seen from Figure 10c, when the air supply distance is 520–640 mm and the number of blades is 8–10, the airflow velocity in zone C is higher. At each level of the air supply distance, with the increase in the number of blades, the airflow velocity in zone C increases. At each level of the number of blades, with the increase in air supply distance, the airflow velocity in zone C increases first and then decreases. The response surface of the interaction between air supply distance and the number of blades on the deviation degree of airflow velocity in zone C is shown in Figure 10d. It can be seen from Figure 10d that when the air supply distance is 460–580 mm and the number of blades is 8–10, the deviation degree of airflow velocity in zone C is relatively low. At each level of the air supply distance, with the increase in the number of blades, the airflow velocity deviation in the C zone shows a downward trend. At each level of the number of blades, with the increase in air supply distance, the airflow velocity deviation in zone C decreases first and then increases.

5.3. Parameter Optimization and Test Verification

In order to obtain the optimal operating parameters of the cleaning fan, it is required that the airflow velocity in front of the screen, in the middle, and at the back of the screen should be the maximum and the airflow deviation in the back should be the minimum. The regression equations of airflow velocity in the front, middle, and back of the screen and airflow deviation degree in the back of the screen surface were used as response variable functions, and their value ranges were limited, factor variables and corresponding constraints were determined, and the regression model was optimized.
Through multi-objective optimization, the optimal working parameter combination of the cleaning fan was obtained: the supply air distance is 585.55 mm, the fan speed is 991 r/min, and the number of blades is 10. The results of this parameter combination are as follows: the average airflow velocity at the front of the screen is 10.6 m/s, the average airflow velocity at the middle of the screen is 11.8 m/s, the average airflow velocity at the back of the screen is 10.9 m/s, and the airflow deviation at the back of the screen is 13.9%. In order to verify the above results, according to the adjustable range of the parameters of the cleaning fan of the harvester, a set of parameters closest to the optimal value was selected for a bench test, and the test parameters were selected as follows: supply air distance 585 mm, fan speed 1000 r/min, and the number of blades 10.
In order to verify the accuracy of the optimization experiment, three repeated tests were carried out under the conditions of optimal parameter combination to obtain the average value. The test was conducted using the air-screen type combined cleaning test rig independently developed by the research group, as shown in Figure 11.
In the test process, when no object is discharged from the cleaning room, the pitot tube equal-flow wind velocity sensor is used to measure the velocity measurement points arranged in the front cleaning room, and then the average airflow velocity in the three areas and the airflow deviation degree at the back of the screen surface are calculated, respectively. In addition, after the wind speed was determined in each group of tests, a combined test was carried out under the joint action of the cleaning fan and the cleaning screen when there were objects discharged. Before the test, the weighed ejector was put into the hopper of the cleaning device, the feeding amount of the ejector was 8 kg/s, the sifting degree of fish scale was 30 mm, and the vibration frequency of the cleaning screen was 7 Hz. All the seed-through grains and impurities were collected in the feeding device and weighed, and the entrained and discharged grains were collected and weighed at the tail of the cleaning test bench. The test was repeated three times for each group, and the impurity content and loss rate of the corn cleaning grains were calculated, respectively. The test results were shown in Table 6.
Bench tests were carried out under this parameter combination, and the average airflow velocity in front of the screen, in the middle, and behind the screen, as well as the average airflow deviation degree in the back of the screen, were measured at 10.8 m/s, 11.8 m/s, 11.2 m/s, and 13.5%, respectively. The relative errors of the optimized results were 1.9%, 0, 2.8%, and 3.0%, respectively, indicating that the optimized model was reliable. The results show that the mean values of the cleaning loss rate and impurity rate are 1.15% and 1.24%, respectively, which is in line with the national standard that the impurity rate and loss rate of corn grain harvester cleaning operation are less than 2.5% and less than 2%, and meet the requirements of cleaning operations.

6. Conclusions

(1)
A prototype of the combined air and screen cleaning device was developed. Fluent simulation software was used to conduct a single-factor test on the influence of the air supply distance of the centrifugal fan, the fan speed, and the number of blades on the airflow velocity of the screen surface. Furthermore, the change law of the airflow velocity in front of the screen, in the middle, and behind the screen surface, as well as the airflow deviation degree at the back of the screen surface with relevant parameters, were studied and analyzed. It is concluded that the optimal horizontal range of operation parameters of the cleaning centrifugal fan is a supply air distance of 460–700 mm, a fan speed of 900–1000 r/min, and a number of blades of 6–10.
(2)
The response surface regression test was carried out in combination with Design-Expert software, and the regression model of air velocity in front of, in the middle of, and behind the screen, as well as the deviation degree of airflow at the back of the screen surface concerning three working parameters of the cleaning fan, were obtained. The test showed: the air supply distance is a significant factor affecting the airflow velocity in front of the screen; the fan speed is a significant factor affecting the airflow velocity in the middle of the screen surface; and the number of blades is a significant factor affecting the airflow at the back of the screen surface and the deviation degree of the airflow at the back of the screen surface.
(3)
The multi-objective optimization method was used to optimize the average airflow velocity in the front, middle, and back of the screen and the airflow deviation degree at the back of the screen surface. The optimal working parameter combination obtained consisted of an air supply distance of 580 mm and a fan speed of 1000 r/min, with the number of blades being 10. The bench test was carried out under these conditions. At this time, the average airflow velocity at the front of the screen was 10.8 m/s, the average airflow velocity at the middle of the screen was 11.8 m/s, the average airflow velocity at the back of the screen was 11.2 m/s, and the airflow deviation at the back of the screen was 13.5%, and the relative errors with the optimization results were 1.9%, 0, 2.8% and 3.0%, respectively. A combined test of the cleaning fan and cleaning screen body was carried out under the condition of a feeding amount of 8 kg/s. The results showed that the loss rate was 1.15% and the impurity rate was 1.24%, which met the technical requirements of cleaning operation and could provide theoretical guidance for the adjustment of the fan structure and operation parameters of the cleaning system of a grain harvester.

Author Contributions

Conceptualization, D.G.; Methodology, C.Z. and D.G.; Validation, C.Z., J.M. and Q.W.; Formal analysis, C.Z., X.L., D.L. and Q.W.; Investigation, C.Z., H.X., X.L., J.M., D.L. and Q.W.; Resources, H.X.; Data curation, C.Z.; Writing—original draft, C.Z.; Writing—review & editing, D.G.; Supervision, D.G.; Project administration, D.G.; Funding acquisition, D.G. All authors have read and agreed to the published version of the manuscript.

Funding

This research was funded by the National Key R&D Program of China, grant number 2021YFD2000502, the Natural Science Foundation of Shandong Province, grant number ZR2022ME064, and the Modern Agricultural Industrial System of Shandong Province, grant number SDAIT-02-12.

Conflicts of Interest

We declare that we have no conflict of interest.

References

  1. Du, H.; Wang, Y.; Zhang, H.; Sun, H.; Zhang, G. Current situation and development trend of centrifugal fans in Combine cleaning equipment. Chin. J. Agric. Mech. 2019, 40, 73–77. [Google Scholar]
  2. Li, H.-x.; Li, Y.-m.; Ma, Z. Research status and development trend of cleaning fans in combine harvesters. Agric. Mech. Res. 2020, 42, 1–5. [Google Scholar]
  3. Xu, L.-Z.; Li, Y.; Li, Y.-m.; Chai, X.-Y.; Qiu, X. Research Progress on cleaning technology and device of grain combine harvester. Trans. Chin. Soc. Agric. Mach. 2019, 50, 1–16. [Google Scholar]
  4. Liang, Z.W.; Li, D.P.; Li, J.; Tian, K.P. Effects of fan volute structure on airflow characteristics in rice combine harvesters. Span. J. Agric. Res. 2020, 18, 4. [Google Scholar] [CrossRef]
  5. Zhao, L.; Chen, L.Y.; Yuan, F.; Wang, L. Simulation Study of Rice Cleaning Based on DEM-CFD Coupling Method. Processes 2022, 10, 2. [Google Scholar] [CrossRef]
  6. Wang, J.; Li, J.; Liang, Z.; Hu, X.; Xiong, G. Experimental study on the influence of volute and blade shape on the performance of double-suction multi-wing centrifugal fan. Fan Technol. 2017, 59, 49–53+19. [Google Scholar]
  7. Jin, C.-Q.; Li, Q.-L.; Ni, Y.-L.; Wang, T.-E.; Yin, X. Experiment of Double-outlet multi-duct cleaning operation in wheat combine harvester. Trans. Chin. Soc. Agric. Eng. 2020, 36, 26–34. [Google Scholar]
  8. Wang, H.; Li, Y.-m.; Xu, L.-Z.; Huang, M.-s.; Ma, Z. Analysis and experiment of air flow field in the cleaning unit of a recycled rice combine harvester. Trans. Chin. Soc. Agric. Eng. 2020, 36, 84–92. [Google Scholar]
  9. Leng, J.; Li, X.; Du, Y.; He, S.; Ding, X.; Niu, X. Analysis and Optimization of Internal Flow Field in the cleaning unit of a Single longitudinal axial flow grain combine. Chin. J. Agric. Eng. 2020, 36, 39–48. [Google Scholar]
  10. Jiang, C.; Li, E.; Zhu, X. Analysis of Vortex structure and instability flow Characteristics of centrifugal fans. J. Drain. Irrig. Mach. Eng. 2021, 39, 1125–1131. [Google Scholar]
  11. Li, X.; Du, Y.; Niu, X.; Chi, R.; Mao, E. Structure optimization design and experiment of corn cleaning device. Chin. J. Agric. Mach. 2020, 51, 233–242. [Google Scholar]
  12. Wang, L.; Song, L.; Feng, X.; Queen, S.; Li, Y. Research status and Development analysis of screening devices in grain combine harvesters. Trans. Chin. Soc. Agric. Mach. 2021, 52, 1–17. [Google Scholar]
  13. Geng, D.; Mou, X.; Zhang, G.; Wang, Z.; Zhu, J.; Xu, H. Mechanism Analysis and Optimization Experiment of Wheat Combine cleaning. J. Jilin Univ. 2022, 52, 219–230. [Google Scholar]
  14. Cheng, Q.; Hu, Z.; Zhang, X.; Peng, J. Design of agricultural fan performance test system based on LabVIEW. Agric. Mech. Res. 2008, 6, 119–120+189. [Google Scholar]
  15. Zhou, H. Design and Research of Fan Performance Test System; Chinese Academy of Agricultural Mechanization Sciences: Beijing, China, 2009. [Google Scholar]
  16. Du, Y.; Zhang, L.; Mao, E.; Li, X.; Wang, H. Design and experiment of grain loss monitoring sensor in combine harvester based on EMD. Chin. J. Agric. Mach. 2022, 53, 158–165. [Google Scholar]
  17. Fan, W. Development of Self-Propelled Corn Combine Harvester; Shandong University: Shandong, China, 2011. [Google Scholar]
  18. Cheng, C.; Fu, J.; Chen, Z.; Hao, F.; Cui, S.; Ren, L. Parameter optimization experiment of Corn grain harvester cleaning device. Trans. Chin. Soc. Agric. Mach. 2019, 50, 151–158. [Google Scholar]
  19. Ma, Z.; Li, Y.-m.; Xu, L.-Z. Determination and analysis of floating velocity, friction and infiltration characteristics of rapeseed extractiles. Chin. J. Agric. Eng. 2011, 29, 13–17. [Google Scholar]
  20. Wang, W.; Wang, Y.; Tian, Z.; Wang, P. Design and experimental study of Material suspension velocity test bench. Chin. J. Agric. Mech. 2016, 37, 44–46+78. [Google Scholar]
  21. Wan, X.Y.; Yuan, J.C.; Yang, J.; Liao, Y.T.; Liao, Q.X. Effects of working parameters on the performance of cyclone separator for rapeseed combine harvester based on CFD. Int. J. Agric. Biol. Eng. 2023, 16, 128–135. [Google Scholar] [CrossRef]
  22. Ding, B.C.; Liang, Z.W.; Qi, Y.Q.; Ye, Z.K.; Zhou, J.H. Improving Cleaning Performance of Rice Combine Harvesters by DEM-CFD Coupling Technology. Agriculture 2022, 12, 9. [Google Scholar] [CrossRef]
  23. Liang, Y.Q.; Tang, Z.; Zhang, H.; Li, Y.M.; Ding, Z.; Su, Z. Cross-flow fan on multi-dimensional airflow field of air screen cleaning system for rice grain. Int. J. Agric. Biol. Eng. 2022, 15, 223–235. [Google Scholar] [CrossRef]
  24. Liang, Z.W.; Xu, L.Z.; De Baerdemaeker, J.; Li, Y.M.; Saeys, W. Optimisation of a multi-duct cleaning device for rice combine harvesters utilising CFD and experiments. Biosyst. Eng. 2020, 190, 25–40. [Google Scholar] [CrossRef]
  25. Wu, J.; Tang, Q.; Mu, S.L.; Yang, X.X.; Jiang, L.; Hu, Z.C. Design and Test of Self-Leveling System for Cleaning Screen of GrainCombine Harvester. Agriculture 2023, 13, 2. [Google Scholar] [CrossRef]
  26. Tong, S.; Shen, Q.; Tang, N.; Jia, Y.; Cong, F.; Gu, W. Numerical simulation and optimization experiment of mixed flow field for longitudinal axial flow cleaning device. Trans. Chin. Soc. Agric. Mach. 2016, 47, 135–142. [Google Scholar]
Figure 1. Schematic diagram of the experimental platform of air screen cleaning device. (1). Centrifugal fan. (2). Cleaning room. (3). Hopper. (4). Shaking plate. (5). Fish scale screen. (6). Punching screen. (7). Feeding device. (8). Motor. (9). Four-bar mechanism.
Agriculture 13 01368 g001
Figure 2. Structure diagram of test factors.
Agriculture 13 01368 g002
Figure 3. Schematic diagram of airflow observation plane on screen surface. (a) Location diagram of the observation plane. (b) Distribution diagram of observation points 120 mm above the screen.
Agriculture 13 01368 g003
Figure 4. Velocity vector distribution of airflow field in cleaning room. (a) Distance of air supply 340 mm. (b) Distance of air supply 460 mm. (c) Distance of air supply 580 mm. (d) Distance of air supply 700 mm.
Agriculture 13 01368 g004
Figure 5. Airflow velocity cloud image of the observation plane 120 mm above the fish scale screen inside the cleaning device. (a) Distance of air supply 340 mm. (b) Distance of air supply 460 mm. (c) Distance of air supply 580 mm. (d) Distance of air supply 700 mm.
Agriculture 13 01368 g005
Figure 6. Wind velocity distribution cloud diagram at the outlet of centrifugal fan.
Agriculture 13 01368 g006
Figure 7. Schematic diagram of turbulent flow at the outlet of centrifugal fan.
Agriculture 13 01368 g007
Figure 8. Air velocity cloud image at 120 mm observation plane above fish-scale screen in cleaning room.
Agriculture 13 01368 g008
Figure 9. Airflow field distribution of specific detection plane in cleaning room. (a) 4 blades. (b) 6 blades. (c) 8 blades. (d) 10 blades.
Agriculture 13 01368 g009
Figure 10. Response surface analysis. (a) Airflow velocity in zone A. (b) Airflow velocity in zone B. (c) Airflow velocity in zone C. (d) Airflow velocity deviation degree in zone D.
Agriculture 13 01368 g010
Figure 11. Bench test verification.
Agriculture 13 01368 g011
Table 1. Structure parameters of centrifugal fan.
ParameterValue
Outer diameter of impeller/mm720
Casing width/mm1000
Inlet diameter/mm475
Outlet height/mm252
Spiral volute outer extension dimension/mm108
Distance between impeller end face and shell/mm20
Table 2. Physical characteristics of extruded substance.
Excrete CompositionMoisture ContentVelocity of Suspension/(m·s−1)
Corn kernel25.1%12.2–15.9
Corn stalk57.5%4.5–9.1
Corn-crushed mandrel66.2%6.3–15.5
Light miscellaneous28.3%1.1–3.1
Table 3. Coding table of test factors.
LevelFactor
Distance of Air Supply
a/mm
Speed of Fan
b/r·min−1
Number of Blades
c/Slice
−14609006
05801008
1700110010
Table 4. Design and results of simulation test.
Test NumberDistance of Air Supply
a/mm
Speed of Fan
b/r·min−1
Number of Blades
c/Slice
Zone A Velocity
Y1/m·s−1
Zone B Velocity
Y2/m·s−1
Zone C Velocity
Y3/m·s−1
Zone C Deviation Degree
Y4/%
170010001011.412.111.419.63
27001100811.812.510.221.78
34601000109.611.69.415.96
4460100068.910.38.323.56
5580900109.511.510.613.32
6460110089.411.68.715.63
770090089.910.79.626.47
858011001011.413.512.211.63
9700100061010.69.132.46
105801000810.611.19.915.84
1146090088.610.58.320.88
125801000810.311.510.315.96
1358090068.710.99.523.56
145801000810.311.310.116.23
155801000810.511.410.216.68
16580110061011.910.121.63
175801000810.711.610.417.58
Table 5. Analysis of airflow velocity in front of screen.
IndexSourceSum of SquaresDegree of FreedomMean SquareFp
Airflow velocity in front of screenModel13.6991.5244.27<0.0001 **
A5.4515.45158.48<0.0001 **
B4.3514.3526.65<0.0001 **
C2.3112.3167.27<0.0001 **
Ab0.302510.30258.800.0209 *
a20.242510.24257.060.0326 *
b20.417810.417812.160.0102 *
c20.295710.29578.610.0219 *
Residual error0.240570.0344
Missing fit0.112530.03751.170.4247
Pure error0.128040.0320
Total error13.9316
Air velocity in the middle of the screenModel9.7691.0836.93<0.0001 **
A0.451210.451215.370.0057 **
B4.3514.35148.22<0.0001 **
C3.1213.12106.45<0.0001 **
Bc0.250010.25008.520.0224 *
a20.769510.769526.210.0014 **
b20.584210.584219.900.0029 **
c20.164210.16425.590.0500 *
Residual error0.205570.0294
Missing fit0.057530.01920.51800.6921
Pure error0.148040.0370
Total error9.9616
Airflow velocity behind screen surfaceModel16.0791.7937.53<0.0001 **
A3.9213.9282.40<0.0001 **
B1.2811.2826.910.0013 **
C5.4415.44114.46<0.0001 **
Ac0.360010.36007.570.0285 *
a24.3414.3491.18<0.0001 **
c20.624110.624113.120.0085 **
Residual error0.333070.0476
Missing fit0.185030.06171.670.3099
Pure error0.148040.0370
Total error16.4016
Airflow deviation degree behind screen surfaceModel429.569429.5647.23<0.0001 **
A73.87173.8773.10<0.0001 **
B22.98122.9822.750.0020 **
C206.761206.76204.61<0.0001 **
Ac6.8416.846.770.0354 *
a2107.371107.37106.25<0.0001 **
c28.1918.198.110.0248 *
Residual error7.0771.01
Missing fit5.0831.693.410.1337
Pure error1.9940.4975
Total error436.6316
Note: ** means p ≤ 0.01 (very significant), * means p ≤ 0.05 (more significant).
Table 6. Analysis of airflow velocity on sieve surface.
Test NumberAverage Velocity of Airflow in Front of the SieveAverage Velocity of Airflow in the Middle of the Sieve SurfaceAverage Velocity of Airflow at the Rear of the Sieve SurfaceAirflow Deviation at the Rear of the Sieve SurfaceClearance Loss RateMiscellaneous Rate
110.711.811.213.11.171.23
210.911.911.313.91.121.26
310.811.711.113.51.161.24
Disclaimer/Publisher’s Note: The statements, opinions and data contained in all publications are solely those of the individual author(s) and contributor(s) and not of MDPI and/or the editor(s). MDPI and/or the editor(s) disclaim responsibility for any injury to people or property resulting from any ideas, methods, instructions or products referred to in the content.

