Article

Study on the Livelihood Capital Level, Structural Characteristics, and Coupling Coordination Degree of Chinese Beef Cattle Farmers

Institute of Agricultural Economics and Development, Chinese Academy of Agricultural Sciences, Beijing 100081, China
*
Author to whom correspondence should be addressed.
Agriculture 2023, 13(7), 1371; https://doi.org/10.3390/agriculture13071371
Submission received: 17 May 2023 / Revised: 30 June 2023 / Accepted: 6 July 2023 / Published: 10 July 2023
(This article belongs to the Section Agricultural Economics, Policies and Rural Management)

Abstract

:
An important foundation of a strong agricultural country is the virtuous cycle of the agricultural production system, and the beef cattle industry is the pivotal industry that guarantees the virtuous cycle of China’s agricultural production system. Farmers are the main force of beef cattle breeding in China, and livelihood capital is an important basis for influencing farmers’ breeding decisions. The measurement and evaluation of the livelihood capital of beef cattle farmers in China can help to comprehensively grasp the current level and structural characteristics of the livelihood capital of beef cattle farmers in China. In this study, the entropy value method and Delphi method were used to determine the weights of each evaluation index, and on this basis, the level, structure, and coupling coordination of farmers’ livelihood capital were measured and classified. The study shows that the overall level of livelihood capital of beef cattle farmers is low; the level and structure of livelihood capital show an uneven phenomenon, and the level of livelihood capital of farmers in different regions and different modes differ significantly. The coupling coordination degree among various measurements of livelihood capital of beef cattle farmers in China is also low, which indicates that a good coordination relationship between various types of livelihood capital has not been formed, which may affect the efficiency of resource allocation. It is suggested to improve the livelihood capital level and coupling coordination among beef cattle farmers and improve the livelihood capital structure of farmers by innovating financial tools, developing forage resources, strengthening technical training and extension, and improving policy support for the beef cattle industry.

1. Introduction

The beef cattle industry in China is an industry that has been rapidly emerging since the 1990s. With economic development and rising living standards, the demand for high-quality and safe meat, eggs, and milk is growing rapidly, and the demand for beef is growing strongly. Currently, the beef cattle industry has become an important part of China’s herbivorous livestock industry, an important industry that responds to the new era of ensuring the effective supply of high-quality livestock products for residents, enriching the dietary structure of residents and promoting the income of farmers and herdsmen, and a pivotal industry that guarantees the virtuous cycle of China’s agricultural production system [1,2].
At present, the main force of China’s beef cattle breeding is small-scale beef cattle farmers; according to the data of the China Animal Husbandry and Veterinary Statistics Yearbook, the annual slaughter size of less than 50 head of farmers accounted for 70.54% of the overall proportion. Free-range households are still the main group of beef cattle breeding [3]. China’s basic situation of a large population and small land area per capita determines that the scale of China’s beef cattle industry still has a long way to go. In recent years, the tight balance of domestic beef supply is increasingly prominent; the gap between supply and demand continues to grow, and beef imports continue to increase. At the same time, domestic resource constraints tighten and environmental pressure is increasing [4]. In this context, to protect the sustainable and stable supply of beef, it is necessary to pay attention to the breeding situation of beef cattle farmers. Livelihood capital is an important basis for influencing the production decisions of beef cattle farmers, so the level and structural characteristics of the livelihood capital of beef cattle farmers in China need to be analyzed. It is of great importance to accurately grasp the current livelihood capital status of China’s beef cattle farmers, which is conducive to the formulation of industrial policies to better guide the development of beef cattle breeding to a higher quality.
Based on the above research background, this study constructs a comprehensive evaluation index of the livelihood capital of beef cattle farmers in China from the perspective of livelihood capital, based on the theory of farmers’ behavior, the theory of livelihood capital, and the theory of factor endowment. Through the data obtained from research in the Ningxia Hui Autonomous Region, Sichuan Province, Shandong Province, and Inner Mongolia Autonomous Region, the entropy value method and the expert scoring method are used to construct a comprehensive evaluation index of the livelihood capital of beef cattle farmers in China and analyze the livelihood capital of beef cattle farmers in China from three aspects of level and structure and coupling coordination. The livelihood capital of beef cattle farmers in China was analyzed in three aspects: level, structure, and coupling coordination. These aspects will help in identifying the policies needed to promote the high-quality development of beef cattle breeding and provide an empirical and theoretical reference to ensure the sustainable and healthy development of China’s beef cattle industry.

2. Materials and Methods

2.1. Data Sources

The data used in this study were obtained from the research of the subject group in Ningxia Hui Autonomous Region, Sichuan Province, Shandong Province, and Inner Mongolia Autonomous Region from August to November 2022. Based on the development of the beef cattle industry and beef cattle breeding, 14 counties (cities) in the following regions were selected for this study: Ningxia Hui Autonomous Region—Haiyuan County and Xiji County; Inner Mongolia Autonomous Region—Arukorqin, Balinzuo, and Keshiketeng Banner; Sichuan Province—Gyunlian County, Pingchang County, and Wangcang County; and Shandong Province—Liangshan County, Yuncheng County, and Wudi County. The specific regional distribution of the research sample is shown in Table 1. The beef cattle industry in the surveyed provinces has developed well. In 2021, the beef cattle inventory in the surveyed provinces accounted for 18.2% of the total national inventory, which can better reflect the situation of beef cattle farmers in China and has a certain typicality and representativeness. The research is conducted on-site, and the research subjects are mainly the heads of beef cattle farmers or decision makers. These research subjects are more knowledgeable and familiar with the beef cattle industry and beef cattle breeding, which effectively improves the reliability and validity of the research data. The research area is distributed in the northwest, southwest, central, and northeast beef cattle production areas, which has good representativeness. Based on the representativeness of the main production areas and counties and cities for beef cattle, each county (banner) selects 1–3 townships (towns, Sumu), and each township (town, Sumu) selects 1–2 villages (Gacha). Each village (Gacha) selects sample breeding households according to the breeding scale. A total of 394 valid questionnaires were obtained.

2.2. Livelihood Capital Measurement Index System Construction

The measurement of livelihood capital needs to be realized on the basis of constructing a scientific and reasonable evaluation index system. The construction of livelihood capital measurement indexes first needs to determine the measurement dimensions of livelihood capital, and then select suitable indicators in each measurement dimension. Referring to the sustainable livelihood analysis framework proposed by the UK Department for International Development, livelihood capital can be divided into human capital, physical capital, financial capital, natural capital, and social capital. Considering that beef cattle breeding cycle is long and risky, psychological capital may influence the decision-making behavior of beef cattle breeding; this study adds psychological capital to the above livelihood capital division and rationalizes and expands the livelihood capital division dimensions. The livelihood capital evaluation index system was constructed by selecting measurement indicators from these six dimensions, and the specific measurement indicators and their meanings are shown in Table 2.
(1)
Human capital. Human capital is the sum of education, skills, health, and other abilities possessed by an individual, a kind of capital that can produce and create wealth, which can be improved and increased in value through continuous learning and practice, including both quantitative and qualitative aspects of human capital [5]. Therefore, the selected indicators include five aspects: age of decision makers, education level of decision makers, number of own labor force engaged in beef cattle breeding, training status of cattle production skills, and years of experience in beef cattle breeding.
(2)
Physical capital. Physical capital is the material resources owned by farmers to sustain their livelihoods and is a key element of economic activity [6]. Physical capital plays an important role in beef cattle breeding, providing the necessary resources and equipment to support the continued operation and production of the breeding. The main physical capital of beef cattle farmers includes farmed livestock, owned transportation, owned housing, and productive fixed assets.
(3)
Financial capital. Financial capital refers to capital that is invested and capitalized mainly by means of financial markets, financial instruments, and financial products, and is characterized by high liquidity, high risk, and high returns. The forms of circulation and accumulation of financial capital include stocks, bonds, and financial derivatives. Therefore, the scale of financial assets and access to credit are selected as the measure of financial capital, specifically including the total amount of deposits, funds and other financial products, the status of access to formal credit or loans from relatives and friends, and the purchase of insurance, among other indicators.
(4)
Natural capital. It generally refers to weather, geographical location, natural resources, etc. For most farmers, land resources are the most important natural resources they have [7]. In this section, the area of cultivated land contracted or rented by farmers, the area of pasture contracted or rented, the area of forage plant cultivation, and the geographical location where they are located are selected as the measures of natural capital.
(5)
Social capital. Social capital refers to the social network and various social resources possessed by farmers, reflecting the closeness of social relationships [8]. Therefore, the social work situation, the degree of organization, and the social network possessed by the farmers were selected as the measure of social capital.
(6)
Psychological capital. Psychological capital is the psychological feelings of farmers about their current life, their expectations for their future life, and their psychological tolerance in encountering difficulties and their psychological resilience in solving them [9]. Referring to relevant studies, the attitude to face risks and attitude to industrial prospects were selected as indicators of psychological capital.
Based on the reference to existing studies, the final constructed indicators of farmers’ livelihood capital in this study are shown in Table 2.

2.3. Determination of Indicator Weights for Livelihood Capital

After constructing the livelihood capital evaluation index system, it is necessary to assign weights to each measurement index. Usually, the assignment methods are divided into subjective and objective assignment methods, and the Delphi method in the subjective assignment method is the most used assignment method in the comprehensive evaluation, while the entropy method is the most used assignment method in the objective assignment method for the comprehensive measurement of a certain index. Since both subjective and objective assignment methods have certain limitations, this chapter uses a combination of entropy and Delphi methods to measure the weight of each indicator of livelihood capital with reference to the studies of Xue Bai [10] and Shouhan Li et al. [11].
The entropy method is a common multi-indicator decision-making method used to determine the importance weights of multiple indicators to the decision objectives [12]. In order to enhance the objectivity and rationality of the scoring results, taking into account factors such as affiliation, job nature, professional title, age, etc., experts and practitioners with high expertise in the field of beef cattle industry research were hired for scoring. This study employed a total of 33 experts from the field of beef cattle industry research. When conducting a questionnaire survey, experts combine their knowledge in their professional fields to make judgments on the evaluation indicators in each scoring table and directly score and empower them. The basic idea of this method is based on the concept of information entropy, where the contribution of each indicator is quantified as an entropy value, and this is used as the basis for calculating the weight of each indicator. The size of the entropy value in the assignment indicates the sum of the product of the attribute weights and the attribute entropy value, and a larger entropy value indicates the higher uncertainty of the indicator information, and a smaller entropy value indicates a greater level of information of the indicator, which indicates a greater influence on the decision result. Since different indicators have different measurement units and scales, and the range of values is different, it is necessary to standardize the indicators before calculating the indicator weights, eliminate the influence of scale, and limit the range of values of different indicators to the same range, so that they have the same influence in the weight calculation, thus improving the stability of the model. In this study, the extreme value method is used to standardize the index data.
The normalized treatment formula for positive indicators is
X t i j = X t i j X m i n X m a x X m i n , i = 1 , 2 , 3 n i j = 1 , 2 , 3 m i t = 1 , 2 , 3 T
The formula for normalizing the inverse metrics is
X t i j = X m a x X t i j X m a x X m i n , i = 1 , 2 , 3 n i j = 1 , 2 , 3 m i t = 1 , 2 , 3 T
Among them, X t i j is for beef cattle farmers i of the first j value of the indicator, and the t denotes the period; X t i j is the standardized treatment of the first j value of the indicator, the X m i n is the value of the beef cattle farmer i of the j , the smallest value of the first indicator of the beef farmer, and X m a x is the minimum value of the i of the j , or the maximum value of the first indicator of the beef farmer.
After standardizing the indicators, the entropy value method was used to calculate the weights of each indicator. In the first step, the standardized value is calculated X t i j , with n individual beef cattle farmers’ first j . The ratio of the value of the index is calculated as shown below:
P t i j = X t i j t T i n X t i j
In the second step, we calculate the beef cattle farmer i of the first j . The entropy value of the index is calculated by the formula shown below:
E j = r t = 1 T i = 1 n P t i j ln P t i j
where r = 1 ln T × n , the E j takes values in the range of [0, 1]. The information utility value can be obtained from the entropy value calculation G j , shown below:
G j = 1 E j
The higher the entropy value, the smaller the value of G j , indicating the higher uncertainty of the indicator information, and the smaller the entropy value, the larger the value of G j , indicating the higher information of the indicator.
Finally, the weights of each livelihood capital indicator of beef cattle farmers can be calculated based on the information utility value W j , the formula is as follows:
W j = G j j = 1 m G j
The Delphi method is an expert consultation survey method that aims to reach consensus and evaluate an object by means of circular feedback on expert opinions [13]. The basic process of the Delphi method consists of identifying a panel of experts, i.e., selecting a group of experts in the relevant field who have in-depth knowledge and experience of the object being evaluated. An anonymized survey is conducted in which the experts will be asked to answer a series of questions. These questions are usually divided into multiple rounds, and in each round, the experts can provide further input based on the feedback from the previous round until a consensus or a certain convergence of expert opinions is reached, and the final assignment of evaluation indicators to a given object is determined. Delphi method, as a subjective qualitative method, is widely used in scientific research evaluation.
In this study, an expert questionnaire was designed based on the farmer livelihood capital evaluation index system. Taking into account the age of the experts, the nature of their positions, and their familiarity with the beef cattle industry, experts in the relevant fields of the beef cattle industry as well as practitioners were hired to score the questionnaire. This questionnaire forms an expert scoring table based on six dimensions (guideline level) of farmers’ livelihood capital level and divides 26 secondary indicators into six expert scoring tables according to specific dimensions. This scoring strictly follows the back-to-back principle of Delphi method in the implementation process, and the questionnaire is sent to each expert individually. The experts do not know the information of the people involved in scoring each other, and no horizontal communication occurs between them.
In order to avoid the weighting results relying too much on numerical information or subjective experience, the weight coefficients of the indicators of the livelihood capital of farming subjects calculated in this study based on the entropy method and the expert scoring method are shown in Table 3. From the results of the indicator weights, it can be seen that physical capital has the highest indicator weight of 0.228, followed by human capital with an indicator weight of 0.202, and psychological capital has the lowest indicator weight of 0.083.
In terms of the weight of specific indicators, the largest indicator weight of 0.122 is the valuation of machinery and equipment for beef cattle production held by farmers, followed by the total amount of financial products such as deposits and financial products held by farming subjects, and the weight of this indicator is 0.108. Indicators with smaller weights include the degree of contact with relatives and friends and the number of WeChat groups related to beef cattle breeding or market information in cell phones.

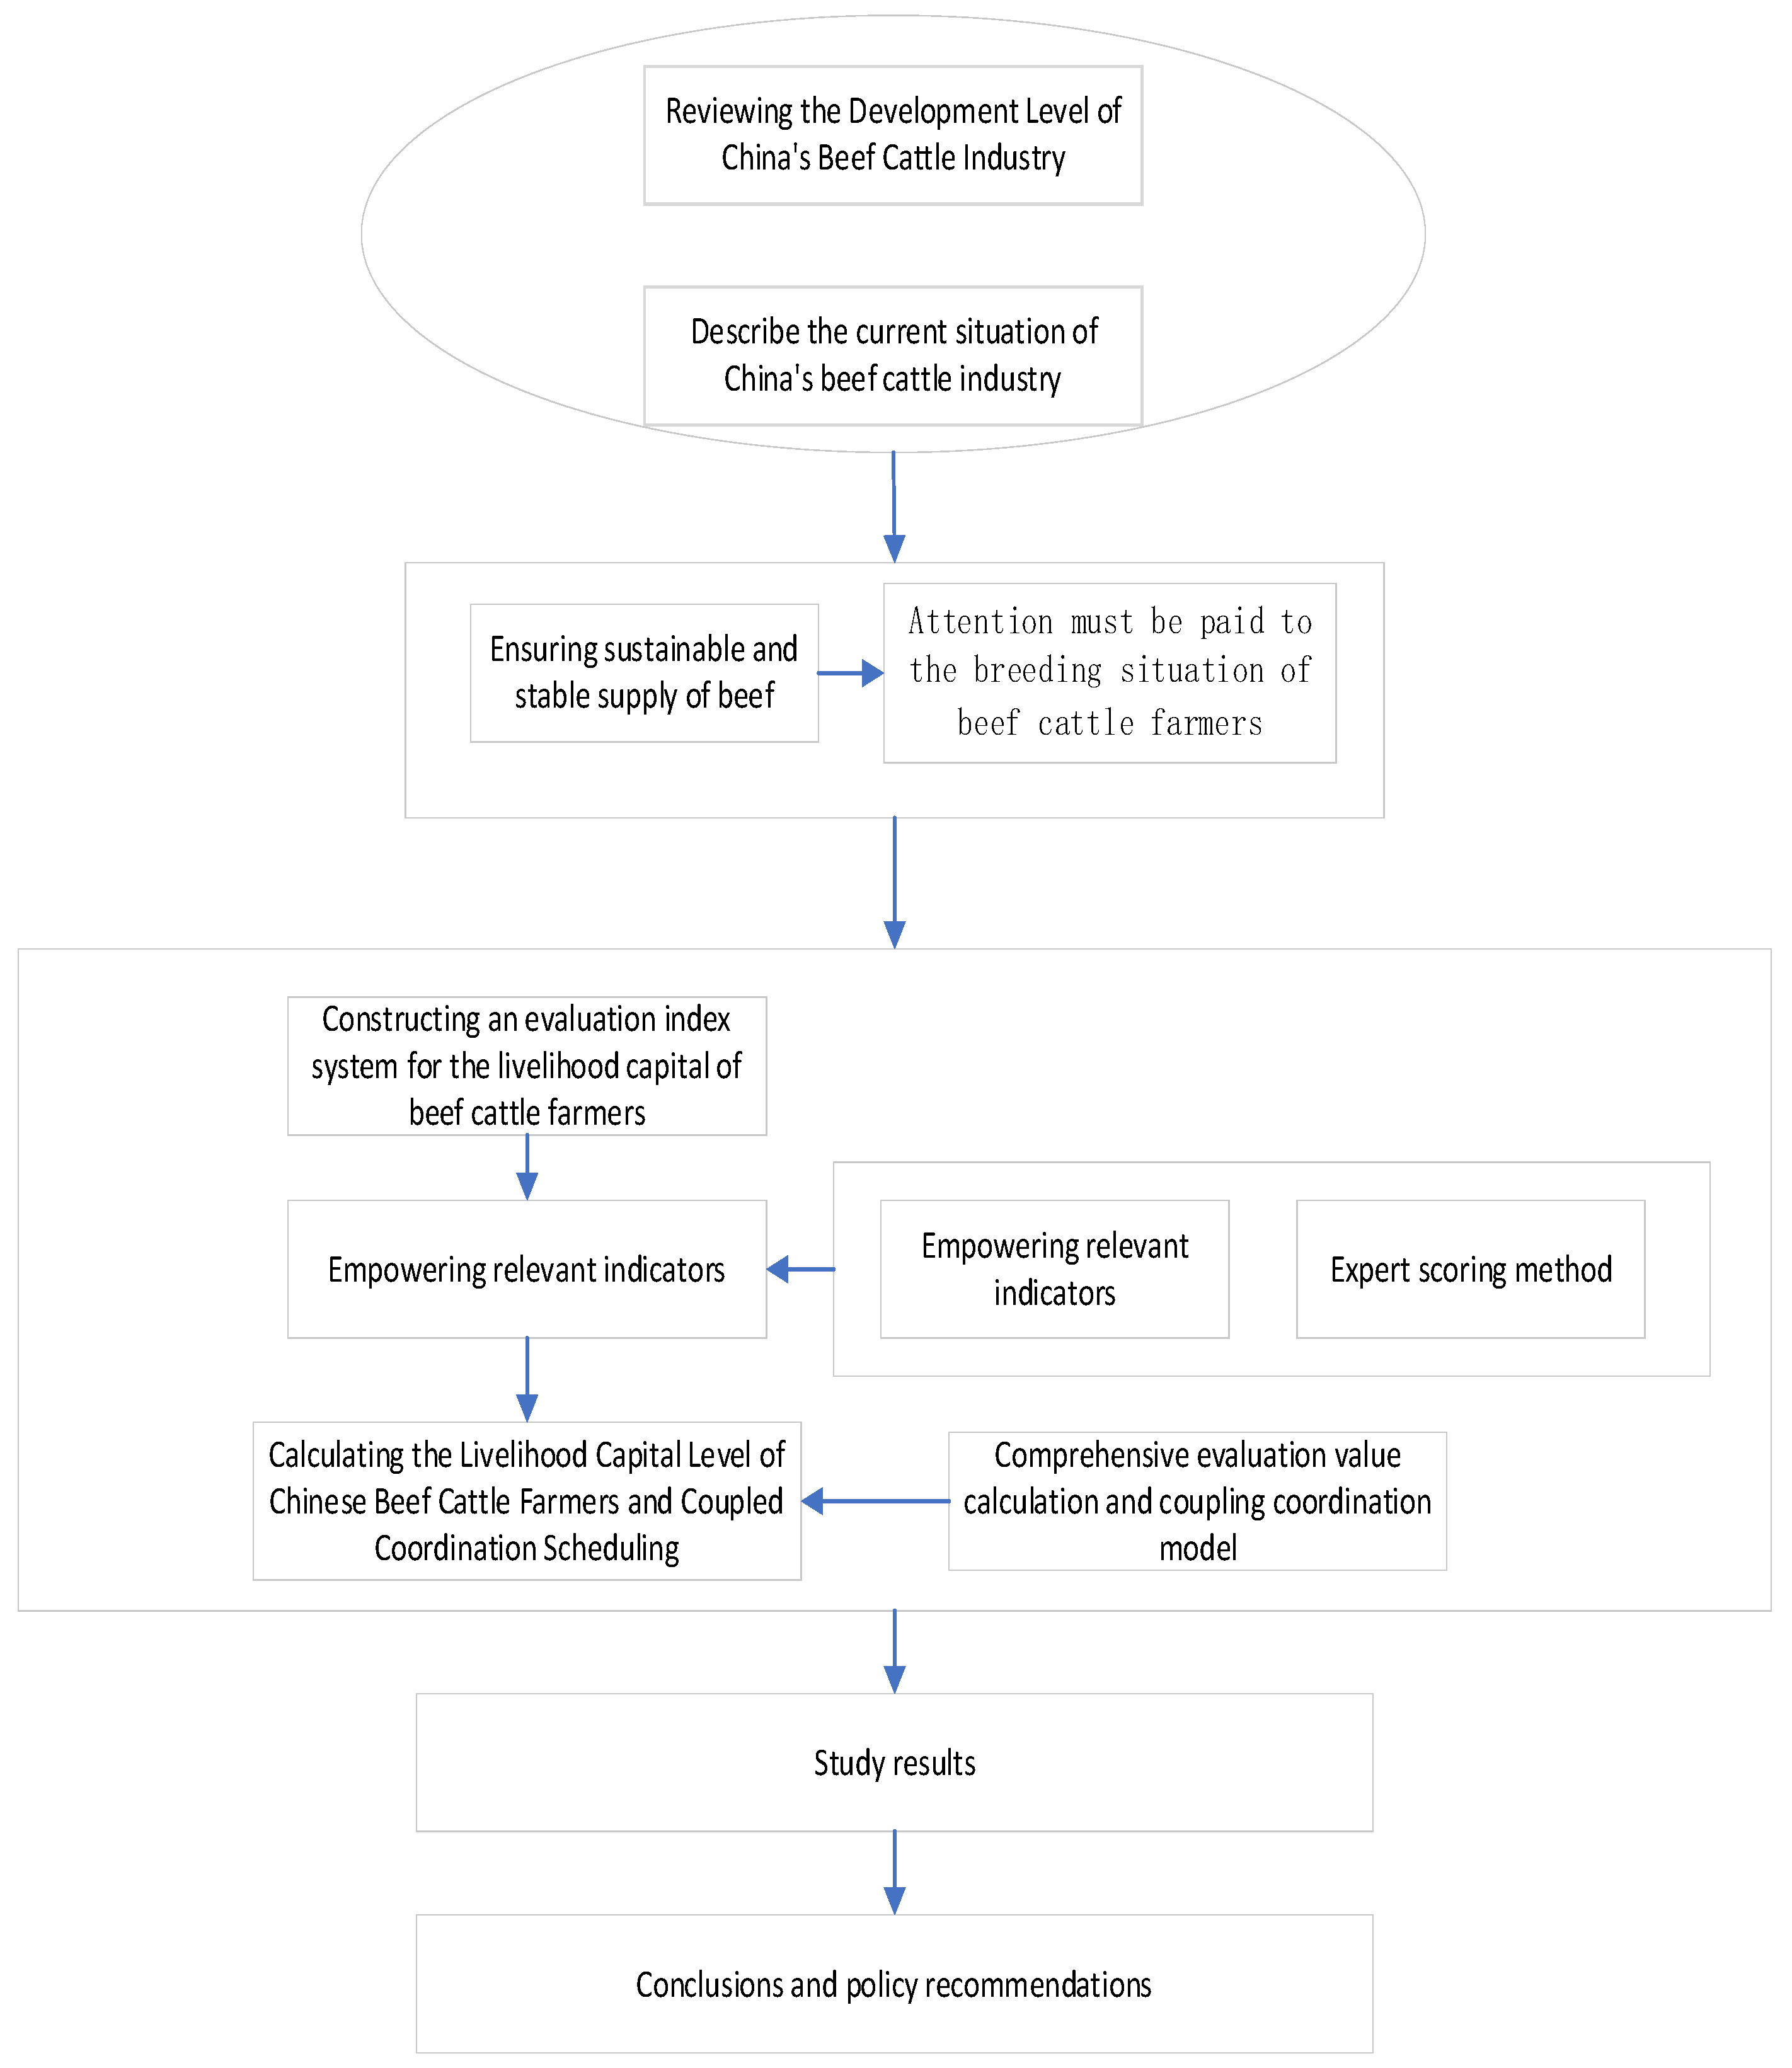
2.4. Technology Roadmap

In order to achieve the research objectives and content of this article, based on reviewing the development and current situation of China’s beef cattle industry, this study first constructs a comprehensive evaluation index system for the livelihood capital of Chinese beef cattle farmers. On this basis, expert scoring and entropy methods are combined to empower the indicators, and the comprehensive evaluation value of the livelihood capital of Chinese beef cattle farmers is calculated. This study systematically analyzes the livelihood capital status of beef cattle farmers in different regions and farming modes and clarifies the current level of livelihood capital of beef cattle farmers in China. Finally, by calculating the coupling and co-scheduling level of Chinese beef cattle farmers, we analyze whether the current livelihood capital structure of Chinese beef cattle farmers is coordinated, and form research conclusions and policy recommendations based on this.
The Technology roadmap of this study is shown in Figure 1.

3. Study Results

3.1. Livelihood Capital Level Characteristics

3.1.1. Characteristics of Livelihood Capital Level of Farmers in Different Production Areas

After assigning weights to the livelihood capital indicators of beef cattle farmers, the livelihood capital level values of farmers need to be calculated by multiplying the standardized values of each livelihood capital value of farmers with their respective corresponding weights, and the calculation formula is shown below:
Z = j = 1 m ( W j × X t i j )
The values of farmers’ livelihood capital levels obtained according to this formula are shown in Table 4. It can be seen that the current overall average value of livelihood capital of beef cattle farmers is 0.2162, and the overall level of livelihood capital is low. In terms of the livelihood capital levels of different production areas, the overall value of the livelihood capital of beef cattle farmers in the northwest production area is the highest, at 0.2486; among them, physical capital (0.0337) and social capital (0.0250) are at the higher level of the four production areas. This is mainly due to the better development of the beef cattle breeding industry in the northwest production area in recent years. Driven by the support of policies, a better breeding atmosphere has been formed locally, and the beef cattle breeding industry has developed rapidly, with a higher degree of organization and mechanization. The comprehensive value of livelihood capital in the Northeast appellation ranks second, at 0.2259; among them, the level values of psychological capital (0.0547) and natural capital (0.0556) are higher and are at a higher level among the four appellations, mainly because the Northeast appellation has a long history of animal husbandry, a better foundation for the development of the beef cattle industry, and has the advantage of grassland resources, with a higher level of natural capital than several other appellations. The comprehensive value of livelihood capital in the Central Plains region ranks third at 0.1970; among them, financial capital (0.0526) is at a higher level among the four production regions, mainly because the overall economic development level of the Central Plains region is higher than that of the other production regions, and farmers have richer financial capital such as deposits and financial products. The integrated value of livelihood capital in the southwest producing area is at a lower level of 0.1893; among them, the levels of natural capital (0.0416) and physical capital (0.0092) are at the lower level of the four producing areas, mainly because Sichuan Province is restricted by geographical location and other factors, which makes it difficult to plant high-quality pasture in patches, difficult to apply mechanical equipment, and there is limited land for breeding, which affects the further development of the beef cattle industry, resulting in the integrated value of livelihood capital being lower than the other three production areas.
In order of the mean value of different types of capital, human capital (0.0608) > natural capital (0.0457) > financial capital (0.0452) > psychological capital (0.0283) > physical capital (0.0186) > social capital (0.0176). It can be seen that the overall level of each livelihood capital of beef cattle farmers in China is currently at a low level, but compared with other capitals, human capital and natural capital are relatively richer, and physical capital and social capital are more scarce.

3.1.2. Characteristics of Livelihood Capital Levels of Farmers in Different Modes

The research sample was divided into four types according to the farming mode, including 112 professional fattening households, 51 professional breeding households, 105 full self-propagation households, and 126 mixed fertilization + breeding households. The calculation results are shown in Table 5. The specific ranking was full self-breeding households (0.2321) > professional fattening households (0.2314) > professional breeding households (0.2024) > mixed fattening + breeding households (0.1950).
Specifically, full self-breeding households involve multiple links such as calf breeding and racking cattle fattening, with long breeding cycles and high labor intensity, which require higher human capital, natural capital, and financial capital, so farmers who choose full self-breeding often need to have a high level of livelihood capital. The higher level of financial capital of professional breeders is mainly due to the relatively strong financing and borrowing ability of farmers with a high level of financial capital, while professional breeders with a short cycle time, low feeding difficulty, low difficulty with scaling and standardizing breeding, and faster capital turnover are more suitable for farmers with higher financial capital. The level of human capital and natural capital of professional breeders is relatively high, mainly because professional breeding of beef cattle is technically difficult and labor-intensive, which requires a high quantity and quality of human capital; at the same time, abundant land and forage crop resources can save the cost of beef cattle breeding and improve the production efficiency of beef cattle, so the level of natural capital of professional breeders is relatively high. The relatively low level of livelihood capital of mixed fattening + breeding households is mainly due to the fact that mixed fattening + breeding households usually have a small farming scale, and the level of livelihood capital of farmers is not sufficient to support the development of professional fattening or breeding models.

3.2. Livelihood Capital Structure Characteristics

3.2.1. Characteristics of the Livelihood Capital Structure of Farmers in Different Production Areas

The structure of livelihood capital varies among beef cattle farmers, in addition to the differences in the level of livelihood capital. The livelihood capital structure of beef cattle farmers can be divided in terms of the strength of capital endowment and also in terms of the different forms of combinations of the dimensions of livelihood capital.
Firstly, it is necessary to explore the strong and weak livelihood capital structure of beef cattle farmers; referring to the study of Tongzhao Zhang et al. [14], the average value of the livelihood capital level of beef cattle farmers was used as the classification criterion, and the capital endowment greater than the average value was classified as a strong-livelihood-capital-type, and the capital endowment below the average value was classified as a weak-livelihood-capital-type. Specifically in this study, when the combined value of the livelihood capital of beef cattle farmers is greater than 0.2162, the farmers are considered to have a strong-livelihood-capital-type structure. By analogy, beef cattle farmers with combined values of human capital, natural capital, physical capital, financial capital, social capital, and psychological capital greater than 0.0608, 0.0457, 0.0186, 0.0452, 0.0176, and 0.0283, respectively, were considered strong-livelihood-capital-type farmers in each dimensional perspective.
As can be seen from Table 6, the current percentage of beef cattle farmers with a weak-livelihood-capital-type is 52.68%, indicating that the livelihood capital of most beef cattle farmers is currently at a low level. In terms of specific livelihood capital types, weak-social-capital-type farmers accounted for the largest percentage at 70.98%, and strong-financial-capital-type farmers accounted for the largest percentage at 63.09%. From different production areas, farmers in the northeast and northwest production areas were dominated by strong livelihood capital, accounting for 61.90% and 68.29% respectively, with a higher percentage of farmers with strong natural capital, strong financial capital, and strong psychological capital in the northeast production area and a higher percentage of farmers with strong physical capital and strong social capital in the northwest production area. Southwest and Central Plains production areas are dominated by weak-livelihood-capital-type farmers, accounting for 65.03% and 64.00%, respectively. Southwest production areas are dominated by weak-capital-type farmers, except for strong financial capital farmers, who account for a higher percentage of strong human capital and strong financial capital farmers in Central Plains production areas.
After exploring the strong and weak structure of livelihood capital factor endowment, it is necessary to analyze the structure of different combinations of livelihood capital. The combined values of the six dimensions of the livelihood capital of beef cattle farmers are ranked, and the livelihood capital with the highest combined value is called the dominant structure. For example, if a beef cattle farmer has the highest combined value of human capital among all dimensions of livelihood capital, it is said to have a dominant structure of human capital, and if the combined value of natural capital is the highest among all dimensions of livelihood capital, it is said to have a dominant structure of natural capital, and so on. The livelihood capital structure of the 394 beef cattle farmers studied was divided according to this criterion, and the distribution of their numbers is shown in Table 7. The four production areas had the highest number of human-capital-dominant-type farmers with 87.07%, followed by natural-capital-dominant-type farmers with 5.36%.

3.2.2. Structural Characteristics of Livelihood Capital Levels of Farmers in Different Modes

The percentages of the strong and weak structures of livelihood capital of professional fattening households, professional breeding households, full self-propagation households, and mixed fertilization + breeding households are shown in Table 8. Except for the strong subsistence capital of 51.36% for the full self-breeding households, the subsistence capital of the sample farmers was generally weak, and the weak subsistence capital of 59.52% was the highest for the mixed fertilization + breeding households. Among the professional breeders, the highest percentage of strong-human-capital-type farmers was 66.67%. The highest percentage of strong-financial-capital-type farmers was 77.27% among professional fattening households, and the highest percentage of strong-psychological-capital-type farmers was 72.94% among full self-breeding households. This indicates that structural differences in the strength and weakness of subsistence capital are related to the mode of farming, and such differences affect the choice of the farming mode of farmers.
The capital structure of farmers with different modes of dominance was analyzed, and the distribution results are shown in Table 9. The largest proportion of human capital accounted for the optimal farming households among the fully self-breeding households, which was 95.29%. Among the professional fattening households, financial capital accounted for the largest share of 13.64%. This reflects that the human capital is more abundant in the whole self-breeding households and the financial capital is more abundant in the professional fattening households. It indicates that there are also large differences between the livelihood capital structures of different types of farmers.

3.3. Livelihood Capital Coupling Coordination Degree

The degree of coupling and coordination of livelihood capital refers to the degree of coordination between different types of livelihood capital owned by beef cattle farmers. Beef cattle farmers need to have multiple types of capital to achieve better livelihoods, and the coordination and balance between these different types of capital also plays an important role in the achievement of livelihood goals. To investigate the degree of coupling and coordination of beef cattle farmers’ livelihood capital, it is helpful to clarify the interaction and coordination among the various livelihood capitals of beef cattle farmers in China, so as to judge whether the livelihood capital structure of farmers is reasonable. To measure the coupling and coordination degree of livelihood capital, we need to analyze the coupling degree of beef cattle farmers’ livelihood capital first.

3.3.1. Coupling Degree Analysis

The coupling degree can be understood as the degree of association or interaction, which refers to the degree of interaction between different elements or different systems. The higher the coupling degree, the higher the degree of association between the elements or systems. The formula for calculating the coupling degree is as follows:
C i t = H i t × P i t × F i t × N i t × S i t × M i t H i t + P i t + F i t + N i t + S i t + M i t 6 6 1 6
In the formula, H i t ,   P i t ,   F i t , N i t ,   S i t , and M i t are respectively the beef cattle farmers i of human, physical, financial, natural, social, and psychological capital combined, respectively. C i t is the coupling degree of livelihood capital for beef cattle farmers i . The livelihood capital coupling degree is shown as 0 C i t 1 .
The coupling degree formula was used to calculate the livelihood capital coupling degree and coupling stage of farmers, as shown in Table 10. From the calculation results, it can be seen that the current livelihood capital coupling degree of beef cattle farmers in China is high, and the proportion of farmers with a livelihood capital coupling degree above 0.5 is 84.26%. Among them, the proportion of farmers whose livelihood capital coupling degree is in the grinding stage is the highest, at 47.46%. This reflects that the livelihood capital of beef cattle farmers is highly coupled, and various types of livelihood capital interact with each other to jointly influence the production decisions of farmers.

3.3.2. Coupling Coordination Degree Analysis

Since the coupling degree reflects only whether the various livelihood capitals of beef cattle farmers are closely related to each other and cannot reflect whether the various livelihood capitals are in a state of coordination, many scholars have introduced the coupling coordination degree model for analyzing the degree of coordination among elements or systems. Specifically in this study, the coupling coordination degree of the livelihood capital of beef cattle farmers reflects whether there is harmony and consistency among the livelihood capital of beef cattle farmers and whether there are shortcomings. The livelihood capital coupling coordination degree of beef cattle farmers can be measured by the livelihood capital coupling degree ( C i t ), and the combined value of livelihood capital ( T i t ) is calculated as follows:
D i t = C i t × T i t
D i t is the beef cattle farmer i of the livelihood capital coupling coordination value, and the t denotes the period, shown as   0 < D i t 1 . Referring to the study of Jing Wang [15], the livelihood capital coupling coordination degree of beef cattle farmers was D i t . The values were divided into the following ten levels: 0 < D i t 0.1 indicates extreme dysfunction;   0.1 < D i t 0.2 indicates severe dysfunction; 0.2 < D i t 0.3 indicates moderate dysfunction; 0.3 < D i t 0.4 indicates mild dysfunction; 0.4 < D i t 0.5 indicates it is on the verge of dissonance; 0.5 < D i t 0.6 indicates it is barely coordinated at times; 0.6 < D i t 0.7 indicates primary coordination at times; 0.7 < D i t 0.8 indicates intermediate coordination at times; 0.8 < D i t 0.9 indicates good coordination; and 0.9 < D i t 1.0 indicates quality coordination.
Using the coupling coordination degree formula, the livelihood capital coupling coordination degree and coupling stage of farmers were calculated, as shown in Table 11. It can be seen that the current livelihood capital coupling coordination degree of beef cattle farmers in China is mostly in the range of severe dysfunction, moderate dysfunction, and mild dysfunction, among which, the proportion of moderate dysfunction farmers is the highest at 47.21%. The low degree of coupled coordination of beef cattle farmers’ livelihood capital indicates that there is no good coordination relationship between various types of livelihood capital, which may affect the efficiency of resource allocation.

4. Discussion

Many scholars have explored related research on livelihood capital. Firstly, in terms of livelihood capital classification, in 1998, Scones proposed dividing livelihood capital into four categories: natural capital, human capital, financial capital, and social capital [16]. Since then, DFID has expanded this classification, adding physical capital and dividing livelihood capital into five categories. The division of livelihood capital by the UK Agency for International Development (DFID) has become the basis for a large amount of subsequent research, with a wide range of impacts. Many domestic scholars analyze the measurement and evaluation of livelihood capital according to the five categories of natural capital, human capital, social capital, financial capital, and physical capital [17,18,19,20]. In addition to the analysis based on five types of livelihood capital, in recent years, some scholars have expanded the classification of livelihood capital, including information capital, cultural capital, and psychological capital into the analysis framework of livelihood capital [21,22,23]. Secondly, measuring livelihood capital helps to understand the current situation and characteristics of farmers’ livelihoods. Before measuring livelihood capital, it is necessary to construct an evaluation index system for livelihood capital. At present, the livelihood capital evaluation index system is very sound. The development of the livelihood capital evaluation index system is to better understand the challenges and opportunities faced by individuals or families in the process of making a living, as well as the abilities they possess. The Sustainable Livelihood Framework Theory of the UK Agency for International Development provides important ideas and guidance for researchers. Livelihood ability, as an important concept, is a comprehensive reflection of the various abilities that an individual or family possesses in the process of making a living. The concept of family development ability proposed by Nguyen (2015) emphasizes the importance of the family as a unit in the process of making a living and believes that family development ability can be improved in multiple ways [24]. Zhang Junhao (2014) further expanded the scope of livelihood ability, including various development aspects such as capital acquisition ability and employment ability, and more comprehensively reflected the essence of livelihood ability [25]. Li Jing and Liao Heping (2018) designed targeted livelihood capital evaluation indicators through natural resources, social resources, and other aspects, evaluating the various capital possessed by individuals or families in the process of making a living from different perspectives [26]. The development of the livelihood capital indicator system is inseparable from the continuous exploration of researchers.
However, current studies on the influence of livelihood capital on farming decisions have less often analyzed livelihood capital as a whole. Basically, it is carried out within the framework of sustainable livelihoods. Based on the framework of sustainable livelihoods, Siqin Chaoketu (2017) conducted a study on the livelihood assets and livelihood methods of farmers in the semi-agricultural and semi-pastoral areas of Inner Mongolia [27]. The research by Meng Jijun (2012) and Guo Xiuli et al. (2017) pointed out that there are differences in the allocation of various kinds of livelihood capital for farmers under the sustainable livelihood framework, resulting in the inability of farmers to achieve a better level of capital allocation [28,29]. Therefore, specific measures to optimize livelihood strategies are proposed [30]. Xie Xianxiong et al. (2019) conducted field research on herdsmen in Inner Mongolia and used a binary logistic model to empirically analyze the overall impact of livelihood capital and various dimensions on herdsmen’s willingness to reduce livestock [31].
Most of the existing literature has been studied from the perspective of one dimension of livelihood capital or factors related to livelihood capital, without exploring its impact on farming decisions as a whole. Livelihood capital includes a combination of natural, human, social, financial, and physical resources and actions, and each component or even each factor affects farming decisions. The quantity and quality of a farmer’s subsistence capital affects his or her ability to survive and thrive, and farmers with more “quantity” and better “quality” subsistence capital will have more diversity in their decision making. Different types of livelihood capital have different degrees of influence on livestock breeding decisions. Therefore, it is necessary to analyze the impact of livelihood capital as a whole in terms of its level, structure, and degree of coordination on farming decisions.
Existing studies have explored the livelihood capital of beef cattle farmers almost in a gap, with a single research content. The development of behavioral economics has been very fruitful in terms of research results, and research on farm household behavior has been fruitful. However, the existing studies, from the industrial perspective, mainly focus on the plantation industry and analyze the livelihood response of farmers. The analysis of the farming industry has mainly focused on studies of hog farming scale decisions. Few studies in the literature focus on beef cattle farming behavior. Obviously, the livelihood capital possessed by farmers, as micro-operating subjects of the economic activities of beef cattle farming, is closely related to the farming decisions they make, and there are significant differences in the livelihood capital of different farmers, so the way to enhance their farming motivation and guide their farming decisions has certain specificity. However, at present, neither government departments nor academic research fields have analyzed in depth the horizontal structural characteristics and coupling coordination of the human, natural, material, financial, social, and psychological livelihood capital of beef cattle farmers, nor have they rationalized the management ideas to promote the high-quality development of beef cattle industry.
This study measures the livelihood capital level and coupling coordination degree of Chinese beef cattle farmers, which better demonstrates the current capital situation of Chinese beef cattle farmers and helps to formulate relevant policies based on their livelihood situation. However, due to limited research time and sample size, this study still has certain shortcomings. Currently, only the livelihood capital situation of beef cattle farmers has been described and analyzed. The relationship between farmers’ livelihood capital and production decisions has not yet been explored, which is also a topic that needs further exploration in future research

5. Conclusions and Recommendations

5.1. Conclusions

By measuring the livelihood capital level, livelihood capital structure, and livelihood capital coupling coordination of beef cattle farmers in the research areas of Shandong, Inner Mongolia, Ningxia, and Sichuan, and conducting specific analyses from the perspective of comparing different regions and different farming models, the following conclusions were drawn by combining longitudinal and cross-sectional comparisons:
(1)
At present, the overall level of livelihood capital of beef cattle farmers in China is low, and among various types of livelihood capital, human capital and natural capital are relatively abundant, while physical capital and social capital are relatively scarce. The level of livelihood capital of cattle farmers varies significantly among different regions and different modes. The livelihood capital of beef cattle farmers in the Northwest region has the highest integrated value, and its physical and social capital is at a higher level among the four production regions. In the southwestern region, due to the constraints of the natural conditions and the degree of development of the beef cattle industry, the comprehensive value of the livelihood capital of beef cattle farmers is relatively low. Among the four breeding modes, the comprehensive value of livelihood capital is the highest for full self-breeding households and the lowest for mixed fattening + breeding households, in the following order: full self-breeding households > professional fattening households > professional breeding households > fattening + breeding households.
(2)
At present, the percentage of weak-subsistence-capital-type farmers among beef cattle farmers is 52.68%, indicating that the subsistence capital of most beef cattle farmers is at a low level. The largest percentage of weak-social-capital-type farmers is 70.98%, which laterally reflects that the current beef cattle industry in China is less organized and does not form a better social network of beef cattle industry farmers. Farmers in the northeast and northwest producing areas are dominated by strong subsistence capital, while those in the southwest and central plains producing areas are dominated by weak subsistence capital. Among the four breeding modes, the percentage of strong-subsistence-capital-type farmers in the whole self-propagation and self-breeding households is 51.36%, and the subsistence capital of farmers in other modes is weak-capital-type in general, and the percentage of weak subsistence capital of mixed breeding + breeding households is the highest, at 59.52%.
(3)
At present, the coupling degree of livelihood capital of beef cattle farmers in China is at a high level, which indicates that the livelihood capitals of beef cattle farmers are related to each other to a high degree, and various types of livelihood capital interact with each other to jointly influence the production decisions of beef cattle farmers. However, the coupling coordination degree among various livelihood capitals of beef cattle farmers is low, which indicates that there is no good coordination relationship among various livelihood capitals, which may affect the efficiency of resource allocation.

5.2. Policy Recommendations

(1)
Innovative financial tools to increase the financial support for beef cattle breeding
Beef cattle farming requires a large one-time investment and a slow payback of the investment. Under the normal financial environment, farmers with higher loan amounts are constrained by the pressure of repayment and usually choose other industries with faster capital recovery. This reveals the need for innovative financial tools to provide flexible and diverse financial support for farmers’ breeding, which in turn improves the financial capital of farmers. For example, the establishment of special loans for beef cattle breeding, the purpose of the loan is only for the purchase of beef cattle by farmers, and unlike traditional loans, the repayment period can match the production cycle of beef cattle, reducing the pressure of borrowing for farmers. Alternatively, meat cattle pledge loans can be developed, where farmers can pledge their meat cattle to financial institutions to obtain a certain amount of a loan. It is also possible to help farmers reduce risks and financial losses by developing beef cattle breeding insurance products that provide insurance against diseases and accidental losses. In addition, financial support for beef cattle breeding can also be provided through financial leasing, where farmers can lease beef cattle, breeding equipment, etc., to carry out breeding. These innovative financial tools can provide farmers with more flexible and diversified financial support to help them better carry out their farming business and improve their financial capital.
(2)
Multi-way development of various types of forage resources to enhance the forage security capacity of beef cattle breeding
Beef cattle breeding requires a certain amount of natural capital as a prerequisite. At present, the most important part of natural capital affecting beef cattle breeding is forage resources. In view of the limited land resources in China at present, under the background of giving priority to guaranteeing land for grain cultivation, the area of planting fodder crops cannot be increased significantly, and only through multiple ways to develop forage resources and improve forage security capacity can the natural capital of farmers be effectively improved. First, the productivity of existing grassland resources should be improved, and appropriate management measures, such as reasonable irrigation, fertilization, and replanting improvement, should be taken to improve the productivity of grassland and increase its grass production. Second, to develop new grassland resources, for resources such as wasteland, swamp, and winter fields to be reclaimed, improved, developed, and utilized, and also to increase the supply of grassland resources by means such as planting grass under the forest and raising cattle. Third, agricultural by-products, farm straw, and other resources should be properly processed and used as feed to reduce waste and improve resource utilization efficiency. Fourth, farmers should be encouraged and supported to adopt advanced green breeding techniques, such as ecological recycling breeding, to reduce pollution emissions and guarantee the sustainable use of natural capital, and actively guide the planting of grass for cattle breeding to realize the combination of breeding within the main body of breeding or in the region.
(3)
Emphasize the cultivation and maintenance of social capital and improve farmers’ knowledge of farming technology
Social capital includes various relationship networks, trust, cooperation, and other resources formed in society. In the process of technology dissemination, social capital can promote trust and cooperation among people, accelerate knowledge sharing, and integrate various resources for better promotion and application of technology, so it is important to focus on the cultivation and maintenance of farmers’ social capital. On the one hand, farmers, beef cattle enterprises, and other related institutions can be encouraged to form nongovernmental, nonprofit organizations, which can provide support and guidance for beef cattle production and operation and promote the healthy development of the industry through activities such as technical training, information exchange, market promotion, and policy advocacy. At the same time, they can also provide feedback to government departments, participate in the formulation of relevant policies and standards, and safeguard the legitimate rights and interests of the beef cattle industry. On the other hand, the stability of the comprehensive benefits of beef cattle breeding and the effectiveness and merits of beef cattle breeding-related technologies should be vigorously publicized by making full use of the media such as rural radio, television, and the Internet to form a favorable public opinion atmosphere among the breeder community. The government can provide financial support in the form of subsidies for farmers to learn the technology related to beef cattle breeding so that more farmers can enter vocational colleges for systematic study, which not only helps to improve the technical level of farmers and the adoption rate of breeding technology but also helps to increase rural employment opportunities and improve the quality of life of rural residents.
(4)
Strengthen the guidance and training of the main technology of beef cattle breeding and improve the level of human capital of farmers
The adoption of the scientific concept of beef cattle breeding and related technologies is conducive to farmers improving the efficiency of beef cattle production, reducing the risk of losses in beef cattle breeding, and ultimately contributing to the stable development of beef cattle breeding. At present, China’s agricultural technology extension service system needs to be further improved, and the lack of manpower and funds in the grassroots technology extension department has become the “last mile” that restricts agricultural technology on the ground. It is recommended to integrate financial resources from various channels to support the technical extension department to carry out the extension work smoothly and to guarantee the scientific concept of beef cattle breeding and related technology publicity funds and demonstration base construction funds. Secondly, the quality of agricultural extension personnel should be improved so that they can effectively guide the farmers to achieve the effect of maximizing technical efficiency by using technology related to beef cattle breeding. At the same time, in order to ensure that farmers can receive adequate support and assistance in adopting beef cattle breeding-related technologies, the quality of the post-tracking service of technical promotion needs to be improved. In terms of technology promotion means, modern technology means should be fully utilized; for example, a technology promotion online platform can be developed through the utilization of media such as WeChat and short videos. Finally, the important role of enterprises and research institutions in technology promotion should also be brought into play. Through the government’s purchase of services, relevant experts from enterprises and scientific research institutions can be hired to guide and demonstrate the technology related to beef cattle breeding, so that farmers can actually feel the effect and role of the technology related to beef cattle breeding.

Author Contributions

Conceptualization, M.W. and X.L.; methodology, X.L.; software, X.L.; validation, X.L. and M.W.; formal analysis, X.L.; investigation, X.L. and M.W.; resources, X.L. and M.W.; data curation, X.L. and M.W.; writing—original draft preparation, X.L.; writing, review, and editing, X.L. and M.W.; visualization, X.L.; supervision, M.W.; project administration, M.W.; funding acquisition, M.W. All authors have read and agreed to the published version of the manuscript.

Funding

We gratefully acknowledge the funding support from the Key projects of the National Natural Science Foundation of China (72033009) and the Scientific and Technological Innovation Project of the Chinese Academy of Agricultural Sciences (ASTIP-IAED-2023-01).

Institutional Review Board Statement

Not applicable.

Informed Consent Statement

Informed consent was obtained from all subjects involved in the study.

Data Availability Statement

The data presented in this study are available within the article.

Conflicts of Interest

The authors declare no conflict of interest.

References

  1. Wang, M. The development of China’s animal husbandry industry in the forty years of reform and opening up:achievements, experiences and future trends. Agric. Econ. Issues 2018, 8, 60–70. [Google Scholar] [CrossRef]
  2. Ma, X.; Wang, M. Comparison of economic efficiency of beef cattle production in typical countries and the inspiration for China. J. Northwest Agric. For. Univ. Sci. Technol. (Soc. Sci. Ed.) 2023, 23, 138–152. [Google Scholar] [CrossRef]
  3. Wang, M. Development Situation of Beef Cattle Industry in 2022 and Prospects for 2023. China Livest. Poult. Seed Ind. 2023, 19, 41–45. [Google Scholar]
  4. Gao, H.; Wang, M. Research on the Cost Benefit and International Competitiveness of Chinese Beef Cattle Production. Price Theory Pract. 2018, 405, 75–78. [Google Scholar] [CrossRef]
  5. He, Y. Study on the Mechanism of Livelihood Capital’s Impact on the Sustainable Livelihood Capacity of Farming Households out of Poverty in Yunnan. Ph.D. Thesis, Kunming University of Science and Technology, Kunming, China, 2021. [Google Scholar] [CrossRef]
  6. Wang, X. Research on Farmers’ Livelihood Capital, Agricultural Land Transfer and Economic Performance. Ph.D. Thesis, Nanjing Agricultural University, Nanjing, China, 2020. [Google Scholar] [CrossRef]
  7. Liu, K.; Qi, Z.; Huang, W.; Ye, S. Research on the influence of capital endowment heterogeneity on farmers’ ecological production behavior--analysis based on the dual perspective of level and structure. China Popul.-Resour. Environ. 2019, 29, 87–96. [Google Scholar] [CrossRef]
  8. Wu, X.; Jin, H. A study on changes in livelihood strategies and influencing factors of farm households from the perspective of livelihood capital—Based on CFPS four period tracking data. Agric. Mod. Res. 2021, 42, 941–952. [Google Scholar] [CrossRef]
  9. Hu, C. Research on Rural Land Transfer in Three Gorges Reservoir Area Based on the Perspective of Farmers’ Livelihoods. Ph.D. Thesis, China University of Mining and Technology, Xuzhou, China, 2016. [Google Scholar]
  10. Bai, X. Research on the Evaluation of Ecological Governance Policy Effects from the Perspective of Farmers. Ph.D. Thesis, Lanzhou University, Lanzhou, China, 2019. [Google Scholar]
  11. Li, S.; Yang, P.; Lu, D. Research on the evaluation index system of high-quality agricultural development—A comparative analysis based on three provinces of Lu, Su and Zhejiang. China Agric. Resour. Zoning 2023, 44, 66–74. [Google Scholar]
  12. Cheng, Z.; Peng, Y. Comprehensive evaluation of ecological civilization in Henan Province—Based on entropy value method and coupled coordination degree model. J. Yunnan Agric. Univ. 2023, 17, 135–141. [Google Scholar]
  13. Wang, J.; Zhang, J. A comparison of several methods for determining weight vectors in comprehensive evaluation. Hebei Univ. Technol. 2001, 2, 52–57. [Google Scholar]
  14. Zhang, T.; Yan, T.; He, K.; Zhang, J. The impact of capital endowment on farmers’ willingness to invest in green production—A case study of straw returning to farmland. China Popul.-Resour. Environ. 2017, 27, 78–89. [Google Scholar]
  15. Wang, J.; Lv, X.; Lv, K. A study on the impact of digital financial use on livelihood diversification of farm households. Rural. Econ. 2021, 8, 62–71. [Google Scholar]
  16. Scoones, I. Sustainable Rural Livelihoods: A Framework for Analysis; IDS Working Paper 72; IDS: Brighton, UK, 1998. [Google Scholar]
  17. Hu, Z. Research on Sustainable Development of Ecologically Fragile Areas from the Perspective of Livelihood Capital. Ph.D. Thesis, Fujian Normal University, Fuzhou, China, 2014. [Google Scholar]
  18. Chen, S. Empirical Study on Poverty Alleviation Policy of Resettlement under Sustainable Livelihoods of Farmers. Ph.D. Thesis, Jiangxi University of Finance and Economics, Nanchang, China, 2017. [Google Scholar]
  19. Yuan, L. Research on the Impact of Ecological Compensation Policies and Livelihood Capital on Sustainable Livelihoods. Ph.D. Thesis, Northwest A&F University, Xi’an, China, 2018. [Google Scholar]
  20. Wang, W. A Study on Land Transfer Behavior and Regional Differences from the Perspective of Rural Residential Environment and Farmers’ Livelihood Capital. Ph.D. Thesis, China University of Geosciences, Wuhan, China, 2022. [Google Scholar] [CrossRef]
  21. Odero, K. Information capital: 6th asset of sustainable livelihood framework. Discov. Innov. 2006, 18, 91. [Google Scholar] [CrossRef]
  22. Li, G.; Qiu, D.; Wang, L.; Wang, P.; Luo, D. The impact of differences in livelihood assets on the selection of compensation models for farmers’ cultivated land protection: An empirical analysis of sample villages in different mountainous and hilly areas of western Chongqing. J. Geogr. 2012, 67, 504–515. [Google Scholar]
  23. Huang, Z.; Chen, X. Analysis of the Impact of Livelihood Capital on Farmers’ Resettlement Satisfaction -- Taking Southern Shaanxi as an Example. Resour. Environ. Arid Areas 2018, 32, 47–52. [Google Scholar] [CrossRef]
  24. Nguyen, L.; Buehler, D. Rural livelihoods and environmental resource dependence in Cambodia. Ecol. Econ. 2015, 120, 282–295. [Google Scholar] [CrossRef]
  25. Zhang, J.; He, J. Capacity Reconstruction: A Paradigm of Sustainable Livelihood and Its Theoretical Construction. Hubei Soc. Sci. 2014, 9, 41–47. [Google Scholar] [CrossRef]
  26. Li, J.; Liao, H. The Relationship between the Livelihood Ability of Regional Poor Farmers and the Ecological Environment: A Case Study of 16 Districts and Counties in Chongqing. China Agric. Resour. Reg. 2018, 39, 175–182. [Google Scholar]
  27. Si, Q.C.; Fang, Y.; Wang, H.; Xu, K. A Study on the Livelihood Assets and Livelihoods of Farmers in the Half Agriculture and Half Pastoral Areas of Inner Mongolia: Taking Gacha, Shuangyushu, Keyou Middle Banner as an Example. Geogr. Sci. 2017, 37, 1095–1103. [Google Scholar] [CrossRef]
  28. Meng, J.; Ai, M.; Liu, Y.; Xiang, Y. Research on the relationship between sustainable livelihood assets and livelihood strategies of farmers and herdsmen—Taking Uxin Banner, Ordos City City as an example. J. Peking Univ. (Nat. Sci. Ed.) 2013, 49, 321–328. [Google Scholar] [CrossRef]
  29. Guo, X.; Zhou, L.; Chen, Y.; Zhao, M. Research on the relationship between farmers’ livelihood capital and livelihood strategies under the effect of ecological policies—Taking Hanggin Banner, Inner Mongolia as an example. China’s Agric. Resour. Reg. 2018, 39, 34–41. [Google Scholar]
  30. Hua, J.; Tian, Y. The impact of livelihood capital on livestock breeding scale decisions of herdsmen—Taking Xilingol League in Inner Mongolia as an example. Feed Expo 2021, 4, 42–48. [Google Scholar]
  31. Xie, X.; Zhao, M.; Cai, Y. Analysis of the Impact of Livelihood Capital on the Willingness of Herders to Reduce Livestock: A Micro Empirical Study of 372 Herders in Inner Mongolia. Resour. Environ. Arid Areas 2019, 33, 55–62. [Google Scholar]
Figure 1. Technology roadmap.
Agriculture 13 01371 g001
Table 1. Regional distribution of the research sample.
Production AreaRepresentative ProvincesRepresenting Counties (Districts and Cities)Sample Size
Northwest RegionNingxia Hui Autonomous RegionHaiyuan County, Xiji County130
Southwest RegionSichuan ProvinceYunlian County, Pingchang County, Weiyuan County, Yilong County, Zhongjiang County117
Midland RegionShandong ProvinceLiangshan County, Yuncheng County, Wudi County, Yangxin County86
Northeast RegionInner Mongolia Autonomous RegionAruqorqin Banner, Balinzuo Banner, Keshiketeng Banner61
Table 2. Biometric capital indicator settings.
Types of Livelihood CapitalSpecific Measurement IndicatorsIndicator Meaning (Unit)Average ValueStandard Deviation
Human CapitalAge of decision makersAge of primary decision maker (weeks)46.448.26
Education level of decision makersEducation level of decision makers
1 = No formal education 2 = Elementary school 3 = Junior high school 4 = High school 5 = University 6 = Graduate and above
2.961.04
Workforce TrainingAverage number of beef cattle breeding-related training attended per year2.181.89
Number of laborersNumber of own labor force engaged in beef cattle breeding (people)2.050.81
Farming experienceYears in beef cattle breeding9.235.85
Physical CapitalNumber of livestockYear-end stock of livestock (head)44.8437.68
TransportationValue of transportation owned (million yuan)10.8212.37
HousingHousehold housing area per capita (m2)37.2815.22
Productive fixed assetsValue of machinery held for beef cattle production (million yuan)13.3635.90
Value of barn, silage cellar (million yuan)12.2713.25
Financial CapitalFinancial AssetsTotal amount of financial products such as deposits and financial products held (million yuan)38.5444.31
Financing CapacityDifficulty in borrowing from friends, relatives, or financial institutions
1 = very difficult 2 = more difficult 3 = average 4 = easy 5 = very easy
2.691.21
InsuranceWhether to purchase insurance related to beef cattle or beef cattle breeding
1 = yes 0 = no
0.320.47
Natural CapitalLand ResourcesContracted and leased arable land area (mu)37.3173.89
Contracted and leased pasture area (mu)112.63391.13
Forage resourcesForage crop cultivation area (mu) (excluding natural pasture area)22.7757.90
LocationDistance from live animal trading market (km)19.1739.96
Social CapitalSocial WorkWhether anyone in the family is a village-level or above cadre (including village-level cadres)
1 = yes 0 = no
0.030.17
Is someone in the family acting as a veterinarian
1 = yes 0 = no
0.030.18
Degree of organizationWhether a member of the farmers’ cooperative/association
1 = yes 0 = no
0.060.23
Social NetworksThe number of WeChat contacts in the phone337.29355.38
Number of WeChat groups related to beef cattle breeding or market information in cell phones6.394.73
The degree of contact with relatives and friends
1 = rarely 2 = less often 3 = generally 4 = more often 5 = very often
3.321.08
The degree of communication with the same type of farms (households)
1 = rarely 2 = less often 3 = generally 4 = more often 5 = very often
3.031.37
Psychological CapitalRisk attitudeAttitude towards possible risks in the breeding process
1 = Cautious risk appetite 2 = Stable risk appetite 3 = Balanced risk appetite 4 = Advanced risk bias 5 = Aggressive risk appetite
3.441.08
Attitude towards the industry’s futureAttitude towards the development prospect of the industry
1 = Very unpromising 2 = Less optimistic 3 = Generally 4 = More optimistic 5 = Very optimistic
2.371.01
Table 3. Livelihood capital indicator weights.
Types of Livelihood CapitalIndicator WeightsSpecific IndicatorsIndicator Weights
Human Capital0.202Age of primary decision maker (weeks)0.053
Education level of decision makers0.055
Average number of beef cattle breeding-related training attended per year0.028
Number of own labor force engaged in beef cattle breeding (people)0.026
Years in beef cattle breeding0.040
Physical Capital0.228Year-end stock of livestock0.054
Value of transportation owned (million yuan)0.019
Household housing area per capita (m2)0.01
Value of machinery held for beef cattle production (million yuan)0.122
Value of barn, silage cellar (million yuan)0.023
Financial Capital0.184Total amount of financial products such as deposits and financial products held (million yuan)0.108
Difficulty in borrowing from family, friends, or financial institutions0.04
Whether to purchase insurance related to beef cattle or beef cattle breeding0.036
Natural Capital0.173Contracted and leased arable land area (mu)0.047
0.173Contracted and leased pasture area (mu)0.042
Forage crop cultivation area (mu) (excluding natural pasture area)0.042
Distance from live animal trading market (km)0.043
Social Capital0.130Whether anyone in the family is a village-level or above cadre (including village-level cadres)0.024
Is there a veterinarian in the house0.013
Whether a member of the farmers’ cooperative/association0.055
The number of WeChat contacts in the phone0.011
Number of WeChat groups related to beef cattle breeding or market information in cell phones0.007
The degree of contact with relatives and friends0.006
The degree of communication with the same type of farms (households)0.014
Psychological Capital0.083The attitude towards possible risks in the breeding process is0.031
Attitude towards the development prospect of the industry0.052
Table 4. Livelihood capital level values.
Capital TypeNortheast RegionNorthwest RegionMidland RegionSouthwest RegionOverall Mean Value
Combined value of livelihood capital0.22590.24860.19700.18930.2162
Human Capital0.03000.07220.04930.07270.0608
Physical Capital0.01620.03370.01030.00920.0186
Financial Capital0.04470.04530.05260.03990.0452
Social Capital0.02470.02500.01240.00950.0176
Psychological Capital0.05470.03110.02160.01630.0283
Natural Capital0.05560.04140.05070.04160.0457
Table 5. Values of livelihood capital levels for different farming patterns.
Capital TypeProfessional FatteningProfessional BreedersFull Self-Breeding and Self-Rearing HouseholdsFattening + Breeding Mixed BreedingOverall Mean Value
Combined value of livelihood capital0.23140.20240.23210.19500.2162
Human Capital0.06520.02350.06410.06930.0608
Physical Capital0.02250.01970.02380.01040.0186
Financial Capital0.06090.04160.04250.03490.0452
Natural Capital0.04450.05560.04700.04170.0457
Social Capital0.01810.01960.01970.01460.0176
Psychological Capital0.02030.04230.03500.02420.0283
Table 6. Distribution of strengths and weaknesses of livelihood capital in different production areas.
Types of Livelihood Capital Sample OverallNortheast RegionNorthwest RegionSouthwest RegionMidland Region
Livelihood CapitalStrong47.32%61.90%68.29%34.97%36.00%
weak52.68%38.10%31.71%65.03%64.00%
Human CapitalStrong40.69%35.71%43.36%31.71%52.00%
weak59.31%64.29%56.64%68.29%48.00%
Natural CapitalStrong32.49%76.19%23.08%21.95%40.00%
weak67.51%23.81%76.92%78.05%60.00%
Physical CapitalStrong39.75%47.62%56.10%30.77%30.00%
weak60.25%52.38%43.90%69.23%70.00%
Social CapitalStrong29.02%19.05%46.34%24.48%32.00%
weak70.98%80.95%53.66%75.52%68.00%
Financial CapitalStrong63.09%71.43%70.73%56.00%58.74%
weak36.91%28.57%29.27%44.00%41.26%
Psychological CapitalStrong56.78%88.10%75.61%46.85%28.00%
weak43.22%11.90%24.39%53.15%72.00%
Table 7. Distribution of heterogeneity of livelihood capital structure in different production areas.
Types of Livelihood CapitalSample OverallNortheast RegionNorthwest RegionSouthwest RegionMidland Region
Human-capital-dominant-type87.07%90.48%84.62%91.46%84.00%
Natural-capital-dominant-type5.36%7.14%9.79%0.00%0.00%
Physical-capital-dominant-type2.21%0.00%1.40%4.88%2.00%
Social-capital-dominant-type0.63%0.00%1.40%0.00%0.00%
Financial-capital-dominant-type4.73%2.38%2.80%3.66%14.00%
Psychological-capital-dominant-type0.00%0.00%0.00%0.00%0.00%
Table 8. Distribution of livelihood capital strengths and weaknesses of farmers by mode.
Types of Livelihood Capital Professional FatteningProfessional BreedingFull Self-BreedingFattening + Breeding
Livelihood CapitalStrong48.24%44.52%51.36%40.48%
weak51.76%55.48%48.64%59.52%
Human CapitalStrong58.82%66.67%61.36%57.53%
weak41.18%33.33%38.64%42.47%
Natural CapitalStrong18.18%25.88%35.71%9.59%
weak81.82%74.12%64.29%90.41%
Physical CapitalStrong38.64%11.90%27.65%13.01%
weak61.36%88.10%72.35%86.99%
Social CapitalStrong31.82%11.90%25.88%34.93%
weak68.18%88.10%74.12%65.07%
Financial CapitalStrong77.27%63.70%60.00%52.38%
weak22.73%36.30%40.00%47.62%
Psychological CapitalStrong56.82%59.52%72.94%53.42%
weak43.18%40.48%27.06%46.58%
Table 9. Distribution of heterogeneity in the livelihood capital structure of farmers by mode.
Types of Livelihood CapitalProfessional FatteningProfessional BreedingFull Self-BreedingFattening + Breeding
Human-capital-dominant-type84.09%88.10%95.29%93.15%
Natural-capital-dominant-type0.00%4.76%1.18%1.37%
Physical-capital-dominant-type2.27%2.38%1.18%1.37%
Social-capital-dominant-type0.00%0.00%0.00%0.68%
Financial-capital-dominant-type13.64%4.76%2.35%3.42%
Psychological-capital-dominant-type0.00%0.00%0.00%0.00%
Table 10. Farmers’ livelihood capital coupling degree and coupling stage.
Coupling DegreeCoupling PhaseFrequencyFrequency
0.000–0.300Low-level coupling5714.47%
0.301–0.500Antagonistic phase51.27%
0.501–0.800Breaking-in stage18747.46%
0.801–1.000High-level coupling14536.80%
Table 11. Farmers’ livelihood capital coupling coordination and degree of coordination.
Coordination LevelDegree of CoordinationCoupling CoordinationFrequencyFrequency
1Extreme disorder0.000–0.10000.00%
2Severe disorder0.101–0.2008621.83%
3Moderate disorder0.201–0.30018647.21%
4Mild disorder0.301–0.40010125.63%
5On the verge of disorder0.401–0.50030.76%
6Barely coordinated0.501–0.60071.78%
7Primary Coordination0.601–0.700112.79%
8Intermediate Coordination0.701–0.80000.00%
9Good coordination0.801–0.90000.00%
10Quality Coordination0.901–1.00000.00%
Disclaimer/Publisher’s Note: The statements, opinions and data contained in all publications are solely those of the individual author(s) and contributor(s) and not of MDPI and/or the editor(s). MDPI and/or the editor(s) disclaim responsibility for any injury to people or property resulting from any ideas, methods, instructions or products referred to in the content.

