Return on Equity in Dairy Farms from Selected EU Countries: Assessment Based on the DuPont Model in Years 2004–2020
Abstract
1. Introduction
2. Changes in Milk Production and Economic Strength of Dairy Farms in EU Countries in 2004–2020
3. Materials and Methods
4. Results
4.1. Return on Equity in Average Dairy Farms from Selected EU Countries
4.2. Factors Determining Return on Equity in Average Dairy Farms from the Selected EU Countries
5. Discussion
6. Summary and Conclusions
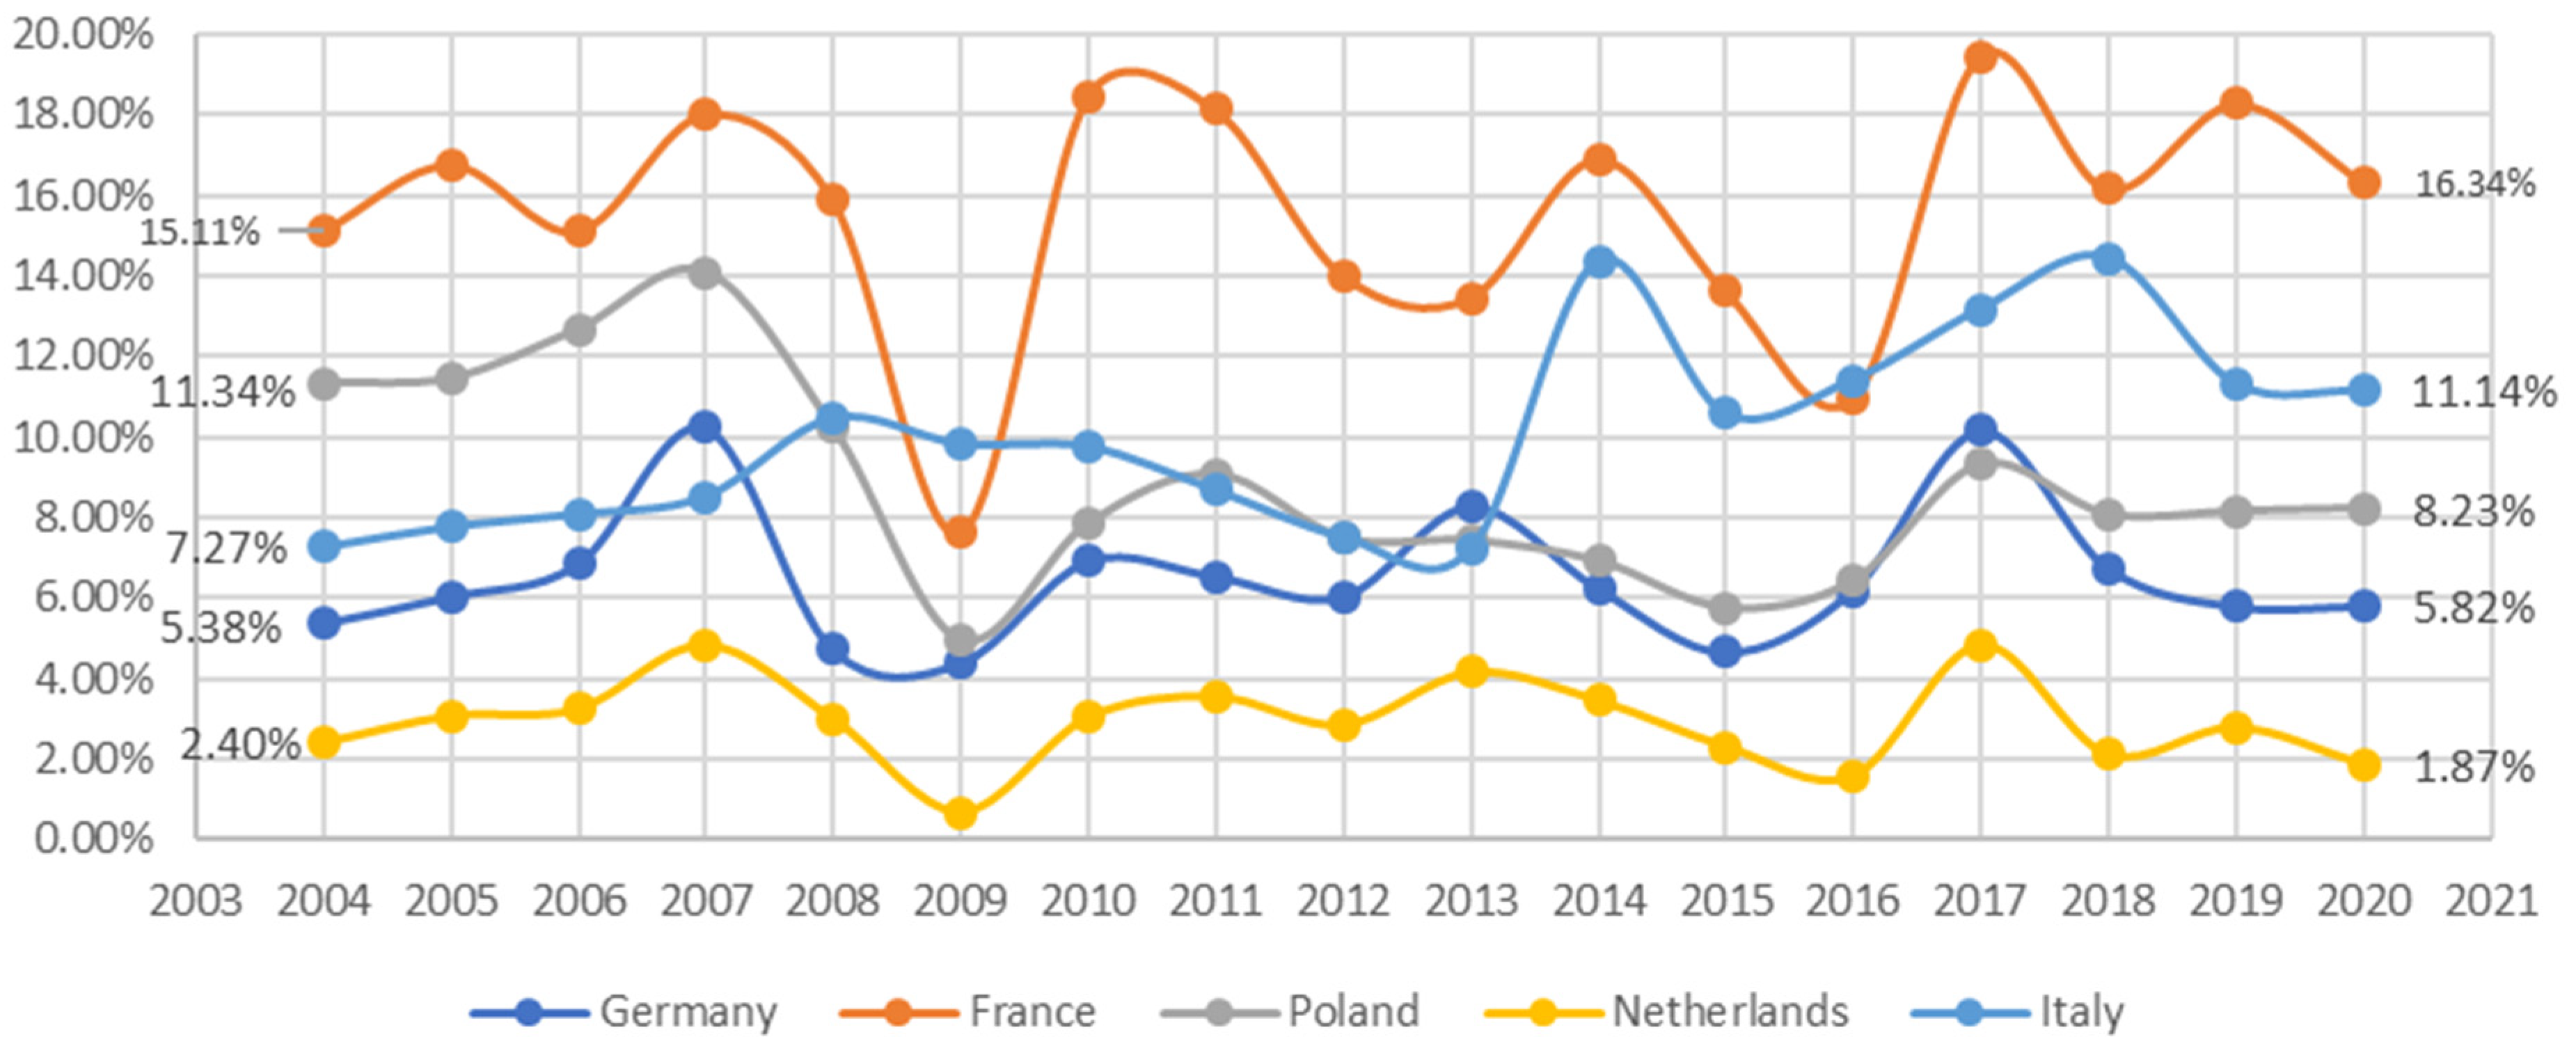
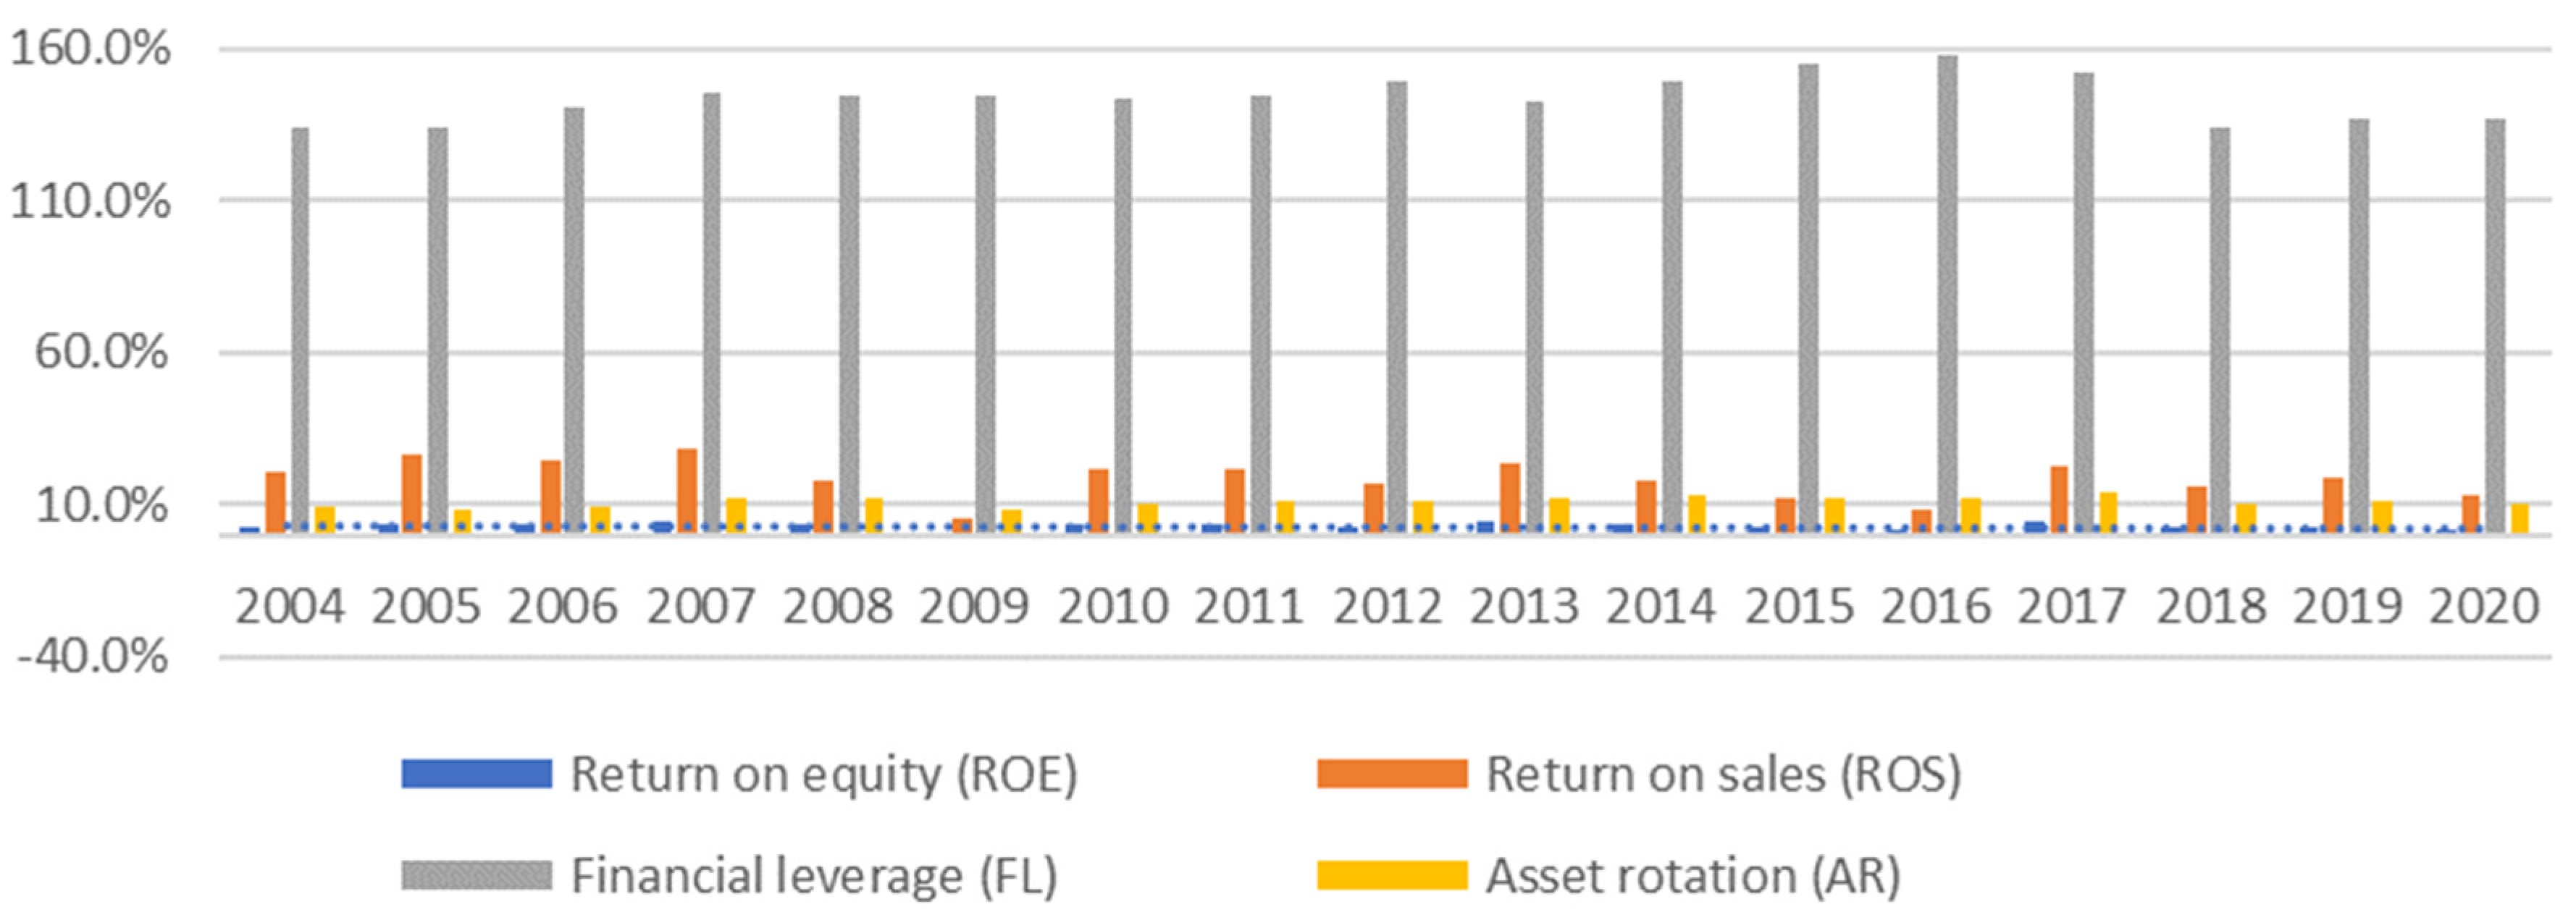
- The lowest return on equity in the years 2004–2020 was recorded for farms from the Netherlands. This ratio ranged from 0.68% in 2009 to 4.86% in 2017. The reasons for the relatively low ROE in dairy farms in the Netherlands should be sought in context of the need to engage significant assets in production, mainly a very expensive resource such as land and costly human labor.
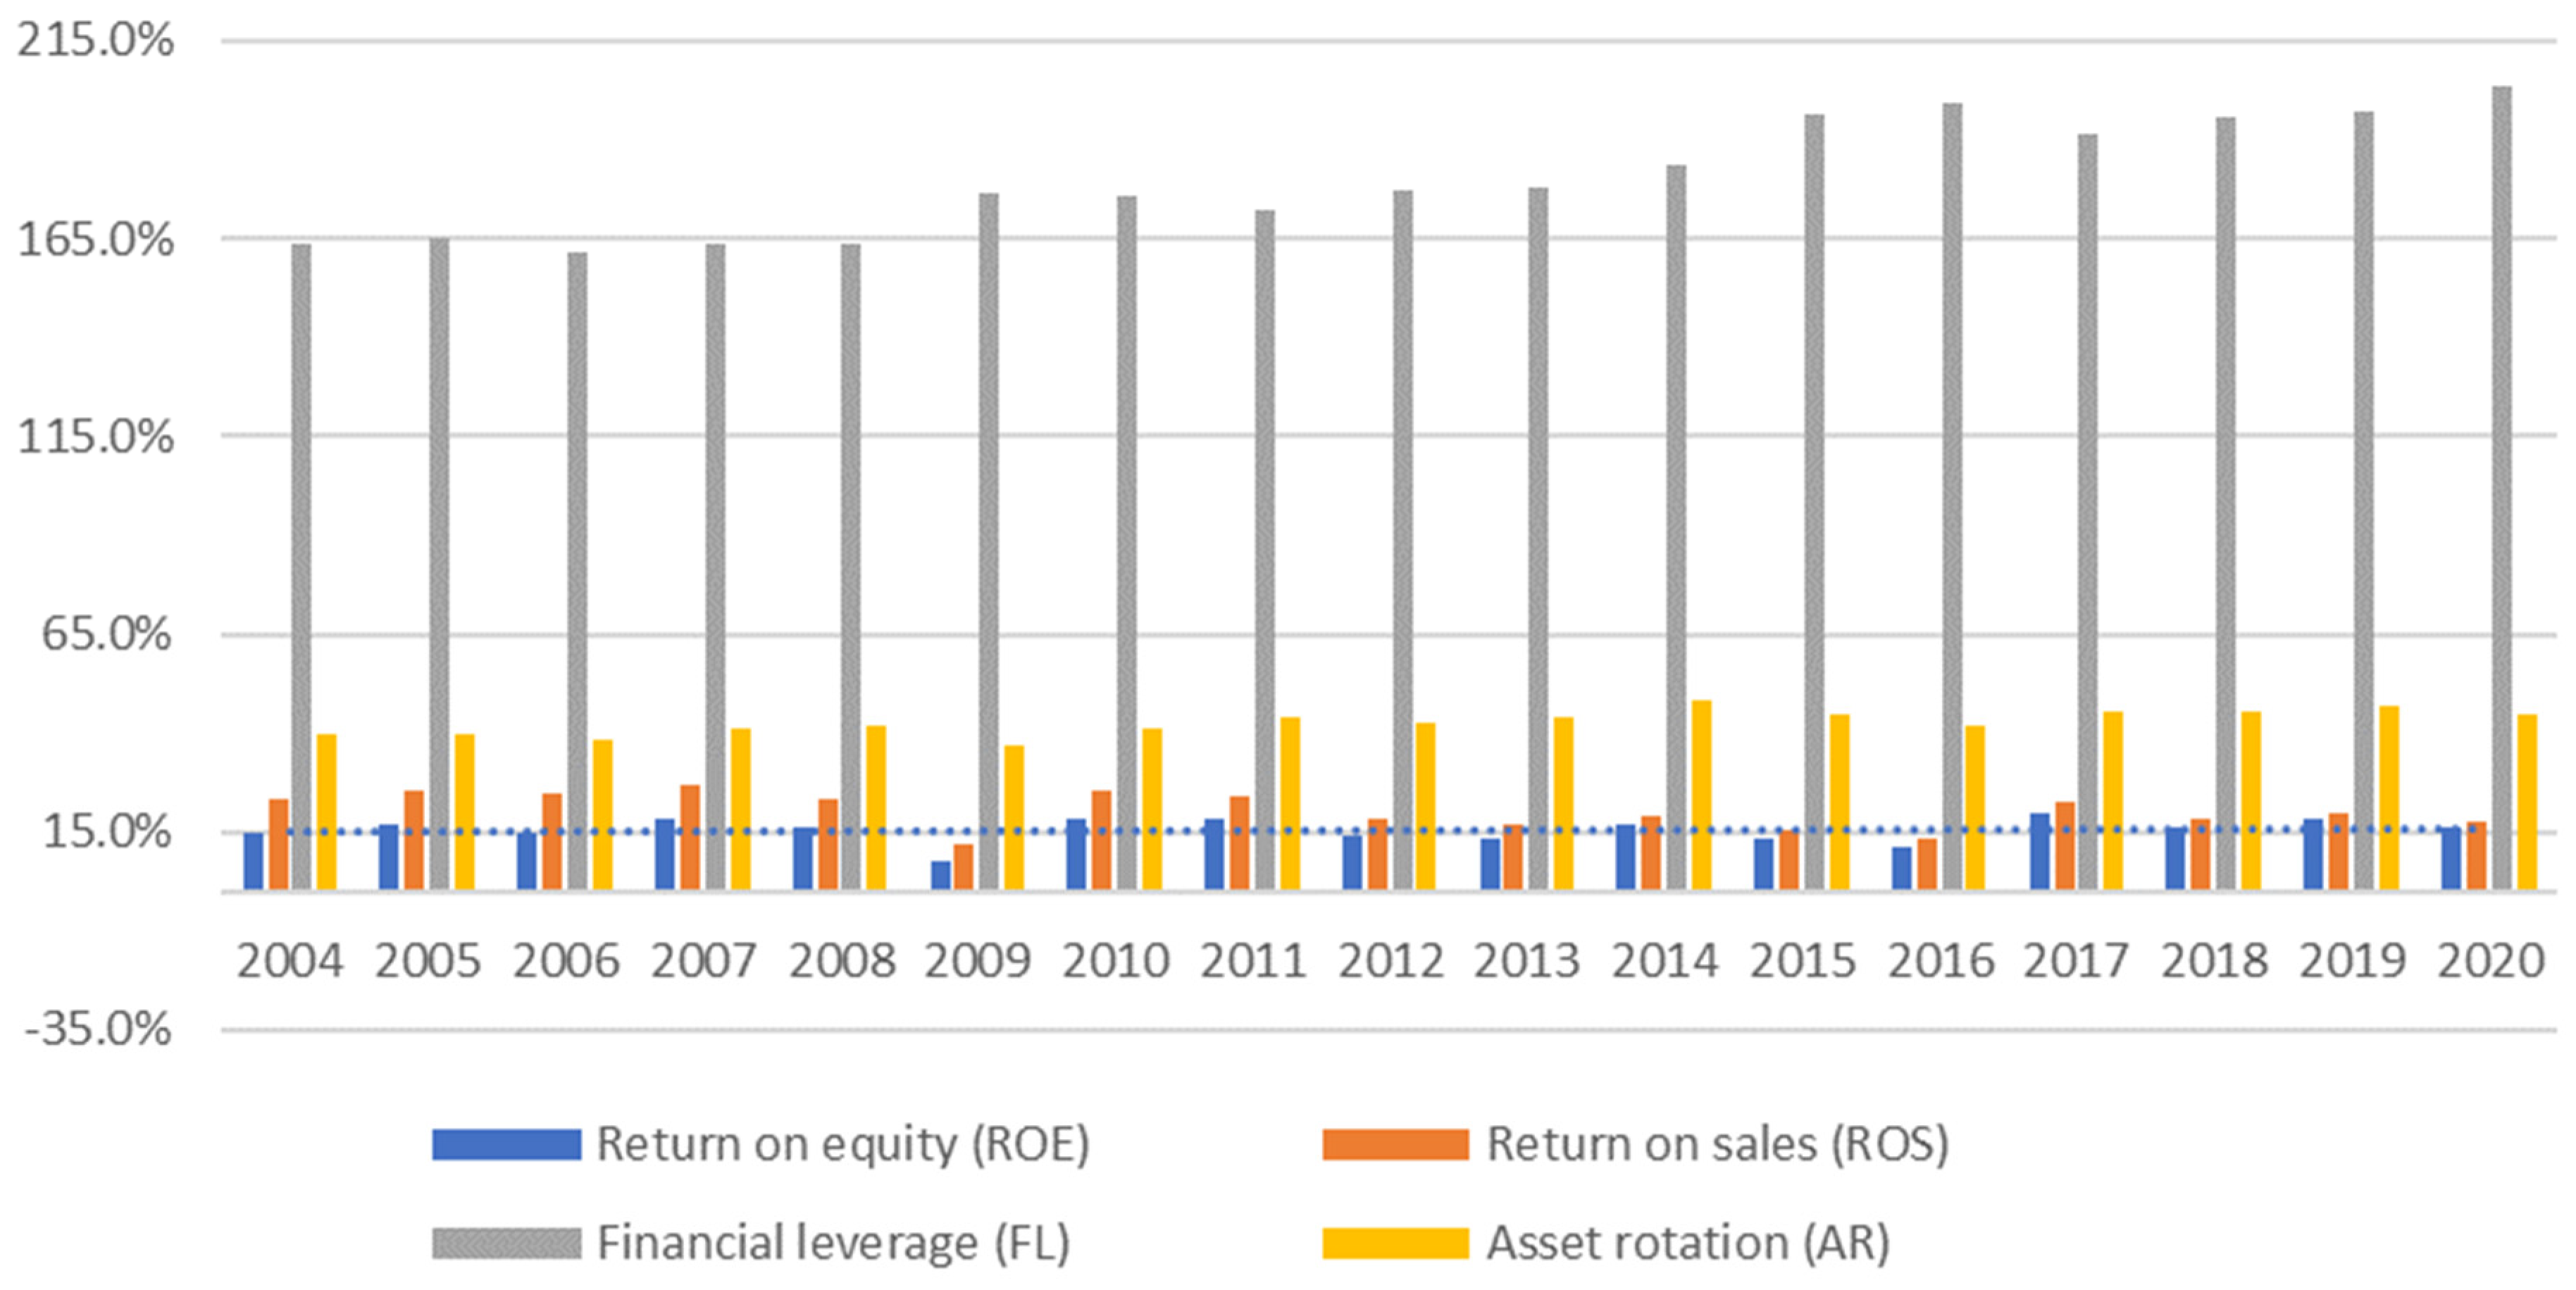
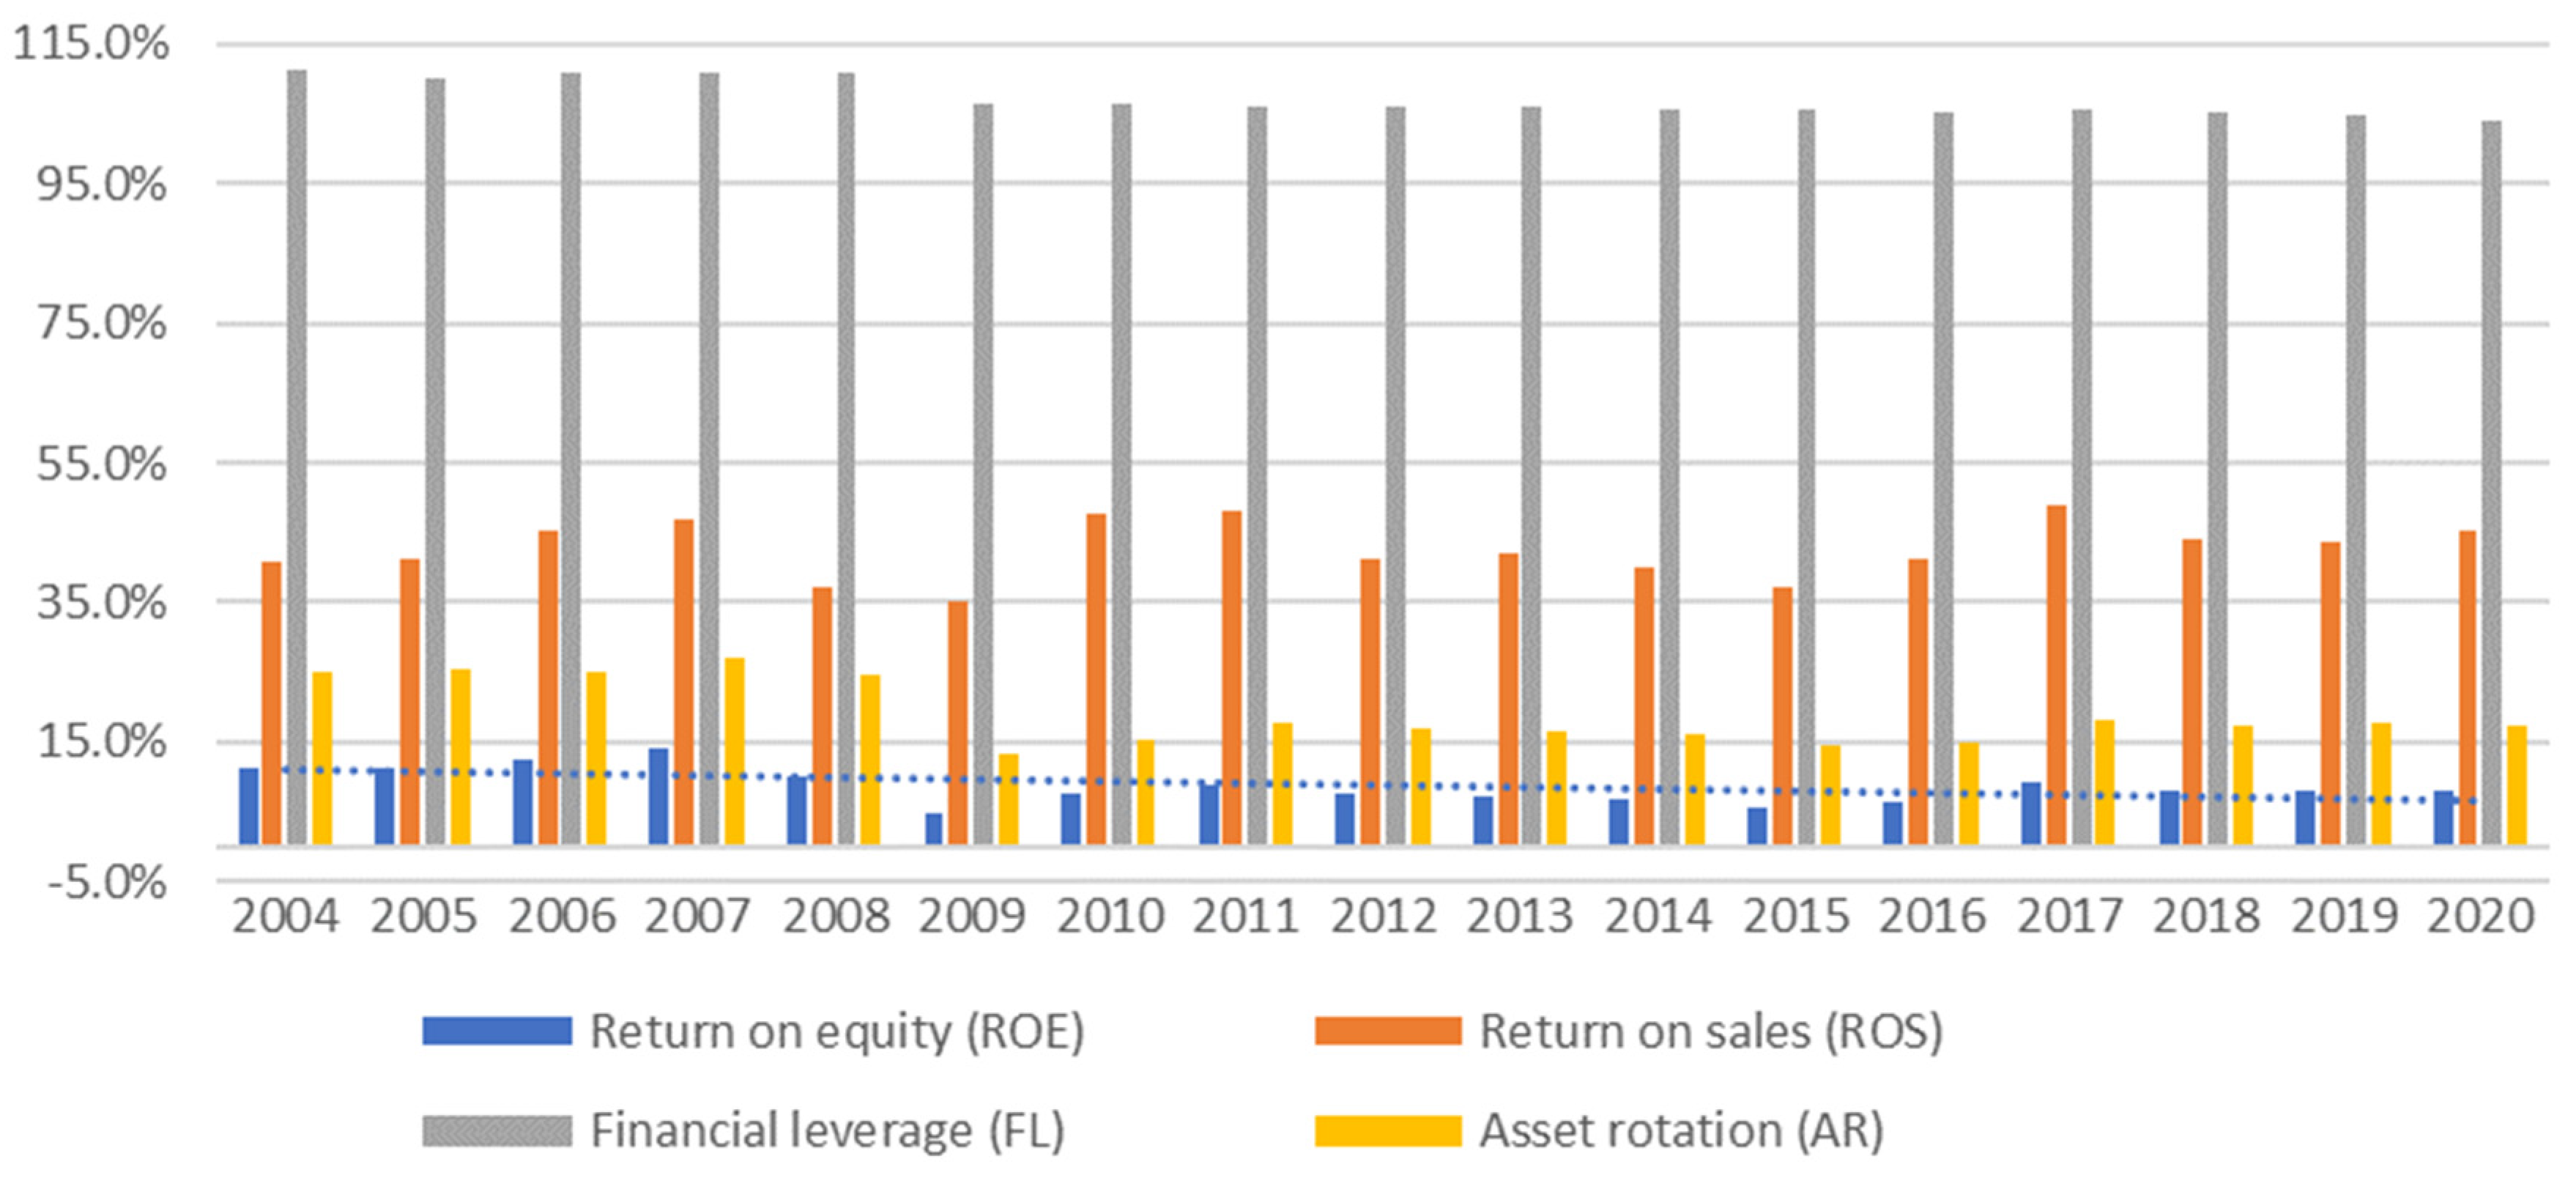
- The highest return on equity was calculated for dairy farms from France. The value of this ratio ranged from 7.64% in 2009 to 19.46% in 2017. The factor strongly determining the favorable value of this ratio was the high degree of financing assets with low-interest loans and credits. The ratio of the total value of farm assets to the value of equity in average French dairy farms ranged from 163.4% in 2004 to 203.9% in 2020. Undoubtedly, the need to repay credits and loans in the future (if they are not canceled) will have a negative impact on the financial liquidity of French dairy farms.
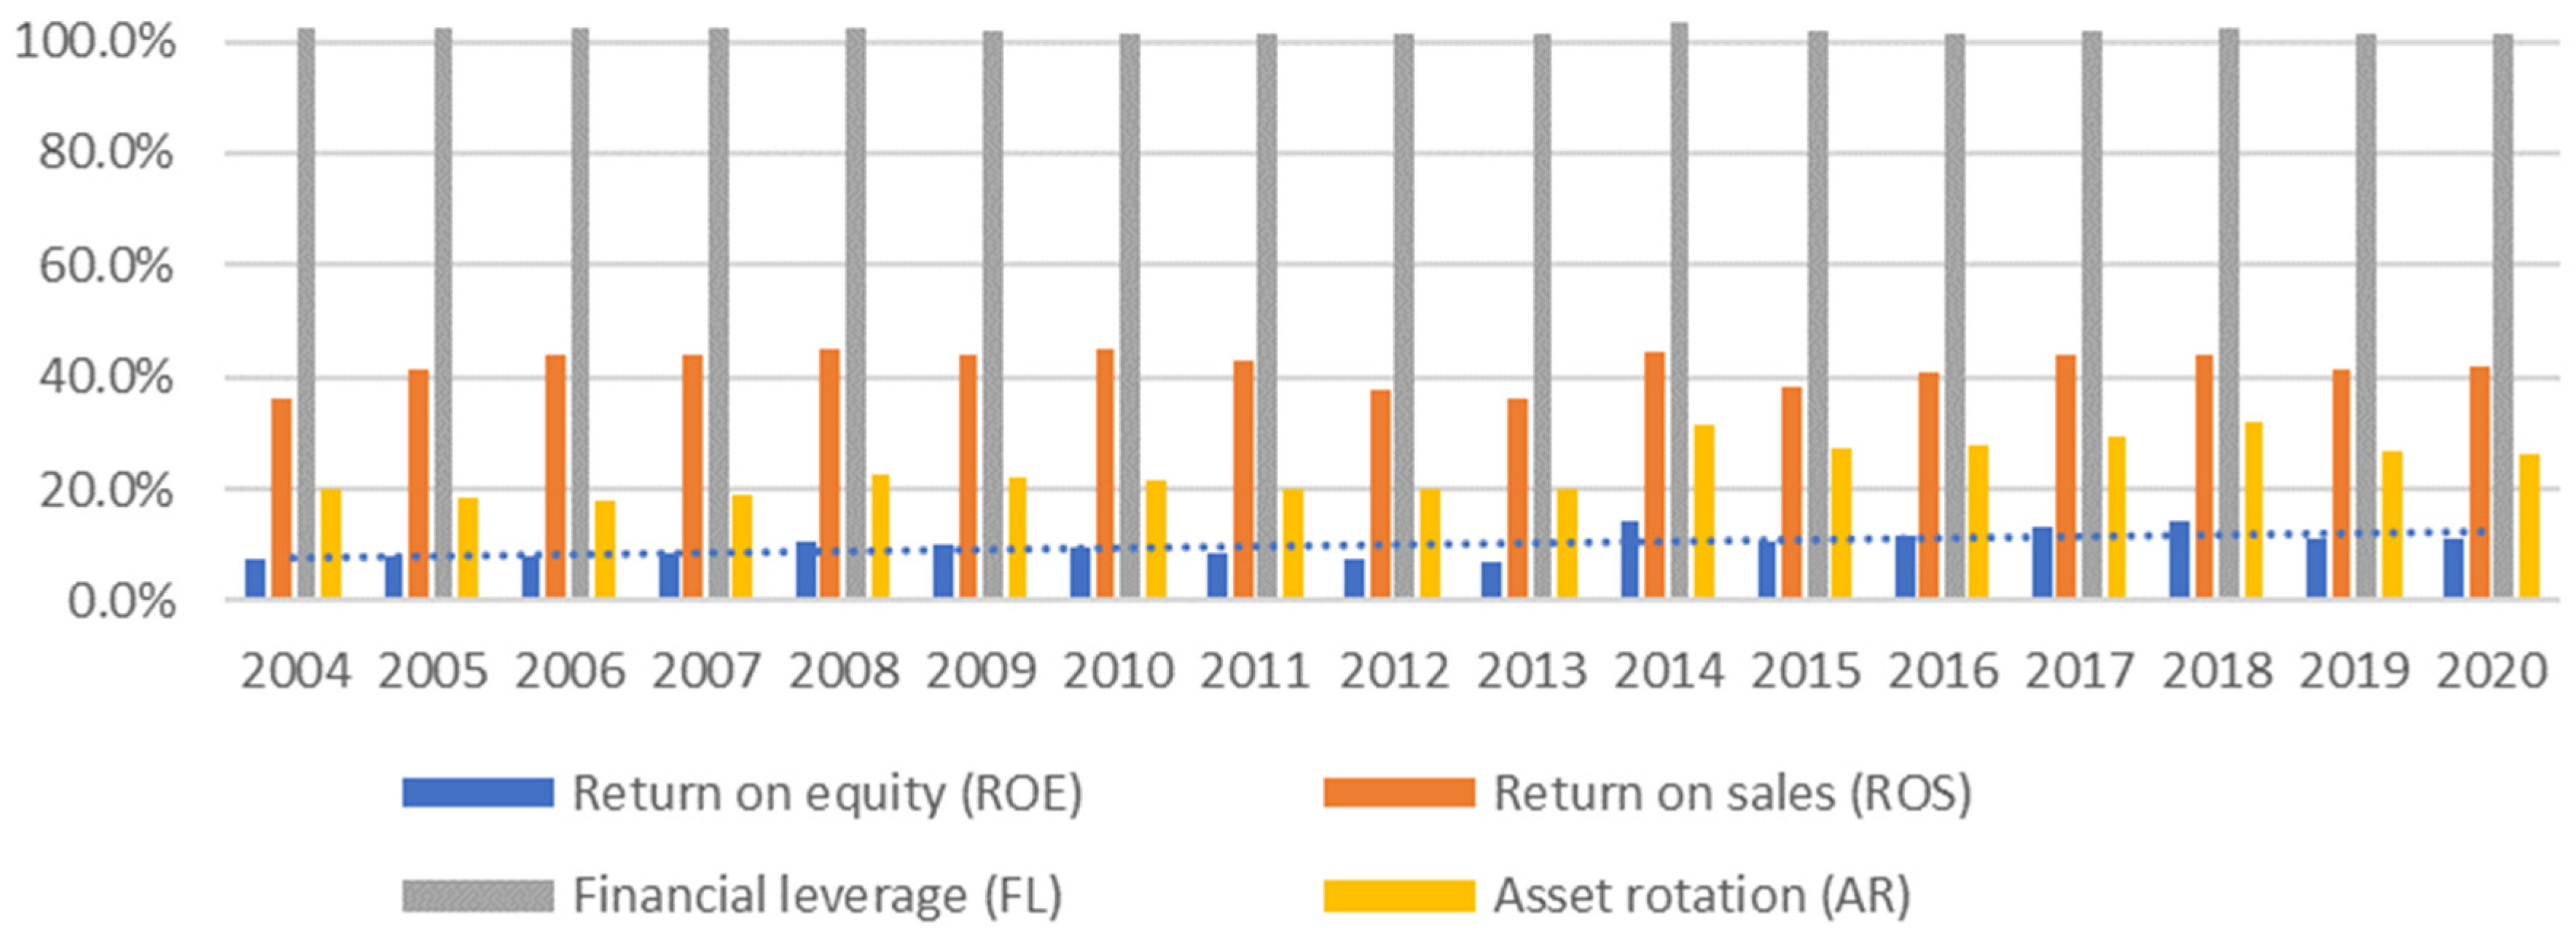
- Despite the fact that they had the lowest production potential and a small scale of milk production, average Polish dairy farms in 2004–2020 had quite a high return on equity. This ratio ranged from 4.97% in 2009 to 14.9% in 2007. In the years 2015–2020, in average Polish dairy farms, the return on equity was clearly lower than that in 2004 and ranged from 5.77% to 9.31%. The main reason for the deterioration of the situation was the large investments in fixed assets, which resulted in an increase in farm assets, while the increase in revenues was not commensurate. In addition, the main reason for the high return on equity in 2004 was Poland’s accession to the EU, which generated a significant increase in the prices of both dairy products and milk.
- Global conditions and administrative regulations at the EU level affect the return on equity in dairy farms. High prices of dairy products on the world markets in 2007 resulted in a relatively high return on equity in average dairy farms in the analyzed countries. This also translated into regulations in the field of agricultural policy, which included the abolition of subsidies for dairy products exported outside the EU. The consequences of these changes in regulations could be seen in 2009, when the drop in prices for dairy products on the world markets left its mark on the return on equity in dairy farms in the studied EU countries.
- The conducted research requires more in-depth analysis. Further work should examine the evolution of return on equity in dairy farms diversified by the scale of milk production. What is the difference between farms with a similar scale of milk production but with different affiliations to a particular country? How do macroeconomic conditions determine the economic efficiency of milk production?
Author Contributions
Funding
Institutional Review Board Statement
Data Availability Statement
Conflicts of Interest
References
- Augere-Granier, M. The EU Dairy Sector: Main Features, Challenges and Prospects; European Parliamentary Research Service: Brussels, Belgium, 2018. [Google Scholar]
- OECD/FAO. Chapter 7. Dairy and dairy products. In OECD-FAO Agric Outlook 2022–2031; OECD/FAO: Paris, France, 2022. [Google Scholar]
- United Nations. World Population Projected to Reach 9.8 Billion in 2050, and 11.2 Billion in 2100; UN Department of Economic and Social Affairs: New York, NY, USA, 2019. [Google Scholar]
- Poczta, W. Rolnictwo—W Pułapce Iluzorycznych Oczekiwań, [w] Zielona Transformacja Polskiego Rolnictwa—Sens, Filozofia i Drogi do Celu. 2022. Available online: www.kongresobywatelski.pl (accessed on 20 March 2023).
- Bellassen, V.; Drut, M.; Hilal, M.; Bodini, A.; Donati, M.; de Labarre, M.D.; Filipović, J.; Gauvrit, L.; Gil, J.M.; Hoang, V.; et al. The economic, environmental and social performance of European certified food. Ecol. Econ. 2022, 191, 107244. [Google Scholar] [CrossRef]
- Huber, R.A.; Wicki, M.L.; Bernauer, T. Public support for environmental policy depends on beliefs concerning effectiveness, intrusiveness, and fairness. Environ. Politics 2020, 29, 649–673. [Google Scholar] [CrossRef]
- Parzonko, A.; Bórawski, P. Competitiveness of Polish dairy farms in the European Union. Agric. Econ.-Zemed. Ekon. 2020, 66, 168–174. [Google Scholar] [CrossRef]
- Poczta, W.; Pawlak, K. Competitiveness of Polish agriculture in the context of globalization and economic integration—competitive potential and position. Probl. Agric. Econ. 2020, 4, 86–107. [Google Scholar] [CrossRef]
- Ziętara, W.; Adamski, M. Competitiveness of the Polish dairy farms at the background of farms from selected European Union countries. Probl. Agric. Econ. 2018, 1, 56–78. [Google Scholar] [CrossRef]
- Manioudis, M.; Milonakis, D. Smith’s Wealth of Nations and the economic past: Setting the scene for economic history? Eur. J. Hist. Econ. Thought 2021, 28, 142–163. [Google Scholar] [CrossRef]
- Juszczyk, S. Agribusiness Finance; Wydawnictwo Naukowe PWN: Warszawa, Poland, 2023; 580p, Available online: https://katalogi.bn.org.pl/permalink/48OMNIS_NLOP/1aot9i7/alma9913166365205606 (accessed on 5 February 2020).
- Power, J. Feeding Europe 60 Years of Common Agricultural Policy; European Council: Brussels, Belgium, 2022. [Google Scholar]
- Fusco, G. Twenty years of common agricultural policy in europe: A bibliometric analysis. Sustainability 2021, 13, 10650. [Google Scholar] [CrossRef]
- Kiryluk-Dryjska, E.; Baer-Nawrocka, A.; Okereke, O. The Environmental and Climatic CAP Measures in Poland vs. Farmers’ Expectations—Regional Analysis. Energies 2022, 15, 4529. [Google Scholar] [CrossRef]
- De Castro, P.; Miglietta, P.P.; Vecchio, Y. The Common Agricultural Policy 2021–2027: A new history for European agriculture. In Italian Review Agricultural Economics; Firenze University Press: Florence, Italy, 2020; Volume 75. [Google Scholar]
- Bórawski, P.; Pawlewicz, A.; Parzonko, A.; Harper, J.K.; Holden, L. Factors shaping cow’s milk production in the EU. Sustainability 2020, 12, 420. [Google Scholar] [CrossRef]
- Popescu, A.; Stoian, E.; Șerban, V. The EU-28 milk sector trends in the period 2009–2018. Sci. Pap. Ser. Manag. Econ. Eng. Agric. Rural. Dev. 2019, 19, 249–263. [Google Scholar]
- Szwacka-Mokrzycka, J. Changes in the standard of living in Polish households against the background of other European Union countries. Acta Sci. Pol. Oeconomia 2020, 19, 107–116. [Google Scholar] [CrossRef]
- Rađenović, Ž.; Krstić, B.; Marković, M. Economic performance of agriculture in the European Union countries. Zagadnienia Ekon. Rolnej. Probl. Agric. Econ. 2022, 370, 5–21. [Google Scholar] [CrossRef]
- Syrůček, J.; Bartoň, L.; Řehák, D.; Štolcová, M.; Burdych, J. Recent development of economic indicators on Czech dairy farms. Agric. Econ. Zemed. Ekon. 2023, 69, 45–54. [Google Scholar] [CrossRef]
- Hornowski, A.; Parzonko, A.; Kotyza, P.; Kondraszuk, T.; Bórawski, P.; Smutka, L. Factors determining the development of small farms in central and eastern Poland. Sustainability 2020, 12, 5095. [Google Scholar] [CrossRef]
- Wilczyński, A.; Kołoszycz, E. Economic resilience of eu dairy farms: An evaluation of economic viability. Agriculture 2021, 11, 510. [Google Scholar] [CrossRef]
- Vrolijk, H.C.J.; Meier, B.; Kleinhanße, W.; Poppe, K.J. Point De Vue FADN: Buttress for farm policy or a resource for economic analysis? EuroChoices 2004, 3, 32–37. [Google Scholar] [CrossRef]
- Mishra, A.K.; Harris, J.M.; Erickson, K.W.; Hallahan, C.; Detre, J.D. Drivers of agricultural profitability in the USA: An application of the Du Pont expansion method. Agric. Financ. Rev. 2012, 72, 325–340. [Google Scholar] [CrossRef]
- Żwirbla, A. Model Du Ponta Jako Narzędzie Retro-i Prospektywnej Analizy Ekonomicznej. Zesz. Teoretyczne Rachun. 2005, 29, 154–186. Available online: https://www.ceeol.com/search/article-detail?id=146703 (accessed on 20 March 2023).
- Guba, W.; Dąbrowski, J. Deregulacja Rynku Mleka w Unii Europejskiej–Skutki i Zalecenia Dla Polski. Rocz. Nauk. Rol. Ser. G 2012, 99, 32–42. [Google Scholar]
- Klootwijk, C.W.; Van Middelaar, C.E.; Berentsen, P.B.M.; de Boer, I.J.M. Dutch dairy farms after milk quota abolition: Economic and environmental consequences of a new manure policy. J. Dairy Sci. 2016, 99, 8384–8396. [Google Scholar] [CrossRef]
- Kuipers, A.; Malak-Rawlikowska, A.; Stalgienė, A.; Ule, A.; Klopčič, M. European dairy farmers’ perceptions and responses towards development strategies in years of turbulent market and policy changes. Agriculture 2021, 11, 293. [Google Scholar] [CrossRef]
- Czyzewski, B.; Czyzewski, A.; Kryszak, Ł. The market treadmill against sustainable income of European Farmers: How the CAP has struggled with Cochrane’s curse. Sustainability 2019, 11, 791. [Google Scholar] [CrossRef]
- Bereżnicka, J. Sources of return on equity in economically diversified agriculture of the European Union countries. Probl. Agric. Econ. 2018, 3, 76–93. [Google Scholar] [CrossRef]
- Bełdycka-Bórawska, A.; Bórawski, P.; Guth, M.; Parzonko, A.; Rokicki, T.; Klepacki, B.; Wysokiński, M.; Maciąg, A.; Dunn, J.W. Price changes of dairy products in the european union. Agric. Econ. 2021, 67, 373–381. [Google Scholar] [CrossRef]
- Poczta, W.; Średzińska, J.; Chenczke, M. Economic situation of dairy farms in identified clusters of European Union countries. Agriculture 2020, 10, 92. [Google Scholar] [CrossRef]
- Gołaś, Z. Determinants of milk production profitability of dairy farms in the EU member states. Probl. Agric. Econ. 2017, 3, 19–40. [Google Scholar] [CrossRef]
- Kleinhanss, W. Competitiveness of the major types of agricultural holdings in Germany. Probl. Agric. Econ. 2015, 1, 24–39. [Google Scholar] [CrossRef]
- Sarica, D.; Demircan, V.; Naziroglu, A.; Aydin, O.; Koknaroglu, H. The cost and profitability analysis of different dairy farm sizes. Trop. Anim. Health Prod. 2022, 54, 320. [Google Scholar] [CrossRef]
- Očić, V.; Bobić, B.Š.; Grgić, Z. Economic analysis of specialized dairy farms in Croatia according to FADN. Mljekarstvo 2023, 73, 50–58. [Google Scholar] [CrossRef]
- Syrůček, J.; Bartoň, L.; Burdych, J. Break-even point analysis for milk production—Selected EU countries. Agric. Econ. 2022, 68, 199–206. [Google Scholar] [CrossRef]
- Oudshoorn, F.W.; Kristensen, T.; Van Der Zijpp, A.J.; Boer, I.J.M.D. Sustainability evaluation of automatic and conventional milking systems on organic dairy farms in Denmark. NJAS-Wagening. J. Life Sci. 2012, 59, 25–33. [Google Scholar] [CrossRef]
- Vanhuyse, F.; Bailey, A.; Tranter, R. Management practices and the financial performance of farms. Agric. Financ. Rev. 2020, 81, 415–429. [Google Scholar] [CrossRef]

| No. | Countries | Year | Increase in Milk Production in 2021 Compared to 2004 | |||||
|---|---|---|---|---|---|---|---|---|
| 2004 | 2010 | 2015 | 2021 | |||||
| (M ton) | (M ton) | (M ton) | (M ton) | Per capita (kg) | (M ton) | % | ||
| 1 | Germany | 28.24 | 29.63 | 32.67 | 32.51 | 390.92 | 4.26 | 15.09 |
| 2 | France | 24.33 | 24.03 | 25.82 | 24.78 | 366.24 | 0.44 | 1.83 |
| 3 | Poland | 11.82 | 12.28 | 13.24 | 14.88 | 393.26 | 3.06 | 25.88 |
| 4 | Netherlands | 10.91 | 11.63 | 13.52 | 14.22 | 813.54 | 3.31 | 30.37 |
| 5 | Italy | 10.73 | 11.40 | 11.43 | 13.20 | 222.88 | 2.47 | 23.07 |
| 6 | Ireland | 5.31 | 5.35 | 6.60 | 9.02 | 1801.93 | 3.71 | 69.98 |
| 7 | Spain | 6.64 | 6.36 | 7.03 | 7.62 | 160.83 | 0.99 | 14.89 |
| 8 | Denmark | 4.57 | 4.83 | 5.28 | 5.64 | 966.43 | 1.08 | 23.54 |
| 9 | Belgium | 3.41 | 3.87 | 3.83 | 4.43 | 383.76 | 1.02 | 29.85 |
| 10 | Austria | 3.14 | 3.26 | 3.54 | 3.83 | 428.78 | 0.69 | 22.08 |
| 11 | Romania | 5.02 | 3.94 | 3.98 | 3.64 | 189.41 | −1.39 | −27.61 |
| 12 | Czechia | 2.60 | 2.68 | 3.03 | 3.31 | 315.38 | 0.71 | 27.19 |
| 13 | Sweden | 3.28 | 2.86 | 2.93 | 2.78 | 268.05 | −0.49 | −15.05 |
| 14 | Finland | 2.45 | 2.34 | 2.44 | 2.31 | 418.31 | −0.13 | −5.47 |
| 15 | Hungary | 1.89 | 1.68 | 1.94 | 2.08 | 213.78 | 0.19 | 9.80 |
| 16 | Portugal | 2.01 | 1.92 | 2.01 | 2.00 | 193.78 | −0.01 | −0.72 |
| 17 | Lithuania | 1.84 | 1.73 | 1.73 | 1.47 | 526.98 | −0.37 | −20.00 |
| 18 | Latvia | 0.78 | 0.83 | 0.98 | 0.99 | 523.08 | 0.21 | 26.32 |
| 19 | Slovakia | 1.08 | 0.92 | 0.93 | 0.90 | 165.33 | −0.18 | −16.34 |
| 20 | Estonia | 0.65 | 0.68 | 0.78 | 0.84 | 630.57 | 0.19 | 28.65 |
| 21 | Bulgaria | 1.35 | 10.95 | 1.03 | 0.84 | 120.87 | −0.51 | −37.84 |
| 22 | Greece | 0.77 | 0.67 | 0.76 | 0.71 | 66.58 | −0.06 | −7.43 |
| 23 | Slovenia | 0.65 | 0.60 | 0.63 | 0.64 | 303.43 | −0.01 | −1.61 |
| 24 | Croatia | 0.68 | 0.79 | 0.69 | 0.56 | 138.00 | −0.13 | −18.45 |
| 25 | Luxembourg | 0.27 | 0.30 | 0.35 | 0.44 | 698.38 | 0.17 | 65.07 |
| 26 | Cyprus | 0.15 | 0.15 | 0.17 | 0.30 | 332.74 | 0.15 | 97.16 |
| 27 | Malta | 0.04 | 0.04 | 0.04 | 0.04 | 76.61 | 0.00 | −5.83 |
| Total | 134.62 | 145.73 | 147.38 | 153.99 | 344.49 | 19.37 | 14.39 | |
| No. | Countries | Number of Farms in 2020 by Economic Size | Average Annual Milk Production in 2020 per Farm [Thousand kg] | ||||||
|---|---|---|---|---|---|---|---|---|---|
| From over 0 to 15,000 EUR | From 15,000 to 49,999 EUR | From 50,000 to 99,999 EUR | From 100,000 to 249,999 EUR | From 250,000 to 499,999 EUR | 500,000 EUR or over | Total | |||
| 1 | Germany | 260 | 3820 | 7730 | 16,880 | 11,260 | 4770 | 44,720 | 741.61 |
| 2 | France | 350 | 1010 | 3330 | 16,930 | 11,610 | 2070 | 35,300 | 714.87 |
| 3 | Poland | 18,910 | 36,590 | 24,800 | 9110 | 860 | 220 | 90,490 | 160.27 |
| 4 | Netherlands | 20 | 80 | 240 | 2630 | 7330 | 4170 | 14,470 | 1003.59 |
| 5 | Italy | 2220 | 5670 | 4410 | 5800 | 3490 | 2850 | 24,440 | 520.15 |
| 6 | Ireland | 0 | 620 | 2350 | 8150 | 3430 | 760 | 15,310 | 557.92 |
| 7 | Spain | 910 | 2150 | 3050 | 4070 | 1590 | 770 | 12,540 | 606.54 |
| 8 | Denmark | 0 | 20 | 20 | 180 | 380 | 1890 | 2490 | 2275.50 |
| 9 | Belgium | 40 | 70 | 150 | 1390 | 1790 | 680 | 4120 | 1079.89 |
| 10 | Austria | 1130 | 8190 | 8570 | 5940 | 450 | 30 | 24,310 | 156.95 |
| 11 | Romania | 116,490 | 14,350 | 2280 | 750 | 120 | 80 | 134,070 | 27.45 |
| 12 | Czechia | 120 | 100 | 130 | 190 | 100 | 260 | 900 | 3630.81 |
| 13 | Sweden | 0 | 20 | 110 | 690 | 1080 | 1120 | 3020 | 918.13 |
| 14 | Finland | 40 | 330 | 1250 | 2420 | 1040 | 310 | 5390 | 446.48 |
| 15 | Hungary | 1100 | 860 | 300 | 210 | 80 | 180 | 2730 | 737.85 |
| 16 | Portugal | 240 | 550 | 1040 | 1630 | 620 | 220 | 4300 | 464.43 |
| 17 | Lithuania | 9410 | 2780 | 910 | 530 | 120 | 50 | 13,800 | 107.83 |
| 18 | Latvia | 4400 | 1990 | 520 | 390 | 110 | 80 | 7490 | 131.94 |
| 19 | Slovakia | 1080 | 240 | 50 | 40 | 30 | 130 | 1570 | 584.52 |
| 20 | Estonia | 170 | 110 | 80 | 90 | 70 | 140 | 660 | 1285.30 |
| 21 | Bulgaria | 10,460 | 2090 | 1160 | 590 | 80 | 50 | 14,430 | 61.12 |
| 22 | Greece | 110 | 300 | 260 | 370 | 90 | 30 | 1160 | 589.19 |
| 23 | Slovenia | 250 | 2210 | 1290 | 630 | 60 | 10 | 4450 | 141.72 |
| 24 | Croatia | 1,710 | 1580 | 580 | 260 | 30 | 30 | 4190 | 142.24 |
| 25 | Luxembourg | 0 | 0 | 20 | 180 | 250 | 70 | 520 | 860.27 |
| 26 | Cyprus | 0 | 0 | 10 | 40 | 140 | 190 | 1448.21 | |
| 27 | Malta | 0 | 0 | 10 | 30 | 20 | 10 | 70 | 601.57 |
| Total | 169,420 | 85,730 | 64,640 | 80,090 | 46,130 | 21,120 | 467,130 | 330.00 | |
| No. | Countries | Number of Monitored Agricultural Holdings | Average Number of Cows per Farm (LSU) | Average Arable Land Size [ha] | Average Value of Sales of Milk (EUR) | Average Value of Farm Assets (EUR) |
|---|---|---|---|---|---|---|
| 1 | Germany | 51,236 | 70.7 | 81.8 | 206,426 | 1,025,860 |
| 2 | France | 39,683 | 66.6 | 99.7 | 180,439 | 530,750 |
| 3 | Poland | 94,137 | 17.6 | 21.3 | 31,644 | 243,695 |
| 4 | Netherlands | 16,426 | 102.5 | 59.7 | 339,562 | 3,998,026 |
| 5 | Italy | 29,727 | 58.9 | 35.1 | 179,286 | 934,583 |
| No. | Countries | Average Revenue from Dairy Farm (EUR) | Average Income from Dairy Farm (EUR) | Average Assets Value (EUR) | |||
|---|---|---|---|---|---|---|---|
| 2004 | 2020 | 2004 | 2020 | 2004 | 2020 | ||
| 1 | Germany | 125,617 | 289,361 | 28,423 | 44,188 | 631,747 | 1,025,860 |
| 2 | France | 116,627 | 238,261 | 27,090 | 42,550 | 292,899 | 530,750 |
| 3 | Poland | 17,806 | 42,663 | 7250 | 19,251 | 71,066 | 243,695 |
| 4 | Netherlands | 186,209 | 413,061 | 37,911 | 54,574 | 2,114,376 | 3,998,026 |
| 5 | Italy | 153,821 | 245,028 | 55,274 | 102,708 | 779,671 | 934,583 |
| Countries | Deviation of the Return on Equity Ratio Compared to 2004 | Return on Sales | Financial Leverage | Asset Turnover |
|---|---|---|---|---|
| Year 2015 | ||||
| Germany | −0.008 | −0.024 | 0.005 | 0.011 |
| France | −0.015 | −0.058 | 0.026 | 0.017 |
| Poland | −0.055 | −0.007 | −0.004 | −0.044 |
| Netherlands | −0.002 | −0.012 | 0.003 | 0.007 |
| Italy | 0.034 | 0.005 | 0.000 | 0.029 |
| Year 2016 | ||||
| Germany | 0.008 | −0.013 | 0.007 | 0.014 |
| France | −0.042 | −0.073 | 0.026 | 0.005 |
| Poland | −0.050 | 0.001 | −0.005 | −0.046 |
| Netherlands | −0.009 | −0.018 | 0.003 | 0.006 |
| Italy | 0.042 | 0.012 | −0.001 | 0.031 |
| Year 2017 | ||||
| Germany | 0.048 | 0.011 | 0.008 | 0.029 |
| France | 0.044 | −0.007 | 0.028 | 0.023 |
| Poland | −0.020 | 0.019 | −0.005 | −0.034 |
| Netherlands | 0.024 | 0.003 | 0.004 | 0.017 |
| Italy | 0.059 | 0.020 | −0.001 | 0.040 |
| Year 2018 | ||||
| Germany | 0.014 | −0.015 | 0.007 | 0.022 |
| France | 0.011 | −0.038 | 0.028 | 0.021 |
| Poland | −0.032 | 0.008 | −0.005 | −0.035 |
| Netherlands | −0.002 | −0.005 | 0.000 | 0.003 |
| Italy | 0.073 | 0.022 | 0.000 | 0.051 |
| Year 2019 | ||||
| Germany | 0.004 | −0.022 | 0.007 | 0.019 |
| France | 0.031 | −0.026 | 0.031 | 0.026 |
| Poland | −0.032 | 0.007 | −0.006 | −0.033 |
| Netherlands | 0.004 | −0.002 | 0.001 | 0.005 |
| Italy | 0.040 | 0.013 | −0.001 | 0.028 |
| Year 2020 | ||||
| Germany | 0.005 | −0.022 | 0.007 | 0.020 |
| France | 0.013 | −0.041 | 0.035 | 0.019 |
| Poland | −0.031 | 0.010 | −0.006 | −0.035 |
| Netherlands | −0.006 | −0.009 | 0.000 | 0.003 |
| Italy | 0.039 | 0.014 | −0.001 | 0.026 |
Disclaimer/Publisher’s Note: The statements, opinions and data contained in all publications are solely those of the individual author(s) and contributor(s) and not of MDPI and/or the editor(s). MDPI and/or the editor(s) disclaim responsibility for any injury to people or property resulting from any ideas, methods, instructions or products referred to in the content. |
© 2023 by the authors. Licensee MDPI, Basel, Switzerland. This article is an open access article distributed under the terms and conditions of the Creative Commons Attribution (CC BY) license (https://creativecommons.org/licenses/by/4.0/).
Share and Cite
Parzonko, A.; Parzonko, A.J.; Bórawski, P.; Wicki, L. Return on Equity in Dairy Farms from Selected EU Countries: Assessment Based on the DuPont Model in Years 2004–2020. Agriculture 2023, 13, 1403. https://doi.org/10.3390/agriculture13071403
Parzonko A, Parzonko AJ, Bórawski P, Wicki L. Return on Equity in Dairy Farms from Selected EU Countries: Assessment Based on the DuPont Model in Years 2004–2020. Agriculture. 2023; 13(7):1403. https://doi.org/10.3390/agriculture13071403
Chicago/Turabian StyleParzonko, Andrzej, Anna Justyna Parzonko, Piotr Bórawski, and Ludwik Wicki. 2023. "Return on Equity in Dairy Farms from Selected EU Countries: Assessment Based on the DuPont Model in Years 2004–2020" Agriculture 13, no. 7: 1403. https://doi.org/10.3390/agriculture13071403
APA StyleParzonko, A., Parzonko, A. J., Bórawski, P., & Wicki, L. (2023). Return on Equity in Dairy Farms from Selected EU Countries: Assessment Based on the DuPont Model in Years 2004–2020. Agriculture, 13(7), 1403. https://doi.org/10.3390/agriculture13071403


