Article

Nitrogen Fluxes in an Agro-Livestock System under Land Use Change: A Temporal Analysis in an Environmental Protection Unit

by
Angélica Cristina Rhoden
1,*,
João Garibaldi Almeida Viana
2,
Vicente Celestino Pires Silveira
1,
Thierry Christophe Bonaudo
3 and
Gilberto Vilmar Kozloski
4
1
Rural Extension, Center for Rural Sciences, Department Centro de Ciências Rurais-CCR, Universidade Federal de Santa Maria, Roraima Avenue 1000, Santa Maria 97105-900, RS, Brazil
2
Business and Economics, Department of Rural Economy, Universidade Federal do Pampa, Rua Barão do Triunfo, 1048, Santana do Livramento 97573-634, RS, Brazil
3
Sciences for Action and Development: Activities, Products, Territories, AgroParisTech, 22 Place de l’Agronomie, CS 20040, CEDEX 09, 91123 Paris, France
4
Animal Science Departament, Universidade Federal de Santa Maria, Roraima Avenue 1000, Santa Maria 97105-900, RS, Brazil
*
Author to whom correspondence should be addressed.
Agriculture 2023, 13(8), 1524; https://doi.org/10.3390/agriculture13081524
Submission received: 29 June 2023 / Revised: 22 July 2023 / Accepted: 27 July 2023 / Published: 31 July 2023
(This article belongs to the Section Farm Animal Production)

Abstract

:
In recent decades, significant changes have driven the advancement of agricultural production systems in Brazil. The objective of this study is to analyze the efficiency and transformation of the agricultural production system in the Ibirapuitã Environmental Preservation Area (EPA) through nitrogen input and output flows. Methodologically, the approach is considered mixed, consisting of a case study and based on quantitative and qualitative techniques. Flowcharts and indicators were elaborated to evaluate nitrogen flows over time. The results were confirmed through semi-structured interviews. The results indicated that production based on economic efficiency is one of the main factors transforming the livestock system. The transformation of the production system into livestock did not reduce nitrogen flows. Productive and economic indicators reaffirm the transformation and volatility of livestock systems under economic and political contexts, even in an environmental protection unit.

1. Introduction

In recent decades, significant changes have driven the advance of agricultural production systems in Brazil, especially in the Pampa biome. The Pampa is composed of natural pastures with significant biodiversity. The biome also stands out for its abundance of water [1,2]. In Brazil, the Pampa biome is located entirely in the state of Rio Grande do Sul, occupying an area of 63% of its territory.
According to Nicoloso et al. [3], Silva et al. [4] and Nabinger [5], the advance of agriculture, especially soybean, has caused changes in the biome’s landscapes. These changes are associated with technological gains in areas such as infrastructure, machinery and equipment, management techniques, and biochemical and genetic technologies for crop adaptations [6]. Today, only 0.5% of the Pampa area is included in an Environmental Protection Area for sustainable use [7].
Environmental protection units of sustainable use have as their objectives the conservation of ecosystems and the maintenance of agricultural production through following guidelines for the management and conservation of natural resources [
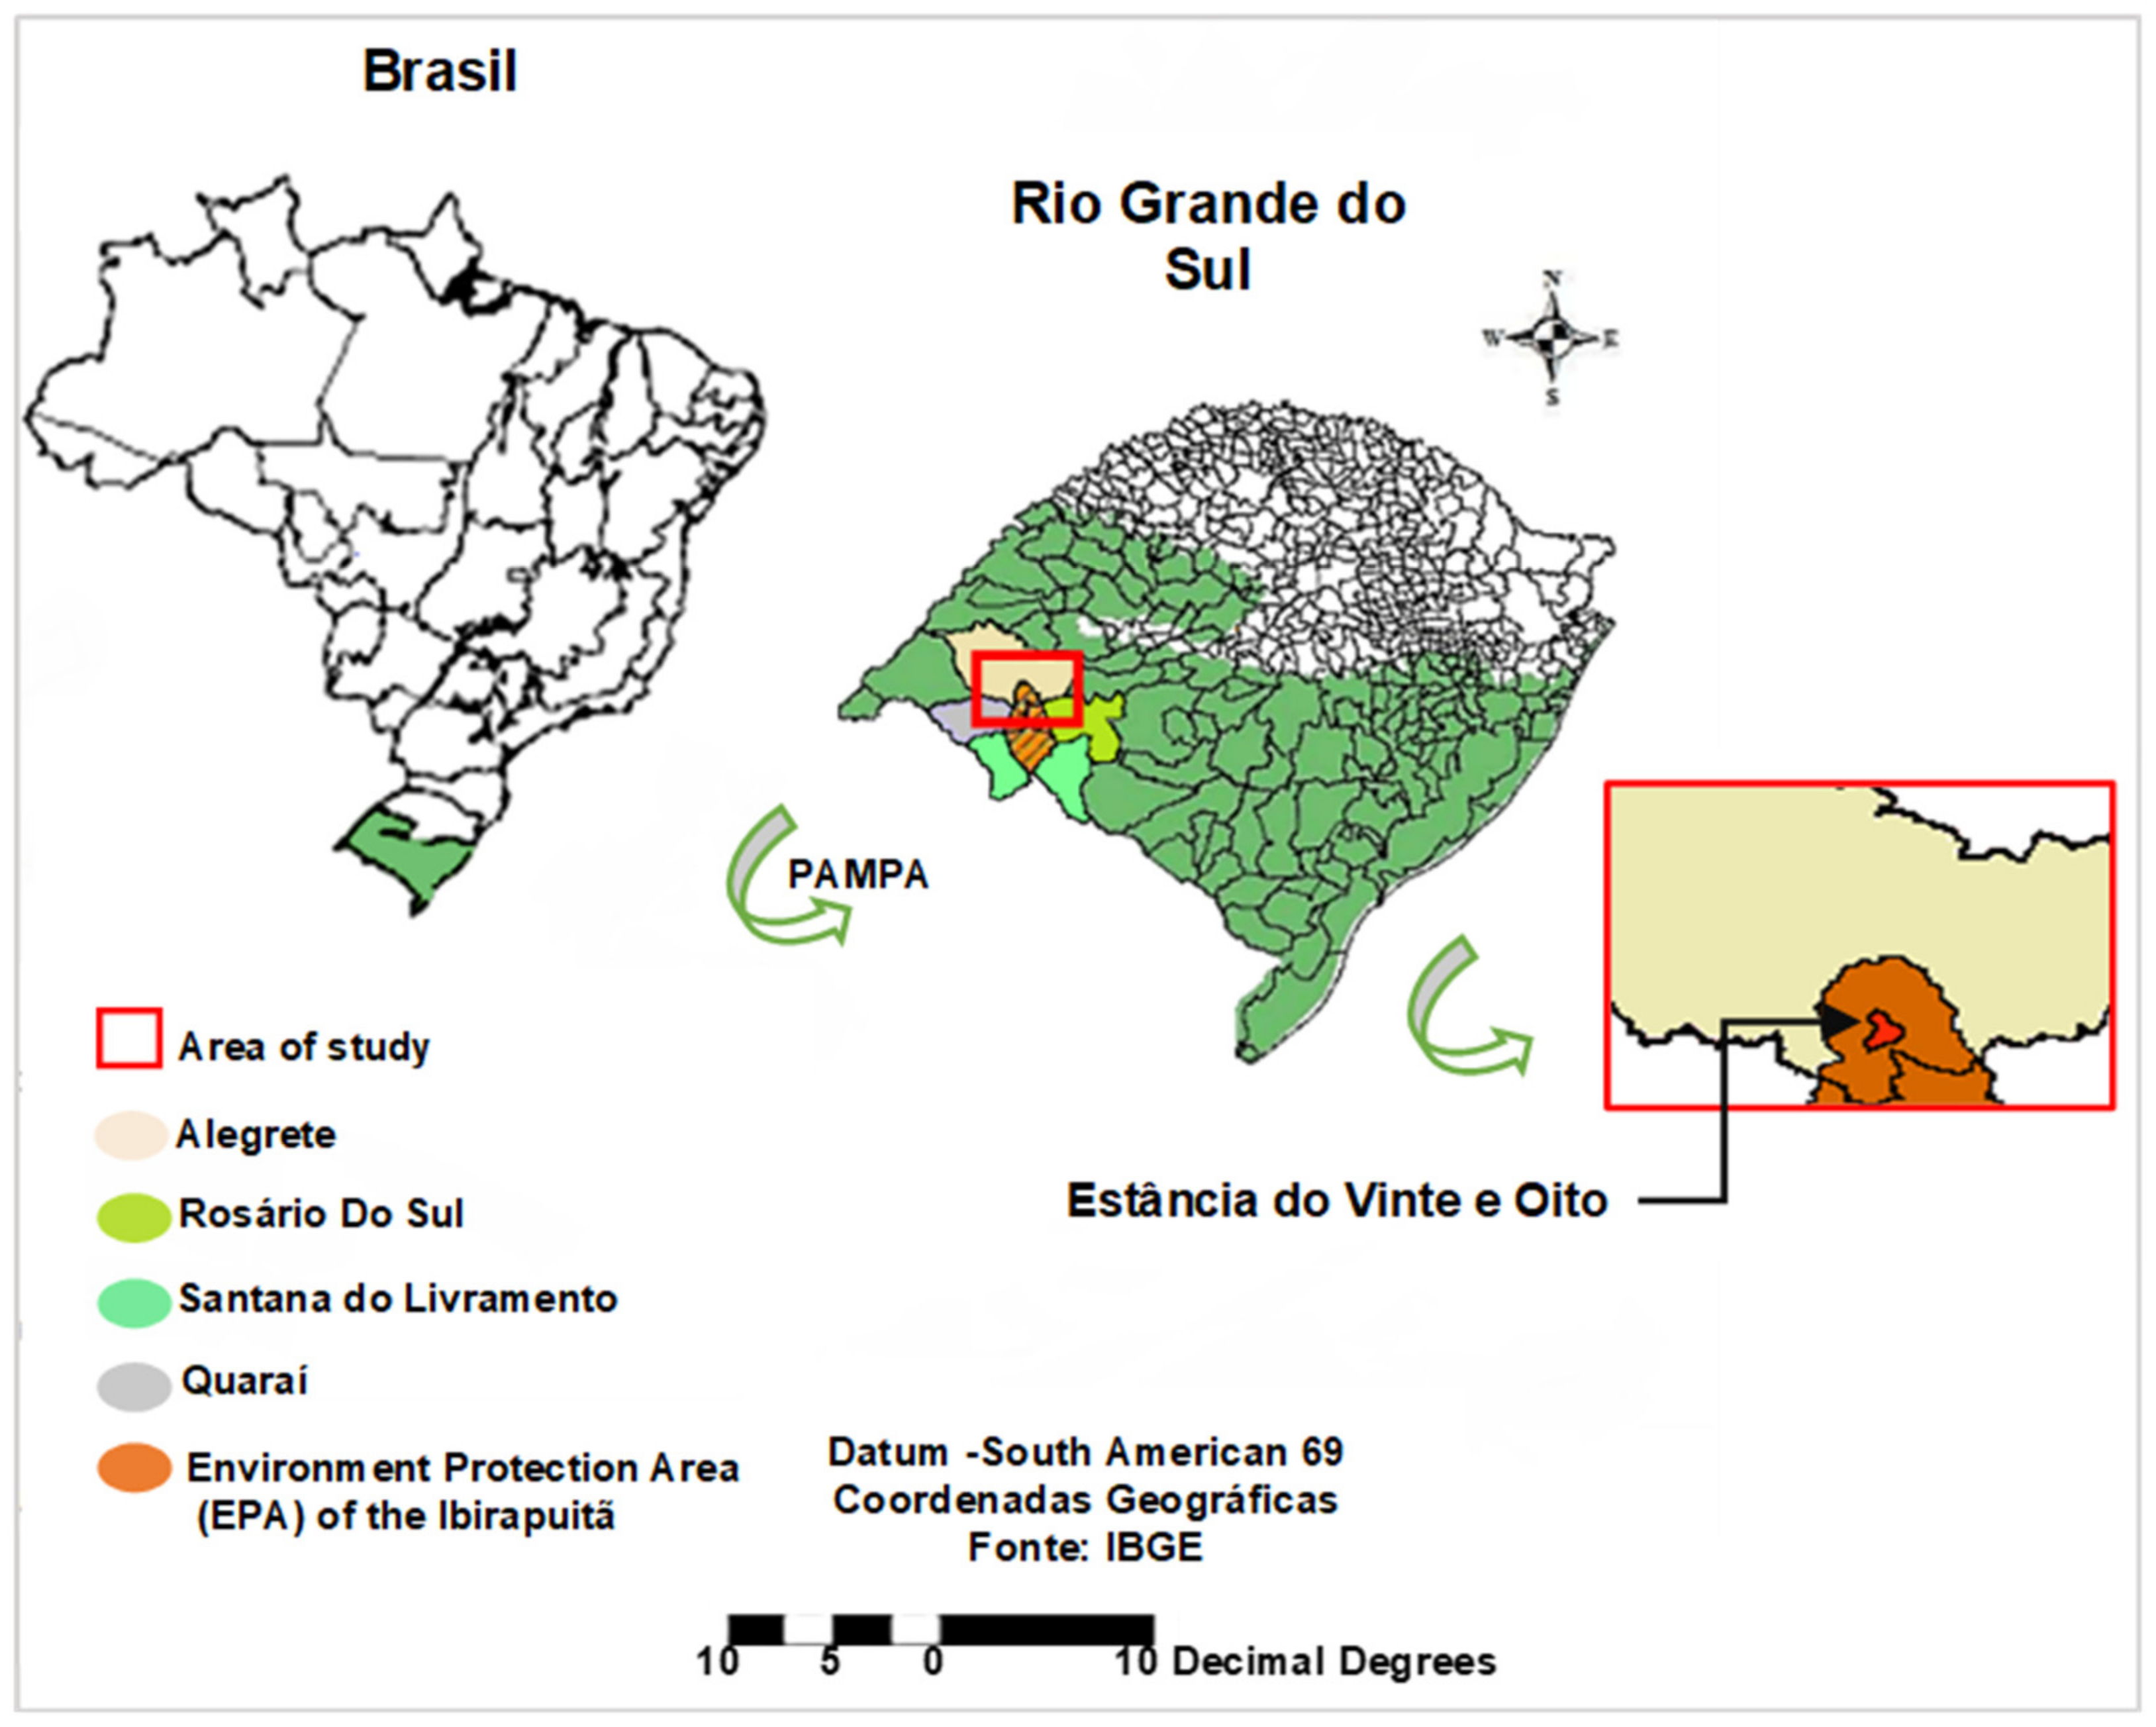
8]. Therefore, the main current form of conservation in the Pampa biome is the maintenance of protected areas in conjunction with livestock production systems. Our study aims to characterize the evolution of the agricultural system in the only environmental protection unit of the Pampa biome in Brazil: the Ibirapuitã EPA (Environmental Preservation Area). The main form of production in the EPA is cattle raising [9]; however, in the last twenty years, about 50% of the natural vegetation of the biome has been transformed into agricultural land, mainly due to the expansion of grain production and the intensification of livestock farming [10,11].
In this sense, to maintain a high level of production and reduce possible environmental impacts, it is essential to know the characteristics of production systems and their material flows, especially those located in environmental protection units [12]. Thus, the objective of this study is to analyze the efficiency and transformation of the agricultural production system in the Ibirapuitã EPA through nitrogen input and output flows. Studies in this sense are useful for understanding the efficiency of agricultural production systems and how they interfere with the environment [13,14,15].

2. Materials and Methods

This study has a descriptive nature, describing the evolution of the production system of the EPA using quantitative and qualitative data. The research is based on the concept of Territorial Metabolism to evaluate the biophysical dimension of the links between man and the environment. The originality of the study is to use two methodologies: (I) an analysis of material flows to quantify all material flows in and out of the territory, as well as indicators of productivity and efficiency of the production system [16,17,18]; (II) an economic analysis from EPA accounting data.

2.1. Characterization of the EPA Territory

The case studied is the agricultural system called Estância do Vinte e Oito, located in the Ibirapuitã EPA, in the municipality of Alegrete, Rio Grande do Sul, Brazil (Figure 1). It is specifically located between the coordinates latitude 29°05′ S to 30°51′ S and longitude 55°29′ W to 55°53′ W. This farm has a total area of 2381 hectares. The activities developed in recent years at the Estância do Vinte e Oito are rice crops (maximum of 70 ha) and beef cattle (between 1700 and 1900 ha), the latter being the farm’s main economic activity. The natural pastures composed mainly of native species (approximately 1600 ha) are the main basis for cattle feed.
The botanical composition varies according to the type of soil on which they grow. There is a significant variation in the quality and quantity of pasture produced as a result of climatic and soil conditions [19]. Aiming at the availability of quality forage in the critical periods of grassland production, pastures of winter–spring production species are cultivated (300 ha) in the areas that allow good yields. The cattle herd varies between 2200 and 2350 head, and the proportion of breeding and fattening animals is variable [19]. This beef cattle system and its evolution is representative of the livestock areas of the region [3,20].

2.2. Data Collection and Analysis Techniques

Data collection was carried out through document analysis of the General Cash Book and Accounting Ledger between 2010, 2015, and 2020. Semi-structured interviews and observations were also carried out on the farm to collect data and understand the operation of the system and production strategies. The interviews were applied to the technical and administrative sector of the Estância do Vinte e Oito.
The identification of the analysis period was carried out based on annual clippings that demonstrate the transformation of the production system at the Estância do Vinte e Oito, leading to the definition of the years 2010, 2015, and 2020. These periods were not characterized by unusual situations or abnormal climatic events in the production system under study.
Following the methodologies of Territorial Metabolism (I) and economic analysis (II) [21], we collected data on all land use (crops, natural pastures, cultivated pastures), inputs (fertilizers, seeds, veterinary inputs), and cattle herd structure throughout the year (birth, purchases, and sales of animals). We also collected bio-technical data (stocking rate, off-take rate, live weight of animals) and economic data (income, purchases, production costs). The data collected are accurate and were documented through the Referential Chart of Accounts of the Federal Revenue of Brazil made available by the administration of the farm.
After the inventory was completed, the nitrogen variables were measured (Table 1), and the input and output flows and balances of the production system were represented graphically based on ISO 9000 symbology [22]. The amount in kilograms (kg) of nitrogen in each production process was represented by the width of the flow, so flows with greater thickness represent a greater movement of the amount of nitrogen in the production system.
Economic and production variables as well as nitrogen variables were measured using production system indicators (Table 2). The indicator modelling allowed for the identification of changes in the nitrogen inputs and outputs of the livestock system over the years, and the profitability and productivity of the production system.

3. Results

From 2010 to 2020, the total area of the Estância do Vinte e Oito remained at 2381 hectares and showed variations in the different production areas (Figure 2). Between 2010 and 2015, rice production occurred in an area of 70 hectares. During this period, the area allocated to pasture was approximately 1764 hectares, with 1664 hectares of natural field and approximately 100 hectares of pasture cultivated with oats. As of 2016, no rice was cultivated and the area was deployed as pasture, thus the production system became only livestock. Therefore, between 2015 and 2020, the area of cultivated pasture increased by 200% (300 hectares), occupying the area of rice farming and part of the natural field, which resulted in a reduction in the natural field (1604 hectares) due to the specialization of the system and the improvement and intensification of the pastoral system.
Throughout the study period (Figure 2), we identified a decrease in the total live weight of the herd, even though the number of heads increased (3.88%), due to the change in the structure of the herd, whereby younger animals with lower weight began to be marketed. In 2010 cows, steers, bulls, and calves were marketed, and in 2015 cows with low productivity were discarded, which led to the improvement of the herd in the following years and the progressive transformation of production. Thus, in 2020, cattle production became focused on steers and calves, aiming to improve productivity per hectare. It was observed that the cattle stock between 2010 and 2020 increased from 2268 to 2351 heads; on the other hand, the animal load was lower in 2020 (Figure 2, Table 3 and Table 4) due to the improvement in zootechnical indices, where the animals started to reach the weight for slaughter or marketing before 24 months.
The N conversion ratio (N inputs to herd) to carcass production decreased during the study period. That is, in 2020, producing 1 kg of carcass required 0.10 kg of N (Table 5). In 2010 and 2015, feeding was based on grazing the natural field (1664 ha) and a 100 ha area of cultivated pasture, and feed was also used to supplement cattle feed (48.97 kg/N). However, between 2015 and 2020, there was an increase in synthetic N inputs intended exclusively for livestock feed, through the use of feed (1494% in the system in KG/N), seed, and fertilizer for cultivated pasture (11%/ha kgN/ha). Synthetic fertilization of natural pasture is performed when low-quality pasture is found [34], in this case in 2015, aiming to maintain the productivity and availability of pasture.
Thus, between 2010, 2015, and 2020, the use of synthetic fertilizers in the pasture area (natural and cultivated) increased from 2.08 kg N/ha/year to 5.81 kg N/ha/year (Figure 2) due to the increase in the area of cultivated pasture and the intensification of synthetic fertilization in this area, aiming for greater pasture productivity for cattle. It was found that by 2020 the natural field used for grazing decreased by 60 ha, thus biological fixation was also reduced. The cultivated pasture and rice area did not show biological fixation because they are grasses. Atmospheric deposition did not change during the study period.
Leaching losses are not accounted for in pasture systems in Brazil [35,36,37]. Therefore, only runoff and leaching losses of N from the (synthetic) fertilizers applied to the cultivated pasture, natural field, and rice crop were considered, thus leaching increased proportionally to 0.22% for each kilogram of synthetic N used. The results of the system under study (Figure 2) showed that the losses of synthetic N and excretion are less than 1% for direct and indirect nitrification, and through volatilization are less than 15% for synthetic N and 12% for excretion [31,38]. In this context, in 2020, synthetic N losses were much higher than in 2010.
The N surplus was found to increase by 5.97% from 2010 to 2020 for livestock and remained negative for rice farming (Table 3).
Table 3. Nitrogen indicators for beef cattle, rice, and production system (kg N ha−1 year).
Biological Indicators (N)Period
201020152020
Beef cattleN inputs kg ha−133.0234.0934.91
N outputs kg ha−18.659.688.99
N surplus kg ha−124.3724.4125.92
RiceN inputs kg ha−141.5332.55-
N outputs kg ha−1104.58105.95-
N surplus kg ha−1−63.05−73.40-
SystemN inputs kg ha−133.3434.0334.91
N outputs kg ha−112.3113.358.99
N surplus kg ha−121.0320.6825.92
Rice crop flows are marked by low N inputs; in counterpoint, the proportion of N outputs through rice marketing is higher than livestock, approximately 95.93 kg N ha−1 more in 2010 and 96.27 Kg N ha−1 in 2015 (Table 3). On the other hand, N outputs in livestock remained between 8.65 kg ha−1 and 8.99 kg ha−1 (Table 3). Regarding rice farming, it was observed that N inputs decreased for fertilizers (34.20%) and seeds increased by 36%, between 2010 and 2015.
Therefore, the total N inputs per hectare of the production system increased by 4.70%, occasioned by the increase in synthetic N in cultivated pasture and the improvement of natural pasture (Table 3). In counterpoint, the total outputs decreased by 26.96%, providing the system with increased surplus N. It was observed that between 2010, 2015, and 2020, the N surplus increased by 5.97% for livestock and remained negative for rice farming (Table 3). Thus, the N balance for rice cultivation has the opposite behavior to that of livestock.

Productive and Economic Indicators of the Production System

Between 2010 and 2020, the offtake and weaning rates were higher (Table 4), providing in 2020 the production of 565 calves. The structure of the breeding herd produced approximately 800 calves, subdivided into 50% cows with calf, 24% primiparous cows, and 26% heifers in 2020.
Table 4. Productive indicators of the livestock production system in the period under analysis.
Production IndicatorsPeriod
201020152020
Herd slaughter rate14.70%22.88%19.43%
Kg BW ha−168.15121.0699.61
Weaning rate47%53.77%61.46%
Cattle stocking (AU ha−1)1.111.131.06
The table was calculated as shown in Table 2.
The results showed the search for a standardization of the cattle herd and carcasses to facilitate health management in the winter period (rainy season) and direct the birth of calves in the summer period (Table 4). The standardization of the cattle herd in kilos of carcass aimed to improve marketing and access to new markets, as well as reduce the operating costs of the system. The positive economic indicators, such as the increase in the profitability margins of beef cattle, were the result of the adoption of a new management model, which aimed to reduce costs, intensify the productivity of the system, and adapt to the climatic conditions of the region (Table 5).
Table 5. Total revenue, operating cost, and operating margin for rice, livestock, and system activities (total) in the period under analysis.
Economic Indicators (USD)Period
201020152020
Beef cattleRevenue ha−1113.42183.67155.49
Cost ha−182.17147.1381.26
Margin ha−131.2436.5374.23
RiceRevenue ha−11448.751881.79-
Cost ha−12800.112069.58-
Margin ha−1−1351.35−187.78-
SystemRevenue ha−1164.39248.48155.49
Cost ha−1185.91220.5181.26
Margin ha−1−21.5227.9774.23
Thus, by removing the rice crop from the production system, the profit margin increased. This is because rice has a high production cost (Table 5). The N efficiency increased by 43.27% during the study period (Table 6) because, even with the increase in N inputs in livestock, the number of animals (carcasses) sold was higher in 2020 (N outputs in marketing) due to the change in herd structure, where a greater number of animals started to be marketed. In other words, in livestock, the lower the N inputs and the higher the N outputs of commercialization, the higher the efficiency. There was a lower rate of self-sufficiency in 2020 (82.62%) when compared to 2010 when the system was 90.41% self-sufficient (Table 6). The N surplus points out that the high export of N in rice grain did not meet the demand for synthetic N or fertilizers for tillage, thus the crop removed N from the system and obtained a negative balance compared to livestock, which provided better efficiency in 2020.
Consequently, it was identified that the system spent 64.54% less in 2020 to produce surplus N. Therefore, the change in the organizational structure increased productivity (Table 4), reduced operating costs, and provided more profitability (Table 5 and Table 6). It is noteworthy that the use of techniques that preserve natural resources provided an increase in the level of production in the Ibirapuitã EPA between 2010 and 2020.

4. Discussion

This study analyzed the changes in the livestock system in three periods. The first period, 2010, combined the expansion of pasture areas with the rice production system. The second period, 2015, combined pasture expansion and investments to improve livestock production. From this period on, the system ceased to be agropastoral and became only livestock. Finally, the third period, 2020, corresponded to the expansion of beef cattle and consolidation of the intensification of production, through the specialization of calf and steer production, improvement of zootechnical indicators, and pasture management.
When analyzing the transformation of rice crops into cultivated pasture, the search for a greater profitability of the production system was observed. Rice crops are more costly in terms of production costs such as labor and fuel when compared to livestock and other grain production systems [39]. In the same way, Mandarino et al. [40] have shown that production systems can double or triple their production with the use of system-adapted management.
On the other hand, however, productive specialization, reflected in new investments in pasture maintenance, resulted in a more profitable system. Therefore, the beef cattle system of Estância do Vinte e Oito went through a readjustment of the productive process. These transformations, according to Rhoden et al. [39], Mandarino et al. [40], and Vargas et al. [41], were influenced by economic factors such as the cost of production, the expansion of livestock marketing, and the change in land use around the EPA. The increase in international grain prices, especially soybeans, productivity gains, and the strengthening of credit policies for agricultural production have contributed significantly to this expansion and globalization of the agricultural chain [4,39].
The number of heads of cattle remained stable in the analyzed period. This maintenance is possibly due to the gains in cattle productivity obtained through the higher reproductive efficiency, observed as a result of the focus on breeding systems and the supply of better-quality pastures (cultivated and improvement of the quality of the natural field) and with the addition of feed with protein (N). In this perspective, EMBRAPA [6] demonstrated that the structure of the cattle herd showed greater reproductive efficiency through the focus on breeding systems where, from 2010 to 2020, it was possible to observe that in the municipalities that make up the Ibirapuitã EPA, the herd in breeding systems increased from 286,706 to 292,162 heads.
The Estância do Vinte e Oito no longer performs the complete cycle of livestock farming and sought a more specialized production in breeding and rearing, which has resulted in a greater economic production efficiency of the cattle herd and profitability of the production system. According to Elias [42], this demonstrates the increase in the scope of the market, driven by the bonus of commercialization and the globalization and standardization of the agricultural and cattle beef chain, and consequently in productive specialization.
Therefore, these changes in the cattle herd structure can affect the entire region of the EPA, making it specialized in beef cattle, especially in breeding systems, providing a better economic exploitation of beef cattle in the Pampa. It is also possible that the specialization of beef cattle will occur in other regions, in breeding and fattening systems, due to the soil and climate conditions typical of each region and better access to markets for commercialization. In this context, Gottschall et al. [43] demonstrated that the standardization of the cattle herd and carcasses aims to facilitate health management and improve the marketing stage.
According to Lassaletta et al. [21,29], an increase in the plant protein required to produce the same amount of animal protein is expected, which did not occur during the period under study. This is due to the decrease in herd weight for marketing and the increase in pasture area. N efficiency in the case under study is still considered low [44]. For South America, [16] calculates a livestock N efficiency of 6.3%. For Brazil, [45] estimated an N efficiency in beef cattle production of 5.2% in 2013. These values are higher than those found at Estância do Vinte e Oito. This is justified by a greater proportion of intensive animal production at the national level and by the system of the Estância do Vinte e Oito having undergone a production transformation with an emphasis on improving the rearing rates; this provided a greater profit margin through the sale of younger and heavier animals.
Regarding the inputs and outputs and the surplus of N, Yanni et al. [46] point out that the high export of N in rice grain cannot meet the demand for synthetic N for the crop; in the same way, the rice crop removed N from the system under study and resulted in a negative balance compared to livestock, which provided better efficiency in 2020. Consequently, it generated a greater dependence of the system on external inputs, reducing its self-sufficiency, but with lower costs. According to Rezende et al. [47], self-sufficiency values above 95% are considered high.
According to Billen et al. [44], excess N (values greater than 40 kg/ha/N) determines losses from the soil to the environment, such as N leaching, which did not occur in the case under study. According to Leinonen et al. [48], part of the excess N can also be stored in soil organic matter, depending on the management used and climatic conditions. It can also facilitate the utilization of nutrients by the production system and the production cost of surplus N that stays in the system [49]; this corroborates with the results of surplus N found at Estância do Vinte Oito. Therefore, this indicator can contribute to the monitoring of N and nutrient flows in the system and to the plausible use of synthetic N, as well as N from animal excreta. It is observed that one of the barriers in grain and livestock production is the balance of nutrients in the system [49]. Negative balance can cause low soil fertility and decrease production. On the other hand, a positive N surplus can promote environmental contamination or contribute to the reuse of the nutrient [49].
The system under study has been influenced by the economic dynamics of the territory, arising from the pressure of grain production systems in the region and the search for increased profit margins in livestock, making it less self-sufficient. Therefore, according to Carneiro [50] and Frederico [51], the pasture structure follows the productivist line and the inputs come in a globalized package. From this perspective, there is a potential to increase animal production. The factors determining the occupation of land areas are important, and the competition for land use related to an intensification of grain systems, especially soybeans, stands out [52,53]. Thus, an increase in the production of livestock systems depends not only on land monitoring but also on a positive economic context [54,55].
According to a technical report [30] on Latin America presented in 2022, the effective N balance is approximately 6.0 thousand tons per hectare; in this perspective, the increased demand for N may not be met. Similarly, in Brazil, the amount of N produced is considered low, not meeting the domestic needs for agricultural production [56]. Therefore, the importation of fertilizers in general, including nitrogen, is necessary [57,58,59].
In this context, the indicators can be combined to find the ideal balance of nutrients, especially nitrogen, in production systems, coupled with the biological needs for and the cost of N in the system. This is one of the challenges in the productive systems of Brazilian agriculture and beef cattle [48]. From this perspective, there is a potential to increase livestock production within the EPA in a sustainable manner, according to the results found in the case study, which serves as an example for other livestock systems in Environmental Preservation Areas.

5. Conclusions

This study analyzed the changes in the livestock system in an environmental protection unit in three periods. The first period (2010) combined low-cost territorial expansion through grazing areas in conjunction with a rice production system. The second period (2015) was characterized by investments in improving livestock production to replace the rice production system. Finally, the third period (2020) corresponded to the consolidation of the intensification of beef cattle and its expansion of production.
It was identified that production based on economic efficiency is one of the main factors in the transformation of the production system. This is associated with the low economic outcome of livestock production systems in natural grasslands compared to grain production, as in other regions of the world. The indicators showed that the establishment of cultivated pasture areas is not related to herd size but to production intensification.
It is noteworthy that the end of rice cultivation did not bring a reduction in nitrogen flows in the system. On the contrary, the need to intensify beef cattle farming to replace the economic gains from rice crops brought an increase in N inputs into the system. Consequently, there was a reduction in the interplay of system flows within the local territory and in the N inputs and outputs of the system, resulting in the maximization of global flows (marketing with global meatpackers).
This fact results from the pressure of agriculture on the territory, and the change in land use in the territory. Although the Ibirapuitã EPA contributes to the conservation of the territory, intensification and land use change are associated with the expansion of grain production and livestock farming, encouraging the transformation of extensive systems into intensive agricultural production systems. Therefore, the production transformation with emphasis on improving rearing rates provided increased N efficiency in the Estancia do Vinte e Oito livestock production system.
The productive and economic indicators reaffirm the transformation and volatility of beef cattle farming in the face of economic and political contexts, even in an environmental protection unit. It is necessary to develop a representative public policy for the Ibirapuitã EPA of the Brazilian Pampa that offers subsidies and stimulates the sustainable use of natural resources, supporting the conservation of ecosystem services in relation to beef cattle. Such policies can be a model for similar protected areas in Brazil and around the world.

Author Contributions

Conceptualization, A.C.R., J.G.A.V., V.C.P.S. and T.C.B.; methodology, A.C.R., J.G.A.V., V.C.P.S. and T.C.B.; software, A.C.R., J.G.A.V., V.C.P.S. and T.C.B.; validation, A.C.R., J.G.A.V., V.C.P.S. and T.C.B.; formal analysis, A.C.R., J.G.A.V., V.C.P.S. and T.C.B.; investigation, A.C.R., J.G.A.V., V.C.P.S. and T.C.B.; data curation, A.C.R., J.G.A.V., V.C.P.S. and T.C.B.; writing—original draft preparation, A.C.R., J.G.A.V., V.C.P.S. and T.C.B.; writing—review and editing, A.C.R., J.G.A.V., V.C.P.S., T.C.B. and G.V.K.; visualization, A.C.R., J.G.A.V., V.C.P.S., T.C.B. and G.V.K.; supervision, A.C.R., J.G.A.V., V.C.P.S. and T.C.B.; project administration, J.G.A.V., V.C.P.S. and G.V.K.; funding acquisition, J.G.A.V., V.C.P.S. and G.V.K. All authors have read and agreed to the published version of the manuscript.

Funding

This research was funded by Conselho Nacional de Desenvolvimento Científico e Tecnológico (CNPq, Proc. 441428/2017-7) and Coordenação de Aperfeiçoamento de Pessoal de Nível Superior (CAPES-PrInt, Proc. 8881.310240/2018-01). The APC was funded by CAPES-PrInt (Proc. 8881.310240/2018-01).

Institutional Review Board Statement

Not applicable.

Data Availability Statement

The data presented in this study are available on request from the corresponding author.

Acknowledgments

The authors acknowledge the CAPES and CNPq for providing financial support for this work.

Conflicts of Interest

The authors declare no conflict of interest.

References

  1. Andrade, B.O.; Marchesi, E.; Burkart, S.; Setubal, R.B.; Lezama, F.; Perelman, S.; Schneider, A.A.; Trevisan, R.; Overbeck, G.E.; Boldrini, I.I. Vascular Plant Species Richness and Distribution in the Río de La Plata Grasslands. Bot. J. Linn. Soc. 2018, 188, 250–256. [Google Scholar] [CrossRef]
  2. Valério De Patta, P. Campos-Outcalt Responds. Am. J. Public Health 1999, 89, 1271. [Google Scholar] [CrossRef]
  3. Nicoloso, C.d.S.; Silveira, V.C.P.; Coelho Filho, R.C.; de Quadros, F.L.F. Typology of Family Livestock Production Systems in the Pampa Biome Using the MESMIS Method. Semin. Ciências Agrárias 2019, 40, 3249. [Google Scholar] [CrossRef]
  4. Silva, C.S.D.; Viana, J.G.A. Instituições Na Pecuária de Corte E Sua Influência Sobre O Avanço Da Sojicultura Na Campanha Gaúcha—Brasil. Rev. Econ. Sociol. Rural 2020, 58, e214991. [Google Scholar] [CrossRef]
  5. Nabinger, C. Diagnóstico de Sistemas de Produção de Bovinocultura de Corte Do Estado Do Rio Grande Do Sul, Brasil (2003–2004); Relatório, IEPE/UFRGS: Porto Alegre, Brazil, 2005; 265p. [Google Scholar]
  6. EMBRAPA. Indicadores de Desempenho Na Pecuária de Corte: Uma Revisão No Contexto Da Plataforma + Precoce; EMBRAPA: Brasília, Brazil, 2018; p. 32. [Google Scholar]
  7. Overbeck, G.E.; Müller, S.C.; Fidelis, A.; Pfadenhauer, J.; Pillar, V.D.; Blanco, C.C.; Boldrini, I.I.; Both, R.; Forneck, E.D. Brazil’s Neglected Biome: The South Brazilian Campos. Perspect. Plant Ecol. Evol. Syst. 2007, 9, 101–116. [Google Scholar] [CrossRef]
  8. Oliveira, U.; Soares-Filho, B.S.; Paglia, A.P.; Brescovit, A.D.; de Carvalho, C.J.B.; Silva, D.P.; Rezende, D.T.; Leite, F.S.F.; Batista, J.A.N.; Barbosa, J.P.P.P.; et al. Biodiversity Conservation Gaps in the Brazilian Protected Areas. Sci. Rep. 2017, 7, 9141. [Google Scholar] [CrossRef] [Green Version]
  9. IUCN. International Union for Conservation of Nature’s Guidelines for Application of IUCN Red List Criteria at Regional and National Levels; Version 4.0; IUCN: Fontainebleau, France, 2010; Volume 4. [Google Scholar]
  10. Le Féon, V.; Poggio, S.L.; Torretta, J.P.; Bertrand, C.; Molina, G.A.R.; Burel, F.; Baudry, J.; Ghersa, C.M. Diversity and Life-History Traits of Wild Bees (Insecta: Hymenoptera) in Intensive Agricultural Landscapes in the Rolling Pampa, Argentina. J. Nat. Hist. 2016, 50, 1175–1196. [Google Scholar] [CrossRef]
  11. Viana, J.G.A.; Fagundes, T.T.; Troian, A.; Fleck, C.F. Evolução Do Crédito Rural No Rio Grande Do Sul: Análise Por Atividade E Finalidade Dos Recursos de 2006 a 2018. Rev. Agronegócio Meio Ambiente 2021, 14, e7686. [Google Scholar] [CrossRef]
  12. de Oliveira, T.E.; de Freitas, D.S.; Gianezini, M.; Ruviaro, C.F.; Zago, D.; Mércio, T.Z.; Dias, E.A.; do Nascimento Lampert, V.; Barcellos, J.O.J. Agricultural Land Use Change in the Brazilian Pampa Biome: The Reduction of Natural Grasslands. Land Use Policy 2017, 63, 394–400. [Google Scholar] [CrossRef]
  13. Cesar, A.; Marques, R.; Medina, E.; Izaguirre, M.L.; Federal, U.; Grande, R.; Molecular, B.; Molecular, B. Diversidade de Rizóbios Associados a Legumes Nativos Dos Campos Sulinos Do Rio Grande Do Sul—Brasil Fernanda Da Silva Moreira. Trop. Ecol. 2004, 45, 87–95. [Google Scholar]
  14. Spiess, E. Nitrogen, Phosphorus and Potassium Balances and Cycles of Swiss Agriculture from 1975 to 2008. Nutr. Cycl. Agroecosyst. 2011, 91, 351–365. [Google Scholar] [CrossRef]
  15. Matsumoto, N.; Paisancharoen, K.; Ando, S. Effects of Changes in Agricultural Activities on the Nitrogen Cycle in Khon Kaen Province, Thailand between 1990–1992 and 2000–2002. Nutr. Cycl. Agroecosyst. 2010, 86, 79–103. [Google Scholar] [CrossRef]
  16. Billen, G.; Lassaletta, L.; Garnier, J. A Vast Range of Opportunities for Feeding the World in 2050: Trade-off between Diet, N Contamination and International Trade. Environ. Res. Lett. 2015, 10, 025001. [Google Scholar] [CrossRef]
  17. Bonaudo, T.; Piraux, M.; Gameiro, A.H. Analysing Intensification, Autonomy and Efficiencies of Livestock Production through Nitrogen Flows: A Case Study of an Emblematic Amazonian Territory. Agric. Syst. 2021, 190, 103072. [Google Scholar] [CrossRef]
  18. Le Noë, J.; Billen, G.; Garnier, J. How the Structure of Agro-Food Systems Shapes Nitrogen, Phosphorus, and Carbon Fluxes: The Generalized Representation of Agro-Food System Applied at the Regional Scale in France. Sci. Total Environ. 2017, 586, 42–55. [Google Scholar] [CrossRef]
  19. FUNDAÇÃO MARRONA. Estância Do Vinte E Oito; Infraestrutura: Alegrete, Brazil, 2021; 3p. [Google Scholar]
  20. Marques, A.C.R.; de Oliveira, L.B.; Schwalbert, R.; Del Frari, B.K.; Brunetto, G.; de Quadros, F.L.F.; Nabinger, C.; Nicoloso, F.T. Growth Strategies as Determinants of CO2 Sequestration and Response to Nitrogen Fertilisation in C4 Grasses in South American Natural Grasslands. Crop Pasture Sci. 2020, 71, 776. [Google Scholar] [CrossRef]
  21. Lassaletta, L.; Billen, G.; Grizzetti, B.; Garnier, J. The Relationship between Crop Yield and Nitrogen Input to Cropland in 131 Countries: 50 Years Trends. In Proceedings of the 18th Nitrogen Workshop—The Nitrogen Challenge: Building A Blueprint for Nitrogen Use Efficiency and Food Security, Lisbon, Portugal, 30 June–3 July 2014; pp. 545–546. [Google Scholar]
  22. NBR ISO 9000/2000; Sistema de Gestão Da Qualidade: Fundamentos E Vocabulário. Editora Abril: Rio de Janeiro, Brazil, 2004; 26p.
  23. Dentener, F.; Drevet, J.; Lamarque, J.F.; Bey, I.; Eickhout, B.; Fiore, A.M.; Hauglustaine, D.; Horowitz, L.W.; Krol, M.; Kulshrestha, U.C.; et al. Nitrogen and Sulfur Deposition on Regional and Global Scales: A Multimodel Evaluation. Global Biogeochem. Cycles 2006, 20, 20. [Google Scholar] [CrossRef]
  24. Medeiros, S.R.; Gomes, R.d.C.; Bungenstab, D.J. Nutrição de Bovinos de Corte Fundamentos E Aplicações; Embrapa: Brasilia, Braizl, 2015; 178p. [Google Scholar]
  25. Meinzen-Dick, R.; Johnson, N.; Quisumbing, A.R.; Njuki, J.; Behrman, J.A.; Rubin, D.; Peterman, A.; Waithanji, E. The Gender Asset Gap and Its Implications for Agricultural and Rural Development. In Gender in Agriculture; Springer: Dordrecht, The Netherlands, 2014; pp. 91–115. [Google Scholar]
  26. Weber, F.H.; Gutkoski, L.C.; Elias, M.C. Caracterização Química de Cariopses de Aveia (Avena sativa L.) Da Cultivar UPF 18. Ciência Tecnol. Aliment. 2002, 22, 39–44. [Google Scholar] [CrossRef] [Green Version]
  27. Walter, M.; Marchezan, E.; de Avila, L.A. Arroz: Composição E Características Nutricionais. Ciência Rural 2008, 38, 1184–1192. [Google Scholar] [CrossRef] [Green Version]
  28. Van der Hoek, K.W. Nitrogen Efficiency in Global Animal Production. Environ. Pollut. 1998, 102, 127–132. [Google Scholar] [CrossRef]
  29. Lassaletta, L.; Billen, G.; Grizzetti, B.; Anglade, J.; Garnier, J. 50 Year Trends in Nitrogen Use Efficiency of World Cropping Systems: The Relationship between Yield and Nitrogen Input to Cropland. Environ. Res. Lett. 2014, 9, 105011. [Google Scholar] [CrossRef]
  30. FAO—Food and Agriculture Organization of The United Nations. World Fertilizer Trends and Outllok to 2022; FAO: Rome, Italy, 2019. [Google Scholar]
  31. D’aurea, A.P.; da Silva Cardoso, A.; Guimarães, Y.S.R.; Fernandes, L.B.; Ferreira, L.E.; Reis, R.A. Mitigating Greenhouse Gas Emissions from Beef Cattle Production in Brazil through Animal Management. Sustainability 2021, 13, 7207. [Google Scholar] [CrossRef]
  32. IPCC. Refinement to the 2006. IPCC Guidelines for National Greenhouse Gas Inventories; IPCC: Kyoto, Japan, 2019; 17p. [Google Scholar]
  33. Lassaletta, L.; Billen, G.; Garnier, J.; Bouwman, L.; Velazquez, E.; Mueller, N.D.; Gerber, J.S. Nitrogen use in the global food system: Past trends and future trajectories of agronomic performance, pollution, trade, and dietary demand. Environ. Res. Lett. 2016, 11, 095007. [Google Scholar] [CrossRef]
  34. Silveira, V.C.P.; Vargas, A.F.d.C.; Oliveira, J.O.R.; Gomes, K.E.; Motta, A.F. Qualidade Da Pastagem Nativa Obtida Por Diferentes Métodos de Amostragem E Em Diferentes Solos Na Apa Do Ibirapuitã, Brasil. Ciência Rural 2005, 35, 582–588. [Google Scholar] [CrossRef] [Green Version]
  35. Gonzatto, R.; Miola, E.C.C.; Doneda, A.; Pujol, S.B.; Aita, C.; Giacomini, S.J. Volatilização de Amônia E Emissão de Óxido Nitroso Após Aplicação de Dejetos Líquidos de Suínos Em Solo Cultivado Com Milho. Ciência Rural 2013, 43, 1590–1596. [Google Scholar] [CrossRef] [Green Version]
  36. Delaby, L.; Dourmad, J.-Y.; Béline, F.; Lescoat, P.; Faverdin, P.; Fiorelli, J.-L.; Vertès, F.; Veysset, P.; Morvan, T.; Parnaudeau, V.; et al. Origin, Quantities and Fate of Nitrogen Flows Associated with Animal Production. Adv. Anim. Biosci. 2014, 5, 28–48. [Google Scholar] [CrossRef]
  37. Zhang, J.; Liu, Y.; Dong, J. Responses of Alpine Soil Nitrification and Denitrification Rates to Nitrogen Addition Gradient—The Role of Functional Genes. Agriculture 2023, 13, 245. [Google Scholar] [CrossRef]
  38. Bretas, I.L.; Paciullo, D.S.C.; Alves, B.J.R.; Martins, M.R.; Cardoso, A.S.; Lima, M.A.; Rodrigues, R.A.R.; Silva, F.F.; Chizzotti, F.H.M. Nitrous Oxide, Methane, and Ammonia Emissions from Cattle Excreta on Brachiaria Decumbens Growing in Monoculture or Silvopasture with Acacia mangium and Eucalyptus Grandis. Agric. Ecosyst. Environ. 2020, 295, 106896. [Google Scholar] [CrossRef]
  39. Rhoden, A.C.; Viana, J.G.A.; Silveira, V.C.P. Change in Land Use and Economic Dynamics of the Ibirapuitã River Environmental Protection Area of the Brazilian Pampa Biome. Semin. Ciências Agrárias 2022, 43, 2137–2154. [Google Scholar] [CrossRef]
  40. Mandarino, R.A.; Barbosa, F.A.; Lopes, L.B.; Telles, V.; Florence, E.d.A.S.; Bicalho, F.L. Evaluation of Good Agricultural Practices and Sustaintability Indicators in Livestock Systems under Tropical Conditions. Agric. Syst. 2019, 174, 32–38. [Google Scholar] [CrossRef]
  41. Vargas, L.P.; Vargas, A.F.d.C.; Silveira, V.C.P. Ecosystem Services and Production Systems of Family Cattle Farms: An Analysis of Animal Production in Pampa Biome. Semin. Ciências Agrárias 2020, 41, 661–676. [Google Scholar] [CrossRef]
  42. Elias, D. Globalização e Fragmentação do Espaço Agrícola do Brasil. Scr. Nov. Rev. Electrónica Geogr. Y Ciencias Soc. 2006, X, 165. [Google Scholar]
  43. Gottschall, C.; Bittencourt, H.R.; Mattos, R.C.; Gregory, R.M. Retardo Da Realização Da IATF Sobre O Desempenho Reprodutivo Na Estação de Acasalamento de Vacas de Corte Lactantes. Arq. Bras. Med. Veterinária Zootec. 2012, 64, 295–304. [Google Scholar] [CrossRef] [Green Version]
  44. Billen, G.; Lassaletta, L.; Garnier, J. A Biogeochemical View of the Global Agro-Food System: Nitrogen Flows Associated with Protein Production, Consumption and Trade. Glob. Food Sec. 2014, 3, 209–219. [Google Scholar] [CrossRef]
  45. Gameiro, A.H.; Bonaudo, T.; Tichit, M. Nitrogen, Phosphorus and Potassium Accounts in the Brazilian Livestock Agro-Industrial System. Reg. Environ. Chang. 2019, 19, 893–905. [Google Scholar] [CrossRef]
  46. Yanni, S.F.; Whalen, J.K.; Simpson, M.J.; Janzen, H.H. Plant Lignin and Nitrogen Contents Control Carbon Dioxide Production and Nitrogen Mineralization in Soils Incubated with Bt and Non-Bt Corn Residues. Soil Biol. Biochem. 2011, 43, 63–69. [Google Scholar] [CrossRef]
  47. Rezende, V.T.; Bonaudo, T.; Alves, R.B.; Nacimento, R.A.; Gameiro, A.H. Cascade Effect of Nitrogen on Brazilian Soybean Production Chain. Nitrogen 2021, 2, 128–138. [Google Scholar] [CrossRef]
  48. Leinonen, I.; Eory, V.; MacLeod, M. Applying a Process-Based Livestock Model to Predict Spatial Variation in Agricultural Nutrient Flows in Scotland. J. Clean. Prod. 2019, 209, 180–189. [Google Scholar] [CrossRef]
  49. Rychel, K.; Meurer, K.H.E.; Getahun, G.T.; Bergström, L.; Kirchmann, H.; Kätterer, T. Lysimeter Deep N Fertilizer Placement Reduced Leaching and Improved N Use Efficiency. Nutr. Cycl. Agroecosyst. 2023, 126, 213–228. [Google Scholar] [CrossRef]
  50. Carneiro, F.L. Fragmentação Internacional da Produção e Cadeias Globais de Valor; IPEA: Brasilia, Brazil, 2015; 52p. [Google Scholar]
  51. Frederico, S. Agricultura Científica Globalizada E Fronteira Agrícola Moderna No Brasil. Confins 2013. [Google Scholar] [CrossRef]
  52. Depablos, L.; Homem, B.G.C.; Ferreira, I.M.; Bernardes, T.F.; Boddey, R.M.; Lara, M.A.S.; Casagrande, D.R. Nitrogen Cycling in Tropical Grass-Legume Pastures Managed under Canopy Light Interception. Nutr. Cycl. Agroecosyst. 2021, 121, 51–67. [Google Scholar] [CrossRef]
  53. Richter, J.; Roelcke, M. The N-cycle as determined by intensive agriculture—Examples from central Europe and China. Nutr. Cycl. Agroecosyst. 2000, 57, 33–46. [Google Scholar] [CrossRef]
  54. Cecchini, L.; Romagnoli, F.; Chiorri, M.; Torquati, B. Eco-Efficiency and Its Determinants: The Case of the Italian Beef Cattle Sector. Agriculture 2023, 13, 1107. [Google Scholar] [CrossRef]
  55. Feketéné Ferenczi, A.; Szűcs, I.; Bauerné Gáthy, A. Economic Sustainability Assessment of a Beekeeping Farm in Hungary. Agriculture 2023, 13, 1262. [Google Scholar] [CrossRef]
  56. Alves, L.A.; Denardin, L.G.d.O.; Martins, A.P.; Anghinoni, I.; Carvalho, P.C.d.F.; Tiecher, T. Soil Acidification and P, K, Ca and Mg Budget as Affected by Sheep Grazing and Crop Rotation in a Long-Term Integrated Crop-Livestock System in Southern Brazil. Geoderma 2019, 351, 197–208. [Google Scholar] [CrossRef]
  57. Cabon, F.; Girard, G.; Ledoux, E. Modelling of the Nitrogen Cycle in Farm Land Areas. Fertil. Res. 1991, 27, 161–169. [Google Scholar] [CrossRef]
  58. Simões, D.; Caixeta-Filho, J.V.; Palekar, U.S. Fertilizer Distribution Flows and Logistic Costs in Brazil: Changes and Benefits Arising from Investments in Port Terminals. Int. Food Agribus. Manag. Rev. 2018, 21, 407–422. [Google Scholar] [CrossRef]
  59. Giordano, M.; Petropoulos, S.A.; Rouphael, Y. The Fate of Nitrogen from Soil to Plants: Influence of Agricultural Practices in Modern Agriculture. Agriculture 2021, 11, 944. [Google Scholar] [CrossRef]
Figure 1. Identification of the Environmental Protection Area of Ibirapuitã River and the territory of the Estância do Vinte e Oito. Source: Elaborated by the authors.
Agriculture 13 01524 g001
Figure 2. Nitrogen flow chart for the agricultural production system for the years 2010, 2015, and 2020 (kg N/year). Elaborated by the authors.
Agriculture 13 01524 g002aAgriculture 13 01524 g002b
Table 1. Measurement of biological variables of nitrogen inputs and outputs, according to the bibliography.
Item of NMeasurement of NSource
Atmospheric deposition12 kg N/ha/year[23]
Biological fixation20 kg N/ha/year[20]
Feed20% of crude protein[24]
Leaching *0.00225 kg N/N[25]
FertilizersUrea: 46% NManufacturers
Protected urea: 45
NPK fertilizer: 5%.
Oat seedsCrude protein 12% (N × 6.25)[26]
Rice seedsCrude protein 7% (N × 5.95)[27]
ExcretionYearlings: 25 kgN/animal/year[28,29,30]
Cows for fattening: 60 kgN/animal/year
Steers and bulls: 40 kgN/animal/year
N excretion volatilization12% of N excreted[31]
Synthetic N volatilization15% of N applied[32]
NitrificationDirect emission: 1% of N applied[32]
Indirect emission: 1% of volatilized N
Beef carcass3.08% N[30,33]
* Leaching of synthetic fertilizer.
Table 2. Measurement of economic and biological production indicators of nitrogen in the production system of the Estância do Vinte e Oito, for the years 2010, 2015, and 2020.
Economic and Biological Production Indicators Measurement
Herd slaughter rateNumber of animals traded/number of initial stock animals of the year
Kilograms (kg) of live weight (BW) ha−1Total kilograms of live animals marketed/hectare
Weaning rateNumber of weaned calves/number of cows
Cattle stockingNumber of animal units (AU)/hectare
Income (USD)/kg BWRevenue from livestock marketing/total kilograms of live animals marketed
Cost (USD)/kg BWLivestock operating costs/total kilograms of live animals marketed
Margin (USD)/kg BWRevenue/kg BW − Cost/kg BW
Revenue (USD) ha−1Revenue from marketing/hectare/year
Cost (USD) ha−1Operational costs/hectare/year
Margin (USD) ha−1Revenue/hectare − cost/hectare
N inputs ha−1N inputs/hectare
N output ha−1Outputs and losses of N/hectare
N surplus ha−1Difference between N inputs/hectare and output
Ratio of N conversion to carcassKg of carcass produced/Kilos (kg) of N inputs to beef cattle
N efficiency N inputs to livestock/N exported (herd traded)
N self-sufficiency (%)N%: (∑N inputs − (∑ration + fertilizer + seed)) × 100/N inputs
Cost (USD) per kilo (kg) of excess NCost (USD) ha of system/kg N surplus in system
Table 6. Livestock system efficiency and productivity indicators during the analysis period.
IndicatorsPeriod
201020152020
Ratio of N to carcass0.13 kg N0.14 kg N0.10 kg N
N efficiency 3.05%4.22%4.37%
N self-sufficiency (%)90.41%88.58%82.62%
Cost (USD) per kg N surplusUSD 8.84USD 10.66USD 3.13
Disclaimer/Publisher’s Note: The statements, opinions and data contained in all publications are solely those of the individual author(s) and contributor(s) and not of MDPI and/or the editor(s). MDPI and/or the editor(s) disclaim responsibility for any injury to people or property resulting from any ideas, methods, instructions or products referred to in the content.

