Article

Genome-Wide Association Studies of Salt-Tolerance-Related Traits in Rice at the Seedling Stage Using InDel Markers Developed by the Genome Re-Sequencing of Japonica Rice Accessions

1
School of Agriculture, Ningxia University, Yinchuan 750021, China
2
Agricultural College, Tarim University, Alar 843300, China
*
Author to whom correspondence should be addressed.
These authors are co-first authors.
Agriculture 2023, 13(8), 1573; https://doi.org/10.3390/agriculture13081573
Submission received: 15 June 2023 / Revised: 1 August 2023 / Accepted: 2 August 2023 / Published: 7 August 2023
(This article belongs to the Section Crop Genetics, Genomics and Breeding)

Abstract

:
Japonica-specific markers are crucial for the analysis of genetic diversity, population structure, evolutionary traits, and genome-wide association study (GWAS) of japonica germplasm accessions. This study developed 402 insertion–deletion (InDel) polymorphic markers based on the re-sequencing of four japonica rice landraces and three japonica rice cultivars. These InDel markers were uniformly distributed across 12 rice chromosomes with high polymorphism and good amplification specificity. The average density of InDel markers on each chromosome was 0.95 Mb per locus. On the basis of these InDel markers, genetic diversity analyses and GWASs for 12 salt-tolerance-related traits were performed using 182 japonica rice accessions. In total, 1204 allelic variants were detected, with an average of 3.00 alleles and 2.10 effective alleles per locus. Based on population structure analysis, 182 japonica rice accessions were divided into four subgroups. The GWAS analyses revealed a total of 14 salt-tolerance-related InDels, which were located on chromosomes 1–5, 9, 10, and 12. Twenty-eight allelic loci were identified, explaining 6.83% to 11.22% of the phenotypic variance. Haplotype analysis detected six InDel markers associated with salt-tolerance-related traits that were significantly different (p < 0.05) or highly significantly different (p < 0.01) among different haplotypes. These markers can be utilized for the molecular identification of salt-tolerant rice germplasm accessions.

1. Introduction

Rice (Oryza sativa L.) is a crucial food crop globally, providing a significant amount of energy for the populations of many developing countries, especially in Asia [1]. With the increasing population and diverse consumer demands, food security has become a crucial concern. Consequently, developing and applying new breeding technologies to improve grain yield has become a top priority for rice breeders. In this regard, molecular markers and whole-genome re-sequencing technologies have emerged as important tools for rice breeding and genetic improvement [2]. Since the completion of rice genome sequencing in 2002, researchers have been able to perform the accurate genotyping of rice using whole-genome re-sequencing technology. This has enabled the construction of ultra-high-density linkage maps for quantitative trait locus (QTL) mapping [3,4]. Insertion–deletion polymorphisms (InDels) are key sources of structural variations in plant genomes and have been widely utilized in the construction of genetic maps in rice [5,6]. Although the distribution frequency and localization accuracy of InDel markers in the genome are lower than those of single nucleotide polymorphism (SNP) markers, they still have many advantages, such as easy detection, high polymorphism, and versatility [7]. Inexpensive detection methods, which are based on polymerase chain reaction (PCR) and agarose gel electrophoresis techniques, are of more practical value to researchers and breeders [7,8]. Shen et al. developed a DNA polymorphism database using the genome sequences of Nipponbare (Oryza sativa L. ssp. japonica) and 93-11 (Oryza sativa L. ssp. indica), which contain 479,406 InDels [9]. PCR analysis indicated that 90% of these InDels could be utilized as markers. Similarly, Yuan et al. identified 699,475 long InDels (>50 base-pairs) using 3K whole-genome re-sequencing data [10]. From these InDels, 96 were randomly selected and screened in 98 rice cultivars. The results showed that these InDel markers were highly polymorphic between japonica and indica rice varieties, providing a foundation for assessing the heterogeneity between these two subspecies. Ji et al. identified 10,860 InDels with a length longer than 20 bp from the genome re-sequencing data of 24 temperate japonica rice varieties, from which they developed eight InDel markers in the QTL (qPHS11) associated with spike germination resistance [11]. Additionally, they developed several highly polymorphic InDel markers for four functional genes, including Heading date 1 (Hd1), Heading date-6 (Hd6), Grain size 3 (GS3), and semidwarf-1 (SD1). These works were significant in the development of functional markers in rice and their application in marker-assisted breeding. Yano et al. obtained 426,337 SNPs and 67,544 InDels by conducting whole-genome re-sequencing on 176 japonica rice varieties [12]. Using these varieties, Hd1 (LOC_Os06g16370), regulating the heading date in rice, was identified through a genome-wide association study (GWAS). Additionally, two InDels, 36 bp and 43 bp in length, were detected within the first exon of this gene. Overall, InDel markers can be used as an optimal marker system for genetic analysis, marker-assisted selection (MAS), and GWASs in rice.
Salt stress is a key abiotic factor that restricts the production of rice [13]. Since rice is a salt-sensitive crop, salt stress during germination and the seedling stage directly impacts the seedling quality and survival ratio of rice, thus affecting rice yield [14]. Therefore, clarifying the genetic mechanisms of salt tolerance in rice and utilizing salt tolerance genes to breed rice varieties suitable for cultivation in saline soils are crucial for global food security. The salinity tolerance of rice is a complex quantitative trait controlled by multiple genes [15]. In recent years, researchers have identified numerous QTLs associated with salinity tolerance in rice through GWASs. Shi et al. utilized 478 rice accessions as an association population and evaluated their salt tolerance using the mean germination time (MGT) and vigor index (VI). Based on MGT and VI, 22 SNPs significantly associated with salt tolerance were identified under salt stress treatment [16]. Chen et al. evaluated the salt tolerance of 204 rice varieties under hydroponic and soil cultivation conditions [17]. They detected 97 and 74 QTLs associated with salt tolerance in hydroponic and soil systems, respectively, and reported 65 candidate genes for salt tolerance, including OsHKT1;5 (SKC1), a gene coding for sodium transporter protein [18]. Similarly, in a GWAS conducted by Yu et al., 295 rice germplasm accessions were used to identify SNPs/InDels loci associated with salt-tolerance-related traits at the seedling stage. Twenty-five significantly associated SNP loci were detected among 1.65 million SNPs/InDels and 93 candidate genes related to salt tolerance in rice were selected. Revealed by haplotype network, sequence, and expression analysis, a key gene, LOC_Os12g07730.1, which encodes a SWIRM domain-containing protein and acts as a transcription factor, was strongly correlated with the salt tolerance of rice at the seedling stage [19].
In recent years, the development of InDel markers has been extensively studied for rice breeding through the re-sequencing of rice genomes and the utilization of functional mutation loci in genes. However, there have been limited reports on the development of highly polymorphic and specific InDel markers for japonica rice by re-sequencing. In the present study, we sequenced seven japonica rice accessions and characterized the distribution of InDel sites throughout the genomes of japonica cultivars and landraces. We aimed to identify loci associated with salt-tolerance-related traits by InDel markers developed based on the re-sequencing data. Our findings could offer valuable theoretical insights and novel genetic resources for the development of japonica-specific markers and to enhance the salt tolerance of rice at the seedling stage.

2. Materials and Methods

2.1. Plant Materials

Four japonica rice landraces, namely, Faguodao (France), Bertone (Portugal), Yanghebaipidao (Ningxia, China), and Ningnongheigeng (Ningxia, China), as well as three japonica rice cultivars, Koshihikari (Japan), Ninggeng 35 (Ningxia, China), and Gaoliangdao (Jilin, China), were re-sequenced using the Illumina second-generation sequencing platform to design InDel markers. An association mapping population consisting of 182 japonica rice accessions collected worldwide was used for the GWAS (Supplementary Table S1).

2.2. Seedling Salt Tolerance Identification of 182 japonica Rice Accessions

The experiments were conducted in July 2021 and July 2022 in the solar greenhouse of Ningxia University (38°30′17″ N, 106°7′38″ E). Seeds of 182 japonica rice accessions were placed in a blast drying oven at 42 °C for 48 h to break the dormancy completely. The process of seed disinfection, germination, and seedling culture followed the methods of Song et al. [20]. The identification methods of Ma et al. were used to evaluate the salt tolerance of rice seedlings [21]. There were two treatments: control treatment (CK, 1 × Yoshida’s solution) and salt stress treatment (SST, 1 × Yoshida’s solution with 125 mmol L−1 NaCl). Each treatment had three replications, with 24 plants per replication for each accession.
Salt tolerance of the 182 japonica rice accessions was evaluated using 12 indexes at 6 days of salt stress. The indexes included salt tolerance score (STS), leaf damage percentage (LDP), relative seedling height (RSH), relative root length (RRL), relative SPAD (RSPAD), relative shoot fresh weight (RSFW), relative root fresh weight (RRFW), relative shoot dry weight (RSDW), relative root dry weight (RRDW), relative plant dry weight (RPDW), relative root-to-shoot ratio (RRS), and shoot water content (SWC). The mean values for each index were calculated over 2 years for the statistical analysis.

2.3. Whole-Genome Re-Sequencing and Identification of InDel Candidates

Re-sequencing of seven japonica rice accessions was conducted with an average sequencing depth of 32× across the whole genome. Nipponbare (Build 4.0) was used as the reference genome. Clean reads were mapped against the reference genome using the MEM algorithm of a Burrows–Wheeler Aligner (BWA 0.7.10-r789). InDel variants were called using HaplotypeCaller of GATK (v3.8) [22,23]. Then, a filter was performed to obtain the set of variant loci. SnpEff (v4.3) was used to annotate and predict the impact of InDels [24].

2.4. InDel Loci Screening and Primer Design

A candidate InDel loci collection was selected from the InDel loci based on the following criteria. The selected loci needed to be distributed uniformly across 12 chromosomes and have insertion/deletion size differences larger than 8 bp between any two of the seven re-sequencing accessions. Using Nipponbare as the reference sequence, 200 bp upstream and downstream of each InDel locus was used to design primers using Primer Premier 5.0. In total, 555 primer pairs were designed and screened to meet the following conditions: primer length between 18 and 23 bp, PCR product size ranging from 150 to 300 bp, and a Tm value of (60 ± 1) °C. Primers were synthesized by the Shanghai Sangon Biological Engineering Technology Company (Shanghai, China).

2.5. DNA Extraction, PCR Amplification, and Product Detection

Genomic DNA was extracted from fresh leaves collected during the tillering stage using the CTAB method [25]. Amplification specificity and polymorphism of the 555 InDel primer pairs were validated by PCR using the DNA of Nipponbare and seven re-sequenced accessions. PCR amplification was conducted using Mastercycler nexus PCR instruments (Eppendorf, Hamburg, Germany). The reaction procedure was pre-denaturation at 95 °C for 5 min; denaturation at 95 °C for 30 s; annealing at 58 °C for 30 s; extension at 72 °C for 1 min, 36 cycles; extension at 72 °C for 10 min; and storage at 4 °C. PCR products were separated by 4% agarose gel electrophoresis, according to Bhattacharya et al. [26].

2.6. Genetic Diversity, Population Structure, and Linkage Disequilibrium Analysis

The 182 japonica rice accessions were genotyped using the selected InDel markers.
The number of alleles (Na), number of effective alleles (Ne), Shannon information index (I), Nei’s genetic diversity (He), and polymorphism information content (PIC) were calculated using PowerMarker 3.25 [27,28]. The number of effective alleles per locus is calculated by a formula:
N e = 1 P i 2
Ne—Number of effective alleles; Pi—Frequency of the “i” allele in the population.
Population structure analysis was carried out using Structure (v2.3.4) in conjunction with Evanno’s method, which utilizes the statistical value ΔK to determine the most suitable K value [29,30]. Groups were categorized based on similarity. Accessions were assigned to each cluster with Q ≥ 0.6, while accessions with Q < 0.6 were assigned under a mixed group [31]. The results of grouping taxa were validated using Analyses of Phylogenetics and Evolution (ape) packages to construct evolutionary trees with the Neighbor-Joining Algorithm (NJ). Principal coordinate analysis (PCoA) was carried out with the genotypic data of the InDel markers in GenAlEx 6.5 [32]. The degree of linkage disequilibrium between loci was measured using the linkage disequilibrium coefficient r2, which was computed for the 12 rice chromosomes by TASSEL (v3.0). Then, the LD decay curves were graphed [33]. According to the method of Huang et al., the LD decay distance was the distance at which the LD decays to r2 equal to 50% of the decay distance [34].

2.7. GWAS of Salt-Tolerance-Related Traits in japonica Rice at the Seedling Stage

A mixed linear model (MLM) was used to perform GWASs on 12 salt-tolerance-related traits at the seedling stage using TASSEL (v3.0). The threshold for significant association was set as −log10(p) ≥ 3.60 (p ≤ 0.1/n, where n is the number of markers). The prediction interval for candidate genes was determined using the LD decay distance. InDel markers significantly associated with multiple traits were blasted against the rice reference genome in the Chinese National Rice Data Center (https://www.ricedata.cn/, accessed on 8 February 2023) and NCBI (https://www.ncbi.nlm.nih.gov/, accessed on 15 February 2023). Genes with verified functions within the prediction interval were annotated. Significant InDel markers were used for haplotype analysis.

2.8. Data Analysis

Excel 2019 was used to organize InDel marker genotype information. SPSS 26.0 and Origin 2023 were used to conduct t-tests and generate boxplots, respectively. Manhattan plots, Q–Q plots, and correlation plots were generated using the CMplot package and ggplot package in R. The linkage map was constructed using MapDraw 2.1 with the physical location of the InDel marker as a parameter.

3. Results

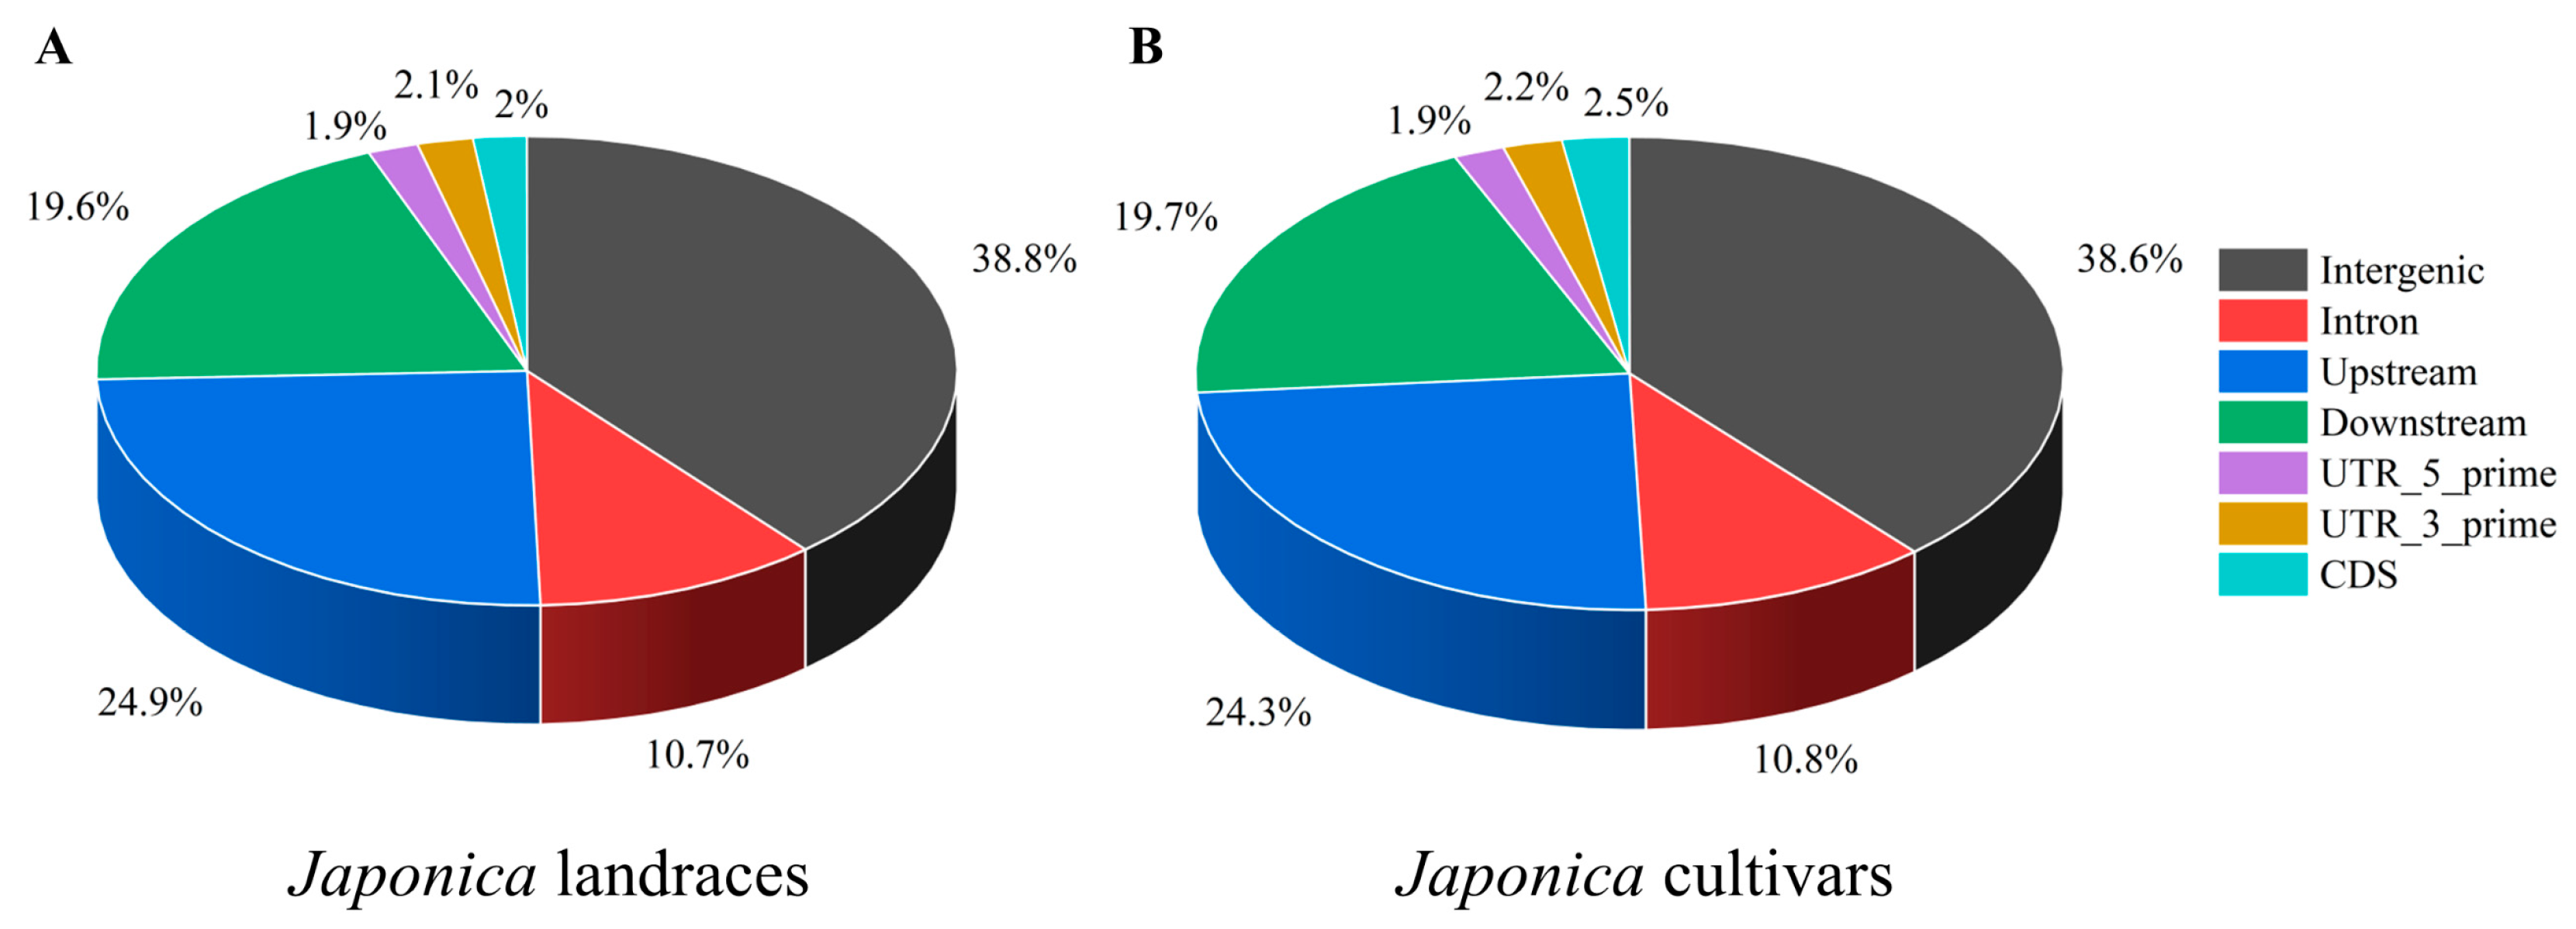
3.1. Distribution Characteristics of InDel Loci in japonica Rice Accessions

In seven japonica rice accessions, 775,068 InDel loci in total were detected, including 16,462 InDel loci in the coding regions and 758,606 InDel loci in the non-coding regions (Figure 1). Faguodao, a japonica rice landrace, had the largest number of InDel loci both in non-coding regions and the coding regions, with 196,976 and 3953 loci, respectively. Ningnongheigeng had the second-largest number of InDel loci. Koshihikari, a japonica rice cultivar, showed the least number of InDel loci identified within the coding regions and non-coding regions. Specifically, there were only 1205 and 39,485 loci detected in these two regions in Koshihikari, respectively.
InDel loci were primarily located in the intergenic regions in both japonica landraces and japonica cultivars (Figure 2). The proportions of loci located in the intergenic regions were 38.8% and 38.6% in japonica landraces and cultivars, respectively. The proportions of InDels located in the upstream and downstream regions of genes were 24.9% and 19.6%, and 24.3% and 19.7% in japonica landraces and cultivars, respectively. The proportions of InDels in the untranslated regions (UTRs) of genes were relatively low: 4.0% and 4.1% in landraces and cultivars, respectively. The InDels frequency was lowest in the CDS region, with only 2% and 2.5% in landraces and cultivars, respectively. Thus, the majority of InDel loci were situated in the intergenic regions and the upstream and downstream of genes, with a small proportion of InDel loci found in the UTR and CDS regions. This pattern was consistent in landraces and cultivars of japonica.

3.2. Distribution of InDels on Chromosomes of Different Types of japonica Rice Accessions

Although the InDel loci were presented on all twelve chromosomes of the seven japonica rice accessions, the InDel frequency of each chromosome varied significantly between japonica landraces and cultivars (Table 1). Chromosome 4 and chromosome 9 had the highest and lowest numbers of InDel loci in japonica landraces, with a count of 13,626 and 6547. On average, there were 354 InDels per million base pair (Mb) across 12 chromosomes (Linkage groups) in japonica landraces. In contrast, the japonica cultivars exhibited the largest number (11,938) and smallest number (3029) of InDel loci on chromosome 11 and chromosome 5, respectively. The average number of InDels per Mb was only 197 in japonica cultivars. These results suggested that the InDels frequency in the japonica landraces was higher than that in the japonica cultivars.

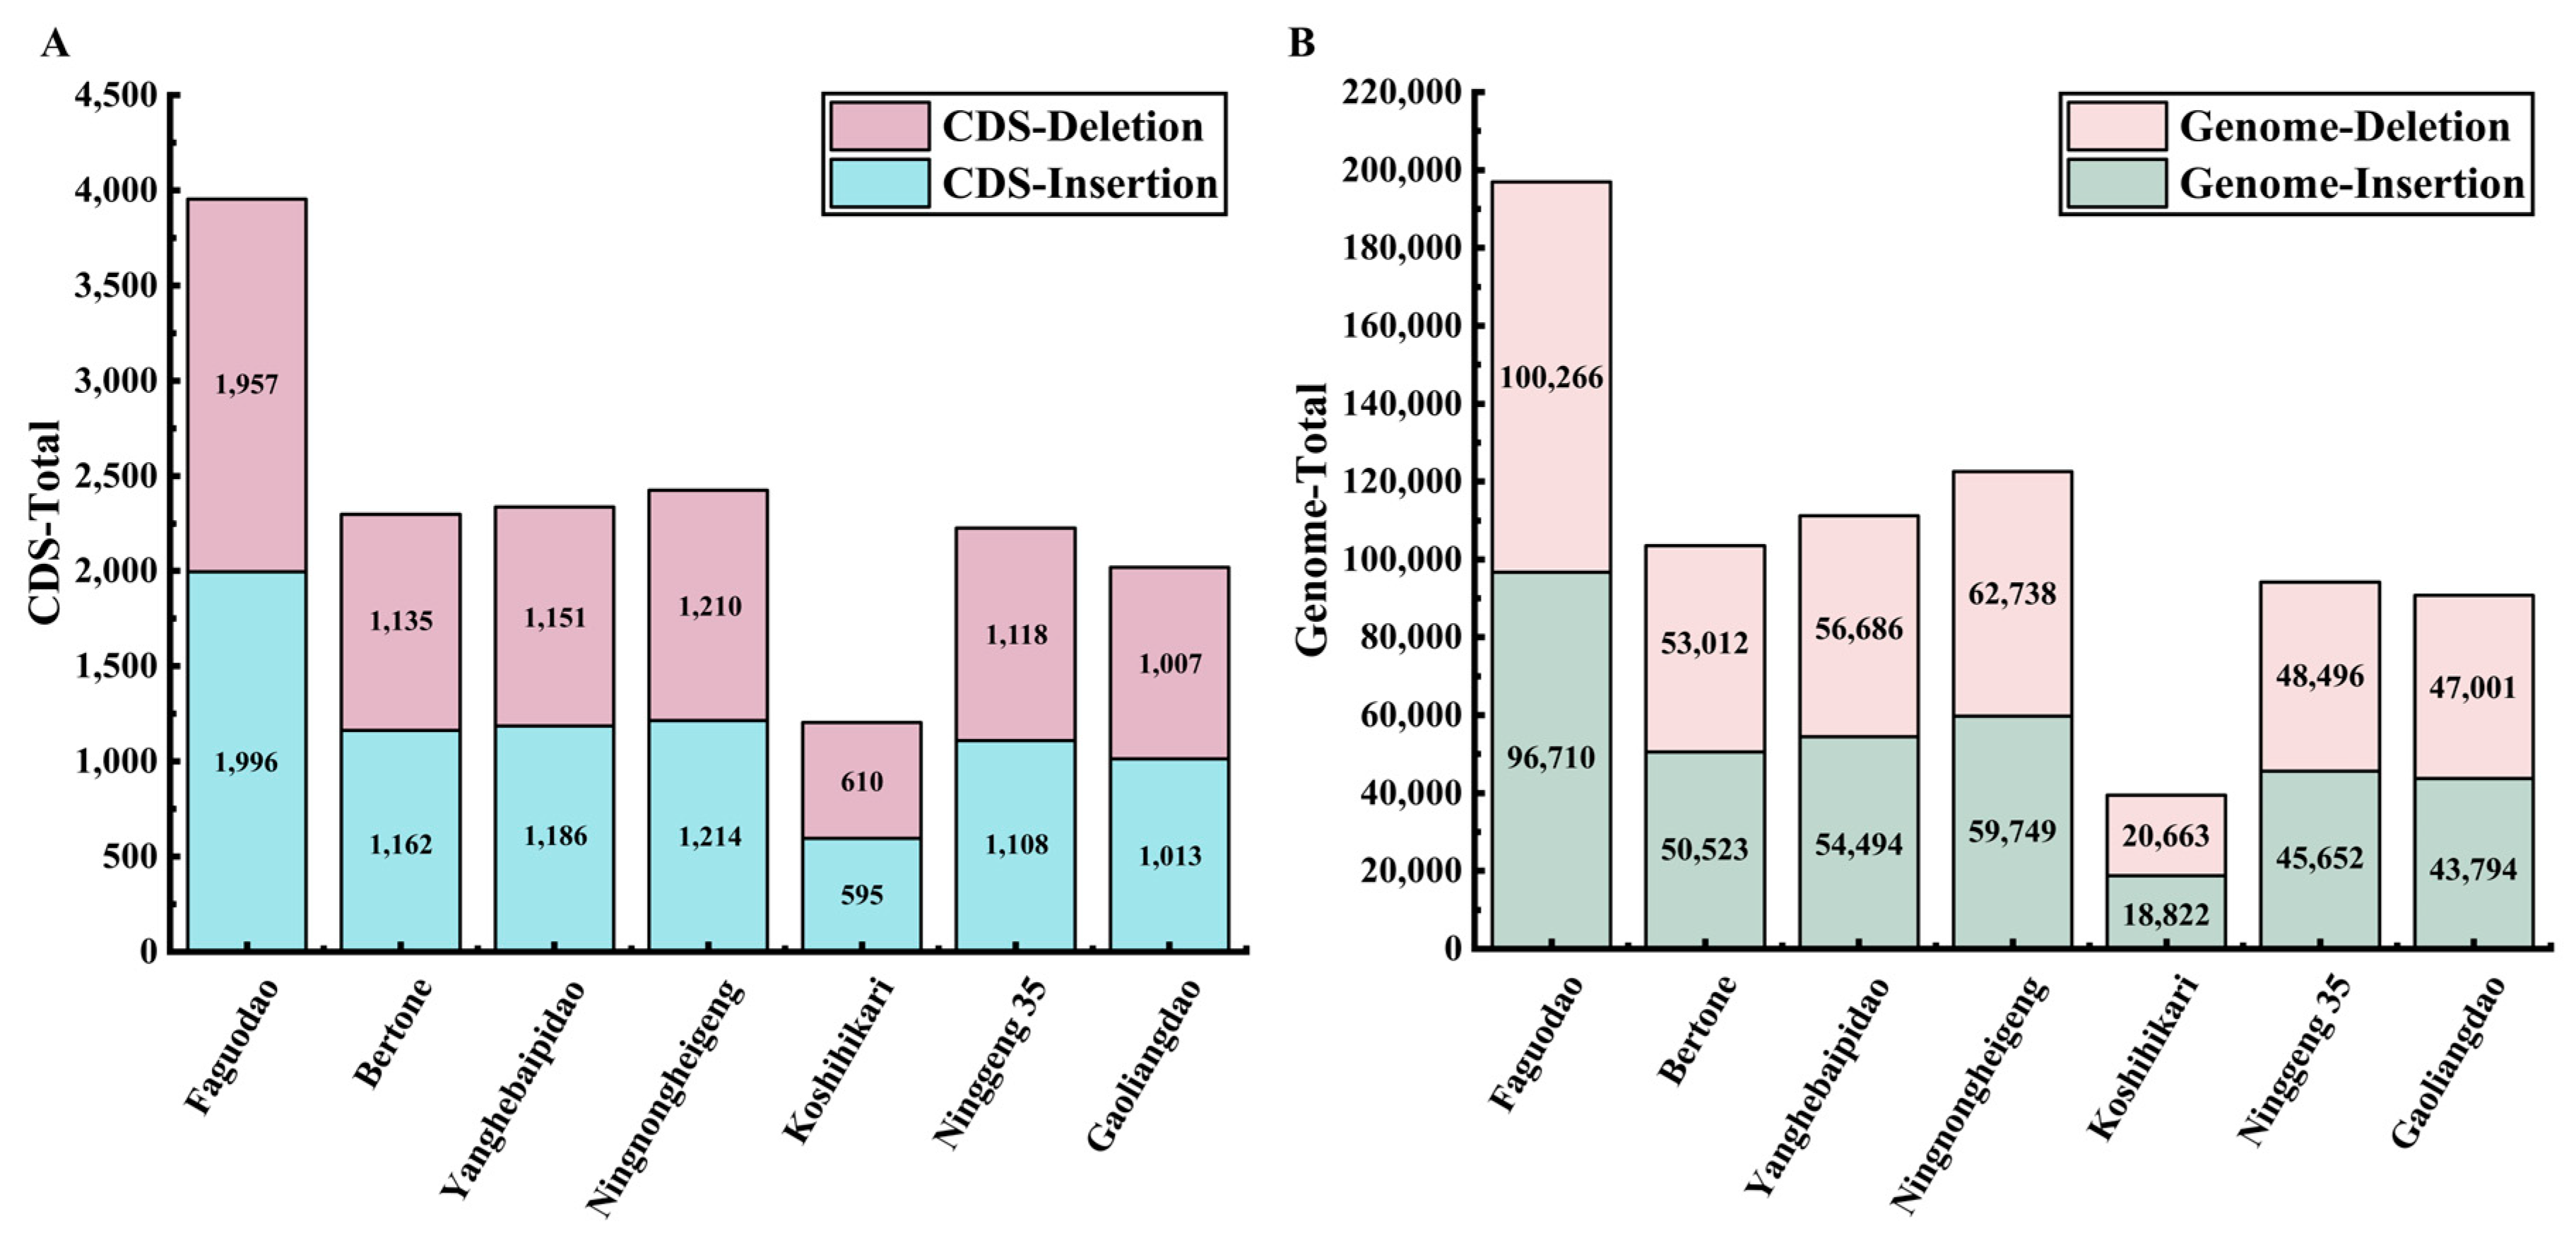
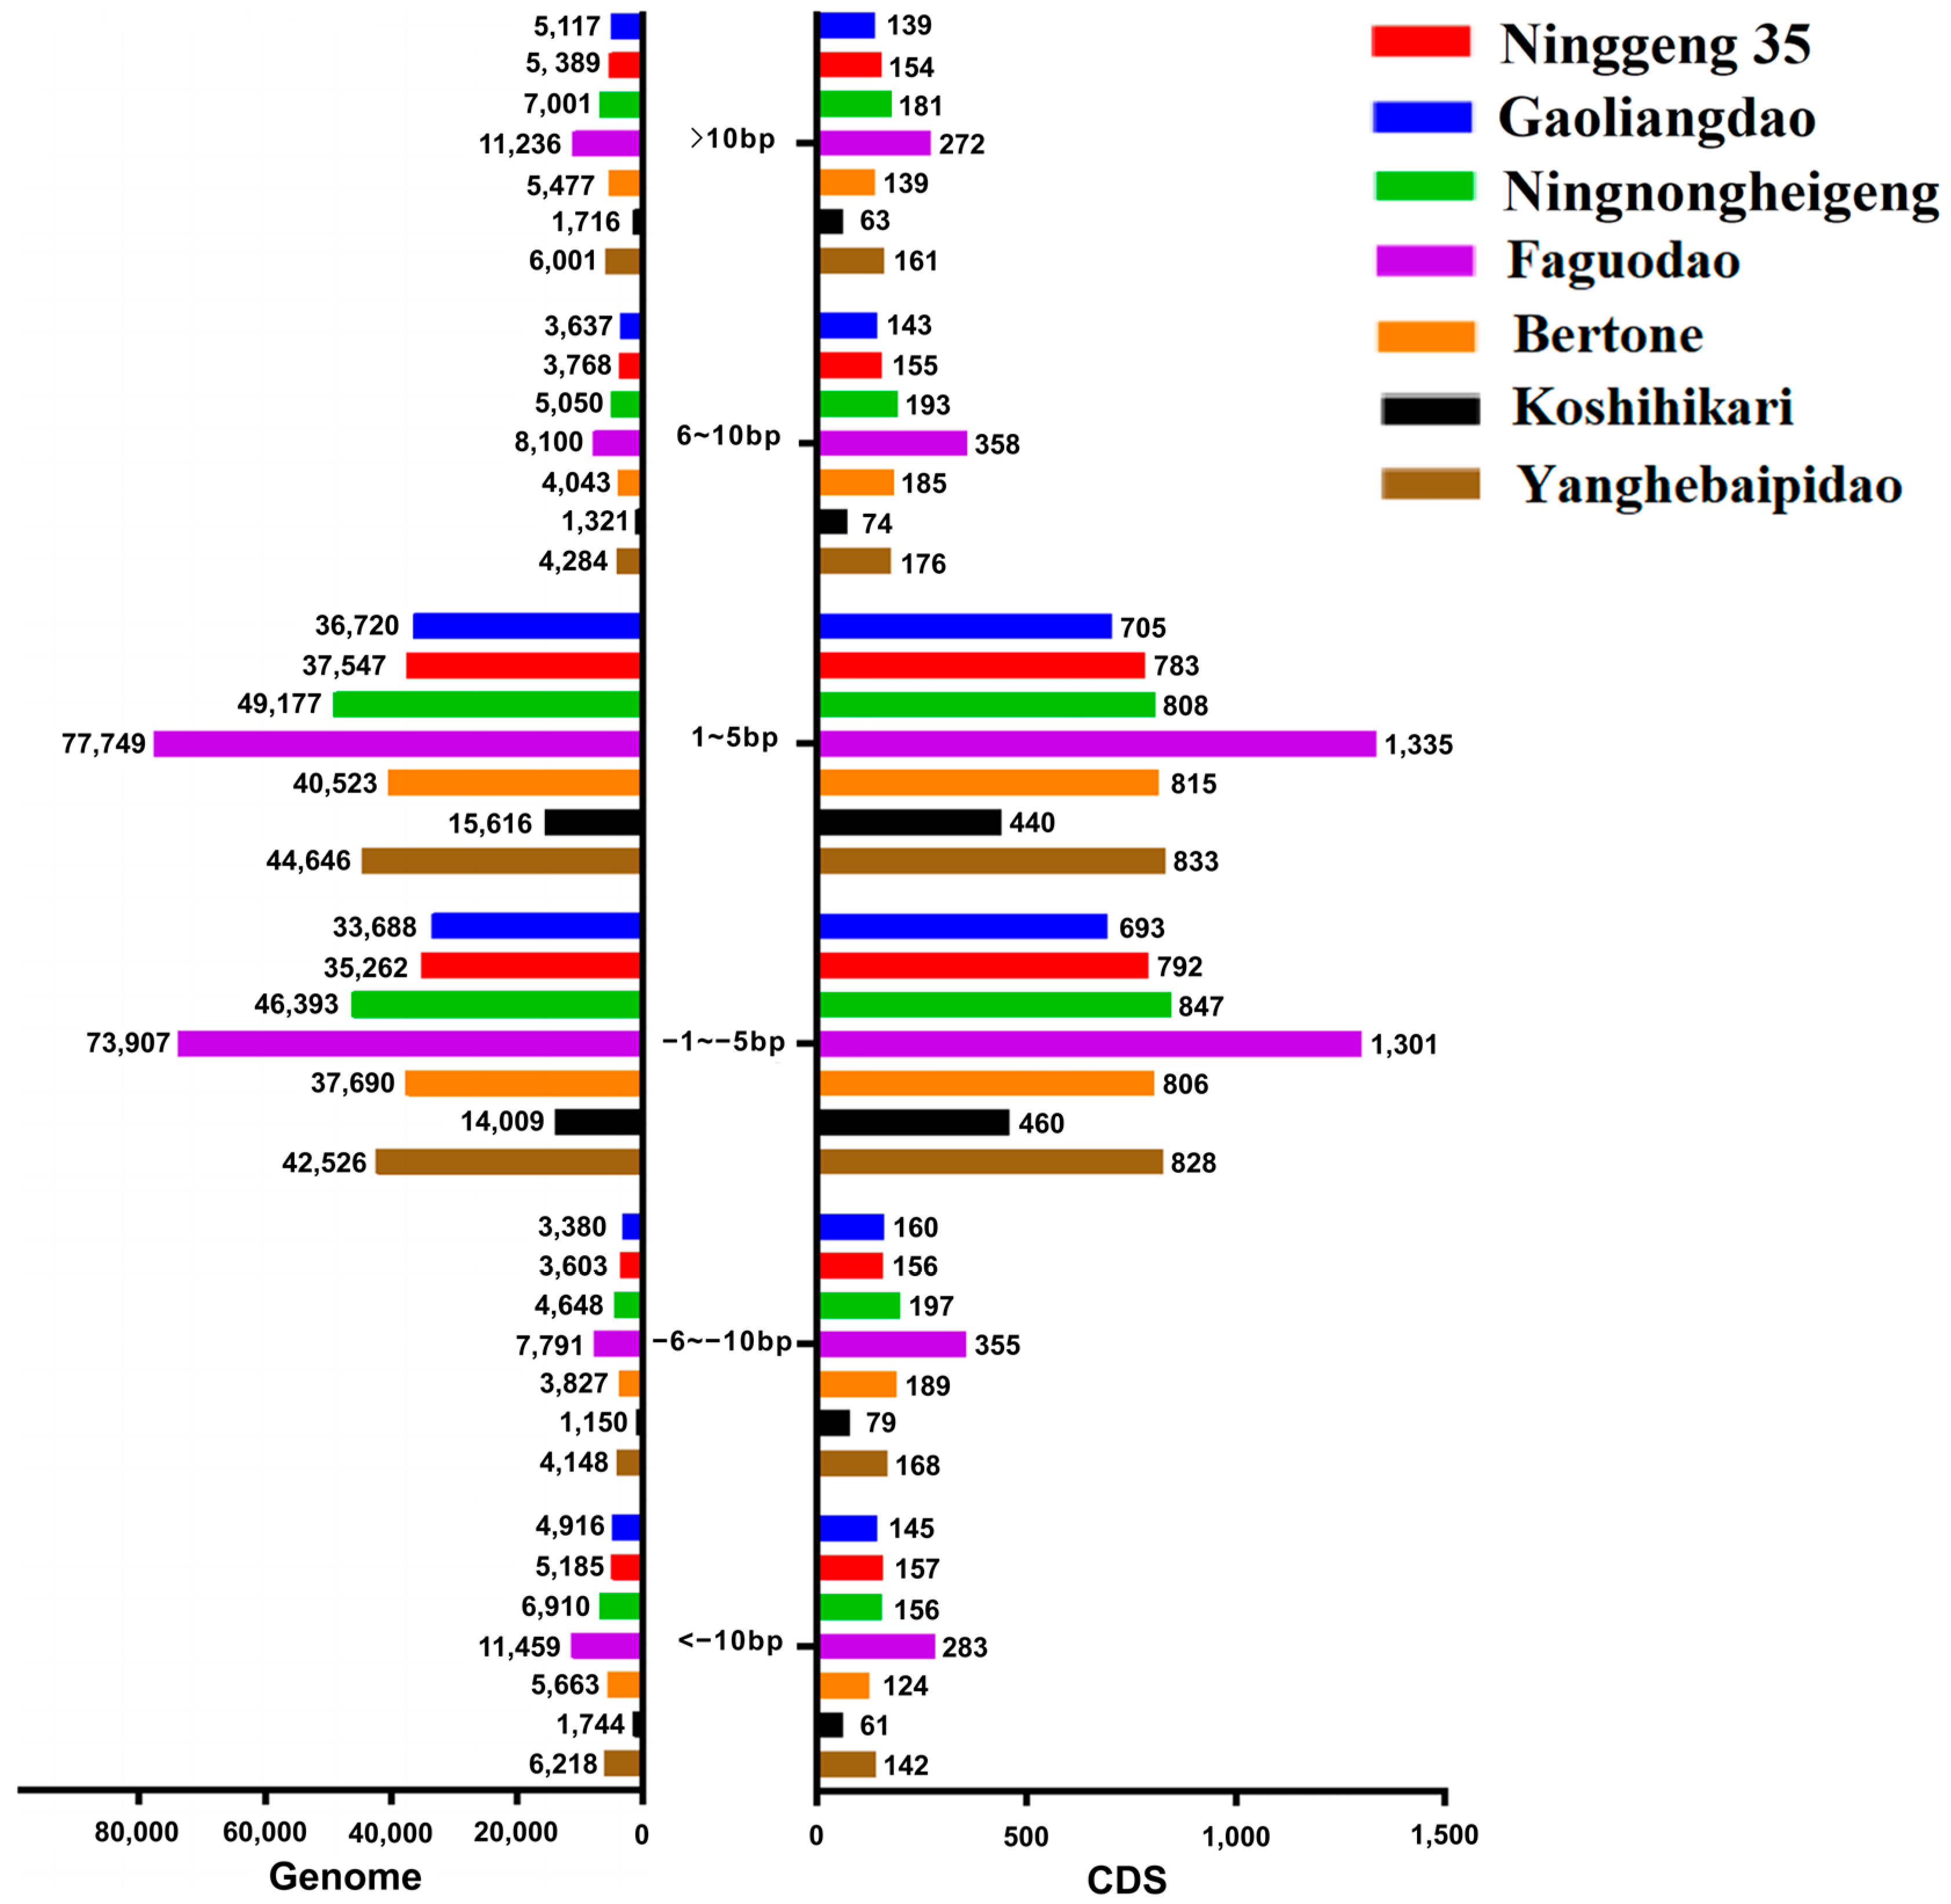
3.3. InDel Length Analysis of Seven Re-Sequenced japonica Rice Accessions

Although the lengths of the InDels ranged from 1 to 50 bp, the majority of the insertions and deletions comprised small fragments (Figure 3). InDels with lengths between 1 and 5 bp were the most frequent, while InDels with lengths greater than 10 bp were the least frequent. There were 585,453 InDel loci with lengths between 1 and 5 bp, which accounted for roughly 77% of all the InDels in the entire genome. However, there were only 84,032 InDel loci with lengths >10 bp genome-wide. The distributions of InDels of different lengths in the CDS regions were consistent with those across the genome. There were 11,446 InDels in the CDS with a length of 1–5 bp, which was also approximately 77% of all InDels in this region. Additionally, there were 2589 InDel sites with a length of 6–10 bp, and 2117 InDel sites with lengths >10 bp in the CDS regions. Japonica landraces had more InDels of 1–10 bp than japonica cultivars. In both Japonica types, the InDel frequency decreases as the InDel length increases in the CDS regions.

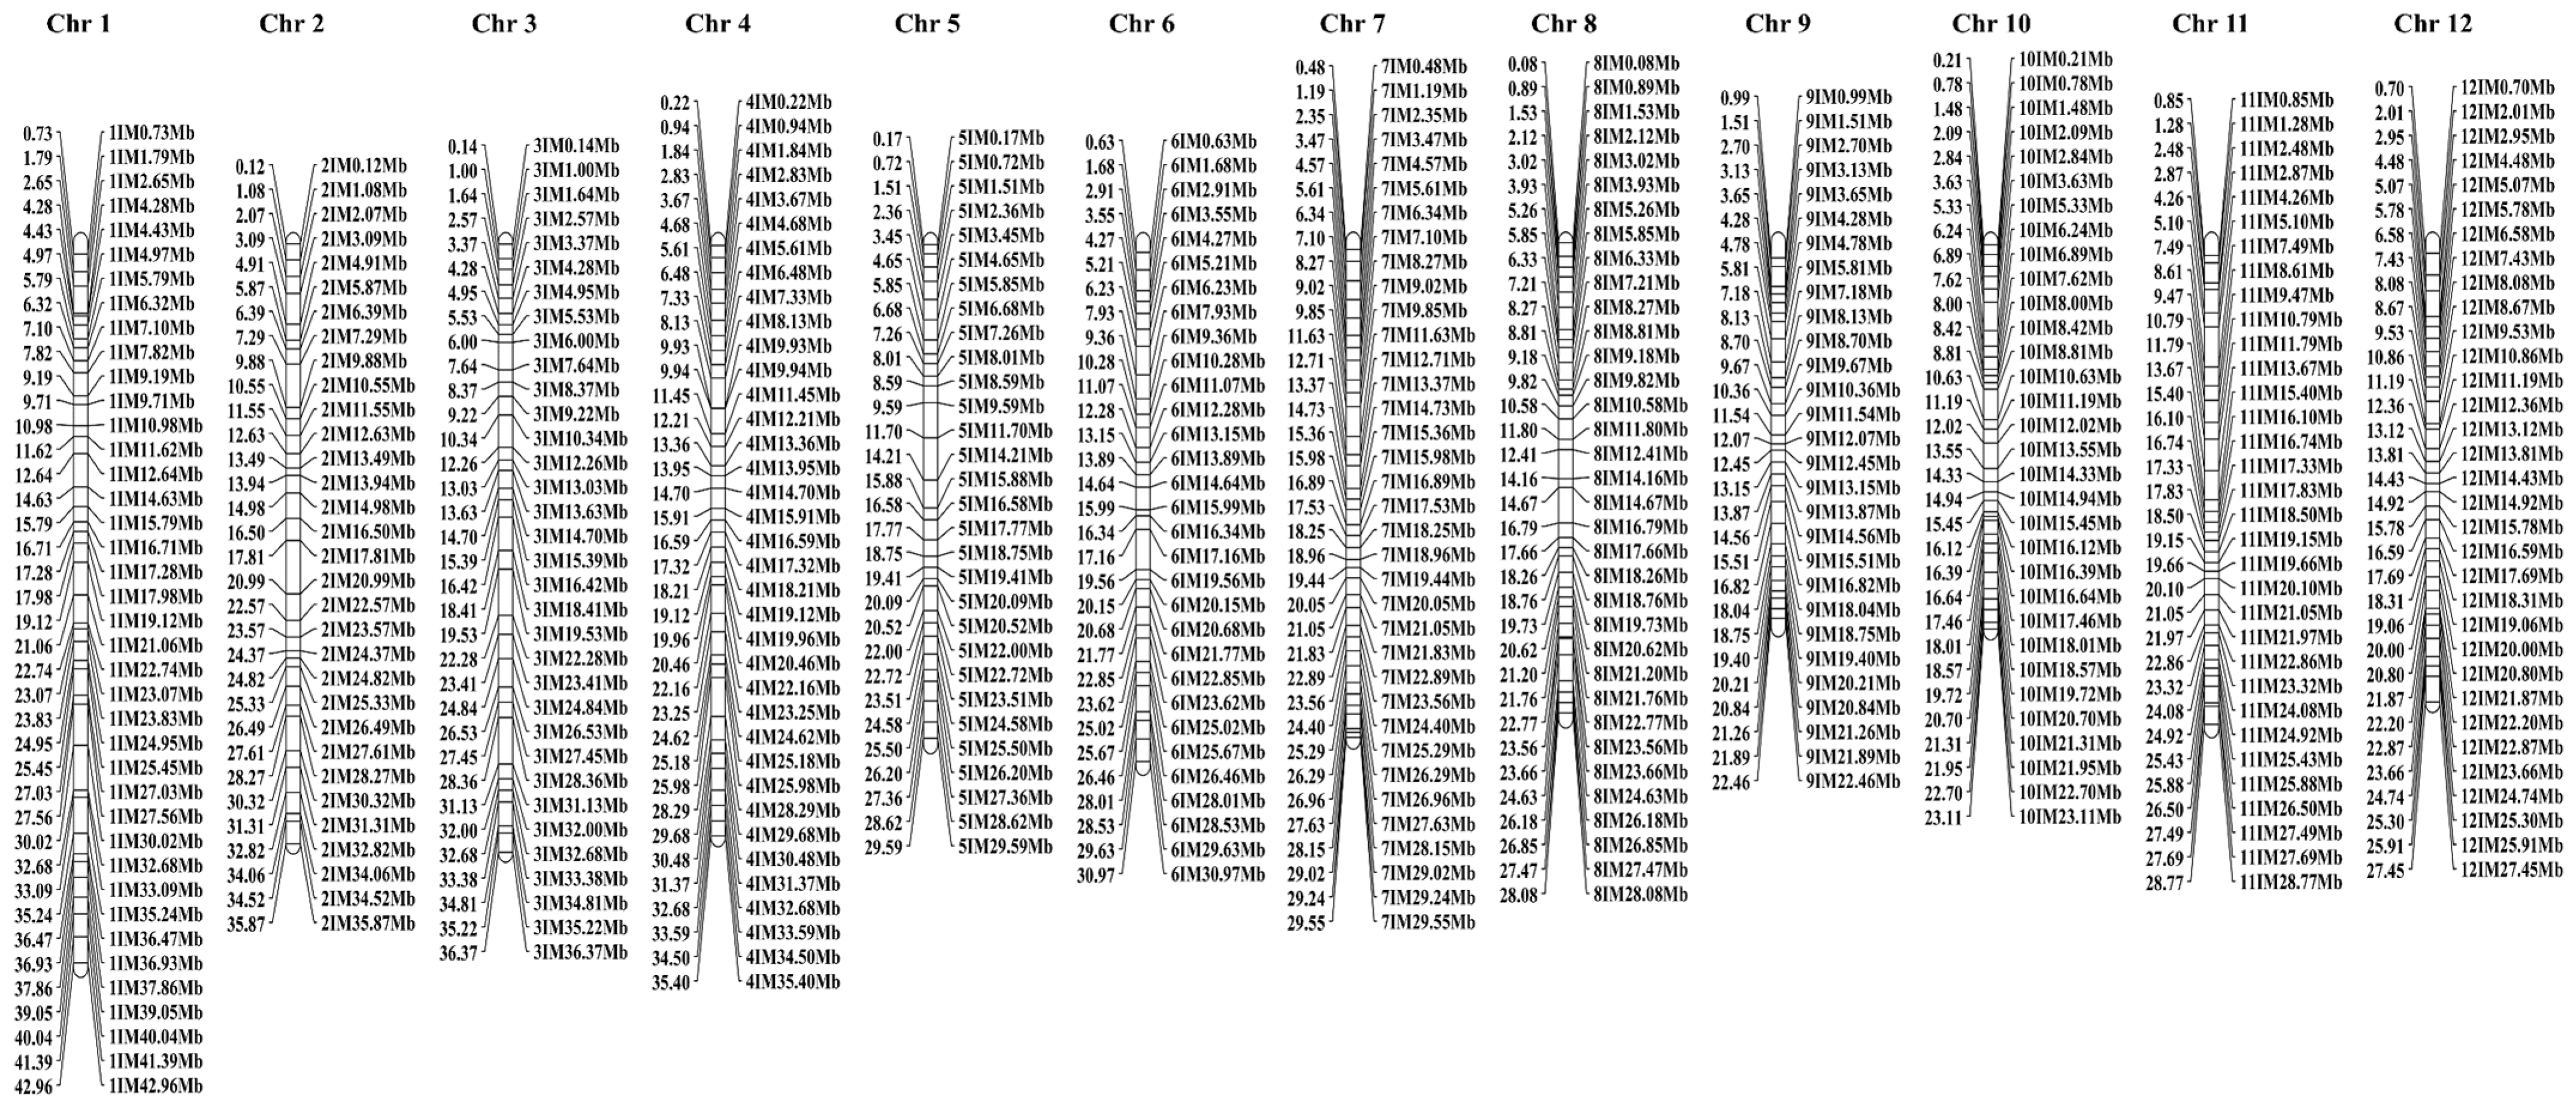
3.4. Development and Screening of Polymorphic InDel Markers

PCR primers were designed for 555 InDel loci distributed in the intergenic regions and the upstream, exon, intron, and downstream regions of genes using the re-sequencing data of seven japonica rice accessions. Out of the 555 markers, 402 (72%) markers with high polymorphism and good amplification specificity were selected as the core InDel markers. These markers were evenly distributed across 12 chromosomes, with 29–40 markers on each chromosome and an average interval of 0.74–1.15 Mb/ locus (Table 2). The distribution of these 402 markers on chromosomes was drawn with their physical locations as inputs using MapDraw 2.1 (Figure 4). The 402 InDel markers effectively covered all 12 chromosomes with an average density of 0.95 Mb/locus.

3.5. Salt-Tolerance-Related Traits of 182 japonica Rice Accessions at the Seedling Stage

We assessed the salt tolerance of 182 japonica rice accessions at the seedling stage under 125 mmol L−1 NaCl stress condition based on 12 salt-tolerance-related traits, including STS, LDP, RSH, RRL, RSPAD, RSFW, RRFW, RSDW, RRDW, RPDW, RRS, and SWC. The average STS of 182 japonica rice accessions was 4.6, with a coefficient of variation (CV) of 31.6%. The range (10–100%) and CV (33.7%) of LDP were the largest among all the tested traits (Table 3). Except for RSH, RRL, RRS, and SWC, CVs of the other traits were all above 20.0%. This indicated that these salt-tolerance-related traits were widely variable among the japonica rice accessions.

3.6. Correlation of Salt-Tolerance-Related Traits in 182 japonica Rice Accessions at the Seedling Stage

The 12 salt-tolerance-related traits showed various degrees of correlation with each other (Table 4). Except for RRL, STS showed strong correlations with all the other traits. STS exhibited highly significant negative correlations with LDP and RRS, and highly significant positive correlations with RSH, RSPAD, RSFW, RRFW, RSDW, RRDW, RPDW, and SWC. Of all the traits positively correlated with STS, RSPAD had the highest correlation coefficient: 0.720. LDP was significantly and positively correlated with RRS and was highly significantly and negatively correlated with all the other traits, except for RRL, with the highest correlation coefficient (r = −0.766) with STS. A notable negative correlation was found between RSH and RRS. In addition, RSH exhibited highly significant positive correlations with STS, RRL, RSPAD, RSFW, RRFW, RSDW, RRDW, and RPDW, among which RSDW was the most correlated trait with a correlation coefficient of 0.449. There were also high positive correlations among RSPAD, RSFW, RRFW, RSDW, RRDW, and RPDW. The results suggested that the salt tolerance traits conjunctly reflect the growth and physiological features of rice seedlings under salt stress treatment, and many of these traits are interconnected.

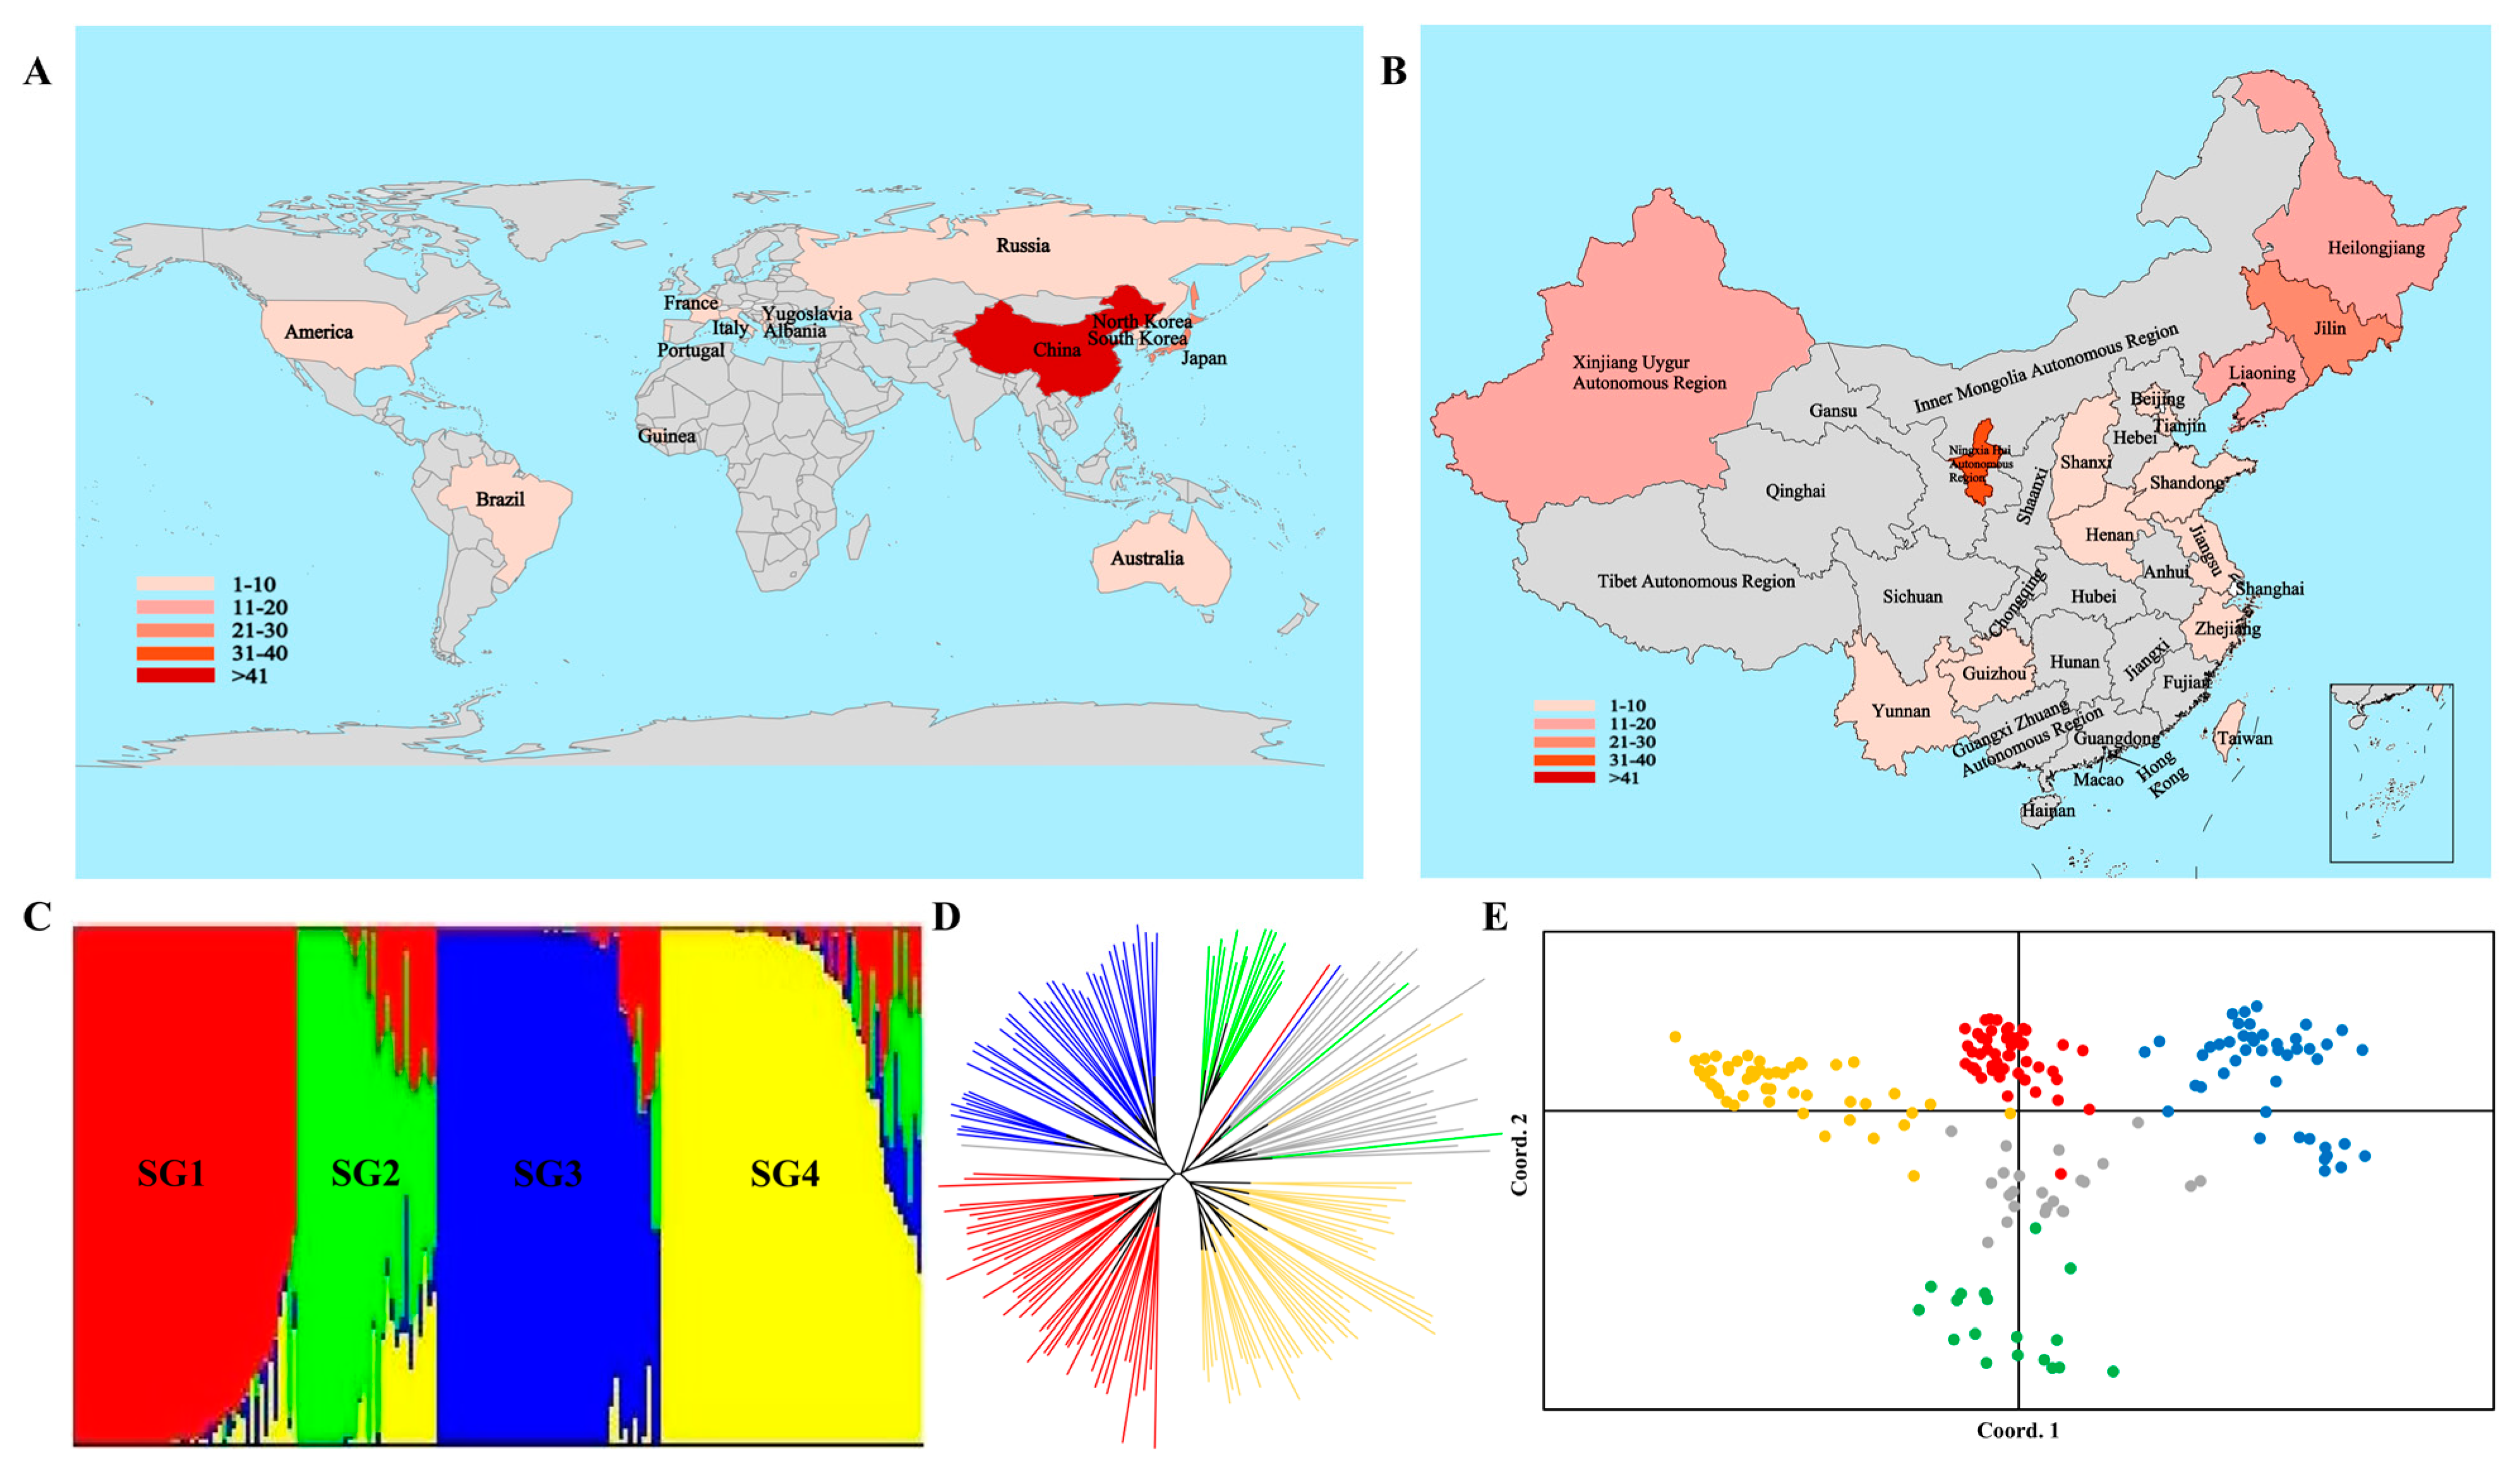
3.7. InDel Marker Genotyping and Genetic Diversity of 182 japonica Rice Accessions

In total, 402 InDel markers were utilized to genotype the 182 japonica rice accessions. The genetic diversity of these InDels was analyzed using PowerMarker 3.25 (Supplementary Table S2). In total, 1204 variations were identified at the 402 InDel loci, including 843 effective alleles. The number of variations ranged from 2 to 6 for each locus, with an average of 3.00. On average, there were 2.10 effective allele loci. The Shannon information index value varied from 0.13 to 1.46, with an average of 0.81. The average value of Nei’s genetic diversity index was 0.50. The polymorphism information content (PIC) varied from 0.05 to 0.71, with an average of 0.42. The InDel marker 10IM16.64Mb exhibited 4.01 effective alleles, with a PIC index of 0.71, a Shannon information index of 1.46, and a Nei’s genetic diversity index of 0.75. Concordantly, the genetic diversity index and polymorphism of 7IM2.35Mb were found to be the lowest among the 402 InDel loci, with an effective allele number of only 1.06 and a PIC index of 0.05.

3.8. GWAS of Salt-Tolerance-Related Traits in Rice Seedlings

3.8.1. Population Structure Analysis

The majority of the 182 japonica rice accessions were collected in Asia, Europe, Australia, North America, South America, and Africa (Figure 5A). Most of the accessions (164/182) were collected in Asia, where China and Japan were the primary sources of collection. The accessions from China were predominantly collected from two regions: Northeast China, from the early maturing and single rice-cropping area and the Northwest China single rice-cropping region in dry areas (Figure 5B). In population structure analysis, the maximum value of ΔK was achieved when K = 4 (Supplementary Figure S1). Consequently, this population was best suited to four subgroups. Based on Q values, 87.4% of the accessions had a single genetic structure and could be sorted into four subgroups. The remaining 12.6% of the accessions displayed a more complex genetic background and were assigned to a mixed group (Figure 5C). Accessions with Q ≥ 0.6 were categorized into one of the four subgroups. The first subgroup (SG1) included 48 accessions, mainly from China (Jilin, Heilongjiang, and Xinjiang provinces) and Japan. The second subgroup (SG2) included 18 accessions, which mainly originated from Italy and regions of China, such as Yunnan, Beijing, and Shanxi. The third subgroup (SG3) with 45 accessions was mainly from Ningxia, China. The fourth subgroup (SG4) had 48 accessions, which were mainly from Japan and Xinjiang and Tianjin in China. The remaining 23 accessions with Q < 0.6 belonged to the mixed group (MG). Next, we constructed a phylogenetic tree using genotypic differences in InDel markers and performed principal coordinate analysis. Accessions could likewise be divided into five subgroups, SG1, SG2, SG3, SG4, and mixed subgroups (Figure 5D,E). The four subgroups exhibited noticeable disparities, with significant independent heritability observed across most of the accessions. However, phenomena of crossover and intermingling of genes also existed between the different accessions.

3.8.2. GWAS of 12 Salt-Tolerance-Related Traits

To find significantly associated loci and to explore superior allelic variations, GWASs for 12 salt-tolerance-related traits were performed using 182 japonica rice accessions (Figure 6). Fourteen InDel loci and twenty-eight allelic variants were detected. These allelic variants had thresholds ranging from 3.62 to 5.09 and explained 6.83% to 11.22% of the phenotypic variations. These were distributed on rice chromosomes 1, 2, 3, 4, 5, 9, 10, and 12 (Table 5). InDel loci significantly associated with STS, LDP, and RSDW were not found (Supplementary Figure S2). Five InDel loci on rice chromosomes 3, 10, and 12 were significantly associated with RSH (Figure 6A). These loci comprised 13 allelic variants, with thresholds ranging from 3.64 to 5.09 and contribution rates ranging from 7.68% to 10.56%. Among the five loci associated with RSH, 12IM7.43Mb-3 had the highest threshold and contribution rate: 5.09 and 10.56%, respectively. An InDel on chromosome 1 was significantly associated with RRL with a threshold of 4.02 and a contribution rate of 7.71% (Figure 6B). Two InDel markers located on chromosomes 2 and 9 were strongly associated with RSPAD with thresholds of 3.62 and 3.68 and explained 7.74% and 7.81% of the phenotypic variance, respectively (Figure 6C). Notably, the InDel marker 10IM6.24Mb located on chromosome 10 demonstrated associations with RSFW, RRFW, RRDW, and RPDW (Figure 6D–G). The allelic variant 10IM6.24Mb-2 had thresholds ranging from 4.00 to 4.63 and explained 9.41% to 11.22% of the phenotypic variance. In addition, an InDel locus on chromosome 5 was associated with the RRS with a threshold of 3.70 and a contribution rate of 9.07% (Figure 6H). Four InDel markers, located on chromosomes 1, 4, 5, and 10, with six allelic variants, were associated with SWC (Figure 6I). The thresholds and contribution rates of these six allelic variants ranged from 3.65 to 4.19 and 6.83% to 9.04%, respectively.

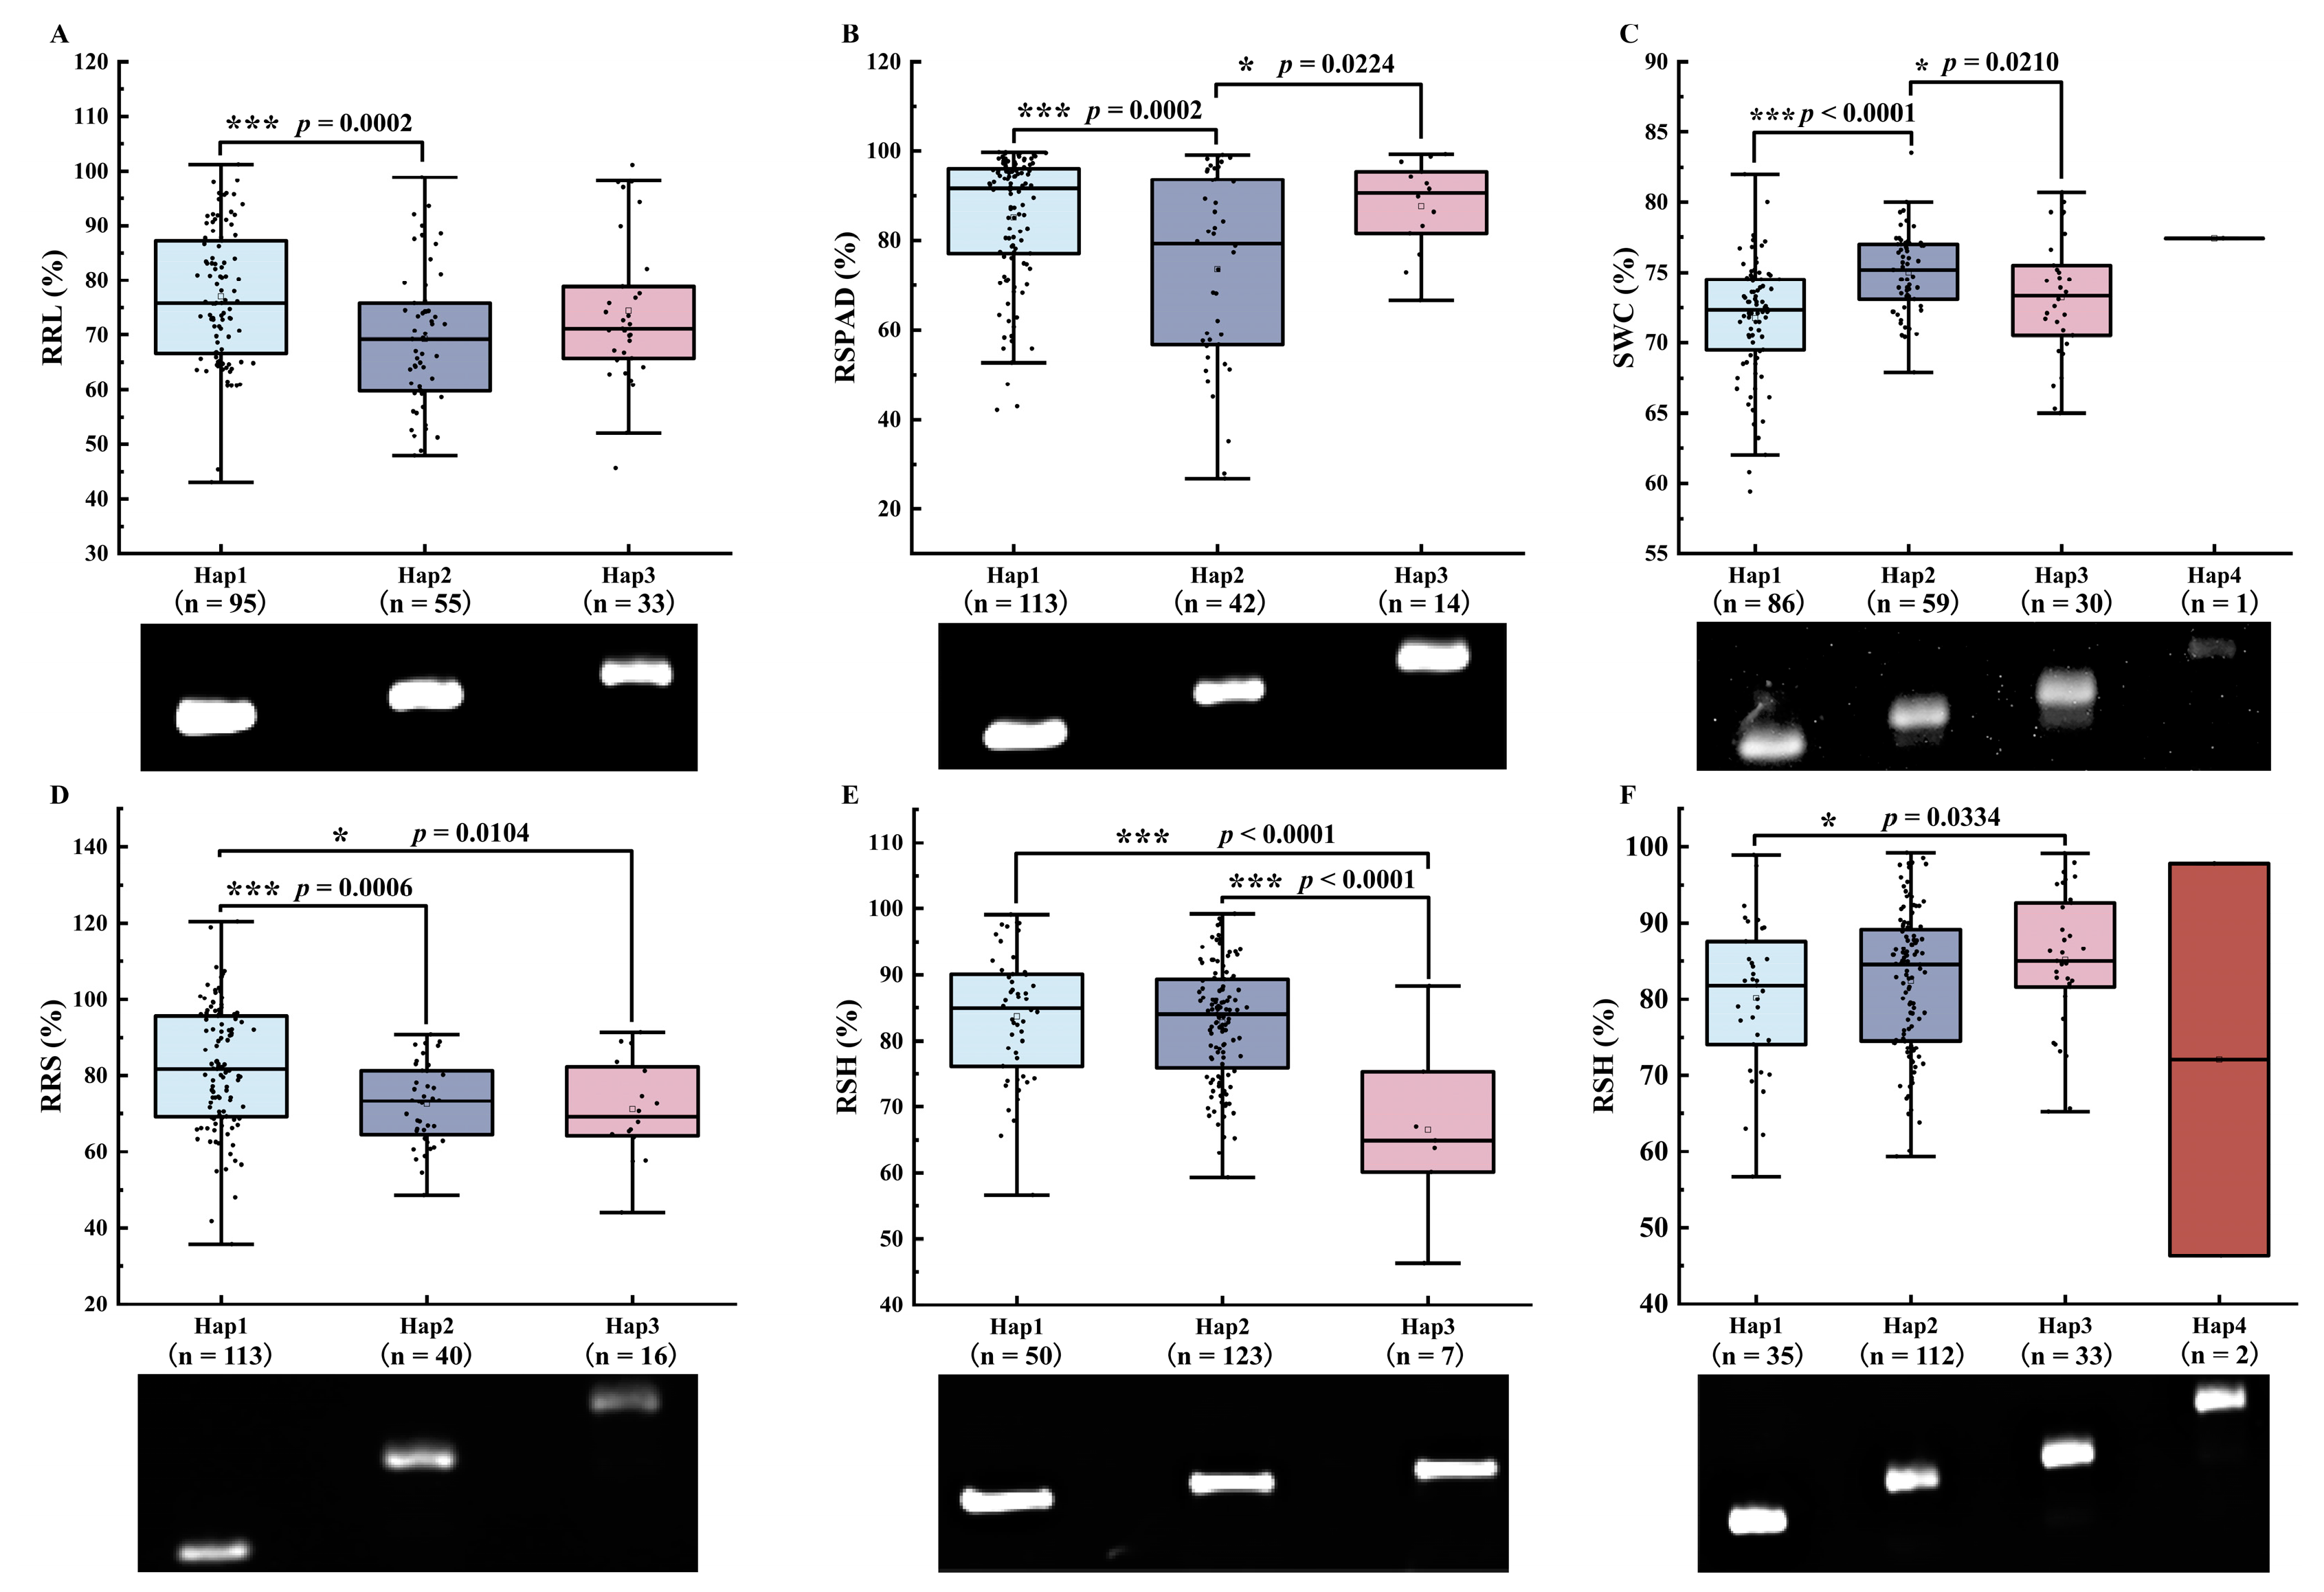
3.8.3. Analysis of Differences in Salt Tolerance among Different Haplotypes at Significantly Associated Loci

Haplotype analysis of the 14 InDel markers obtained by GWASs that were significantly associated with salt tolerance was performed for different salt-tolerance-related traits. Out of these markers, six were found to have significant differences among the haplotypes (Figure 7). Three haplotypes of 1IM25.45Mb were significantly associated with RRL (Figure 7A). Among these haplotypes, Hap1 and Hap2 exhibited highly significant differences in RRL (p < 0.001). The InDel marker 2IM25.33Mb, associated with RSPAD, had three haplotypes (Figure 7B). Among these haplotypes, Hap1 and Hap2 had a highly significant difference in RSPAD (p < 0.001), and Hap2 and Hap3 had a significant difference in RSPAD (p < 0.05). Four haplotypes of 5IM0.17Mb, Hap1, Hap2, Hap3, and Hap4, were significantly associated with SWC (Figure 7C). The difference in SWC between Hap1 and Hap2 was highly significant (p < 0.0001), and the difference between Hap2 and Hap3 was significant (p < 0.05). Three haplotypes of 5IM19.41Mb had different RRS, with a highly significant difference between Hap1 and Hap2 (p < 0.001) and a significant difference between Hap1 and Hap3 (p < 0.05) (Figure 7D). Among the three variations in 10IM11.19Mb, Hap1 and Hap2 had much significantly higher RSH than Hap3 (p < 0.0001), although the difference between Hap1 and Hap2 was not significant (Figure 7E). Another InDel marker, 12IM14.92Mb, had four haplotypes, where only were Hap1 and Hap3 significantly different in RSH (p < 0.05) (Figure 7F).

4. Discussion

4.1. Genome-Wide Distribution Characteristics of InDel Loci in Different Rice Types in Relation to Rice Domestication

Natural variations among cultivars, wild species, and landraces provide the genetic diversity necessary for crop breeding and improvement. Throughout crop domestication and improvement processes, the differential selection of alleles plays a significant role in determining the variation in crop yield and other important agronomic traits. The most valuable alleles are typically obtained from direct homologs of the landrace or closely related species. Mutations in the promoter or CDS regions usually cause phenotypic differences in haplotypes. With the advances in DNA sequencing technology, researchers have become interested in using whole-genome re-sequencing data to explore the genomic variations in various types of rice and to understand the intricate history of rice domestication [39,40,41,42]. The process of domestication through both natural and artificial selection has led to a notable decrease in genetic diversity and allele frequency across the genome of rice [43]. Chai et al. analyzed whole-genome re-sequencing data from three rice varieties: PSRR-1 (weedy rice), Bengal (japonica rice), and Nona Bokra (indica rice). The total number of InDels in PSRR-1/Bengal was 85,016, which was similar to that of Bengal/Nona Bokra (102,242), but more than twice as large as that of PSRR-1/Nona Bokra (36,163) [44]. This indicated that PSRR-1 was genetically closer to Nona Bokra than to Bengal and exhibited a closer resemblance to the indica rice. Wang et al. demonstrated that introns may play essential roles in the occurrence of InDels in rice through their research on intronic length polymorphisms (ILPs) [45]. Through the correlation of promoter InDel polymorphism and heterotic gene expression in rice hybrids, Zhang et al. discovered a significant number of InDel loci in the promoter region of rice [46]. Their findings indicated that the distribution characteristics of InDel in the intron and promoter regions would be useful for the studies of genome evolution and inter-subspecies heterosis [45,46]. In this study, we found that the number and frequency of InDel loci were significantly higher in japonica landraces than in japonica cultivars. On average, there were 11,125 InDel loci per chromosome and 354 InDels/Mb in japonica landraces, whereas in japonica cultivars, there were, on average, only 6,234 InDel loci per chromosome and 197 InDels/Mb (Table 1). This indicated that during the domestication of japonica rice, japonica landraces emerged as an intermediate type of rice between wild rice and japonica rice cultivars through either artificial or natural selection. In addition, InDel loci were mainly distributed in the intergenic regions, introns, and the upstream (especially the promoter region) and downstream regions of genes, which was similar in japonica landraces and cultivars.

4.2. Development and Application of InDel Markers in Rice Breeding

With the rapid development of high-throughput sequencing technology and the decreasing cost of sequencing, the development of InDel markers by re-sequencing has increasingly been used in rice research. Shen et al. developed 108 InDel markers from selected InDel loci with lengths ranging between 25 and 50 bp identified between Nipponbare and 93-11 by re-sequencing. Hu et al. developed 346 InDel markers by comparing the genome sequences of two indica rice varieties (ZS97 and MH63) and one japonica rice variety (Nipponbare) [47]. Ma et al. discovered 373,501 InDel loci among three Dongxiang wild rice accessions and generated 217 InDel markers. Out of those markers, 203 were found to be polymorphisms between Dongxiang wild rice and Nipponbare, with an average distance of 1.9 Mb/locus [48]. However, most studies have concentrated on developing InDel markers between wild and cultivated rice or among subspecies, with only a few studies examining genome-wide InDel markers within the same subspecies. In this study, we performed whole-genome re-sequencing on four japonica landraces and three japonica cultivars to develop japonica-specific markers. We identified 775,068 InDel loci using Nipponbare as the reference genome and developed 402 evenly distributed markers across 12 chromosomes (Figure 4). The average marker density was 0.95Mb/locus.
InDel markers have gained widespread usage in genetic diversity assessments, germplasm identification, and gene mapping in recent years. Hu et al. utilized two markers, namely, LInD1-28 and LInD2-109, to ascertain the authenticity of 88 offspring generated from the cross of ZS97 with MH63 [47]. Their results showed that out of the 88 hybrids, 81 were authentic. Moreover, 55 LInDel markers were developed either in crucial regions of functional genes or closely associated with genes, which may facilitate research on the genetics and MAS of rice. Yuan et al. mapped a primary cold tolerance QTL qCT2.1 using 285 InDel markers in rice seedlings [49]. The QTL was situated within a 1.7 Mb region between two markers, dxw-4 and dxw-9. Li et al. created two F2 populations using two introgression lines (ILs), RBPH16 and RBPH17, derived from wild rice, GX2183 [50]. Using MAS and backcrossing with the aid of five InDel markers located within the initial mapping interval, the location of Bph36 was narrowed down to a 38 kb region between two markers, X48 and S13, on the short arm of chromosome 4. This discovery may offer a new way to enhance the resistance of rice against BPH using molecular techniques. In the present study, 402 InDel markers were developed based on the re-sequencing data of seven japonica rice accessions. The genetic diversity and population structure of the 182 japonica rice accessions were analyzed. Out of the 402 InDel markers, 93.3% showed moderate to high polymorphism. The average Shannon information index value was 0.81, and the average Nei’s genetic diversity index value was 0.50. Additionally, the mean value of PIC was 0.42 (Supplementary Table S2). The 182 japonica rice accessions were effectively sorted into four subgroups using InDel markers, which provided a foundation for conducting GWAS analysis on traits related to salt tolerance (Figure 5C–E). The results of the salt tolerance analysis of different haplotypes showed that there were significant differences in salt tolerance among different haplotypes of the six InDel markers (Figure 7). Among them, the RSPAD of Hap3 with 2IM25.33Mb was significantly higher than that of Hap1 and Hap2, containing only a small amount of rice accessions. To investigate the source of this variation, we searched the RiceVarMap (v2.0) database (ricevarmap.ncpgr.cn/, accessed on 13 July 2023) [51]. The results showed that Hap3 of 2IM25.33 Mb was a rare allele in both japonica and indica rice but was not possessed in aus. It might be a salt-tolerant genotype formed by natural variation during the process of rice domestication. In rice breeding, this haplotype should be preserved. In contrast, Hap3 of 10IM11.19Mb, a salt-sensitive allele of rice exhibiting lower RSH and accession numbers than both Hap1 and Hap2, was mainly derived from aus. Therefore, Hap3 of 10IM11.19Mb should be excluded by MAS in rice breeding.

4.3. Comparison with the Salt-Tolerance-Related QTLs Reported Previously

In this study, we identified 14 InDel loci through GWAS, which showed significant correlations with salt-tolerance-related traits in rice seedlings. Out of these, five InDel loci were similar to or overlapped with QTLs for salt-tolerance-related traits discovered in previous studies (Table 5). The locus 1IM14.63Mb, located on rice chromosome 1 at 14.63Mb, was significantly associated with SWC. This locus was near the reported interval of qSNC1 (regulation of shoot Na+ contents) [37]. The 4IM19.96Mb loci located on rice chromosome 4 at 19.96Mb had a significant association with SWC. It was near the reported locus qSNa12_4.1 (regulation of relative shoot Na+ contents) [38]. Locus 2IM25.33Mb on chromosome 2 at position 25.33Mb was significantly associated with RSPAD, aligned with the previously reported mapping interval of qSFWn2.2 (influence on relative shoot fresh weight) [35]. The 10IM6.24Mb located on chromosome 10 at 6.24Mb was significantly associated with RSFW, RRFW, RRDW, and RPDW. Two previously reported loci, qRFWs10.1 (influence on relative root fresh weight) and qRLs10.1 (influence on relative root length), were located in this region [35]. We also found that 9IM10.36Mb, located at the genomic region of chromosome 9 at position 10.36 Mb, was closely related to RSPAD. This region was adjacent to the previously reported mapping interval of qRFW9.1 (influence on relative root fresh weight) [36]. Additionally, the correlation analysis revealed a significant positive relationship between RSPAD and RRFW under salt stress.

4.4. Analysis of Cloned Genes within or near the InDel-Linked Locus Regions

Regions of the genome significantly associated with certain traits were identified based on GWAS significance thresholds. Through linkage disequilibrium analysis, 92 kb upstream and downstream of each locus was defined as its confidence interval (Supplementary Figure S3). Through GWAS analysis, we identified 28 InDel alleles that were significantly associated with salt tolerance. Within the confidence intervals of these candidate loci, a total of 379 annotated genes, including 15 cloned genes, were identified (Table 6) [52,53,54,55,56,57,58,59,60,61,62,63,64,65,66]. These genes perform crucial functions in rice, such as drought resistance [52,63], disease resistance [53,58], environmental adaptation [57], signal transduction [55,64], seed germination and pollen development [60,62,65,66], and salt tolerance [54]. Locus 4IM19.96Mb, located on chromosome 4, was significantly associated with SWC; its candidate interval contained one cloned gene, OsHAK1 (high-affinity potassium transporter gene, LOC_Os04g32920) [54]. In rice, the expression of OsHAK1 was increased in both roots and shoots under salt stress. When OsHAK1 was overexpressed, seedlings showed increased photosynthetic rates, chlorophyll contents, proline accumulation, and decreased levels of lipid peroxidation, which demonstrated greater salt tolerance.
In addition, several genes near the associated InDel locus interval may play important roles in regulating salt tolerance in rice. An InDel marker, 1IM25.45Mb, located on chromosome 1 was significantly associated with RRL. Near the interval of this locus, Nan et al. discovered a candidate gene, OsMDH1 (NAD-dependent malate dehydrogenase 1, LOC_Os01g61380) [67]. OsMDH1 was expressed in several tissues in rice, including leaves, leaf sheaths, spikes, glumes, buds, roots, and stems under salt stress, and the salt tolerance of rice was negatively affected by altering the concentration of vitamin B6 in tissues [67]. Marker 3IM14.70Mb, located on chromosome 3, was significantly associated with RSH. OsSAPK1 (stress/ABA-activated protein kinase 1, LOC_Os03g27280), identified by Lou et al., was located near this marker. OsSAPK1 functions cooperatively with stress/ABA-activated protein kinase 2 (SAPK2) during rice germination and seedling development and positively regulates salt tolerance in rice by promoting metabolite synthesis and regulating osmotic potential [68]. Additionally, OsSAPK1 regulated the Na+ gradient between roots and shoots, transmembrane Na+ fluxes, and intracellular Na+ homeostasis. Near the interval of 12IM24.74Mb on chromosome 12, a plasma membrane Na+/H+ exchanger gene, OsSOS1 (LOC_Os12g44360), was identified by Martínez-Atienza et al. As a plasma membrane Na+/H+ exchange protein-encoding gene, OsSOS1 was induced under salt stress, which implies its key role in maintaining Na+/K+ ion homeostasis in rice [69].

5. Conclusions

The distribution characteristics of InDel loci across the genome of japonica landraces and cultivars were basically the same, mainly occurring in the intergenic region and upstream, downstream, and in the introns of genes. Japonica landraces showed a higher frequency of InDel loci compared with japonica cultivars. The lengths of InDel ranged from 1 to 50 bp, with the majority of insertions/deletions being 1 to 5 bp. Based on this, 402 InDel markers with high polymorphic and good amplification specificity were developed. These markers were evenly distributed on the 12 chromosomes of rice. Using these markers, GWASs were conducted to detect QTLs and identify candidate genes associated with salt tolerance in a panel of 182 japonica rice accessions. In total, 14 InDels significantly associated with salt tolerance were identified by GWASs on rice chromosomes 1, 2, 3, 4, 5, 9, 10, and 12. Twenty-eight allelic variants were identified, explaining 6.83% to 11.22% of the phenotypic variations. One InDel locus (10IM6.24Mb-2) was associated with RSFW, RRFW, RRDW, and RPDW. Six InDel markers were significantly (p < 0.05) or highly significantly (p < 0.001) associated with salt-tolerance-related traits in haplotype analysis. Overall, these findings further our understanding of the distribution patterns of InDel loci in different types of japonica rice accessions. The InDel markers developed in the study can be used for genetic diversity and population structure analysis, GWAS, QTL mapping, and the molecular identification of salt tolerance in japonica rice accessions.

Supplementary Materials

The following supporting information can be downloaded at: https://www.mdpi.com/article/10.3390/agriculture13081573/s1. Figure S1: Analysis of Delta K of subgroups of the 182 japonica rice accessions; Figure S2: Manhattan and Q-Q plots for GWAS of STS, LDP, and RSDW in rice at the seedling stage.; Figure S3: LD decay; Table S1: Names, origins, and types of 182 japonica rice accessions; Table S2: Genetic diversity of 182 japonica rice accessions with InDel markers, Table S3 InDel marker primers information.

Author Contributions

Conceptualization, L.T. and J.S.; methodology, H.Y.; software, H.Y.; validation, H.Y., J.S. and L.T.; formal analysis, H.Y.; investigation, H.Y. and C.Q.; resources, L.T.; data curation, H.Y., K.D., P.F., W.K. and T.B.; writing—original draft preparation, H.Y. and J.S.; writing—review and editing, J.S. and L.T.; visualization, H.Y., J.S., K.D., C.Z., S.M., Y.Z. and P.L.; supervision, L.T.; project administration, L.T. All authors have read and agreed to the published version of the manuscript.

Funding

This work was supported by grants from the National Natural Science Foundation of China (32260492), the Natural Science Foundation of Ningxia Outstanding Youth Project (2022AAC05011), and the National Key Research and Development Program of China (2021YFD1900603).

Institutional Review Board Statement

Not applicable.

Data Availability Statement

Data generated and analyzed during this study are contained in this manuscript.

Acknowledgments

The authors are grateful for the research laboratory facilities provided by the School of Agriculture, Ningxia University, Ningxia, China.

Conflicts of Interest

The authors declare no conflict of interest.

References

  1. Wang, W.; Mauleon, R.; Hu, Z.; Chebotarov, D.; Tai, S.; Wu, Z.; Li, M.; Zheng, T.; Fuentes, R.R.; Zhang, F.; et al. Genomic variation in 3010 diverse accessions of Asian aultivated rice. Nature 2018, 557, 43–49. [Google Scholar] [CrossRef] [PubMed] [Green Version]
  2. Yang, X.; Xia, X.; Zhang, Z.; Nong, B.; Zeng, Y.; Xiong, F.; Wu, Y.; Gao, J.; Deng, G.; Li, D. QTL mapping by whole genome re-sequencing and analysis of candidate genes for nitrogen use efficiency in rice. Front. Plant Sci. 2017, 8, 1634. [Google Scholar] [CrossRef] [PubMed] [Green Version]
  3. Huang, X.; Feng, Q.; Qian, Q.; Zhao, Q.; Wang, L.; Wang, A.; Guan, J.; Fan, D.; Weng, Q.; Huang, T.; et al. High-throughput genotyping by whole-genome resequencing. Genome Res. 2009, 19, 1068–1076. [Google Scholar] [CrossRef] [PubMed] [Green Version]
  4. Xie, W.; Feng, Q.; Yu, H.; Huang, X.; Zhao, Q.; Xing, Y.; Yu, S.; Han, B.; Zhang, Q. Parent-independent genotyping for constructing an ultrahigh-density linkage map based on population sequencing. Proc. Natl. Acad. Sci. USA 2010, 107, 10578–10583. [Google Scholar] [CrossRef]
  5. Yang, J.; Wang, Y.; Shen, H.; Yang, W. In silico identification and experimental validation of insertion-deletion polymorphisms in tomato genome. DNA Res. 2014, 21, 429–438. [Google Scholar] [CrossRef] [Green Version]
  6. Lü, Y.; Cui, X.; Li, R.; Huang, P.; Zong, J.; Yao, D.; Li, G.; Zhang, D.; Yuan, Z. Development of genome-wide insertion/deletion markers in rice based on graphic pipeline platform. J. Integr. Plant Biol. 2015, 57, 980–991. [Google Scholar] [CrossRef] [Green Version]
  7. Pan, G.; Li, Z.; Huang, S.; Tao, J.; Shi, Y.; Chen, A.; Li, J.; Tang, H.; Chang, L.; Deng, Y.; et al. Genome-wide development of insertion-deletion (InDel) markers for Cannabis and its uses in genetic structure analysis of Chinese germplasm and sex-linked marker identification. BMC Genom. 2021, 22, 595. [Google Scholar] [CrossRef]
  8. Wang, H.; Zhu, Y.; Xiao, C.; Yuan, J.; Liu, Y.; Zhang, Q. Development of a set of InDel markers for characterizing three japonica rice (Oryza sativa L.) varieties. Plant Genet. Resour. 2023, 20, 304–307. [Google Scholar] [CrossRef]
  9. Shen, Y.; Jiang, H.; Jin, J.; Zhang, Z.; Xi, B.; He, Y.; Wang, G.; Wang, C.; Qian, L.; Li, X.; et al. Development of genome-wide DNA polymorphism database for map-based cloning of rice genes. Plant Physiol. 2004, 135, 1198–1205. [Google Scholar] [CrossRef] [Green Version]
  10. Yuan, H.; Yang, W.; Zou, J.; Cheng, M.; Fan, F.; Liang, T.; Yu, Y.; Qiu, R.; Li, S.; Hu, J. InDel markers based on 3K whole-genome re-sequencing data characterise the subspecies of rice (Oryza sativa L.). Agriculture 2021, 11, 655. [Google Scholar] [CrossRef]
  11. Ji, H.; Shin, Y.; Lee, C.; Oh, H.; Yoon, I.S.; Baek, J.; Cha, Y.-S.; Lee, G.-S.; Kim, S.L.; Kim, K.-H. Genomic variation in Korean japonica rice varieties. Genes 2021, 12, 1749. [Google Scholar] [CrossRef]
  12. Yano, K.; Yamamoto, E.; Aya, K.; Takeuchi, H.; Lo, P.; Hu, L.; Yamasaki, M.; Yoshida, S.; Kitano, H.; Hirano, K.; et al. Genome-wide association study using whole-genome sequencing rapidly identifies new genes influencing agronomic traits in rice. Nat. Genet. 2016, 48, 927–934. [Google Scholar] [CrossRef]
  13. Hossain, H.; Rahman, M.A.; Alam, M.S.; Singh, R.K. Mapping of quantitative trait loci associated with reproductive-stage salt tolerance in rice. J. Agron. Crop Sci. 2015, 201, 17–31. [Google Scholar] [CrossRef]
  14. Lei, L.; Zheng, H.; Bi, Y.; Yang, L.; Liu, H.; Wang, J.; Sun, J.; Zhao, H.; Li, X.; Li, J.; et al. Identification of a major QTL and candidate gene analysis of salt tolerance at the bud burst stage in rice (Oryza sativa L.) using QTL-seq and RNA-seq. Rice 2020, 13, 55. [Google Scholar] [CrossRef]
  15. Qin, H.; Li, Y.; Huang, R. Advances and challenges in the breeding of salt-tolerant rice. Int. J. Mol. Sci. 2020, 21, 8385. [Google Scholar] [CrossRef]
  16. Shi, Y.; Gao, L.; Wu, Z.; Zhang, X.; Wang, M.; Zhang, C.; Zhang, F.; Zhou, Y.; Li, Z. Genome-wide association study of salt tolerance at the seed germination stage in rice. BMC Plant Biol. 2017, 17, 92. [Google Scholar] [CrossRef] [Green Version]
  17. Chen, C.; Norton, G.J.; Price, A.H. Genome-wide association mapping for salt tolerance of rice seedlings grown in hydroponic and soil systems using the Bengal and assam Aus Panel. Front. Plant Sci. 2020, 11, 576479. [Google Scholar] [CrossRef]
  18. Ren, Z.; Gao, J.; Li, L.; Cai, X.; Huang, W.; Chao, D.; Zhu, M.; Wang, Z.; Luan, S.; Lin, H. A rice quantitative trait locus for salt tolerance encodes a sodium transporter. Nat. Genet. 2005, 37, 1141–1146. [Google Scholar] [CrossRef]
  19. Yu, J.; Zao, W.; He, Q.; Kim, T.-S.; Park, Y.-J. Genome-wide association study and gene set analysis for understanding candidate genes involved in salt tolerance at the rice seedling stage. Mol. Genet. Genom. 2017, 292, 1391–1403. [Google Scholar] [CrossRef]
  20. Song, J.; Yang, H.; Qiao, C.; Zhu, C.; Bai, T.; Du, H.; Ma, S.; Wang, N.; Luo, C.; Zhang, Y.; et al. Natural variations of chlorophyll fluorescence and ion transporter genes influenced the differential response of japonica rice germplasm with different salt tolerances. Front. Plant Sci. 2023, 14, 1095929. [Google Scholar] [CrossRef]
  21. Ma, S.; Tian, R.; Hu, H.; Lv, J.; Tian, L.; Luo, C.; Zhang, Y.; Li, P. Comprehensive evaluation and selection of rice (Oryza sativa japonica) germplasm for saline tolerance at seedling stage. J. Plant Genet. Resour. 2020, 21, 1089–1101. [Google Scholar] [CrossRef]
  22. Li, H.; Durbin, R. Fast and accurate short read alignment with Burrows-Wheeler transform. Bioinformatics 2009, 25, 1754–1760. [Google Scholar] [CrossRef] [PubMed] [Green Version]
  23. McKenna, A.; Hanna, M.; Banks, E.; Sivachenko, A.; Cibulskis, K.; Kernytsky, A.; Garimella, K.; Altshuler, D.; Gabriel, S.; Daly, M.; et al. The genome analysis toolkit: A MapReduce framework for analyzing next-generation DNA sequencing data. Genome Res. 2010, 20, 1297–1303. [Google Scholar] [CrossRef] [PubMed] [Green Version]
  24. Cingolani, P.; Platts, A.; Wang, L.L.; Coon, M.; Nguyen, T.; Wang, L.; Land, S.J.; Lu, X.; Ruden, D.M. A program for annotating and predicting the effects of single nucleotide polymorphisms, SnpEff: SNPs in the genome of Drosophila melanogaster strain w1118; iso-2; iso-3. Fly 2012, 6, 80–92. [Google Scholar] [CrossRef] [Green Version]
  25. Zhang, X.; Wang, L.; Shou, L. Modified CTAB method for extracting genomic DNA from wheat leaf. J. Agric. Sci. Technol. 2013, 14, 946–949. [Google Scholar] [CrossRef]
  26. Bhattacharya, D.; Van Meir, E.G. A simple genotyping method to detect small CRISPR-Cas9 induced indels by agarose gel electrophoresis. Sci. Rep. 2019, 9, 4437. [Google Scholar] [CrossRef] [Green Version]
  27. Liu, K.; Muse, S.V. PowerMarker: An integrated analysis environment for genetic marker analysis. Bioinformatics 2005, 21, 2128–2129. [Google Scholar] [CrossRef] [Green Version]
  28. Wang, B.; Guo, X.; Zhao, P.; Ruan, M.; Yu, X.; Zou, L.; Yang, Y.; Li, X.; Deng, D.; Xiao, J.; et al. Molecular diversity analysis, drought related marker-traits association mapping and discovery of excellent alleles for 100-day old plants by EST-SSRs in cassava germplasms (Manihot esculenta Cranz). PLoS ONE 2017, 12, e0177456. [Google Scholar] [CrossRef] [Green Version]
  29. Falush, D.; Stephens, M.; Pritchard, J.K. Inference of population structure using multilocus genotype data: Linked loci and correlated allele frequencies. Genetics 2003, 164, 1567–1587. [Google Scholar] [CrossRef]
  30. Evanno, G.; Regnaut, S.; Goudet, J. Detecting the number of clusters of individuals using the software STRUCTURE: A simulation study. Mol. Ecol. 2005, 14, 2611–2620. [Google Scholar] [CrossRef] [Green Version]
  31. Remington, D.L.; Thornsberry, J.M.; Matsuoka, Y.; Wilson, L.M.; Whitt, S.R.; Doebley, J.; Kresovich, S.; Goodman, M.M.; Buckler, E.S. Structure of linkage disequilibrium and phenotypic associations in the maize genome. Proc. Natl. Acad. Sci. USA 2001, 98, 11479–11484. [Google Scholar] [CrossRef]
  32. Peakall, R.; Smouse, P.E. GenAlEx 6.5: Genetic analysis in Excel. Population genetic software for teaching and research—An update. Bioinformatics 2012, 28, 2537–2539. [Google Scholar] [CrossRef] [Green Version]
  33. Bradbury, P.J.; Zhang, Z.; Kroon, D.E.; Casstevens, T.M.; Ramdoss, Y.; Buckler, E.S. TASSEL: Software for association mapping of complex traits in diverse samples. Bioinformatics 2007, 23, 2633–2635. [Google Scholar] [CrossRef] [Green Version]
  34. Huang, X.; Wei, X.; Sang, T.; Zhao, Q.; Feng, Q.; Zhao, Y.; Li, C.; Zhu, C.; Lu, T.; Zhang, Z.; et al. Genome-wide association studies of 14 agronomic traits in rice landraces. Nat. Genet. 2010, 42, 961–967. [Google Scholar] [CrossRef]
  35. Nayyeripasand, L.; Garoosi, G.A.; Ahmadikhah, A. Genome-wide association study (GWAS) to identify salt-tolerance QTLs carrying novel candidate genes in rice during early vegetative stage. Rice 2021, 14, 9. [Google Scholar] [CrossRef]
  36. Bizimana, J.B.; Luzi-Kihupi, A.; Murori, R.W.; Singh, R.K. Identification of quantitative trait loci for salinity tolerance in rice (Oryza sativa L.) using IR29/Hasawi mapping population. J. Genet. 2017, 96, 571–582. [Google Scholar] [CrossRef]
  37. Naveed, S.A.; Zhang, F.; Zhang, J.; Zheng, T.-Q.; Meng, L.-J.; Pang, Y.-L.; Xu, J.-L.; Li, Z.-K. Identification of QTN and candidate genes for salinity tolerance at the germination and seedling stages in rice by genome-wide association analyses. Sci. Rep. 2018, 8, 6505. [Google Scholar] [CrossRef] [Green Version]
  38. Batayeva, D.; Labaco, B.; Ye, C.; Li, X.; Usenbekov, B.; Rysbekova, A.; Dyuskalieva, G.; Vergara, G.; Reinke, R.; Leung, H. Genome-wide association study of seedling stage salinity tolerance in temperate japonica rce germplasm. BMC Genet. 2018, 19, 2. [Google Scholar] [CrossRef] [Green Version]
  39. Choi, J.Y.; Zaidem, M.; Gutaker, R.; Dorph, K.; Singh, R.K.; Purugganan, M.D. The complex geography of domestication of the African rice Oryza glaberrima. PLoS Genet. 2019, 15, e1007414. [Google Scholar] [CrossRef] [Green Version]
  40. Cubry, P.; Tranchant-Dubreuil, C.; Thuillet, A.-C.; Monat, C.; Ndjiondjop, M.-N.; Labadie, K.; Cruaud, C.; Engelen, S.; Scarcelli, N.; Rhoné, B.; et al. The rise and fall of African rice cultivation revealed by analysis of 246 new genomes. Curr. Biol. 2018, 28, 2274–2282.e6. [Google Scholar] [CrossRef] [Green Version]
  41. Veltman, M.A.; Flowers, J.M.; van Andel, T.R.; Schranz, M.E. Origins and geographic diversification of African rice (Oryza glaberrima). PLoS ONE 2019, 14, e0203508. [Google Scholar] [CrossRef] [PubMed] [Green Version]
  42. Wang, M.; Yu, Y.; Haberer, G.; Marri, P.R.; Fan, C.; Goicoechea, J.L.; Zuccolo, A.; Song, X.; Kudrna, D.; Ammiraju, J.S.S.; et al. The genome sequence of African rice (Oryza glaberrima) and evidence for independent domestication. Nat. Genet. 2014, 46, 982–988. [Google Scholar] [CrossRef] [PubMed] [Green Version]
  43. Zhang, J.; Zhang, D.; Fan, Y.; Li, C.; Xu, P.; Li, W.; Sun, Q.; Huang, X.; Zhang, C.; Wu, L.; et al. The identification of grain size genes by RapMap reveals directional selection during rice domestication. Nat. Commun. 2021, 12, 5673. [Google Scholar] [CrossRef] [PubMed]
  44. Chai, C.; Shankar, R.; Jain, M.; Subudhi, P.K. Genome-wide discovery of DNA polymorphisms by whole genome sequencing differentiates weedy and cultivated rice. Sci. Rep. 2018, 8, 14218. [Google Scholar] [CrossRef] [Green Version]
  45. Wang, X.; Zhao, X.; Zhu, J.; Wu, W. Genome-wide investigation of intron length polymorphisms and their potential as molecular markers in rice (Oryza sativa L.). DNA Res. 2006, 12, 417–427. [Google Scholar] [CrossRef] [Green Version]
  46. Zhang, H.; He, H.; Chen, L.; Li, L.; Liang, M.; Wang, X.; Liu, X.; He, G.; Chen, R.; Ma, L.; et al. A genome-wide transcription analysis reveals a close correlation of promoter INDEL polymorphism and heterotic gene expression in rice hybrids. Mol. Plant 2008, 1, 720–731. [Google Scholar] [CrossRef] [Green Version]
  47. Hu, W.; Zhou, T.; Wang, P.; Wang, B.; Song, J.; Han, Z.; Chen, L.; Liu, K.; Xing, Y. Development of whole-genome agarose-resolvable LInDel markers in rice. Rice 2020, 13, 1. [Google Scholar] [CrossRef]
  48. Ma, X.; Tang, J.; Zhang, J.; Cui, D.; Li, H.; Li, M.; Han, L. Development of molecular markers polymorphic between Dongxiang wild rice and Geng rice cultivar ‘Nipponbare’. Zuo Wu Xue Bao 2019, 45, 316–321. [Google Scholar] [CrossRef]
  49. Yuan, R.; Zhao, N.; Usman, B.; Luo, L.; Liao, S.; Qin, Y.; Nawaz, G.; Li, R. Development of chromosome segment substitution lines (CSSLs) derived from guangxi wild rice (Oryza rufipogon Griff.) under rice (Oryza sativa L.) background and the identification of QTLs for plant architecture, agronomic traits and cold tolerance. Genes 2020, 11, 980. [Google Scholar] [CrossRef]
  50. Li, Z.; Xue, Y.; Zhou, H.; Li, Y.; Usman, B.; Jiao, X.; Wang, X.; Liu, F.; Qin, B.; Li, R.; et al. High-resolution mapping and breeding application of a novel brown planthopper resistance gene derived from wild rice (Oryza. rufipogon Griff). Rice 2019, 12, 41. [Google Scholar] [CrossRef] [Green Version]
  51. Zhao, H.; Yao, W.; Ouyang, Y.; Yang, W.; Wang, G.; Lian, X.; Xing, Y.; Chen, L.; Xie, W. RiceVarMap: A comprehensive database of rice genomic variations. Nucleic Acids Res. 2015, 43, D1018–D1022. [Google Scholar] [CrossRef]
  52. Liu, J.; Zhou, J.; Xing, D. Phosphatidylinositol 3-kinase plays a vital role in regulation of rice seed vigor via altering NADPH oxidase activity. PLoS ONE 2012, 7, e33817. [Google Scholar] [CrossRef]
  53. Delteil, A.; Gobbato, E.; Cayrol, B.; Estevan, J.; Michel-Romiti, C.; Dievart, A.; Kroj, T.; Morel, J.-B. Several wall-associated kinases participate positively and negatively in basal defense against rice blast fungus. BMC Plant Biol. 2016, 16, 17. [Google Scholar] [CrossRef] [Green Version]
  54. Chen, G.; Liu, C.; Gao, Z.; Zhang, Y.; Zhang, A.; Zhu, L.; Hu, J.; Ren, D.; Yu, L.; Xu, G.; et al. Variation in the abundance of OsHAK1 transcript underlies the differential salinity tolerance of an indica and a japonica rice cultivar. Front. Plant Sci. 2018, 8, 2216. [Google Scholar] [CrossRef] [Green Version]
  55. Deng, M.; Hu, B.; Xu, L.; Liu, Y.; Wang, F.; Zhao, H.; Wei, X.; Wang, J.; Yi, K. OsCYCP1;1, a PHO80 homologous protein, negatively regulates phosphate starvation signaling in the roots of rice (Oryza sativa L.). Plant Mol. Biol. 2014, 86, 655–669. [Google Scholar] [CrossRef]
  56. You, X.; Zhu, S.; Zhang, W.; Zhang, J.; Wang, C.; Jing, R.; Chen, W.; Wu, H.; Cai, Y.; Feng, Z.; et al. OsPEX5 regulates rice spikelet development through modulating jasmonic acid biosynthesis. New Phytol. 2019, 224, 712–724. [Google Scholar] [CrossRef]
  57. Kim, S.-K.; You, Y.N.; Park, J.C.; Joung, Y.; Kim, B.-G.; Ahn, J.C.; Cho, H.S. The rice thylakoid lumenal cyclophilin OsCYP20-2 confers enhanced environmental stress tolerance in tobacco and Arabidopsis. Plant Cell Rep. 2012, 31, 417–426. [Google Scholar] [CrossRef]
  58. Wu, T.; Peng, C.; Li, B.; Wu, W.; Kong, L.; Li, F.; Chu, Z.; Liu, F.; Ding, X. OsPGIP1-mediated resistance to bacterial leaf streak in rice is beyond responsive to the polygalacturonase of Xanthomonas oryzae pv. oryzicola. Rice 2019, 12, 90. [Google Scholar] [CrossRef] [Green Version]
  59. Li, Q.; Deng, Z.; Gong, C.; Wang, T. The rice eukaryotic translation initiation factor 3 subunit f (OseIF3f) is involved in microgametogenesis. Front. Plant Sci. 2016, 7, 532. [Google Scholar] [CrossRef] [Green Version]
  60. Huang, Z.; Ying, J.; Peng, L.; Sun, S.; Huang, C.; Li, C.; Wang, Z.; He, Y. A genome-wide association study reveals that the cytochrome B5 involved in seed reserve mobilization during seed germination in rice. Theor. Appl. Genet. 2021, 134, 4067–4076. [Google Scholar] [CrossRef]
  61. Choi, J.; Lee, J.; Kim, K.; Cho, M.; Ryu, H.; An, G.; Hwang, I. Functional identification of OsHk6 as a homotypic cytokinin receptor in rice with preferential affinity for iP. Plant Cell Physiol. 2012, 53, 1334–1343. [Google Scholar] [CrossRef] [PubMed] [Green Version]
  62. Lee, S.-K.; Eom, J.-S.; Hwang, S.-K.; Shin, D.; An, G.; Okita, T.W.; Jeon, J.-S. Plastidic phosphoglucomutase and ADP-glucose pyrophosphorylase mutants impair starch synthesis in rice pollen grains and cause male sterility. J. Exp. Bot. 2016, 67, 5557–5569. [Google Scholar] [CrossRef] [PubMed] [Green Version]
  63. Gao, W.; Li, M.; Yang, S.; Gao, C.; Su, Y.; Zeng, X.; Jiao, Z.; Xu, W.; Zhang, M.; Xia, K. MiR2105 and the kinase OsSAPK10 co-regulate OsbZIP86 to mediate drought-induced ABA biosynthesis in rice. Plant Physiol. 2022, 189, 889–905. [Google Scholar] [CrossRef] [PubMed]
  64. Chinpongpanich, A.; Phean-O-Pas, S.; Thongchuang, M.; Qu, L.-J.; Buaboocha, T. C-terminal extension of calmodulin-like 3 protein from Oryza sativa L.: Interaction with a high mobility group target protein. Acta Biochim. Biophys. Sin. 2015, 47, 880–889. [Google Scholar] [CrossRef]
  65. Han, M.-J.; Jung, K.-H.; Yi, G.; Lee, D.-Y.; An, G. Rice immature pollen 1 (RIP1) is a regulator of late pollen development. Plant Cell Physiol. 2006, 47, 1457–1472. [Google Scholar] [CrossRef] [Green Version]
  66. Kubo, T.; Takashi, T.; Ashikari, M.; Yoshimura, A.; Kurata, N. Two tightly linked genes at the hsa1 locus cause both F1 and F2 hybrid sterility in rice. Mol. Plant 2016, 9, 221–232. [Google Scholar] [CrossRef] [Green Version]
  67. Nan, N.; Wang, J.; Shi, Y.; Qian, Y.; Jiang, L.; Huang, S.; Liu, Y.; Wu, Y.; Liu, B.; Xu, Z. Rice plastidial NAD -dependent malate dehydrogenase 1 negatively regulates salt stress response by reducing the vitamin B6 content. Plant Biotechnol. J. 2019, 18, 172–184. [Google Scholar] [CrossRef]
  68. Lou, D.; Wang, H.; Yu, D. The sucrose non-fermenting-1-related protein kinases SAPK1 and SAPK2 function collaboratively as positive regulators of salt stress tolerance in rice. BMC Plant Biol. 2018, 18, 203. [Google Scholar] [CrossRef] [Green Version]
  69. Martínez-Atienza, J.; Jiang, X.; Garciadeblas, B.; Mendoza, I.; Zhu, J.-K.; Pardo, J.M.; Quintero, F.J. Conservation of the salt overly sensitive pathway in rice. Plant Physiol. 2007, 143, 1001–1012. [Google Scholar] [CrossRef] [Green Version]
Figure 1. Statistics for InDels across the genome and in CDS regions. (A,B) InDel statistics for CDS and genomic regions, respectively. CDS—InDel statistics for coding regions; Genome—InDel statistics for non-coding regions; Insertion—number of insertions detected; Deletion—number of deletions detected; Total—Total number of insertions and deletions detected.
Agriculture 13 01573 g001
Figure 2. Distribution of InDels in different regions of the genome in japonica landraces (A) and cultivars (B). The distribution frequencies of InDels in different regions were derived from the total percentages of InDels in different regions of the germplasm contained in different japonica rice types to the total genome InDels. Intergenic—intergenic regions; Upstream—upstream region of genes; Downstream—downstream region of genes; UTR_5_prime—within the 5′UTR of genes; UTR_3_prime—within the 3′UTR of gene; CDS—coding regions.
Agriculture 13 01573 g002
Figure 3. The distribution of InDels with different lengths genome-wide and in CDS regions. The vertical coordinate is the InDel length (within 10 bp). InDels with lengths greater than 0 are Insertions, and InDels with lengths less than 0 are Deletions. The horizontal coordinate is the corresponding number of InDels.
Agriculture 13 01573 g003
Figure 4. The distribution of InDel markers on 12 rice chromosomes (unit: Mb).
Agriculture 13 01573 g004
Figure 5. Population structure of 182 japonica rice accessions. (A,B) The distribution of 182 japonica rice accessions in the world (A) and in China (B); (CE) Structure analysis (C), phylogenetic tree analysis (D), and principal coordinate analysis (PCoA) (E) of subgroups of the 182 japonica rice accessions; SG 1–4: indicates 4 distinct subgroups of the division.
Agriculture 13 01573 g005
Figure 6. Manhattan and Q–Q plots for GWASs of salt-tolerance-related traits in rice at the seedling stage. (AI) The Manhattan and Q–Q plots of MLM analysis of RSH, RRL, RSPAD, RSFW, RRFW, RRDW, RPDW, RRS, and SWC.
Agriculture 13 01573 g006
Figure 7. Significant associations of the haplotypes with salt tolerance indices. (AF) Significantly associated InDel markers 1IM25.45Mb, 2IM25.33Mb, 5IM0.17Mb, 5IM19.41Mb, 10IM11.19Mb, and 12IM14.92 haplotypes for the salt tolerance traits RRL, RSPAD, SWC, RRS, and RSH, respectively. ***: p < 0.001; *: p < 0.05. Not labeled means the difference was not significant.
Agriculture 13 01573 g007
Table 1. Distribution and frequency of InDels on each chromosome in different japonica rice accession types.
ChromosomePhysical Length (Mb)Japonica LandracesJaponica Cultivars
Count/GenomeFrequency
(InDels/Mb)
Count/GenomeFrequency
(InDels/Mb)
145.0612,229217.47013155.6
236.829141248.34567124.0
337.259670259.64049108.7
435.8613,626380.07893220.1
530.049802326.33029100.8
632.1213,448418.79168258.4
730.359500313.03909128.8
828.5312,543439.66368223.2
923.776547275.43173133.5
1023.6613,095553.54866205.7
1130.8312,985421.111,938387.2
1227.7510,952394.78842318.6
Average31.8411,128354.06235197.0
Table 2. Distribution of 402 polymorphic InDel markers on 12 rice chromosomes.
ChromosomeChromosome Length (Mb)Number of MarkersMean Interval (Mb)
145.06401.12
236.82321.15
337.25341.10
435.86370.97
530.04301.00
632.12311.04
730.35360.84
828.53350.82
923.77290.82
1023.66320.74
1130.83330.93
1227.75330.84
Table 3. Statistical analysis of 12 salt-tolerance-related traits of 182 japonica rice accessions.
TraitMinMaxRangeMedianMeanSDCV (%)
STS1.47.56.14.84.61.531.6
LDP10.0100.090.070.766.122.333.7
RSH46.399.252.983.982.39.811.8
RRL43.1101.258.173.274.412.917.4
RSPAD26.899.772.989.482.716.720.2
RSFW24.299.875.656.057.317.731.3
RRFW22.598.676.153.455.316.429.9
RSDW30.496.265.866.667.016.323.8
RRDW19.898.778.951.354.716.430.2
RPDW24.695.170.561.363.215.625.2
RRS35.8120.484.679.679.515.319.4
SWC59.483.524.173.673.24.05.0
STS—Salt tolerance score; LDP—Leaf damage percentage; RSH—Relative seedling height; RRL—Relative root length; RSPAD—Relative SPAD; RSFW—Relative shoot fresh weight; RRFW—Relative root fresh weight; RSDW—Relative shoot dry weight; RRDW—Relative root dry weight; RPDW—Relative plant dry weight; RRS—Relative root to shoot ratio; SWC—Shoot water content. The same as below.
Table 4. Correlation of 12 salt-tolerance-related traits under salt stress treatment at the seedling stage.
TraitSTSLDPRSHRRLRSPADRSFWRRFWRSDWRRDWRPDWRRSSWC
STS1.000
LDP−0.766 **1.000
RSH0.447 **−0.318 **1.000
RRL−0.0560.0430.257 **1.000
RSPAD0.720 **−0.587 **0.412 **−0.0461.000
RSFW0.597 **−0.475 **0.364 **0.1150.488 **1.000
RRFW0.438 **−0.288 **0.293 **0.1350.280 **0.710 **1.000
RSDW0.579 **−0.418 **0.449 **0.0810.454 **0.753 **0.681 **1.000
RRDW0.407 **−0.317 **0.267 **0.1430.271 **0.715 **0.772 **0.685 **1.000
RPDW0.541 **−0.417 **0.368 **0.0550.379 **0.725 **0.684 **0.927 **0.724 **1.000
RRS−0.281 **0.187 *−0.223 **0.096−0.315 **−0.0970.073−0.266 **0.345 **−0.1011.000
SWC0.298 **−0.305 **0.058−0.0420.412 **0.422 **0.302 **0.211 **0.194 **0.232 **−0.1451.000
**, p < 0.01; *, p < 0.05.
Table 5. Loci significantly associated with salt-tolerance-related traits of japonica rice at the seedling stage.
TraitsChromosomeLocus-Allele−log10(p)R2 (%)Known QTLs
RSH33IM14.70Mb-14.449.28
33IM14.70Mb-23.647.68
1010IM11.19Mb-33.787.97
1212IM7.43Mb-14.429.25
1212IM7.43Mb-24.018.42
1212IM7.43Mb-35.0910.56
1212IM14.92Mb-13.727.85
1212IM14.92Mb-33.707.81
1212IM14.92Mb-43.808.01
1212IM24.74Mb-23.938.28
1212IM24.74Mb-33.787.94
1212IM24.74Mb-43.717.83
1212IM24.74Mb-53.868.13
RRL11IM25.45Mb-24.027.71
RSPAD22IM25.33Mb-23.627.74qSFWn2.2 [35]
99IM10.36Mb-13.687.81qRFW9.1 [36]
RSFW1010IM6.24Mb-13.638.62
1010IM6.24Mb-24.2610.03qRFWs10.1 [35]
qRLs10.1 [35]
RRFW1010IM6.24Mb-24.6311.22qRFWs10.1 [35]
qRLs10.1 [35]
RRDW1010IM6.24Mb-24.159.44qRFWs10.1 [35]
qRLs10.1 [35]
RPDW1010IM6.24Mb-24.009.41qRFWs10.1 [35]
qRLs10.1 [35]
RRS55IM19.41Mb-13.709.07
SWC11IM14.63Mb-14.197.57qSNC1 [37]
11IM14.63Mb-23.826.83
44IM19.96Mb-33.657.96qSNa12_4.1 [38]
55IM0.17Mb-24.179.04
1010IM1.48Mb-13.698.04
1010IM1.48Mb-23.698.04
Table 6. Cloned genes in the salt-tolerance-associated loci intervals.
GeneChrRelated TraitsPosition of Associated InDel (bp)Gene MSU IDGene FunctionReferences
Osrboh11SWC1IM14.63MbLOC_Os01g25820respiratory burst oxidaseLiu et al., 2012 [52]
OsWAK142RSPAD2IM25.33MbLOC_Os02g42150OsWAK14—OsWAK receptor-like protein kinaseDelteil et al., 2016 [53]
OsHAK14SWC4IM19.96MbLOC_Os04g32920potassium transporterChen et al., 2018 [54]
OsCYCP1;15RRS5IM19.41MbLOC_Os05g33040cyclin, putative, expressedDeng et al., 2014 [55]
OsPEX145SWC5IM0.17MbLOC_Os05g01090pex14, putative, expressedYou et al., 2019 [56]
OsCYP20-25SWC5IM0.17MbLOC_Os05g01270peptidyl-prolyl cis-trans isomerase, putative, expressedKim et al., 2011 [57]
OsPGIP15SWC5IM0.17MbLOC_Os05g01380polygalacturonase inhibitor precursor, putative, expressedWu et al., 2019 [58]
OseIF3f5SWC5IM0.17MbLOC_Os05g01450eukaryotic translation initiation factor 3 subunit F, putative, expressedLi et al., 2016 [59]
OsCyb59RSPAD9IM10.36MbLOC_Os09g16920desaturase/cytochrome b5 protein, putative, expressedHuang et al., 2021 [60]
OsHk510RSH10IM11.19MbLOC_Os10g21810histidine kinase, putative, expressedChoi et al., 2012 [61]
OspPGM10RSFW
RRFW
RRDW
RPDW
10IM6.24MbLOC_Os10g11140phosphoglucomutase, putative, expressedLee et al., 2016 [62]
OsbZIP8612RSH12IM7.43MbLOC_Os12g13170transcription factor, putative, expressedGao et al., 2022 [63]
OsCML312RSH12IM14.92MbLOC_Os12g03816OsCML3—Calmodulin-related calcium sensor protein, expressedChinpongpanich et al., 2015 [64]
RIP112RSH12IM14.92MbLOC_Os12g03822WD domain, G-beta repeat domain-containing protein, expressedHan et al., 2006 [65]
HSA1b12RSH12IM24.74MbLOC_Os12g39920expressed proteinKubo et al., 2016 [66]
Disclaimer/Publisher’s Note: The statements, opinions and data contained in all publications are solely those of the individual author(s) and contributor(s) and not of MDPI and/or the editor(s). MDPI and/or the editor(s) disclaim responsibility for any injury to people or property resulting from any ideas, methods, instructions or products referred to in the content.

