Article

Multi-Year Cereal Crop Classification Model in a Semi-Arid Region Using Sentinel-2 and Landsat 7–8 Data

by
Manel Khlif
1,*,
Maria José Escorihuela
2,
Aicha Chahbi Bellakanji
1,
Giovanni Paolini
2,
Zeineb Kassouk
1 and
Zohra Lili Chabaane
1
1
LR17AGR01 InteGRatEd Management of Natural Resources: Remote Sensing, Spatial Analysis and Modeling (GREEN-TEAM), National Agronomic Institute of Tunisia, Carthage University, 43 Avenue Charles Nicolle, Tunis 1082, Tunisia
2
isardSAT, Technological Park, Marie Curie, 8-14, 08042 Barcelona, Spain
*
Author to whom correspondence should be addressed.
Agriculture 2023, 13(8), 1633; https://doi.org/10.3390/agriculture13081633
Submission received: 20 June 2023 / Revised: 15 July 2023 / Accepted: 21 July 2023 / Published: 19 August 2023
(This article belongs to the Section Digital Agriculture)

Abstract

:
This study developed a multi-year classification model for winter cereal in a semi-arid region, the Kairouan area (Tunisia). A random forest classification model was constructed using Sentinel 2 (S2) vegetation indices for a reference agricultural season, 2020/2021. This model was then applied using S2 and Landsat (7 and 8) data for previous seasons from 2011 to 2022 and validated using field observation data. The reference classification model achieved an overall accuracy (OA) of 89.3%. Using S2 data resulted in higher overall classification accuracy. Cereal classification exhibited excellent precision ranging from 85.8% to 95.1% when utilizing S2 data, while lower accuracy (41% to 91.8%) was obtained when using only Landsat data. A slight confusion between cereals and cereals growing with olive trees was observed. A second objective was to map cereals as early as possible in the agricultural season. An early cereal classification model demonstrated accurate results in February (four months before harvest), with a precision of 95.2% and an OA of 87.7%. When applied to the entire period, February cereal classification exhibited a precision ranging from 85.1% to 94.2% when utilizing S2 data, while lower accuracy (42.6% to 95.4%) was observed in general with Landsat data. This methodology could be adopted in other cereal regions with similar climates to produce very useful information for the planner, leading to a reduction in fieldwork.

1. Introduction

Land cover maps are a crucial tool in studying changes across various fields of application, including agriculture, food security, climate change, and water security [1,2,3]. Agricultural land management planning is a fundamental tool for food security, especially in arid and semi-arid regions [4,5]. The succession of extreme events, mainly drought, rainfall variability, and the scarcity of water resources are serious challenges for agriculture in semi-arid regions such as the center of Tunisia [6]. Research conducted by Mougou et al. [7] demonstrated that the impact of climate change in central Tunisia’s Kairouan governorate could potentially result in a 50% decrease in wheat yield. Farmers have started to adapt to these climate change impacts by switching from rainfed to irrigated crops [6], reducing crops or stopping production altogether, or changing their crops with drought-resistant seeds [8]. Long-term land cover information is invaluable in assessing the impact of climate change on agricultural productivity. Furthermore, an early land cover map allows the government to anticipate the area and consequently the production of crops early in the agricultural season. Such information facilitates proactive decision-making to ensure food security [9], especially for countries heavily reliant on cereal-based diets and heavily impacted by the effects of climate change. This is particularly the case in Tunisia which is a country whose diet is based on cereals, and which imports more than half of its needs.
Thanks to advances in remote sensing technology and the availability of free satellite data, the production of large-scale land cover maps has become easier, allowing for yearly or seasonal mapping [10,11]. Various large-scale land use/land cover (LULC) products are available for the whole of the world such as Collection 5 MODIS Global Land Cover [12] (with a spatial resolution (SR) equal to 500 m), European Space Agency (ESA) Climate Change Initiative Land Cover (CCI-LC) [13] (SR equal to 300 m), and Copernicus Global Land Cover [14] (SR equal to 100 m). However, these products exhibit a major limitation in their medium to low spatial resolution (ranging from 100 m to 1 km), making them less suitable for field-scale applications. For high spatial resolution LULC mapping (10 m), several products are available, including Finer Resolution Observation and Monitoring of Global Land Cover 10 m (FROM-GLC10) [15], which combines Landsat 8 (L8) and S2 data, ESA worldwide land cover mapping using Sentinel 1 (S1) and S2 for the whole world, Sentinel-2 Global Land Cover (S2GLC) [16] using S2, and European Land Cover 10 m (ELC10) [17] using S1 and S2 [18] combining S2 and L8 data. However, a limitation of these high-resolution products is that they are often not produced annually. In addition, existing products are generated with generic crop classes (e.g., they do not distinguish between subclasses such as cereals and vegetable crops grouped in the same cropland class). Therefore, these products are not suitable for accurately tracking specific crops such as cereals.
According to Yang et al. [19], the random forest (RF) [20] algorithm has been widely utilized in previous LULC studies [16,19,21,22,23,24,25,26,27,28,29], followed by support vector machine (SVM) [30,31,32,33,34,35]. Li et al. [36] conducted a comparison between the performance of the RF classification algorithm and other algorithms such as SVM and artificial neural network (ANN). RF showed superior accuracy in reducing feature sets and improving classification accuracy. Additionally, Praticò et al. [37] compared the performance of the RF with SVM and classification and regression trees (CART) [38] classification algorithms, achieving OAs equal to 88%, 83%, and 80% respectively. The RF algorithm has shown advantages in terms of flexibility, simplicity, and efficiency when processing large datasets [18].
Several vegetation indices, such as the Normalized Difference Vegetation Index (NDVI) [39], the Enhanced Vegetation Index 2 (EVI2) [40], and the Normalized Difference Moisture Index (NDMI) [41], have demonstrated good performances in land cover classification. Different image compositions of vegetation indices have been explored for generating land cover maps [21], such as time series composition and percentile composition. Phan et al. [42] tested image compositions using different input data from L8 (spectral band and vegetative index) in the Mongolia region and found that the median composition is the most efficient in filling the gaps, reducing data volume and computation time with an OA equal to 89.8%. To take into account the different vegetation stages of each crop, different percentile values of vegetation indices were tested by Xie et al. [21]. They employed two image compositions to obtain a land cover map: percentiles (10, 20, 25, 50, 75, 80, and 90) and monthly median. Both approaches produced accurate land cover classification results, with OAs ranging between 77% and 80%. Nasiri et al. [11] further supported these findings, demonstrating that percentiles and seasonal compositions give very similar results regardless of whether S2 or L8 data are used.
To generate a land cover product with high SR, some studies have trained classification models using field data extracted from existing LULC maps (MODIS land cover, Copernicus Global Land Service Land Cover 100 m (CGLS-LC100), Google Earth, etc.), [21,43]. Greater detail and precision can be achieved when considering the heterogeneity of the classes in the study area. However, obtaining such data can be challenging and costly. In some cases, the available datasets are limited for training and validating models on a large scale, or extensive fieldwork is required to collect the necessary data.
To address the delay in producing land cover maps, You et al. [9] proposed a solution by calibrating an identification model of rice, soybean, and corn based on the 2017 agricultural season data. Then, they predicted the location of these three crops the following year by testing different time intervals. Using the RF algorithm with S1 and S2 data, they elaborated an early map for China. The results showed successful identification of rice four months before harvest (F1 score of 93%), corn two months before harvest (F1 score of 92%), and soybeans 50 days before harvest (F1 score of 91%). This approach allowed for the early identification of the three main crops in China, which can help in making decisions regarding food security.
Existing land cover maps made for the Kairouan plain in Tunisia, as presented in studies by Chahbi et al. [44], Bousbih et al. [45], and Chahbi et al. [46], were based on a decision tree method proposed by Zribi et al. [47]. These studies calibrated their methodologies annually over a small area using various image sources such as SPOT, SRTM, and ENVISAT ASAR radar images [47], SPOT and SRTM images in [44], SPOT images in [46], and Landsat images in [45]. However, the applicability of these approaches to larger regions and/or different periods/years and their validation was limited to their study period. Furthermore, early land cover maps would be needed for the spatial delimitation of cereal fields, early estimation of cereal yields, cereal import, and market management [48,49,50].
In this study, our objectives are two-fold. First, we aim to develop an RF land classification model that can be used over a long period of time (ideally as long as remote sensing data are available) eliminating the reliance on field data. For that, the model will be based on S2 data, as it is the period when remote sensing data is more frequently available, but applied and tested with Landsat data also for the period when S2 was not yet available. Second, we aim to obtain the cereal map as early as possible before harvest (which occurs at the end of May or June) so the information is available early for management purposes.

2. Materials and Methods

2.1. Study Area

The selected study area is in the center of Tunisia, in Kairouan governorate, encompassing coordinates ranging from 9°15′ E to 10°15′ E and 35°45′ N to 36°55′ N, and covering an area of 6712 km2. Figure 1 provides a visual representation of the study area. This region is characterized by a semi-arid climate, with an average annual rainfall of around 300 mm, an average temperature of 19.2 °C, and an estimated average annual evapotranspiration of nearly 1600 mm [45]. The southern part of the study area is drier than the northern part. Annual rainfall in the southern region is around 200 to 250 mm for an average year but sometimes less is recorded. The average rainfall of the two subzones in the northern regions (Oueslatia and Sbikha) is around 380 mm. The study area is prone to extreme climatic events, including both droughts and floods. To mitigate the impact of flooding in the city of Kairouan and ensure a stable water supply, hydraulic structures such as the Sidi Saad Dam (constructed in 1982) and the El Haoureb Dam (constructed in 1989) have been built. Following the construction of these two dams, the study area has experienced an increase in the diversification of crops, seasonal crops (tomato, peppers, etc.), and an increase in the production of annual crops (cereals). In the agriculture year 2019/2020, the dominant crop was arboriculture (more than 65.38%), mainly composed of rainfed olive trees, followed by cereal crops (13.8%), both irrigated and rainfed [51].
The study area ranks first in cereal production for central Tunisia [52]. Over the years, there has been a significant shift toward the predominance of irrigated cereal cultivation in this region, starting in 2017. This transformation is of great significance as it ensures a crucial role in maintaining an adequate cereal stock for Tunisia, particularly during periods of drought. Thus, having an early cereal map is a very important administrative tool for correctly planning cereal imports.

2.2. Datasets

The remote sensing dataset utilized in this study comprises optical data from S2, Landsat 7 (L7), and L8, along with field data representing the different crops for agricultural seasons from 2011/2012 to 2021/2022 in Kairouan governorate. To cover the entire study area, three tiles are required from S2, L7, and L8 data. In this study, the agricultural year is a year beginning in September and ending in August of the following year. In our study area, cereals are grown only once per agricultural year, with sowing starting in November and harvesting ending in June of the following year.

2.2.1. Landsat 7–8

L7 and L8 are multi-spectral, multi-band satellite data delivered by the United States Geological Survey (USGS). Landsat data have a spatial resolution of 30 m for reflectance data and a repeat cycle of 16 days. During the study period, L7 data are available from 2011 to 2021 and L8 data are available from 2013 until the present.

2.2.2. Sentinel 2

S2 is a multi-spectral, multi-band imaging mission with high spatial (10–30 m) and temporal (5–6 days) resolution, delivered by the ESA. The S2 mission is composed of two satellites, Sentinel 2A (S2A) (launched on 23 June 2015) and Sentinel 2B (S2B) (launched on 7 March 2017). These data are available in the Google Earth Engine (GEE) from 28 March 2017 until now.

2.2.3. Field Data

An extensive field database was compiled for the Kairouan plain yearly except for the agricultural season 2015/2016. From 2011/2012 to 2019/2020 field data were collected in the Kairouan plain. For the agricultural seasons 2020/2021 and 2021/2022, field data were enlarged to cover the entire governorate of Kairouan. Field data encompass various classes observed in the study area, including cereal crops (wheat and barley), cereal cultivated with olive trees, vegetable crops, fodder crops, arboriculture, arboriculture with vegetable crops, and bare soil. Table 1 summarizes the number of field data for each agricultural season.

2.3. Methods

The methodology applied in this study was developed in GEE. To ensure consistency, a single satellite was chosen for the classification of each agricultural season. For Landsat data, the satellite with more available quality images per year was selected. Therefore, the following satellite data were used: L7 (2011/2012 and 2012/2013), L8 (from 2013/2014 to 2021/2022), and S2 (from 2017/2018 to 2021/2022). For each agricultural season, satellite images were used from the beginning of the cereal cycle to the end, which corresponds, respectively, to November of one year and June of the following year. A cloud cover threshold of less than 10% is defined for S2 data. Due to the lower temporal resolution and limited availability of Landsat data, a less restrictive cloud cover condition of less than 30% was applied. In GEE, these satellite data were already atmospherically corrected, so only a cloud mask is applied to the data.

2.3.1. Vegetation Indexes

To distinguish between different vegetation classes, fifteen vegetation indices were calculated in this study (Table A1 in Appendix A summarizes these indices by including details of the used bands and the calculation formula). These selected indices provide valuable insights into phenological stages, photosynthetic activity, chlorophyll content, and biomass estimation. In order to take into account the entire cereal growing cycle, different percentiles are calculated for each vegetation index (P3, P25, P50, P75, and P95).

2.3.2. Land Cover Classification Model

The generation of the cereal map in this study involves training a classification model using in situ data from the reference year 2020/2021 and subsequently applying this model to other years. For the earlier land classification map, two approaches have been tested. The first approach entails using the previously elaborated land cover model and varying the input data period (e.g., from November to March). The second approach involves developing a specific classifier using the period as afterward applied. Both models were initially trained during the 2020/2021 agriculture season and subsequently validated over 9 years, from the 2011/2012 to the 2021/2022 agriculture season. The classification models were generated on GEE using the JavaScript program.
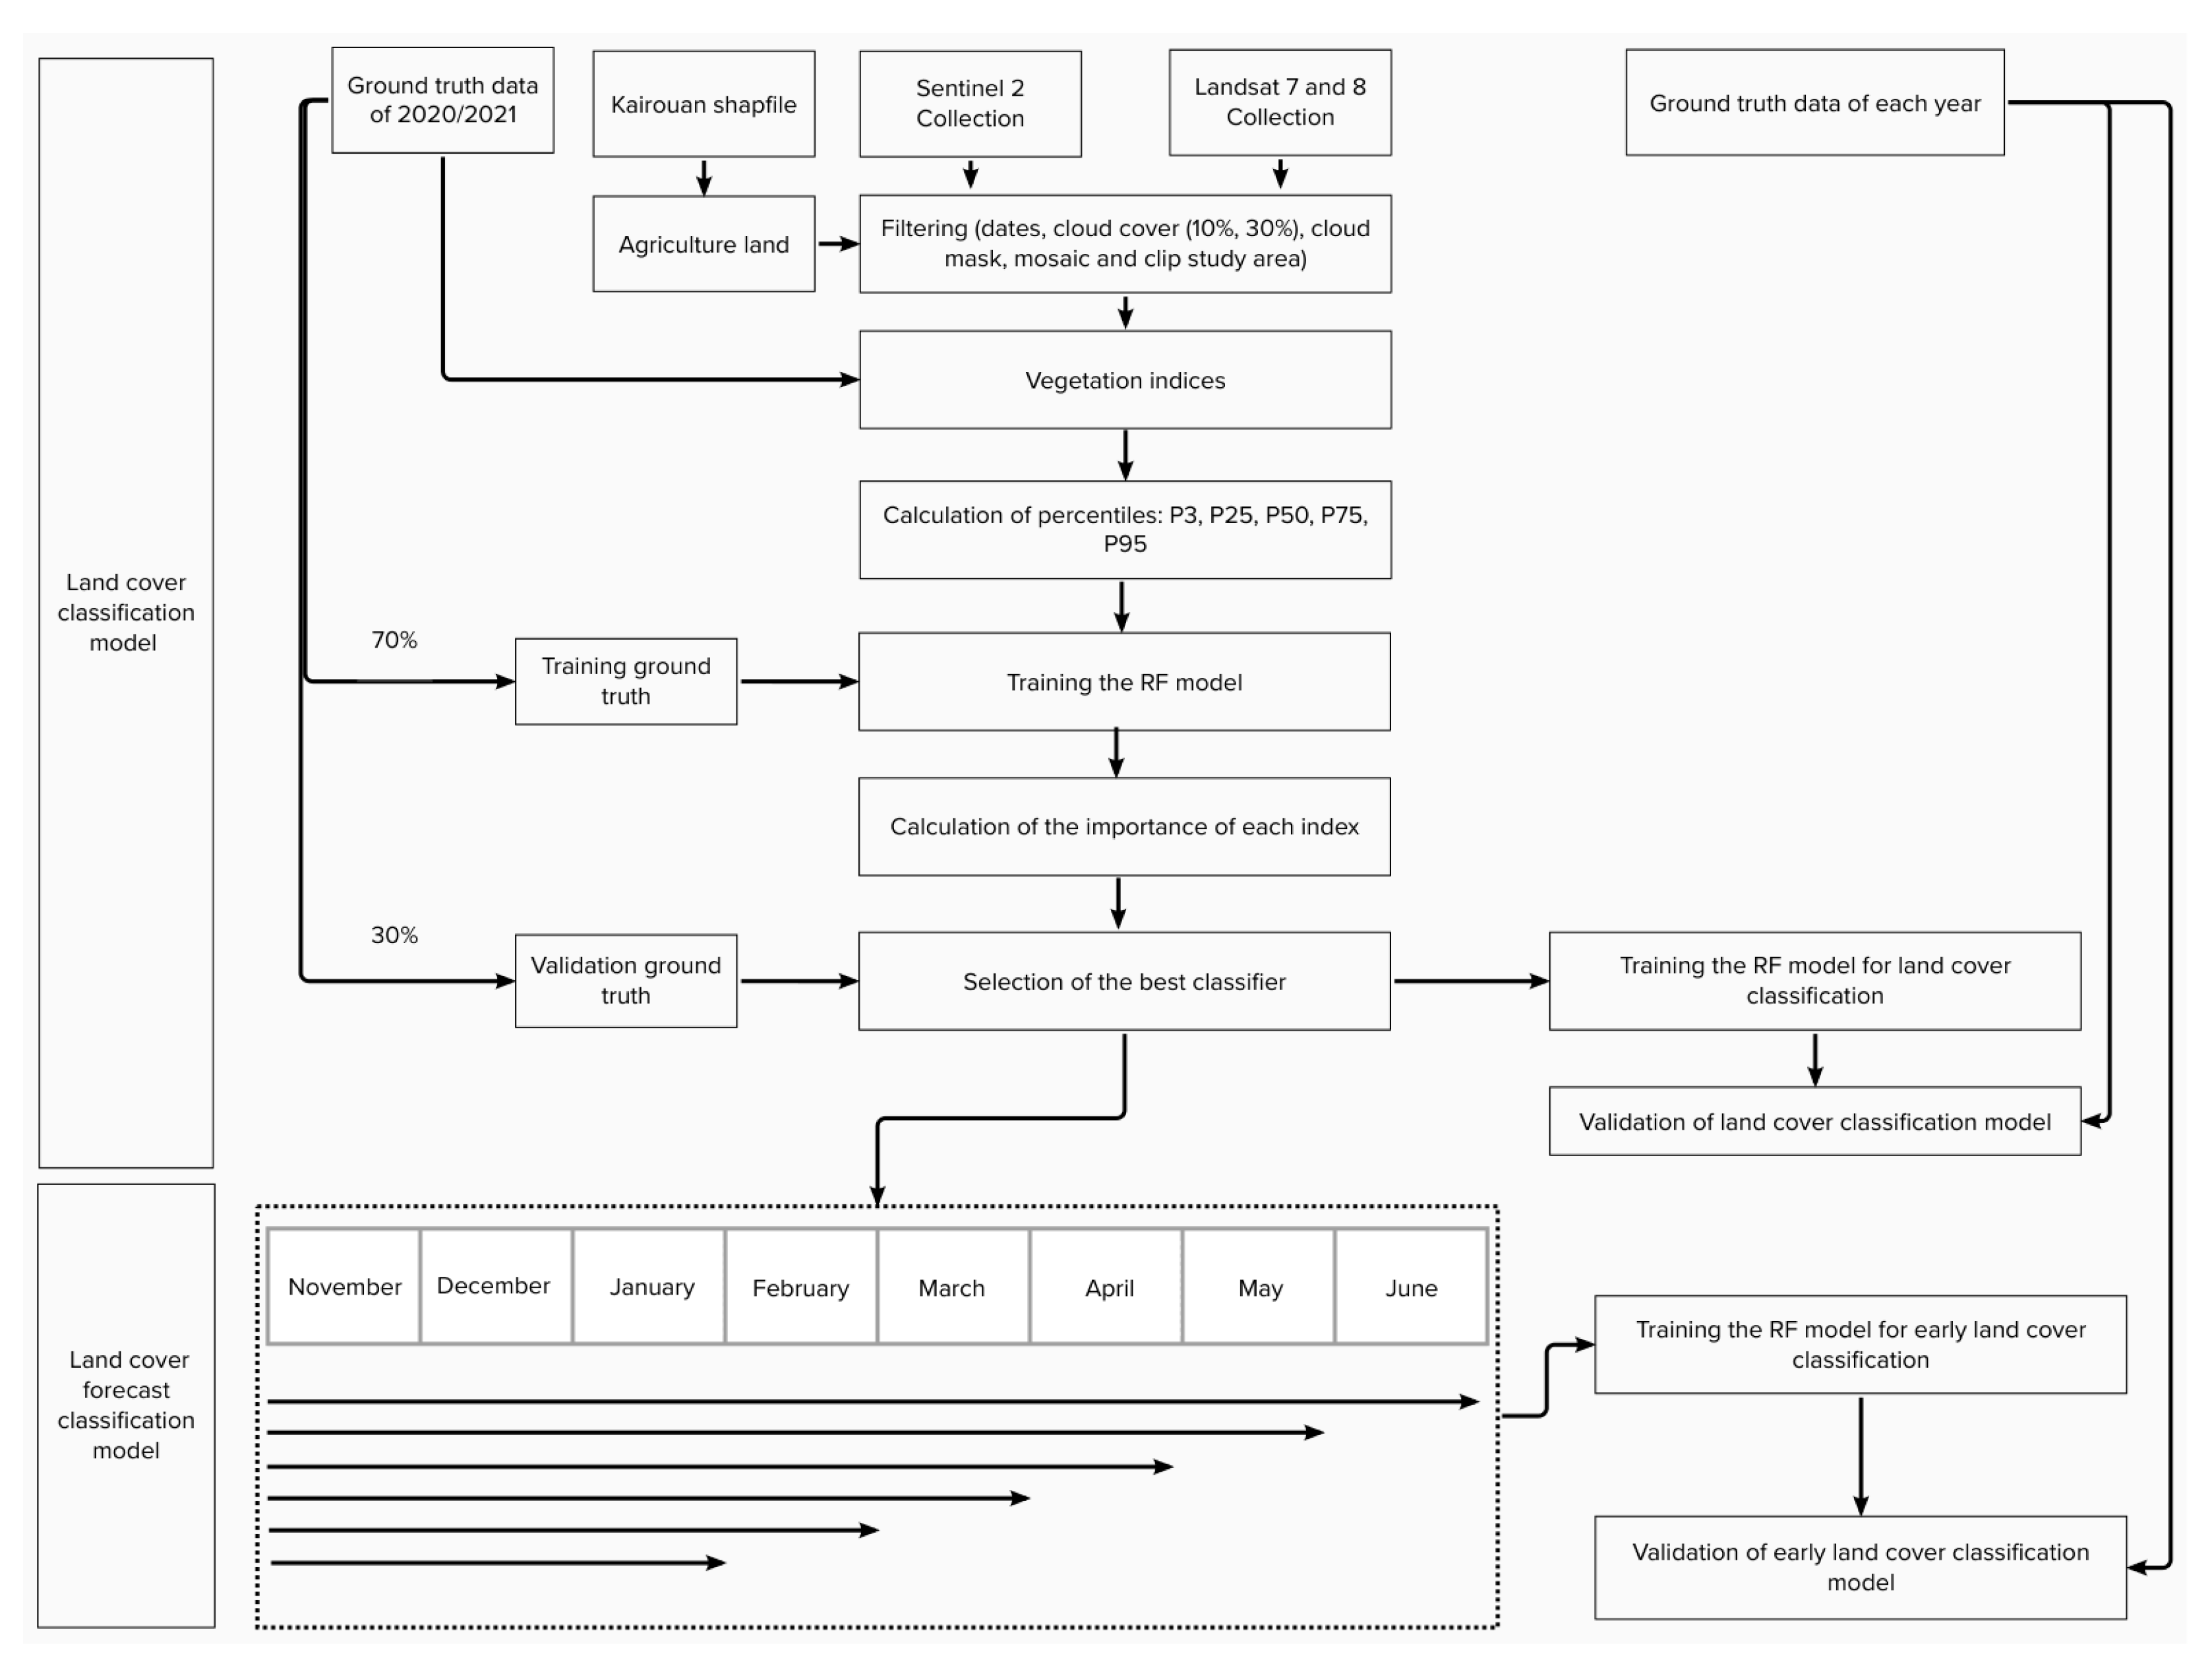
The two models of this methodology are detailed in Figure 2 below:
The RF classification algorithm was selected to perform the classification of the different vegetative classes. This algorithm comprises a collection of decision trees that are independently trained on a subset of the training dataset using bagging and bootstrapping techniques [20]. Depending on the decision of each decision tree, each pixel receives the vegetative class label that has more votes. The reference land cover classification model was trained from 1 November 2020 to 30 June 2021. The RF classification algorithm was trained with 70% of the field database for the reference year 2020/2021, using a total of 150 trees. Each field can contain several pixels, which increases the number of training and validation data. Initially, all the indexes, with their values expressed in percentiles, were used in the training of the RF algorithm. In order to select the most important indices for land cover classification in our study area, an order of importance was established for each of these features, based on the 2020/2021 reference year classification. Using this information, only the combination of the best indexes was used to train and classify the algorithm. For the first task described above, the best combination of the indices was used to train the RF for the reference year, and the same model was subsequently applied to other years.

2.3.3. Metrics

Two main indices are employed to evaluate the classification’s performance: the overall accuracy (OA) [53] and the Kappa index (Kappa) [54].
OA gives an overall accuracy of the classification for all the classes. It is defined as follows:
O A = N u m b e r   o f   c o r r e c t l y   c l a s s i f i e d   s a m p l e s N u m b e r   o f   t o t a l   s a m p l e s = n i i N ,
where nii is the number of pixels that are well classified in each class and N is the total number of validation pixels of all classes.
The Kappa index represents the proportional reduction in the error obtained by a classification, compared to the error obtained by a completely random classification.
K a p p a = O v e r a l l   A c c u r a c y E s t i m a t e d   c h a n c e   a g r e e m e n t 1 E s t i m a t e d   c h a n c e   a g r e e m e n t = N n i i i ( j n i j ) ( j n j i ) N 2 i ( j n i j ) ( j n j i ) ,
where nij is the number of pixels classified in class i by the algorithm and nji is the number of pixels labeled as class i in the field data.
OA and Kappa are used for the choice between the different combinations of indices in order to validate the classification results and select the best classifier.
Based on the confusion matrix, precision (P), recall (R), and the F1 score can be calculated to present the accuracy of the classification at the level of each class [53]. P represents how many pixels are correctly classified for a specific class i among all the pixels classified as i. R represents how many pixels are correctly classified as i among all the pixels labeled as class i in the field data. The F1 score provides a measure that combines these two indices.
P = N u m b e r   o f   c o r r e c t l y   c l a s s i f i e d   s a m p l e s   i n   e a c h   c l a s s N u m b e r   o f   s a m p l e s   c l a s s i f i e d   t o   t h a t   c l a s s = n i i   i n i j ,
R = N u m b e r   o f   c o r r e c t l y   c l a s s i f i e d   s a m p l e s   i n   e a c h   c l a s s N u m b e r   o f   s a m p l e s   f r o m   r e f e r e n c e   d a t a   i n   e a c h   c l a s s = n i i   j n j i ,
F 1 = 2 × P × R P + R ,
where nii is the number of pixels that are well classified in each class, nij represents the number of pixels classified in class i and nji represents the number of pixels labeled as class i in the field data.

3. Results

3.1. Models

In this section, we present the calibration and validation of the models for the reference year.

3.1.1. Land Cover Classification Model M1

To select the most important indices for land cover classification, a model was built using all of the selected indices and their respective percentiles for the 2020/2021 reference year. Figure 3 below shows the ranked importance of the indices in the above-mentioned model. The results depicted in Figure 3 highlight the remarkable importance of DVI in land cover classification in our study area, followed by the MSI, NDMI, and GNDVI. Consequently, the reference classification model was trained utilizing the P3, P25, P50, P75, and P95 percentiles of these four indices (DVI, MSI, NDMI, and GNDVI).
The confusion matrix results for the 2020/2021 classification are presented in Table 2. Overall, satisfactory results in terms of accuracy are achieved for all the different classes. Particularly noteworthy are the excellent validation results for the cereal crop classes, achieving an accuracy of 95.1% for cereal and 81.7% for cereal cultivated with olive trees. However, the cereal class is mostly confused with the cereal mixed with olive trees class. Specifically, 347 cereal pixels (around 2.55%) are misclassified as cereal with olive trees, and 385 pixels of cereal with olive trees (around 8.23%) are misclassified as cereal.
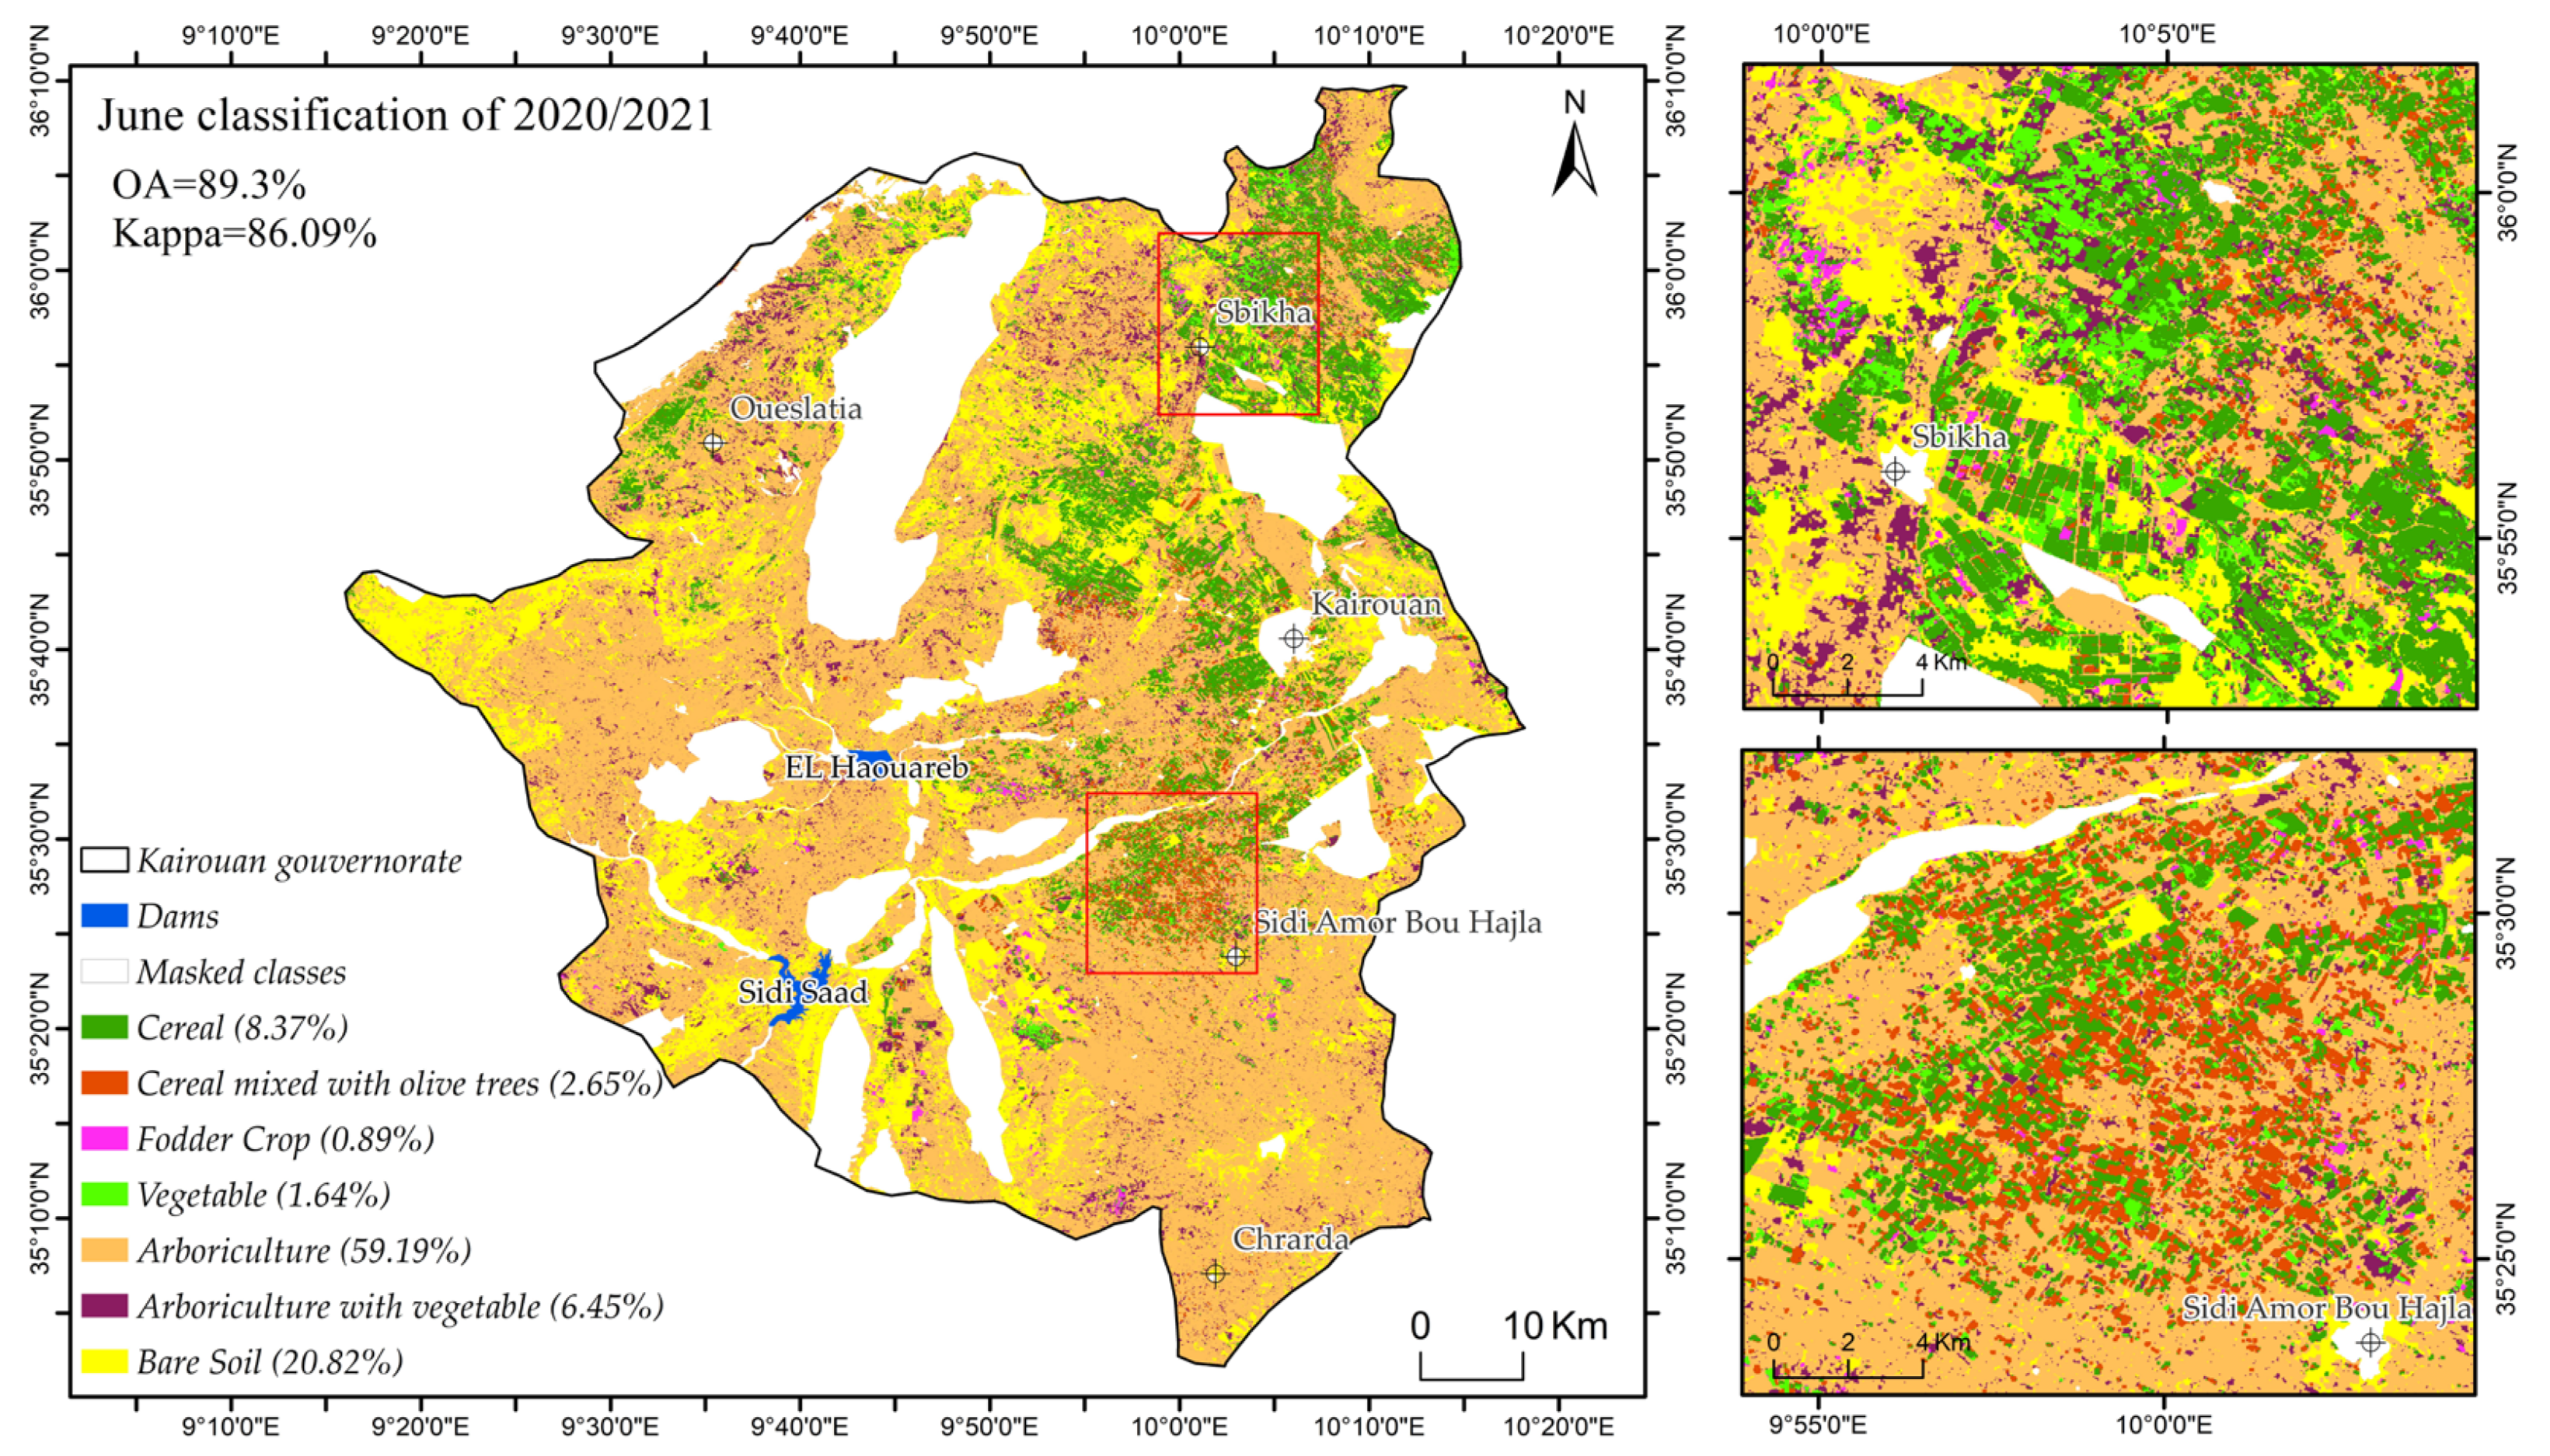
Figure 4 shows the land cover classification for the 2020/2021 agricultural season. It confirms that arboriculture is the dominant class, covering approximately 59.19% of the total agricultural land area, followed by cereals (8.37%), and cereal class with olive trees (6.45%). Around 20.82% of the land is categorized as bare soil. Cereals are located mainly in the downstream part of the two dams (Sidi Saad and El Haoureb), which is the plain of Kairouan. Additionally, some cereal plots are located next to Oueslatia and Sbikha which are generally rainfed cereals.

3.1.2. Early Land Cover Classification M1 Model

Figure 5 presents the early land cover classification maps (including OA and Kappa) of 2020/2021 using the previous model for early classification (M1). The best results are obtained when the entire period is used for the classification (i.e., input data until June) and the performance of the model decreases as the length of the input data period decreases. However, the results were still acceptable in February, with an OA of 78% and a Kappa of 71.9%.
Table 3 shows the confusion matrix for the different classes of the February classification. It shows good performance for the classification of cereals (P = 82.5%, F1 = 85.8%) but the performance for cereals with olive trees largely decreased compared to the results in June.

3.1.3. Early Land Cover Classification M2 Model

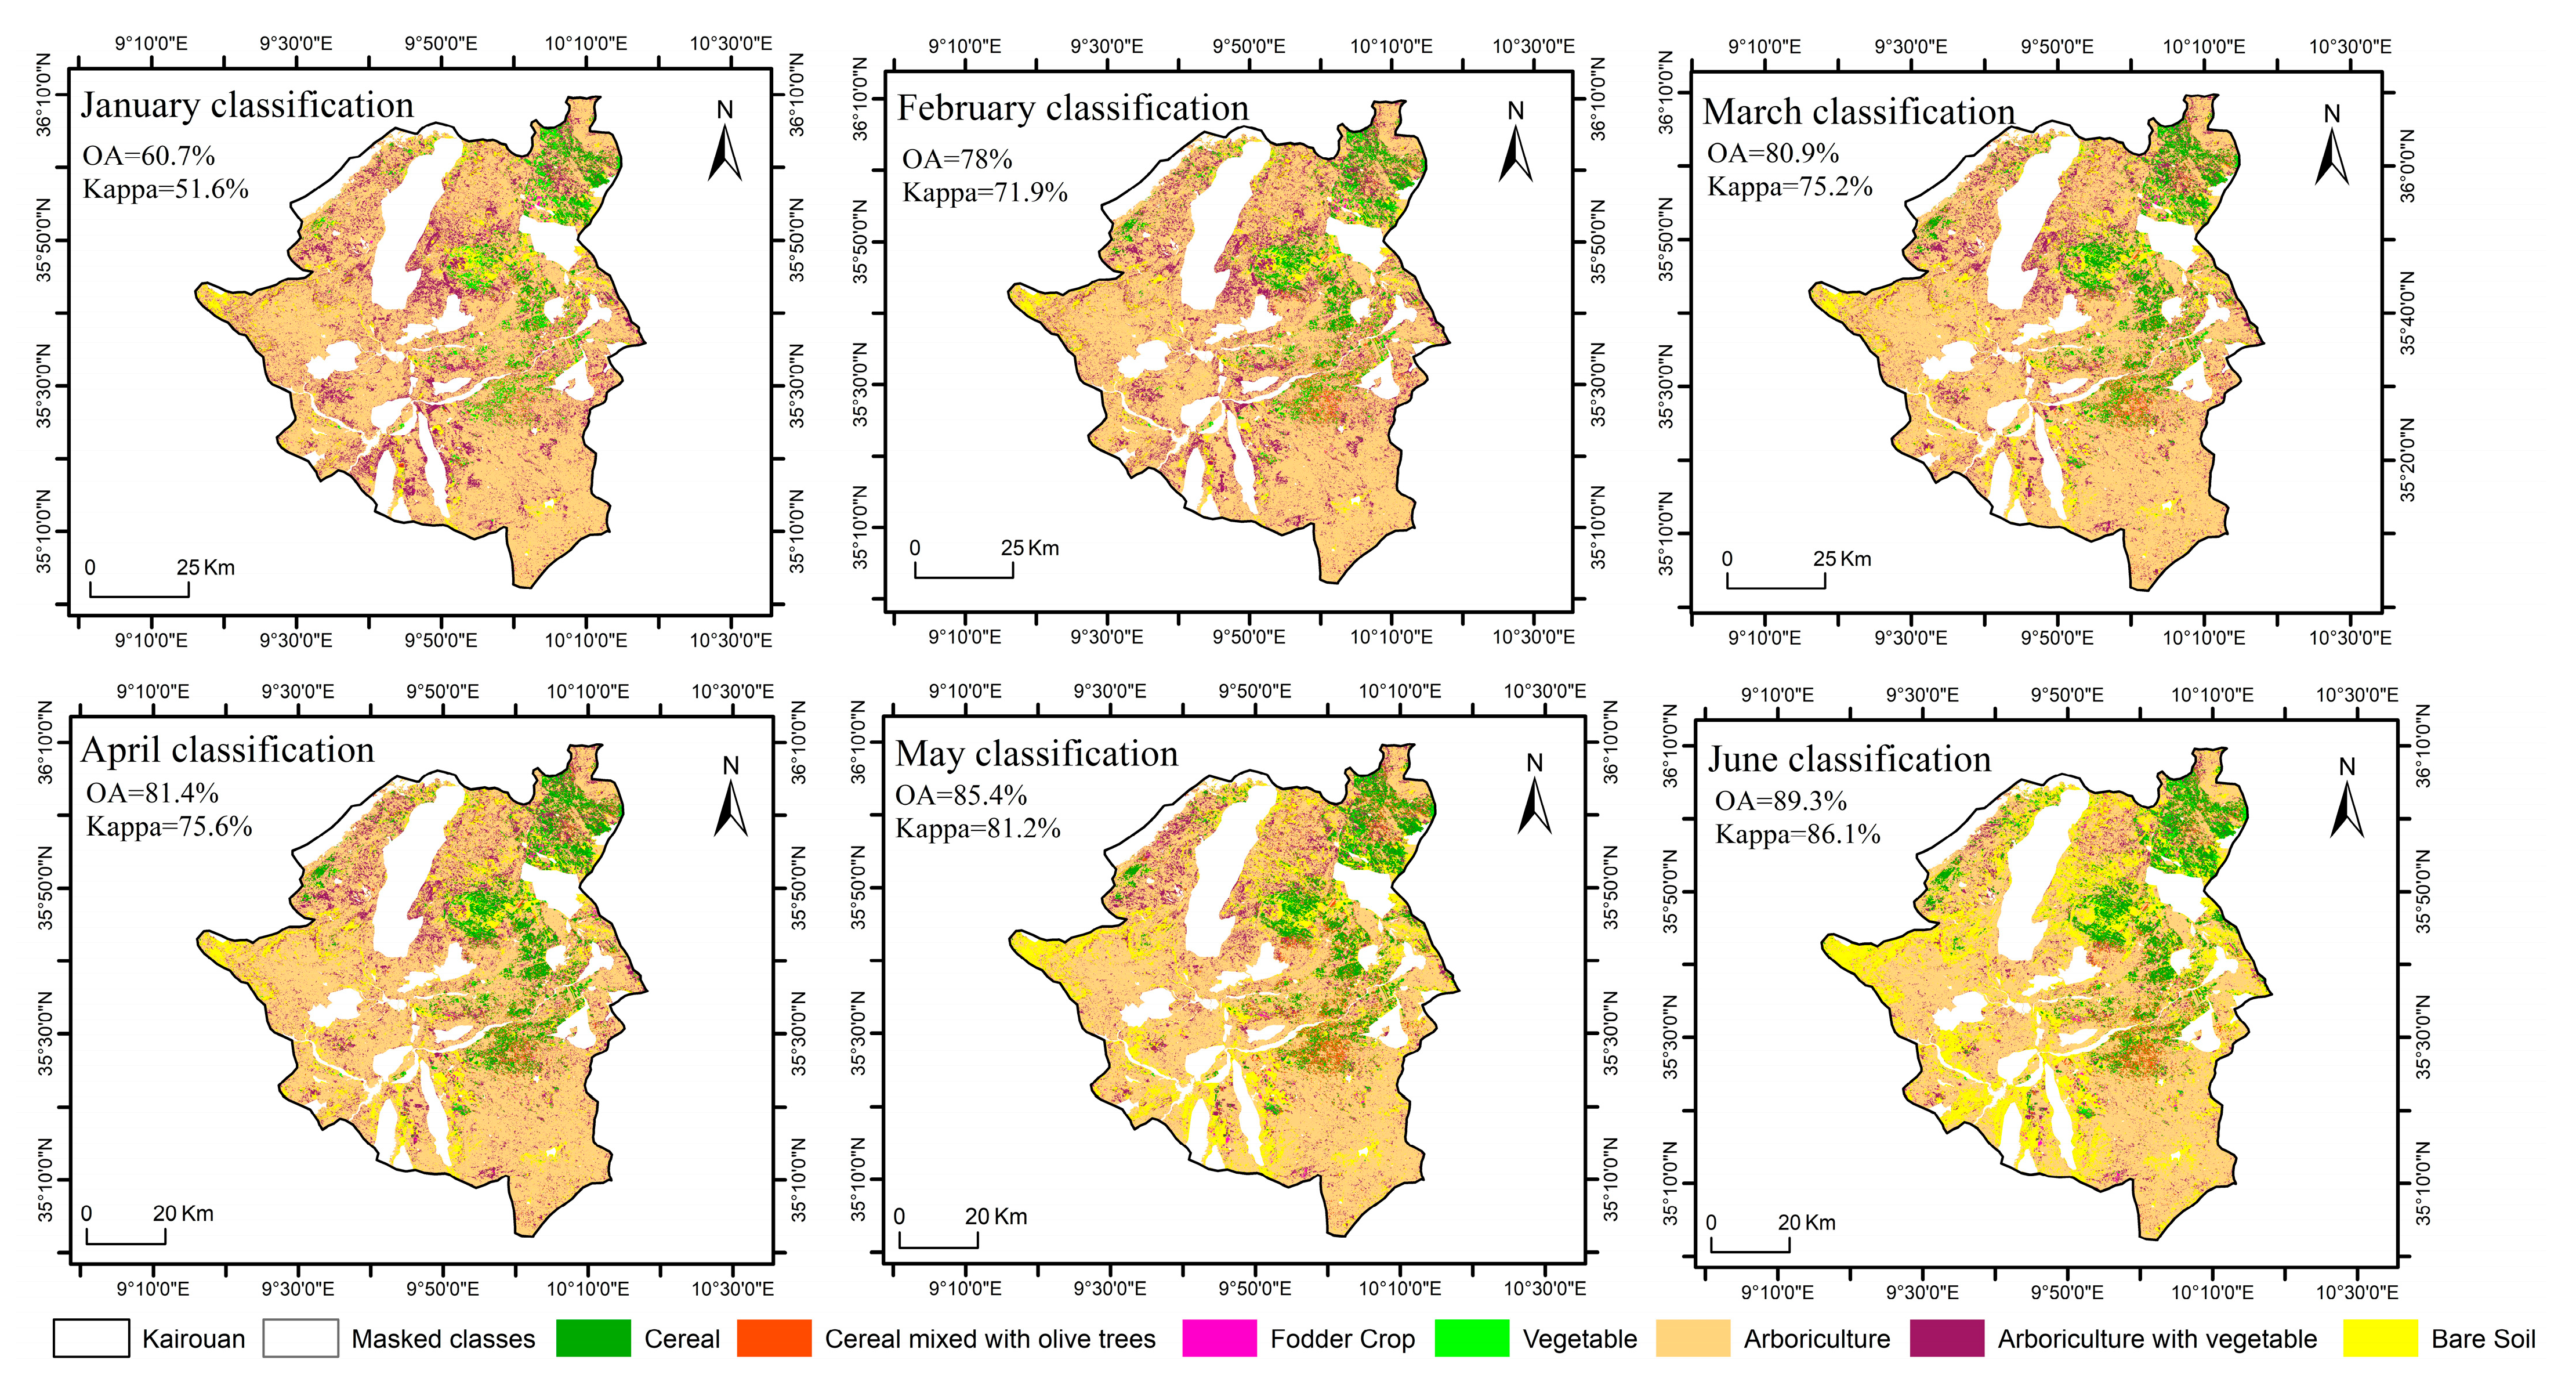
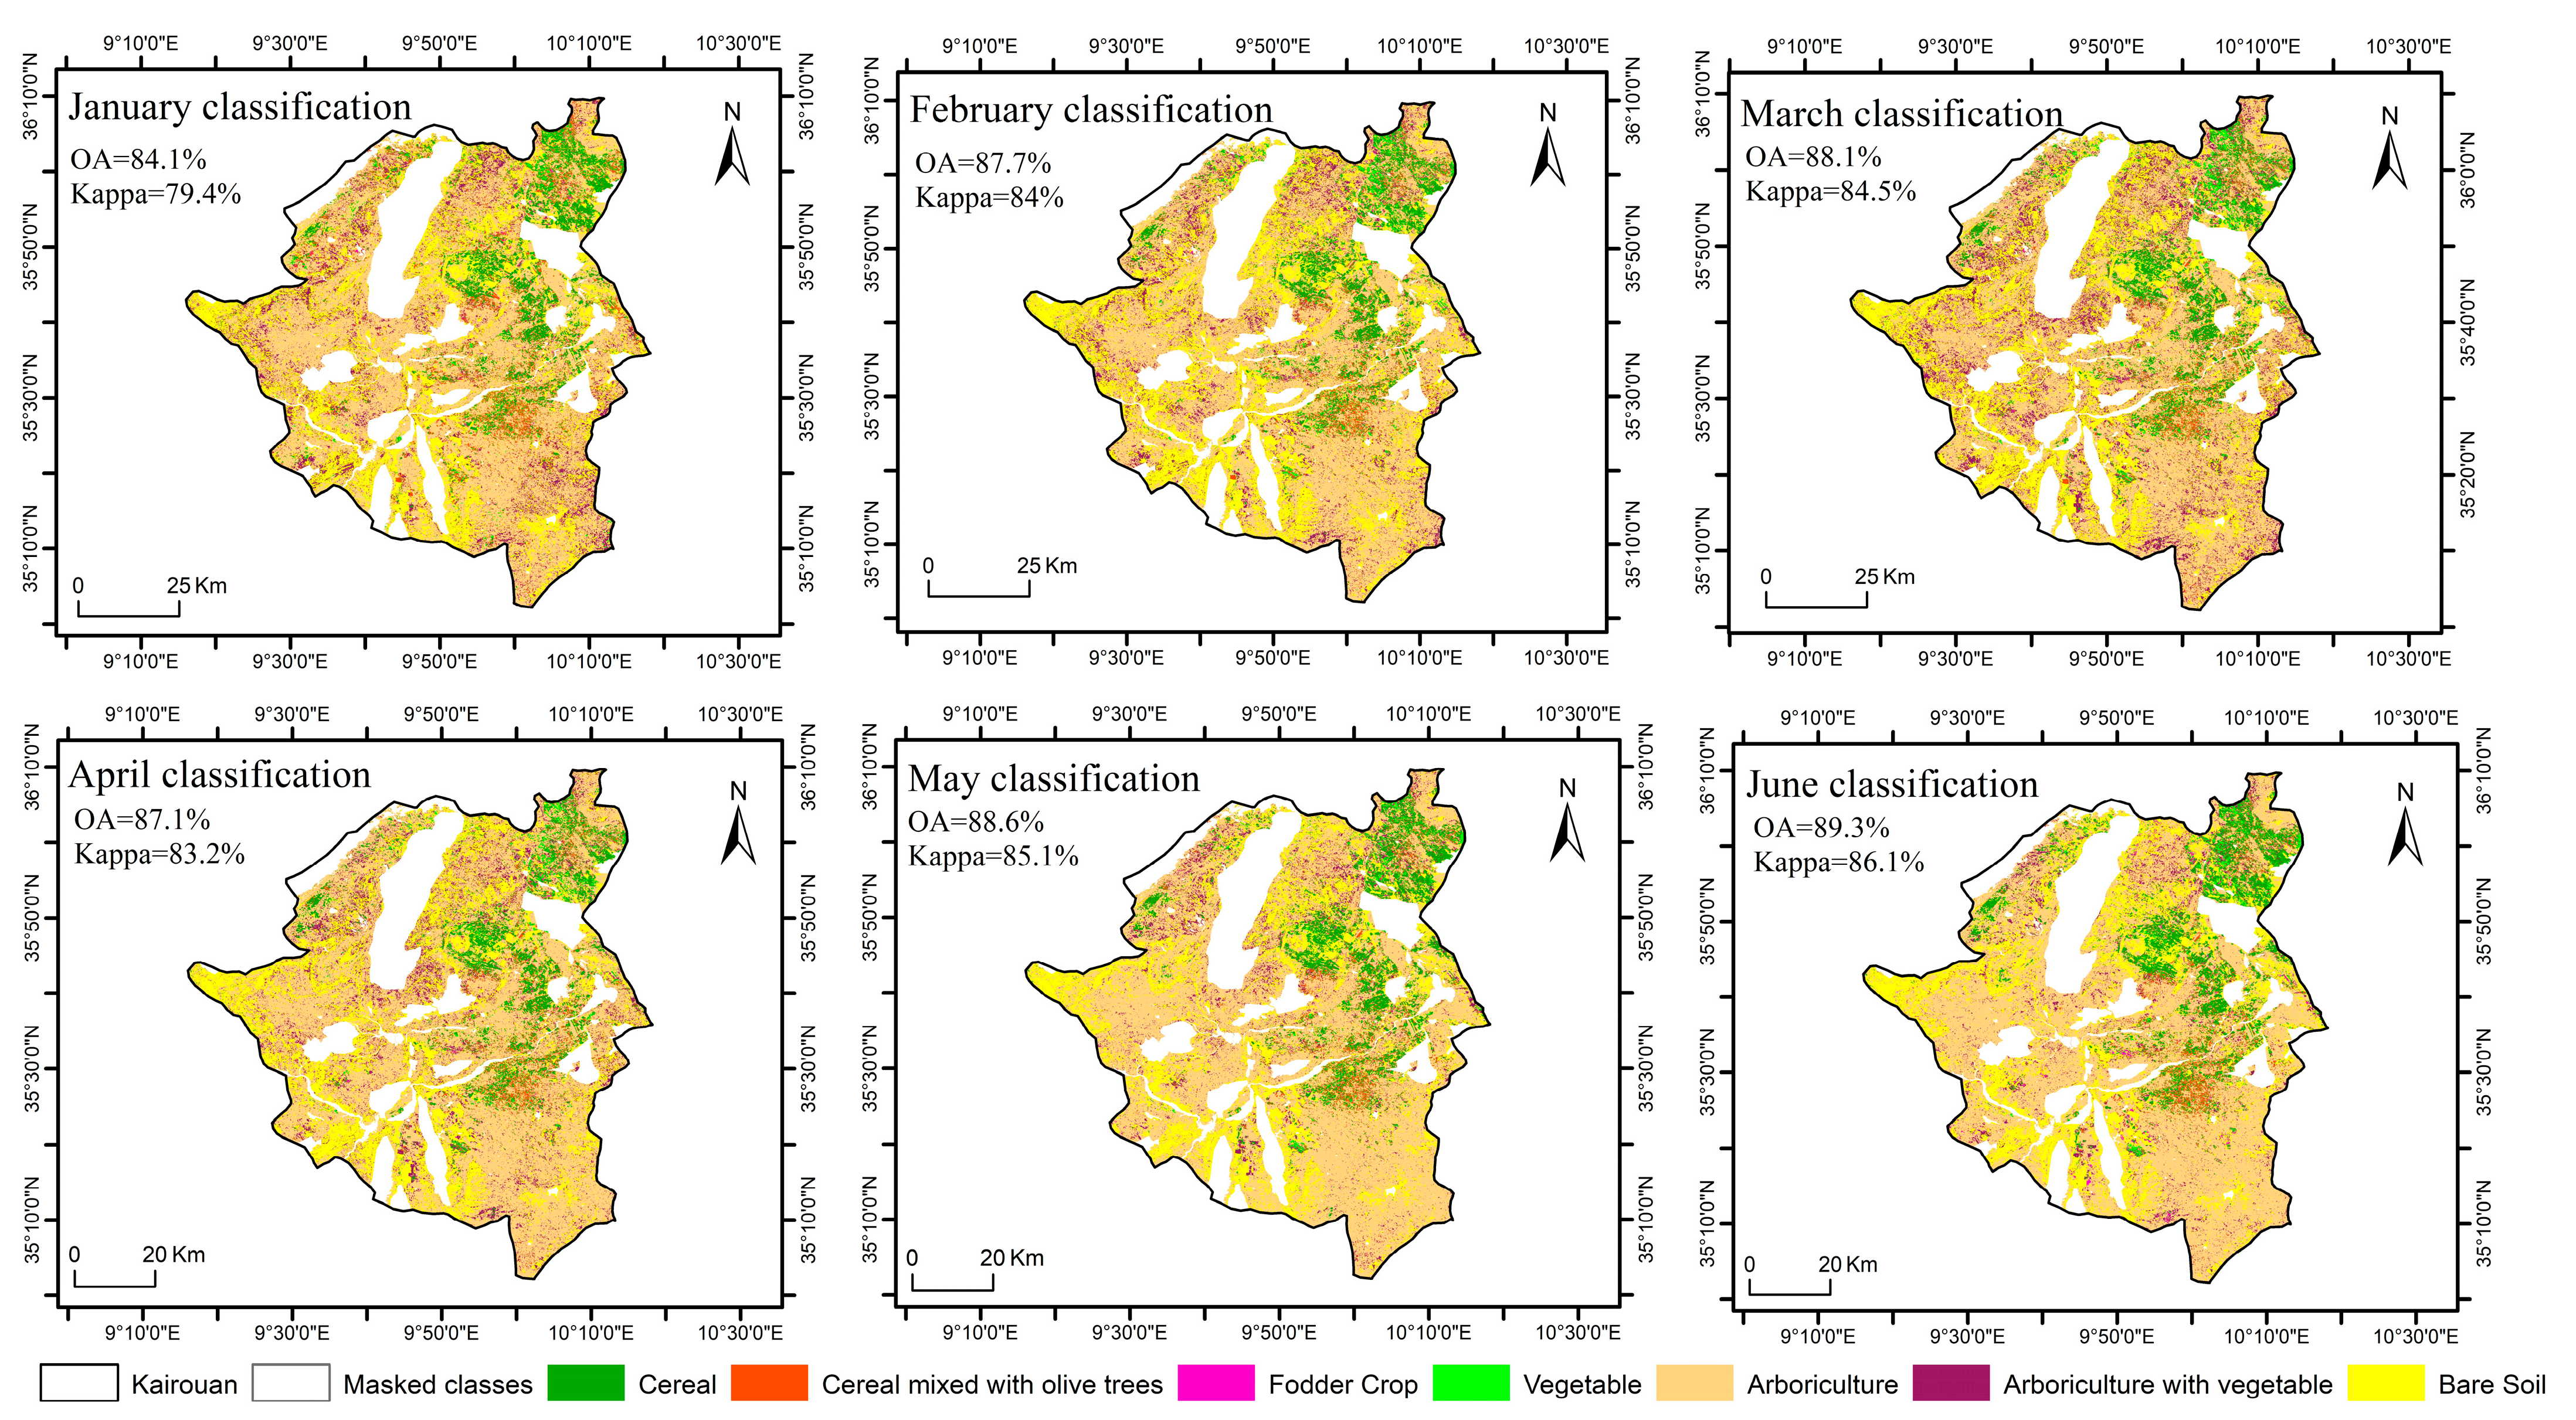
Figure 6 presents the early land cover classification maps (including OA and Kappa) of 2020/2021 for the different calibration periods (M2). From February to June, the accuracy remained consistently high, with OA scores of 87.7% for the February classification and 89.3% for the June classification. However, the January classification demonstrated a slightly lower accuracy, with an OA of 84.1%. This high similarity between scores is also noted in the resulting classification maps, as shown in Figure 6 below.
These results are clearly better than the ones obtained from the early classification using M1 where accuracy was clearly decreasing as the period considered was shortening (see Figure 5).
The confusion matrix result for the February classification for the reference year, 2020/2021, is presented in Table 4. The analysis reveals that all classes exhibit high accuracy, with notable performance in the cereal class. A slight difference between the P accuracy of the cereal class in the February classification and the June classification was observed. Table 4 demonstrates that the cereal class is well classified with a P equal to 95.2% and an F1 equal to 93.5% in the February M2 classification, which is very similar to the results when the whole period is considered (as can be seen in Table 2: P = 95.1%, F1 = 94.2%). The scores of the February classification of cereals with olive trees (P = 80.1%, F1 = 83.9%) are also very close to the June classification (as can be seen in Table 2: P = 81.7%, F1 = 83.4%). Similar slight variations were observed in the classifications for other classes as well.

3.2. Validation

3.2.1. Land Cover Classification

Table 5 below shows the results of the application of the reference land cover classification model to the period from 2011/2012 to 2021/2022, in terms of P, R, and F1 for the cereal and cereal with olive trees classes, and OA and Kappa for the total land cover classes. The accuracy of the cereal crop map shows good results, whether using S2 or Landsat data. When using S2 data, the cereal P ranged between 95.1% for 2021/2022 and 85.8% for 2017/2018. The Landsat data exhibited a slightly lower range, with P values ranging from 91.8% for the 2021/2022 season to 41% for the 2014/2015 season. However, the validation of the cereal with olive trees class demonstrates average to poor results when using S2 data. The cereal with olive trees accuracy was 60.4% for the 2019/2020 season and dropped to 27.4% for the 2021/2022 season. The use of L8 data only yielded poor results for this class.
The overall validation of the land cover classifications shows accurate results for the years when the S2 data were used. We found OAs equal to 79.5% for 2021/2022 and 67.3% for 2018/2019. On the other hand, the Landsat data exhibited low results for global validation, with OAs equal to 59.5% for 2017/2018 and 25.3% for 2012/2013.

3.2.2. Validation of the M1 Early Classification Model

Table 6 below summarizes the results of the February classifications using the M1 approach for cereal and cereal mixed with olive trees. The accuracy of the cereal crop map shows good P results, whether using S2 or Landsat data. When using S2 data, the cereal P was between 95.6% for 2021/2022 and 84.2% for 2019/2020, but R was 55.8% and 58.3%, respectively. The Landsat data exhibited a slightly lower accuracy, with P values ranging from 98.8% for the 2017/2018 season, with R of 13.1%, to 24.8% for the 2011/2012 season, with R of 10.5%. However, the validation of the cereal with olive trees class demonstrates only average to poor results for both sets of data. The precision of the cereal with olive trees class was 51.9% for the 2019/2020 season and dropped to 13.7% for the 2017/2018 season when using the S2 data. The use of L8 data only yielded poor results for this class (P between 37.5% and 4.2%).
The overall validation of the land cover classifications shows only average to poor results. We found OAs equal to 63.7% for 2021/2022 and 33.5% for 2017/2018, for S2 data, and 65% and 15.8%, respectively, for L8 data.

3.2.3. Validation of the M2 Early Classification Model

Table 7 shows the cereal and the cereal with olive trees classes validation results together with the overall accuracy for the M2 early classification approach. Accurate results were consistently achieved for all agricultural seasons, especially when utilizing S2 data (P between 94.2% and 85.1%); when using L8, P values range from 95.4% (2021/2022) to 42.6% (2014/2015). For the cereal with olive trees, the validation results indicate an average to poor precision either with S2 or L8 data (P values between 42.9% and 7.1%).
The overall accuracy results are very similar to those obtained with the land classification model using the data from the entire season. Particularly good results were obtained for the 2021/2022 season, where the OA was 75.2% and Kappa was 63.8%. The overall accuracy is not very good, but this is expected as by February most of the crops have not yet been seeded.
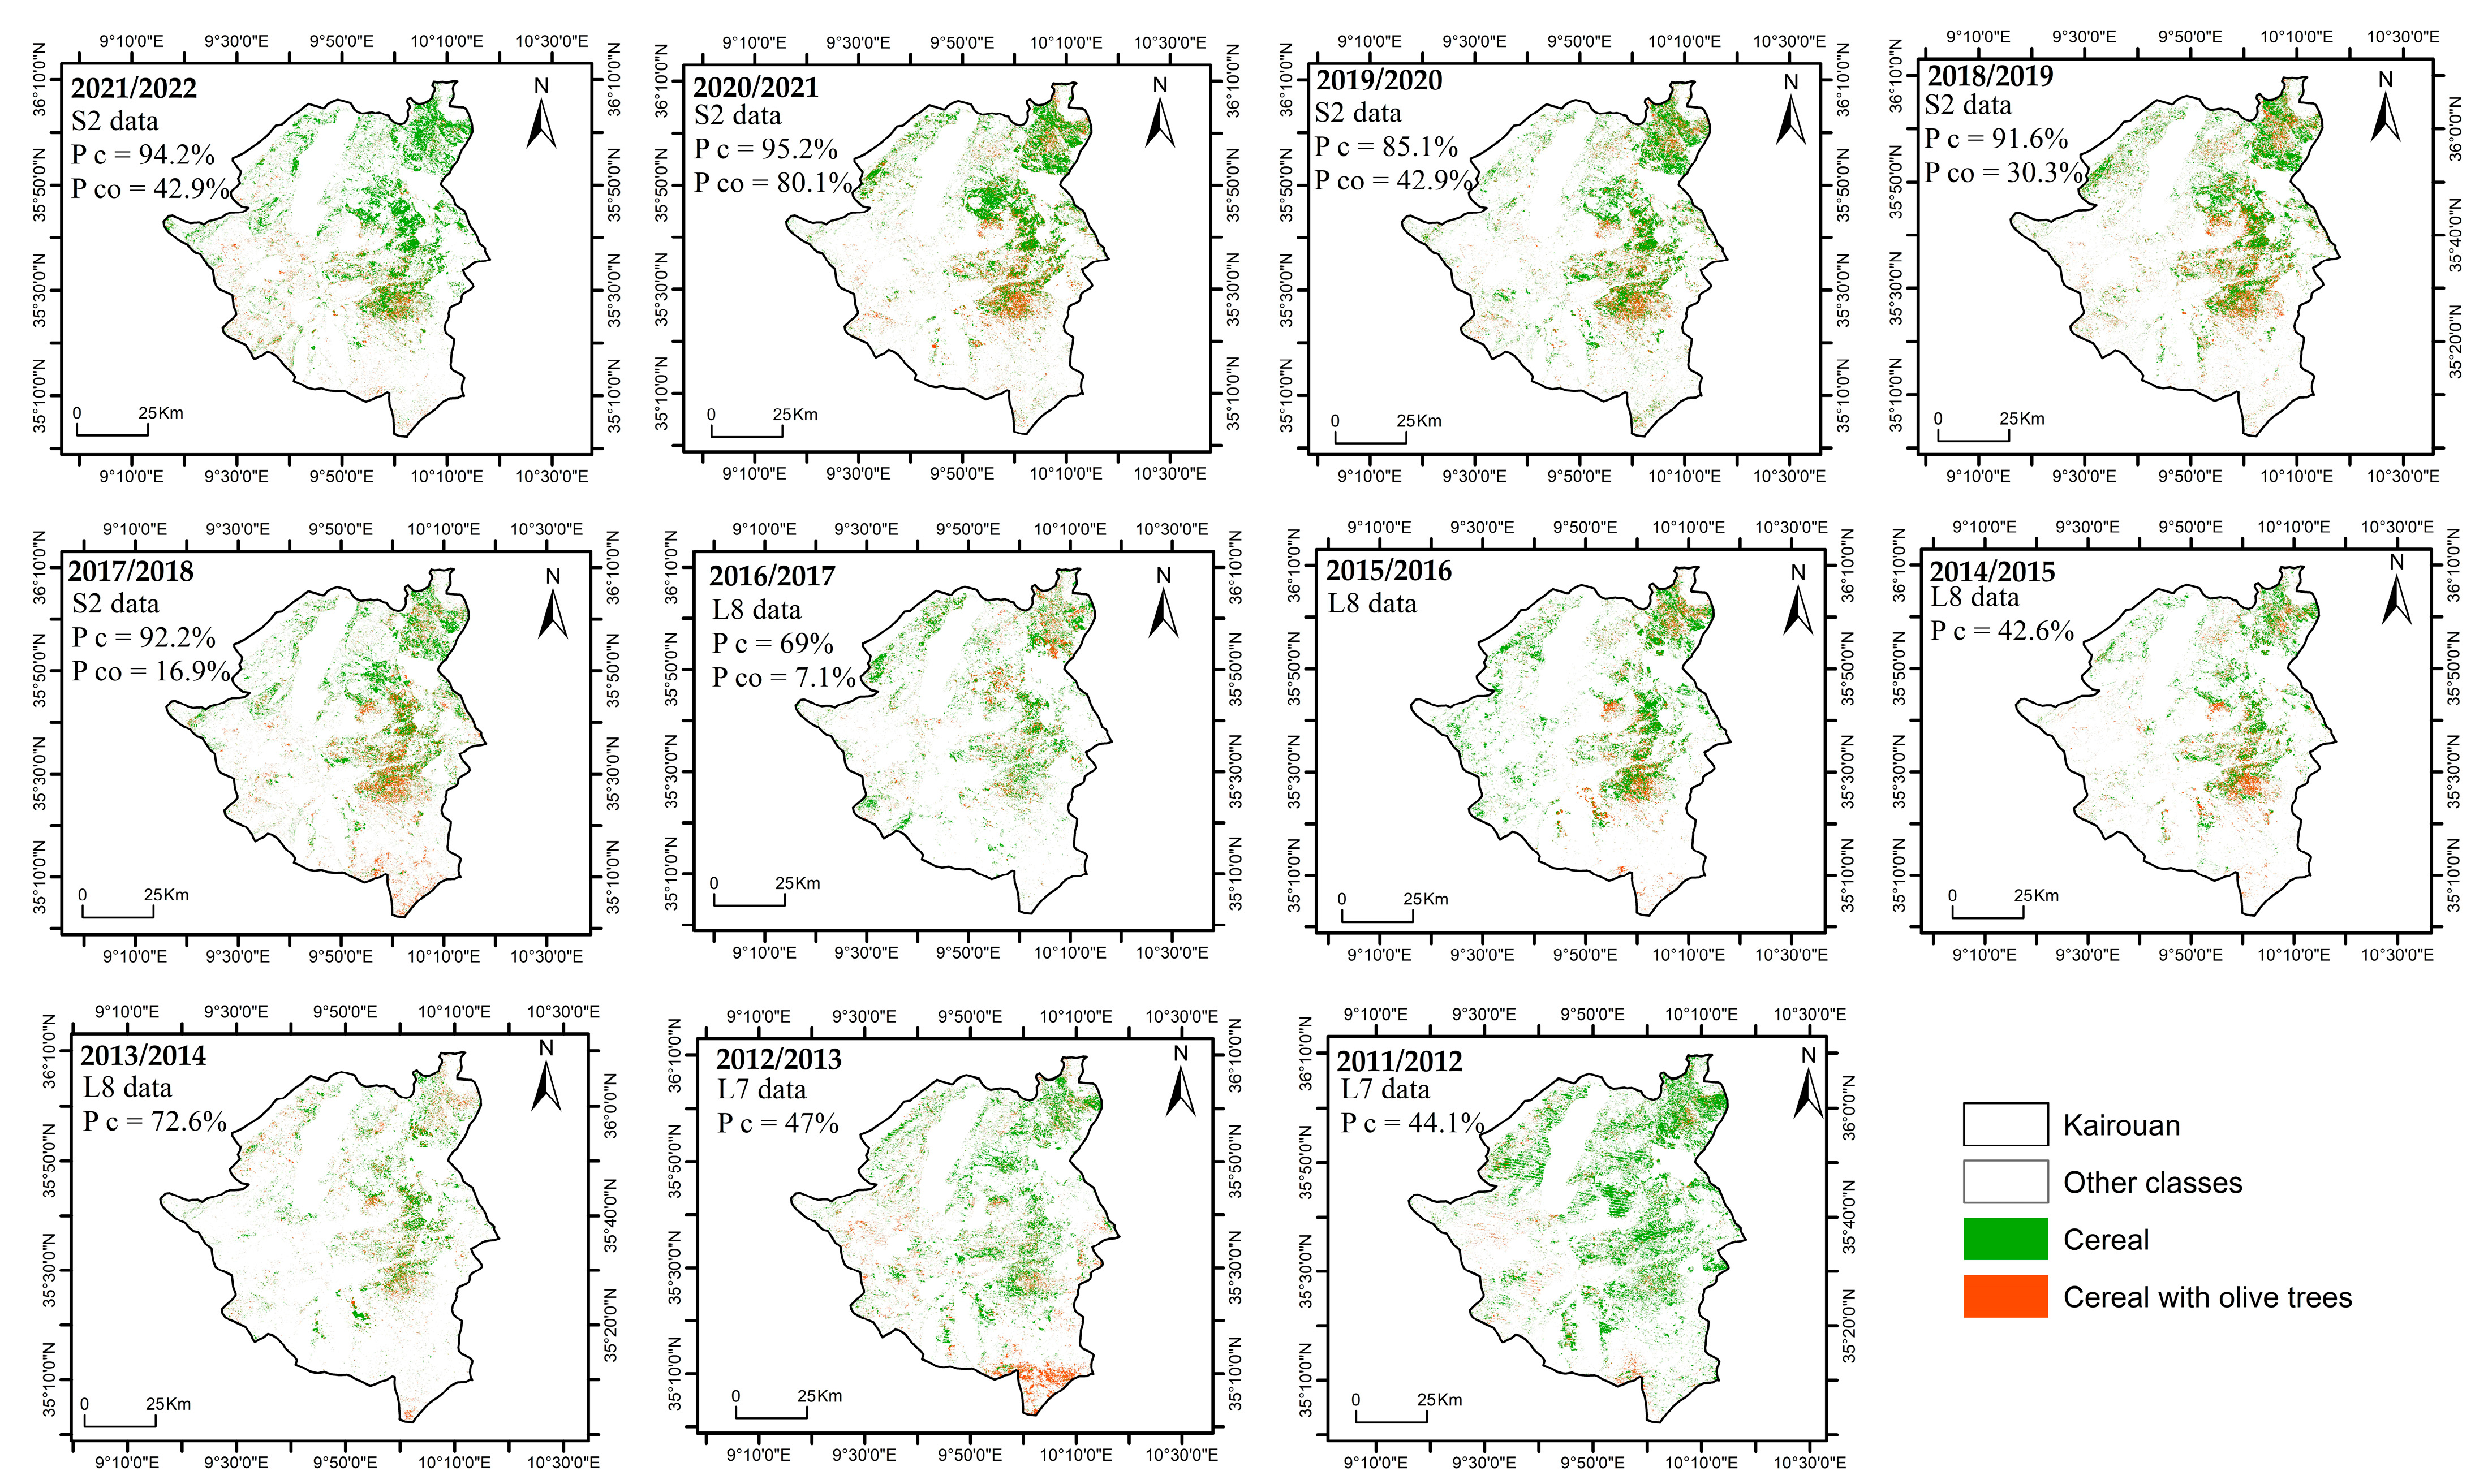
Cereal maps were produced using this model for each season throughout the study period. The visualization of all the results of cereal classification is shown in Figure 7. It shows the existence of a fixed area of cereal crops in the plain of Kairouan (center of the governorate) each year and with some differences in the north and south of the region. Notably, the northern area exhibits differences in cereal density, while the southern region showed the cultivation of cereals with olive trees in the 2011/2012 and 2012/2013 agricultural seasons, followed by their absence in subsequent years.

4. Discussion

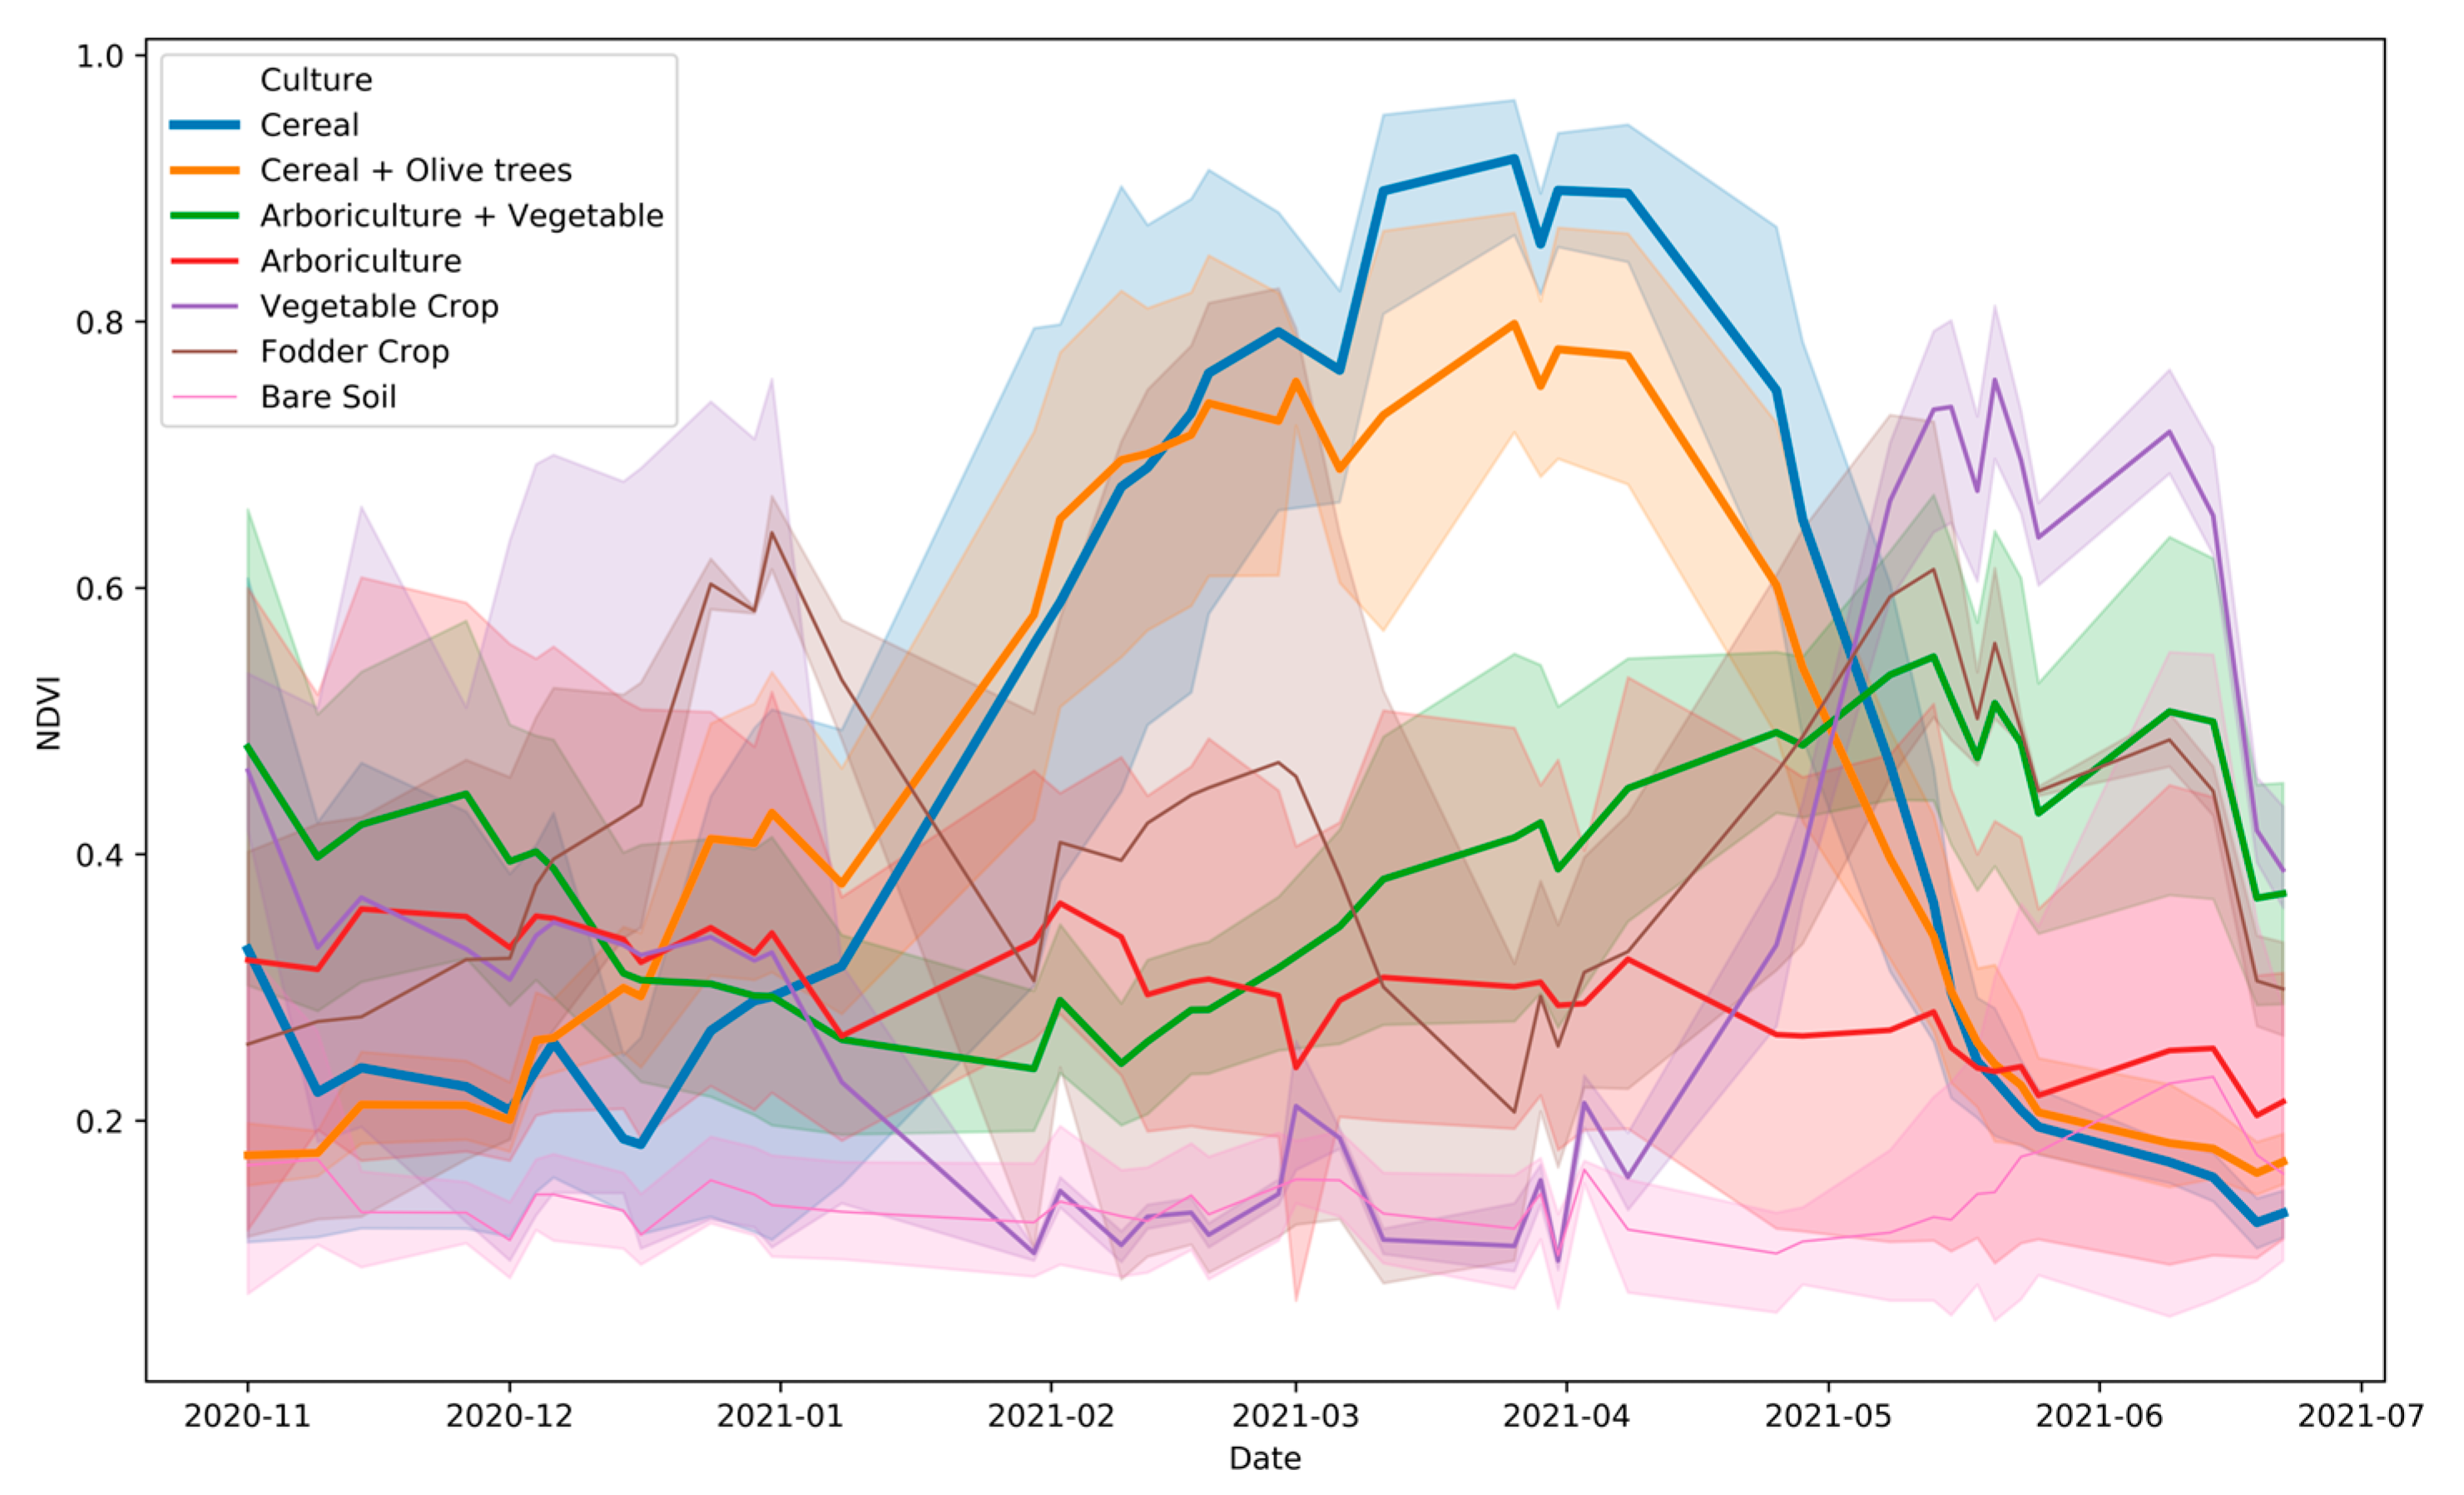
The RF classification algorithm based on DVI, MSI, NDMI, and GNDVI percentile demonstrated good performances in classifying different agricultural classes in our study area. The confusion matrix for the 2020/2021 reference year classification reveals some confusion between the cereal class and the mixed cereal with olive trees class. This confusion can be explained by the strong similarity between these two classes. According to Nasiri et al. [11], confusion between crops can be detected in cases where the crops have similar spectral signatures. The distinction between these two classes is only possible at the beginning or end of the cereal cycle when only bare soil or olive trees are present (see Figure A1). In spite of this, the number of misclassified pixels between these two classes remains relatively low compared to the total number of pixels in each class, which gives good accuracy. The percentage of misclassification for this class is about 6.67%.
The results of the cereal classification model from 2011/2012 to 2021/2022 showed a satisfactory performance, particularly for the years when S2 data were used (Figure 7). An excess of cereal crops in the Kairouan plain, corresponding to irrigated areas, was consistently detected throughout the entire period. These findings align with previous literature, which also confirmed the trend toward expanding the cultivation of cereals. Notably, the year 2016/2017 was characterized by a large amount of precipitation in December 2016 and March 2017, resulting in a larger cultivated area for cereal crops in the Kairouan plain, as indicated by our model. This result is consistent with the land cover map produced by Bousbih et al. [45], displaying remarkable similarities. Other similarities with the land cover map elaborated by Chahbi et al. [44] are also found for the year 2011/2012, which was characterized by heavy rains during the cereal vegetative cycle and shows a larger number of fields cultivated with cereals. The increment in cereal production during 2011/2012 was also caused by a government policy aimed at increasing cereal production by lowering the prices of seeds [55].
Two approaches were tested for the early classification of cereals. The first approach used the already developed model (trained using indexes from the entire agricultural season) and applied it using only data from the first part of the season. The second approach trained the model using the same months employed for the early classification task. The second early classification approach showed much better results compared to the first approach. The first approach resulted in an excess of vegetable crops instead of cereals during the February classification (Figure 5). This confusion arose from the similarity between the percentile values of cereals from November to February (early classification model) and the percentile values of vegetable crops from November to June (training model).
Conversely, the second approach demonstrated improved classification accuracy for the different crops in February, especially for the classification model based on S2 data. It was demonstrated that it was possible to develop a model to map cereals with good performance in February. The model accuracy (F1) for the cereal class in the reference year was 93.5% in February and 94.2% in June. The classification accuracy (F1) for the mixed cereal with olive trees class was 83.7% in February and 83.4% in June. When applied to the entire period, the February cereal classification exhibited a precision ranging from 85.1% to 94.2% when utilizing S2 data, while lower accuracy (42.6% to 95.4%) was observed in general with Landsat data.
The advantageous results of the classification model based on S2 data over Landsat data have also been demonstrated in studies comparing the performance of these two data sources [11,56]. The lower average precision obtained by early classification with Landsat data can be attributed to the limited number of images available and the differences in wavelengths between the bands, particularly between L7 and S2 data.
These results highlight the ability of this model to identify cereal crops as early as four months before the end of their cycle. The application of fertilizers such as di-ammonium phosphate during sowing (100–200 kg/ha) and ammonium nitrate at the beginning of tillering (150–200 kg/ha), at stem elongation (150–200 kg/ha), and at flowering if there is no rain, contributes to accelerated cereal development. By the end of February, corresponding to the full tillering stage, cereals have developed significantly and are easily identifiable, with heights exceeding 20 cm.
The confusion between cereals and cereals mixed with olive trees and the limited accuracy of the classification model based on Landsat data are the two main limitations of this study. The distinction between these two classes is only noticeable at the beginning and end of the cycle. To address this issue, we tried to incorporate an additional index (NDVI) to try to capture this difference during the early vegetative stage; however, the limited availability of Landsat data leads to significant data gaps in the area for this index, making it an impractical option. Another limitation was the reduced number of field data for this class which impacted the calibration and validation of the model.
Comparing the cereal maps of the 11 agricultural seasons, in Figure 7, the effect of droughts on agricultural practices can be clearly seen. This effect is primarily observed in the rainfed cereal areas, mainly the northern and southern parts of the study area. The absence of rainfed cereal crops in the southern part can be explained by the lack of rain during the development cycle of cereal, leading to the end of its cycle before harvesting. These observations indicate that climate change has affected the land cover in this region, with successive droughts being recorded [7,57]. Farmers have modified their agricultural practices and crops to adapt to climate change. Variations in cereal density are observed from year to year, with notable differences in the rainfed cereal areas of the northern and southern parts of the Kairouan governorate. Only the irrigated cereal areas (Kairouan plain) changed slightly during the whole period. During the agricultural seasons of 2011/2012 and 2012/2013, the southern part of the study area was cultivated with cereal crops with olive trees. In the following year, under the effect of successive periods of drought that our study area experienced, farmers in the south of the region focused exclusively on olive trees, which proved more resilient to the drought waves. The cessation of cereal cultivation in this area is a consequence of water scarcity, particularly in the Chrarda and Sidi Amor Bou Hajla regions (as depicted in Figure 1). Annual rainfall is around 200 to 250 mm for an average year, with the possibility of even less rainfall. By contrast, the northern part of the region has a different climate, characterized by an average annual rainfall of approximately 380 mm, allowing for rainfed cereal cultivation. The completion of the cereal growth cycle is linked to the rainy periods. If November is rainy, this encourages farmers to grow cereals. Cereal crops reach the end of their cycle only if they are sufficiently provided with water during the months of March and April. Therefore, if rainfall occurs during these months, rainfed cereals complete their cycle, otherwise they serve as livestock feed. Surveys conducted in March 2022 in the northern part of the region revealed that rainfed cereals complete their cycle approximately once every three years in Oueslatia’s northern part and once every five years in the southern part. Furthermore, the quantity and intensity of rainfall can also affect the cereal cycle. For this reason, early identification of cereal areas is crucial for the decision-making processes.
Moreover, local government policies also influence agricultural practices. During the years from 2010/2011 to 2012/2013, the government encouraged farmers to switch to arboriculture, particularly focusing on irrigated olive trees. For this reason, there was a notable abandonment of olive trees. However, more recently, the Tunisian government has encouraged farmers to grow cereals instead of vegetable crops, because of the problems related to the importation of cereals. The government has also influenced land use through subsidy decisions.

5. Conclusions

A land cover classification model has been calibrated and validated over 11 years. The model achieved an overall accuracy (OA) of 89.3%. The validation results of the classification model show accurate results for the years based on S2 data, especially for cereal crops with P between 85.8% and 95.1% from 2017/2018 to 2021/2022. However, the validation of this model for the years based on Landsat data (L7 and L8) shows average results, with P between 41% and 91.8%. A slight confusion between cereals and cereals growing with olive trees was detected.
A second objective was to map cereals as early as possible in the agricultural season. An early classification model demonstrated accurate results in February (four months before harvest), with a cereal precision of 95.2% and an OA of 87.7%. When applied to the entire period, the February cereal classification exhibited a precision ranging from 85.1% to 94.2% when utilizing S2 data, while lower accuracy (42.6% to 95.4%) was observed in general with Landsat data.
The obtained results open the path to having early land use maps, up to three or four months before the harvest, with a precision for cereal crops that is comparable to a map produced at the end of the cycle, without the need for field campaigns for data collection. This methodology can be adapted on a national scale if more field data are collected and it can be a decision-support tool for food security.

Author Contributions

Conceptualization, M.K., M.J.E., Z.L.C. and A.C.B.; methodology, M.K., M.J.E., A.C.B., Z.K. and G.P.; software, M.K., M.J.E. and G.P.; validation, M.K., A.C.B., M.J.E., Z.K., G.P. and Z.L.C.; formal analysis, M.K., M.J.E., A.C.B. and Z.L.C.; investigation, M.K.; resources, M.K.; data curation, M.K. and Z.K.; writing—original draft preparation, M.K.; writing—review and editing, M.J.E., A.C.B., G.P., Z.K. and Z.L.C.; visualization, M.K.; supervision, Z.L.C., M.J.E. and A.C.B.; project administration, M.J.E. and Z.L.C.; funding acquisition, M.J.E. and Z.L.C. All authors have read and agreed to the published version of the manuscript.

Funding

This work was supported by the European Commission Horizon 2020 Programme for Research and Innovation (H2020) in the context of the Marie Sklodowska-Curie Research and Innovation Staff Exchange (RISE) action (ACCWA project, grant agreement no. 823965) and LR GREEN-TEAM (LR17AGR01) of INAT, University of Carthage.

Institutional Review Board Statement

Not applicable.

Data Availability Statement

The data presented in this study are available on request from the corresponding author.

Acknowledgments

The authors would like to thank Emna Ayari, Echraf Shil, and Haifa Rebei for supporting ground truth field missions; the LR GREEN-TEAM (LR17AGR01) for providing the field data from 2011/2012 to 2019/2020; and the National Agronomic Institute of Tunisia technical team and IRD Tunis for technical support in the field and in the laboratory.

Conflicts of Interest

The authors declare no conflict of interest.

Appendix A

Table A1. Vegetation indices dedicated to the land cover classification tested in this study, including details of the bands used, the calculation formula, and the reference for each index.
Vegetation IndexBandExpressionReference
NDVINormalized Difference Vegetation IndexNIR, Red(NIR − Red)/(NIR + Red)[39]
GNDVIGreen Normalized Difference Vegetation IndexGreen, NIR(NIR − Green)/(NIR + Green)[58]
NDRENormalized Difference Red EdgeNIR, Red Edge(NIR − Red Edge)/(NIR + Red Edge)[59]
EVIEnhanced Vegetation IndexNIR, Red, Blue2.5 × (NIR − Red)/(1 + NIR + 6 × Red − 7.5 × Blue)[60]
EVI2Enhanced Vegetation Index 2NIR, Red2.5 × (NIR − Red)/(NIR + 2.4 × Red + 1)[40]
IPVIInfrared Percentage Vegetation IndexNIR, RedNIR/(NIR + Red)[61]
OSAVIOptimized SAVINIR, Red1.16 × ((NIR − Red)/(NIR+ Red + 0.16))[62]
MSIMoisture stress indexNIR, SWIR1SWIR1/NIR[63]
NDMINormalized Difference Moisture IndexNIR, SWIR1(NIR − SWIR1)/(NIR + SWIR1)[41]
NGRDINormalized Green–Red Difference IndexGreen, Red(Green − Red)/(Green + Red)[64]
SRISimple Ratio IndexNIR, RedNIR/Red[65]
GRVIGreen Ratio Vegetation IndexGreen, RedGreen/Red[66]
RGIRed–Green IndexGreen, RedRed/Green[66]
TVITriangular Vegetation IndexNIR, Green, Red0.5 × (120 × (NIR − Green) − 200 × (Red − Green))[67]
DVIDifference Vegetation IndexNIR, RedNIR − Red[39]

Appendix B

Figure A1 below represents an example of the NDVI profile of each crop of some ground truth plots from the 2020/2021 reference year.
Figure A1. NDVI profile for the different considered crops derived from multitemporal S2 data for the 2020/2021 agricultural season.
Agriculture 13 01633 g0a1

References

  1. Guan, R.; Li, Z.; Li, T.; Li, X.; Yang, J.; Chen, W. Classification of Heterogeneous Mining Areas Based on ResCapsNet and Gaofen-5 Imagery. Remote Sens. 2022, 14, 3216. [Google Scholar] [CrossRef]
  2. Cassidy, L.; Binford, M.; Southworth, J.; Barnes, G. Social and ecological factors and land-use land-cover diversity in two provinces in southeast Asia. J. Land Use Sci. 2010, 5, 277–306. [Google Scholar] [CrossRef]
  3. Yang, R.; Zhou, Q.; Fan, B.; Wang, Y.; Li, Z. Land Cover Classification from Hyperspectral Images via Weighted Spatial–Spectral Joint Kernel Collaborative Representation Classifier. Agriculture 2023, 13, 304. [Google Scholar] [CrossRef]
  4. Zhi, F.; Dong, Z.; Guga, S.; Bao, Y.; Han, A.; Zhang, J.; Bao, Y. Rapid and Automated Mapping of Crop Type in Jilin Province Using Historical Crop Labels and the Google Earth Engine. Remote Sens. 2022, 14, 4028. [Google Scholar] [CrossRef]
  5. Han, J.; Zhang, Z.; Cao, J.; Luo, Y. Mapping rapeseed planting areas using an automatic phenology- and pixel-based algorithm (APPA) in Google Earth Engine. Crop J. 2022, 10, 1483–1495. [Google Scholar] [CrossRef]
  6. Verner, D.; Treguer, D.; Redwood, J.; Christensen, J.; McDonnell, R.; Elbert, C.; Konishi, Y. Climate Variability, Drought, and Drought Management in Tunisia’s Agricultural Sector; World Bank: Washington, DC, USA, 2018. [Google Scholar]
  7. Mougou, R.; Mansour, M.; Iglesias, A.; Chebbi, R.Z.; Battaglini, A. Climate change and agricultural vulnerability: A case study of rain-fed wheat in Kairouan, Central Tunisia. Reg. Env. Chang. 2011, 11, 137–142. [Google Scholar] [CrossRef]
  8. Van Tilburg, A.J.; Hudson, P.F. Extreme weather events and farmer adaptation in Zeeland, the Netherlands: A European climate change case study from the Rhine delta. Sci. Total Environ. 2022, 844, 157212. [Google Scholar] [CrossRef] [PubMed]
  9. You, N.; Dong, J. Examining earliest identifiable timing of crops using all available Sentinel 1/2 imagery and Google Earth Engine. ISPRS J. Photogramm. Remote Sens. 2020, 161, 109–123. [Google Scholar] [CrossRef]
  10. Mirmazloumi, S.M.; Kakooei, M.; Mohseni, F.; Ghorbanian, A.; Amani, M.; Crosetto, M.; Monserrat, O. ELULC-10, a 10 m European Land Use and Land Cover Map Using Sentinel and Landsat Data in Google Earth Engine. Remote Sens. 2022, 14, 3041. [Google Scholar] [CrossRef]
  11. Nasiri, V.; Deljouei, A.; Moradi, F.; Sadeghi, S.M.M.; Borz, S.A. Land Use and Land Cover Mapping Using Sentinel-2, Landsat-8 Satellite Images, and Google Earth Engine: A Comparison of Two Composition Methods. Remote Sens. 2022, 14, 1977. [Google Scholar] [CrossRef]
  12. Friedl, M.A.; Sulla-Menashe, D.; Tan, B.; Schneider, A.; Ramankutty, N.; Sibley, A.; Huang, X. MODIS Collection 5 global land cover: Algorithm refinements and characterization of new datasets. Remote Sens. Environ. 2010, 114, 168–182. [Google Scholar] [CrossRef]
  13. Poulter, B.; MacBean, N.; Hartley, A.; Khlystova, I.; Arino, O.; Betts, R.; Bontemps, S.; Boettcher, M.; Brockmann, C.; Defourny, P.; et al. Plant functional type classification for earth system models: Results from the European Space Agency’s Land Cover Climate Change Initiative. Geosci. Model Dev. 2015, 8, 2315–2328. [Google Scholar] [CrossRef]
  14. Buchhorn, M.; Smets, B.; Bertels, L.; Roo, B.D.; Lesiv, M.; Tsendbazar, N.-E.; Herold, M.; Fritz, S. Copernicus Global Land Service: Land Cover 100 m: Collection 3: Epoch 2019: Globe; Laboratory of Geo-Information Science and Remote Sensing: Wageningen, The Netherlands, 2020. [Google Scholar]
  15. Gong, P.; Liu, H.; Zhang, M.; Li, C.; Wang, J.; Huang, H.; Clinton, N.; Ji, L.; Li, W.; Bai, Y.; et al. Stable classification with limited sample: Transferring a 30-m resolution sample set collected in 2015 to mapping 10-m resolution global land cover in 2017. Sci. Bull. 2019, 64, 370–373. [Google Scholar] [CrossRef] [PubMed]
  16. Malinowski, R.; Lewiński, S.; Rybicki, M.; Gromny, E.; Jenerowicz, M.; Krupiński, M.; Nowakowski, A.; Wojtkowski, C.; Krupiński, M.; Krätzschmar, E.; et al. Automated Production of a Land Cover/Use Map of Europe Based on Sentinel-2 Imagery. Remote Sens. 2020, 12, 3523. [Google Scholar] [CrossRef]
  17. Venter, Z.S.; Sydenham, M.A.K. Continental-Scale Land Cover Mapping at 10 m Resolution Over Europe (ELC10). Remote Sens. 2021, 13, 2301. [Google Scholar] [CrossRef]
  18. Li, Q.; Qiu, C.; Ma, L.; Schmitt, M.; Zhu, X. Mapping the Land Cover of Africa at 10 m Resolution from Multi-Source Remote Sensing Data with Google Earth Engine. Remote Sens. 2020, 12, 602. [Google Scholar] [CrossRef]
  19. Yang, L.; Driscol, J.; Sarigai, S.; Wu, Q.; Chen, H.; Lippitt, C.D. Google Earth Engine and Artificial Intelligence (AI): A Comprehensive Review. Remote Sens. 2022, 14, 3253. [Google Scholar] [CrossRef]
  20. Random Forests|SpringerLink. Available online: https://link.springer.com/article/10.1023/A:1010933404324 (accessed on 11 October 2022).
  21. Xie, S.; Liu, L.; Zhang, X.; Yang, J.; Chen, X.; Gao, Y. Automatic Land-Cover Mapping using Landsat Time-Series Data based on Google Earth Engine. Remote Sens. 2019, 11, 3023. [Google Scholar] [CrossRef]
  22. Monsalve-Tellez, J.M.; Torres-León, J.L.; Garcés-Gómez, Y.A. Evaluation of SAR and Optical Image Fusion Methods in Oil Palm Crop Cover Classification Using the Random Forest Algorithm. Agriculture 2022, 12, 955. [Google Scholar] [CrossRef]
  23. Teluguntla, P.; Thenkabail, P.S.; Oliphant, A.; Xiong, J.; Gumma, M.K.; Congalton, R.G.; Yadav, K.; Huete, A. A 30-m landsat-derived cropland extent product of Australia and China using random forest machine learning algorithm on Google Earth Engine cloud computing platform. ISPRS J. Photogramm. Remote Sens. 2018, 144, 325–340. [Google Scholar] [CrossRef]
  24. Kelley, L.C.; Pitcher, L.; Bacon, C. Using Google Earth Engine to Map Complex Shade-Grown Coffee Landscapes in Northern Nicaragua. Remote Sens. 2018, 10, 952. [Google Scholar] [CrossRef]
  25. Oliphant, A.J.; Thenkabail, P.S.; Teluguntla, P.; Xiong, J.; Gumma, M.K.; Congalton, R.G.; Yadav, K. Mapping cropland extent of Southeast and Northeast Asia using multi-year time-series Landsat 30-m data using a random forest classifier on the Google Earth Engine Cloud. Int. J. Appl. Earth Obs. Geoinf. 2019, 81, 110–124. [Google Scholar] [CrossRef]
  26. Gumma, M.K.; Thenkabail, P.S.; Teluguntla, P.G.; Oliphant, A.; Xiong, J.; Giri, C.; Pyla, V.; Dixit, S.; Whitbread, A.M. Agricultural cropland extent and areas of South Asia derived using Landsat satellite 30-m time-series big-data using random forest machine learning algorithms on the Google Earth Engine cloud. GIScience Remote Sens. 2020, 57, 302–322. [Google Scholar] [CrossRef]
  27. Ibrahim, S. Improving Land Use/Cover Classification Accuracy from Random Forest Feature Importance Selection Based on Synergistic Use of Sentinel Data and Digital Elevation Model in Agriculturally Dominated Landscape. Agriculture 2022, 13, 98. [Google Scholar] [CrossRef]
  28. Zeng, J.; Tan, M.L.; Tew, Y.L.; Zhang, F.; Wang, T.; Samat, N.; Tangang, F.; Yusop, Z. Optimization of Open-Access Optical and Radar Satellite Data in Google Earth Engine for Oil Palm Mapping in the Muda River Basin, Malaysia. Agriculture 2022, 12, 1435. [Google Scholar] [CrossRef]
  29. Abida, K.; Barbouchi, M.; Boudabbous, K.; Toukabri, W.; Saad, K.; Bousnina, H.; Sahli Chahed, T. Sentinel-2 Data for Land Use Mapping: Comparing Different Supervised Classifications in Semi-Arid Areas. Agriculture 2022, 12, 1429. [Google Scholar] [CrossRef]
  30. The Nature of Statistical Learning Theory|SpringerLink. Available online: https://link.springer.com/book/10.1007/978-1-4757-3264-1 (accessed on 12 October 2022).
  31. Ni, R.; Tian, J.; Li, X.; Yin, D.; Li, J.; Gong, H.; Zhang, J.; Zhu, L.; Wu, D. An enhanced pixel-based phenological feature for accurate paddy rice mapping with Sentinel-2 imagery in Google Earth Engine. ISPRS J. Photogramm. Remote Sens. 2021, 178, 282–296. [Google Scholar] [CrossRef]
  32. Piiroinen, R.; Heiskanen, J.; Mõttus, M.; Pellikka, P. Classification of crops across heterogeneous agricultural landscape in Kenya using AisaEAGLE imaging spectroscopy data. Int. J. Appl. Earth Obs. Geoinf. 2015, 39, 1–8. [Google Scholar] [CrossRef]
  33. Huang, C.; Davis, L.S.; Townshend, J.R.G. An assessment of support vector machines for land cover classification. Int. J. Remote Sens. 2002, 23, 725–749. [Google Scholar] [CrossRef]
  34. Yousefi, S.; Mirzaee, S.; Almohamad, H.; Al Dughairi, A.A.; Gomez, C.; Siamian, N.; Alrasheedi, M.; Abdo, H.G. Image Classification and Land Cover Mapping Using Sentinel-2 Imagery: Optimization of SVM Parameters. Land 2022, 11, 993. [Google Scholar] [CrossRef]
  35. Paneque-Gálvez, J.; Mas, J.-F.; Moré, G.; Cristóbal, J.; Orta-Martínez, M.; Luz, A.C.; Guèze, M.; Macía, M.J.; Reyes-García, V. Enhanced land use/cover classification of heterogeneous tropical landscapes using support vector machines and textural homogeneity. Int. J. Appl. Earth Obs. Geoinf. 2013, 23, 372–383. [Google Scholar] [CrossRef]
  36. Li, X.; Chen, W.; Cheng, X.; Wang, L. A Comparison of Machine Learning Algorithms for Mapping of Complex Surface-Mined and Agricultural Landscapes Using ZiYuan-3 Stereo Satellite Imagery. Remote Sens. 2016, 8, 514. [Google Scholar] [CrossRef]
  37. Praticò, S.; Solano, F.; Di Fazio, S.; Modica, G. Machine Learning Classification of Mediterranean Forest Habitats in Google Earth Engine Based on Seasonal Sentinel-2 Time-Series and Input Image Composition Optimisation. Remote Sens. 2021, 13, 586. [Google Scholar] [CrossRef]
  38. Breiman, L. Classification and Regression Trees; Routledge: New York, NY, USA, 2017; ISBN 978-1-315-13947-0. [Google Scholar]
  39. Tucker, C.J. Red and photographic infrared linear combinations for monitoring vegetation. Remote Sens. Environ. 1979, 8, 127–150. [Google Scholar] [CrossRef]
  40. Jiang, Z.; Huete, A.; Didan, K.; Miura, T. Development of a two-band enhanced vegetation index without a blue band. Remote Sens. Environ. 2008, 112, 3833–3845. [Google Scholar] [CrossRef]
  41. Jin, S.; Sader, S.A. Comparison of time series tasseled cap wetness and the normalized difference moisture index in detecting forest disturbances. Remote Sens. Environ. 2005, 94, 364–372. [Google Scholar] [CrossRef]
  42. Phan, T.N.; Kuch, V.; Lehnert, L.W. Land Cover Classification using Google Earth Engine and Random Forest Classifier—The Role of Image Composition. Remote Sens. 2020, 12, 2411. [Google Scholar] [CrossRef]
  43. Amini, S.; Saber, M.; Rabiei-Dastjerdi, H.; Homayouni, S. Urban Land Use and Land Cover Change Analysis Using Random Forest Classification of Landsat Time Series. Remote Sens. 2022, 14, 2654. [Google Scholar] [CrossRef]
  44. Chahbi, A.; Zribi, M.; Lili-Chabaane, Z.; Duchemin, B.; Shabou, M.; Mougenot, B.; Boulet, G. Estimation of the dynamics and yields of cereals in a semi-arid area using remote sensing and the SAFY growth model. Int. J. Remote Sens. 2014, 35, 1004–1028. [Google Scholar] [CrossRef]
  45. Bousbih, S.; Zribi, M.; Lili-Chabaane, Z.; Baghdadi, N.; El Hajj, M.; Gao, Q.; Mougenot, B. Potential of Sentinel-1 Radar Data for the Assessment of Soil and Cereal Cover Parameters. Sensors 2017, 17, 2617. [Google Scholar] [CrossRef]
  46. Chahbi Bellakanji, A.; Zribi, M.; Lili-Chabaane, Z.; Mougenot, B. Forecasting of Cereal Yields in a Semi-arid Area Using the Simple Algorithm for Yield Estimation (SAFY) Agro-Meteorological Model Combined with Optical SPOT/HRV Images. Sensors 2018, 18, 2138. [Google Scholar] [CrossRef] [PubMed]
  47. Zribi, M.; Chahbi, A.; Shabou, M.; Lili-Chabaane, Z.; Duchemin, B.; Baghdadi, N.; Amri, R.; Chehbouni, A. Soil surface moisture estimation over a semi-arid region using ENVISAT ASAR radar data for soil evaporation evaluation. Hydrol. Earth Syst. Sci. 2011, 15, 345–358. [Google Scholar] [CrossRef]
  48. Wei, M.; Wang, H.; Zhang, Y.; Li, Q.; Du, X.; Shi, G.; Ren, Y. Investigating the Potential of Crop Discrimination in Early Growing Stage of Change Analysis in Remote Sensing Crop Profiles. Remote Sens. 2023, 15, 853. [Google Scholar] [CrossRef]
  49. You, N.; Dong, J.; Li, J.; Huang, J.; Jin, Z. Rapid early-season maize mapping without crop labels. Remote Sens. Environ. 2023, 290, 113496. [Google Scholar] [CrossRef]
  50. Weilandt, F.; Behling, R.; Goncalves, R.; Madadi, A.; Richter, L.; Sanona, T.; Spengler, D.; Welsch, J. Early Crop Classification via Multi-Modal Satellite Data Fusion and Temporal Attention. Remote Sens. 2023, 15, 799. [Google Scholar] [CrossRef]
  51. Kairouan Governorate in Figures 2020. Available online: http://www.odco.nat.tn/en/publishing/governorates-in-figures/kairouan-governorate-in-figures-2020/ (accessed on 19 November 2022).
  52. Evolution de la collecte des céréales à l’échelle nationale à la date du 28 Juin 2022. Office des Céréales—Tunis. 2022. Available online: https://www.oc.com.tn/fr/evolution-de-la-collecte-des-cereales-a-lechelle-nationale-a-la-date-du-28-juin-2022/ (accessed on 20 November 2022).
  53. Congalton, R.G. A review of assessing the accuracy of classifications of remotely sensed data. Remote Sens. Environ. 1991, 37, 35–46. [Google Scholar] [CrossRef]
  54. Cohen, J. A Coefficient of Agreement for Nominal Scales. Educ. Psychol. Meas. 1960, 20, 37–46. [Google Scholar] [CrossRef]
  55. Chahed, Y.; Hassan, F.A. 2012 Grain and Feed Update Tunisia. Global Agricultural Information Network. 2012; TS1204. Available online: https://apps.fas.usda.gov/newgainapi/api/report/downloadreportbyfilename?filename=2012%20Grain%20and%20Feed%20Update_Tunis_Tunisia_5-18-2012.pdf (accessed on 20 November 2022).
  56. Forkuor, G.; Dimobe, K.; Serme, I.; Tondoh, J.E. Landsat-8 vs. Sentinel-2: Examining the added value of sentinel-2’s red-edge bands to land-use and land-cover mapping in Burkina Faso. GIScience Remote Sens. 2018, 55, 331–354. [Google Scholar] [CrossRef]
  57. Zribi, M.; Nativel, S.; Le Page, M. Analysis of Agronomic Drought in a Highly Anthropogenic Context Based on Satellite Monitoring of Vegetation and Soil Moisture. Remote Sens. 2021, 13, 2698. [Google Scholar] [CrossRef]
  58. Gitelson, A.A.; Kaufman, Y.J.; Merzlyak, M.N. Use of a green channel in remote sensing of global vegetation from EOS-MODIS. Remote Sens. Environ. 1996, 58, 289–298. [Google Scholar] [CrossRef]
  59. Gitelson, A.; Merzlyak, M.N. Spectral Reflectance Changes Associated with Autumn Senescence of Aesculus hippocastanum L. and Acer platanoides L. Leaves. Spectral Features and Relation to Chlorophyll Estimation. J. Plant Physiol. 1994, 143, 286–292. [Google Scholar] [CrossRef]
  60. Huete, A.; Didan, K.; Miura, T.; Rodriguez, E.P.; Gao, X.; Ferreira, L.G. Overview of the radiometric and biophysical performance of the MODIS vegetation indices. Remote Sens. Environ. 2002, 83, 195–213. [Google Scholar] [CrossRef]
  61. Crippen, R.E. Calculating the vegetation index faster. Remote Sens. Environ. 1990, 34, 71–73. [Google Scholar] [CrossRef]
  62. Rondeaux, G.; Steven, M.; Baret, F. Optimization of soil-adjusted vegetation indices. Remote Sens. Environ. 1996, 55, 95–107. [Google Scholar] [CrossRef]
  63. Huntjr, E.; Rock, B. Detection of changes in leaf water content using Near- and Middle-Infrared reflectances. Remote Sens. Environ. 1989, 30, 43–54. [Google Scholar] [CrossRef]
  64. Gitelson, A.A.; Kaufman, Y.J.; Stark, R.; Rundquist, D. Novel algorithms for remote estimation of vegetation fraction. Remote Sens. Environ. 2002, 80, 76–87. [Google Scholar] [CrossRef]
  65. Pearson, R.L.; Miller, L.D. Remote Mapping of Standing Crop Biomass for Estimation of the Productivity of the Shortgrass Prairie; Willow Run Laboratories, Environmental Research Institute of Michigan: Ann Arbor, MI, USA, 1972; p. 1355. [Google Scholar]
  66. Gamon, J.A.; Surfus, J.S. Assessing leaf pigment content and activity with a reflectometer. New Phytol. 1999, 143, 105–117. [Google Scholar] [CrossRef]
  67. Broge, N.H.; Leblanc, E. Comparing prediction power and stability of broadband and hyperspectral vegetation indices for estimation of green leaf area index and canopy chlorophyll density. Remote Sens. Environ. 2001, 76, 156–172. [Google Scholar] [CrossRef]
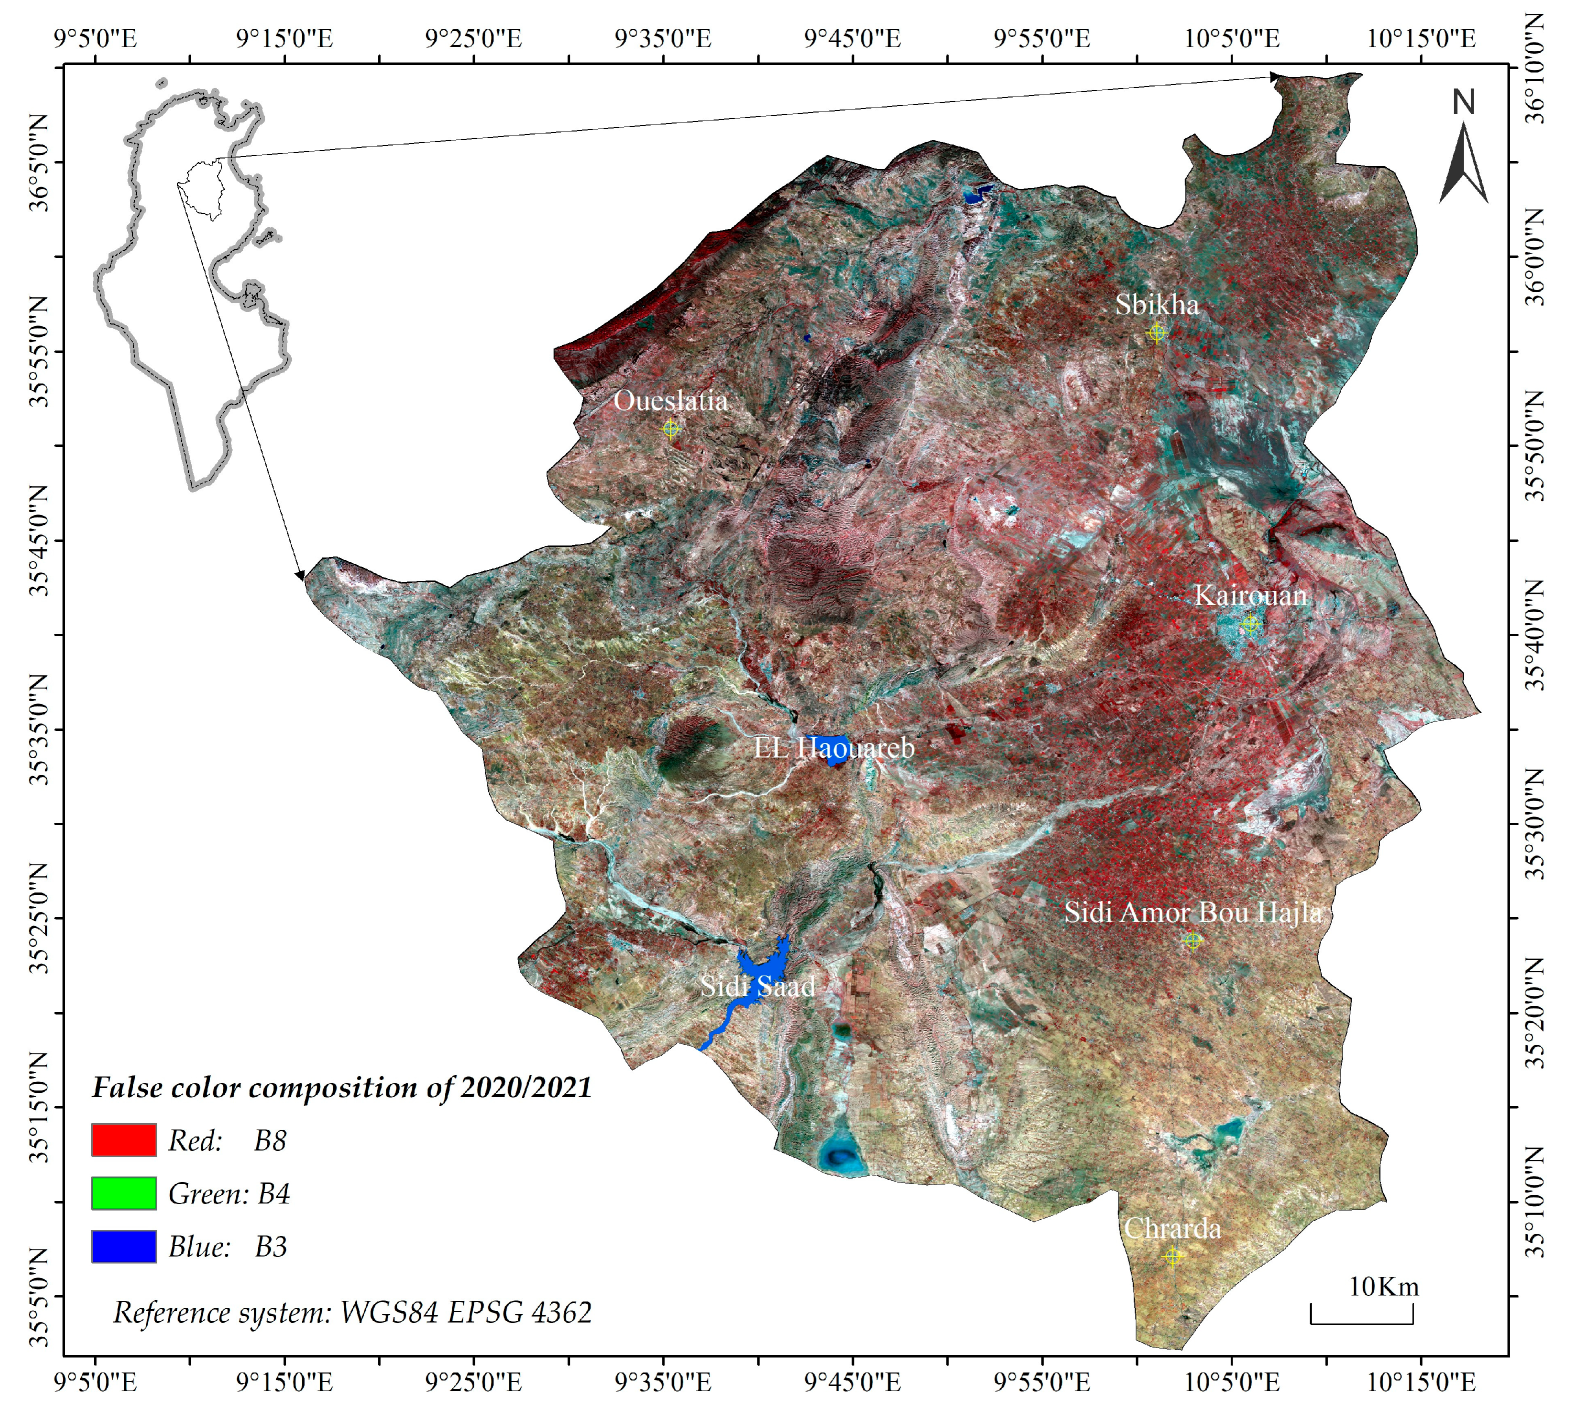
Figure 1. Location of the study area governorate of Kairouan. The RGB (B8, B4, B3) composite is the median of all S2 images from 1 November 2020 to 30 June 2021.
Agriculture 13 01633 g001
Figure 2. Flow chart for land cover modelization approach including remote sensing data analysis, field data acquisition preprocessing, and the classification approach, and the derived early land cover classification model.
Agriculture 13 01633 g002
Figure 3. Contribution of vegetation indices when applying the RF algorithm for 2020/2021 land cover classification. The indices were ranked in descending order of importance for land cover classification in our study area.
Agriculture 13 01633 g003
Figure 4. Land cover classification of the 2020/2021 agricultural season by using multitemporal S2 data from 1 November 2020 to 30 June 2021, with the occupation percentage of each crop class in relation to the area of the agricultural crop mask of the Kairouan governorate.
Agriculture 13 01633 g004
Figure 5. M1 land cover classification for the 2020/2021 agricultural season by using multitemporal S2 data for the different classification periods. For each land cover classification result, the OA and Kappa results are indicated.
Agriculture 13 01633 g005
Figure 6. M2 Land cover classification for the 2020/2021 agricultural season by using multitemporal S2 data for the different classification periods. For each land cover classification result, the OA and Kappa results are indicated.
Agriculture 13 01633 g006
Figure 7. Early cereal identification maps (4 months before harvest) were obtained by using multitemporal satellite data from 1 November, yi−1 to February 28, yi. An identification of the used satellite data is specified for each year with the precision of the cereal class (P c) and the cereal mixed with olive trees class (P co).
Agriculture 13 01633 g007
Table 1. Field observation data for each class for the agricultural seasons from 2011/2012 to 2021/2022 in Kairouan governorate.
Year/Class2011/
2012
2012/
2013
2013/
2014
2014/
2015
2015/
2016
2016/
2017
2017/
2018
2018/
2019
2019/
2020
2020/
2021
2021/
2022
Cereal57767626-99188171117261419
Cereal with
olive trees
-12--4143403010969
Fodder crop-28-4-----3235
Vegetable69969693-232122177112
Arboriculture113354-11101845215164
Arboriculture with vegetable42333332-253535493544
Bare soil1415360-356112653129
Total193252213269-234303297284776868
Table 2. Confusion matrix for the 2020/2021 land cover classification with the specification of precision (P), recall (R), and F1 score for each class.
CerealCereal with Olive TreesFodder CropVegetableArboricultureArboriculture with
Vegetable
Bare SoilRow Total
Cereal12,68038501401129313,329
Cereal with olive trees34739841141912204874
Fodder crop44328696193401193
Vegetable46101286217801513
Arboriculture24232160729853457668
Arboriculture with vegetable414517174346820161513
Bare soil60519819881338990
Column total13,5874675889153989991194819739,080
P (%)95.181.758.38595.254.290.5
R (%)93.385.278.383.681.168.799.2
F194.283.466.984.387.660.694.6
Table 3. Confusion matrix for the 2020/2021 February classification applying the M1 model with the specification of precision (P), recall (R), and F1 score for each class.
CerealCereal with Olive TreeFodder CropVegetableArboricultureArboriculture with VegetableBare SoilRow Total
Cereal10,994395516111631095213,329
Cereal with olive trees37833721147076217804874
Fodder crop3221362719723201193
Vegetable1640011457183141513
Arboriculture11111417419100227668
Arboriculture with vegetable273526852984481513
Bare soil3921130223220361318990
Column total12,2883927753312211,1141649622739,080
P (%)82.569.252.675.796.855.868.2
R (%)89.585.983.336.766.851.298.5
F185.876.664.449.47953.480.6
Table 4. Confusion matrix for the 2020/2021 February M2 classification model with the specification of precision (P), recall (R), and F1 score for each class.
CerealCereal with Olive TreeFodder CropVegetableArboricultureArboriculture with VegetableBare SoilRow Total
Cereal12,689299112415655513,329
Cereal with olive trees375390301445113104874
Fodder crop45910693282101193
Vegetable14316910868132741513
Arboriculture8920370462292907668
Arboriculture with vegetable511731812938621241513
Bare soil13641497669579398990
Column total13,8154426795138587221455848239,080
P (%)95.280.158.171.891.95788.3
R (%)91.888.287.278.480.859.293.6
F193.583.969.774.98658.191.9
Table 5. Validation results of the land cover classification model by setting the P, R, and F1 for cereal and cereal mixed with olive trees, and OA and Kappa for overall classification accuracy.
DataYearCerealCereal with Olive TreesLand Cover
PRF1PRF1OAKappa
Reference year S22020/202195.193.394.281.785.283.489.386.1
S22021/202295.175.38427.484.741.373.561.9
2019/202086.983.18560.476.967.673.262.4
2018/201990.869.678.836.174.448.667.344.1
2017/201885.887.886.840.952.245.97545.2
L82021/202291.830.846.19.142.114.947.634.3
2019/202069.158.563.33366.744.249.932.1
2018/201982.843.55720.786.733.442.216.2
2017/201889.371.779.621.960.232.159.527.7
2016/201770.527.839.817.856.627.144.333.1
2014/20154180.254.2---38.322.9
2013/201450.165.556.8---30.77
L72012/201357.448.252.4---25.36.3
2011/201248.862.862.8---36.77.1
Table 6. Validation of the February classification results using the M1 approach by setting the P, R, and F1 for cereal and cereal mixed with olive trees, and OA and Kappa for overall classification accuracy.
DataYearCerealCereal with Olive TreesLand Cover
PRF1PRF1OAKappa
Reference year S22020/202182.589.585.869.285.976.674.868.2
S22021/202295.655.870.540.545.242.763.751.8
2019/202084.268.575.551.95854.854.639.4
2018/201995.258.372.337.243.540.153.931.1
2017/2018953450.113.748.321.333.514.5
L82021/202295.554.469.322.449.830.96552.1
2019/202088.145.359.837.558.145.641.627.3
2018/201978.220.832.911.121.714.719.63.5
2017/201898.813.123.19.226.413.615.84.7
2016/201793.66.812.74.26.1532.921.4
2014/20154361.250.5---3417.9
2013/201491.210.553.7---22.913.1
L72012/201350.221.630.2---14.30.5
2011/201224.810.514.8---15.51.8
Table 7. Validation of cereal and cereal with olive trees February classification results using the M2 approach by setting the P, R, and F1 for cereal and cereal mixed with olive trees, and OA and Kappa for overall classification accuracy.
DataYearCerealCereal with Olive TreesLand Cover
PRF1PRF1OAKappa
Reference year S22020/202195.291.893.580.188.283.987.784
S22021/202294.278.185.442.955.848.575.263.8
2019/202085.178.181.542.961.950.760.645.8
2018/201991.664.675.830.348.437.35730.9
2017/201892.257.971.116.947.324.951.324.9
L82021/202295.454.269.123.750.432.367.955.3
2019/202084.652.264.640.772.352.149.135.2
2018/201983.52740.810.117.812.922.94.6
2017/201893.734.850.712.934.518.832.512.4
2016/20176936477.17743.630.2
2014/201542.669.452.8---43.227.8
2013/201472.638.149.9---20.910.4
L72012/20134725.833.4---14.70.6
2011/201244.123.230.4---22.13.2
Disclaimer/Publisher’s Note: The statements, opinions and data contained in all publications are solely those of the individual author(s) and contributor(s) and not of MDPI and/or the editor(s). MDPI and/or the editor(s) disclaim responsibility for any injury to people or property resulting from any ideas, methods, instructions or products referred to in the content.