
Optimizing Sericea Lespedeza Fodder Production in the Southeastern US: A Climate-Informed Geospatial Engineering Approach

 ,
, 
 , ,
, ,
Abstract
:1. Introduction
2. Materials and Methods
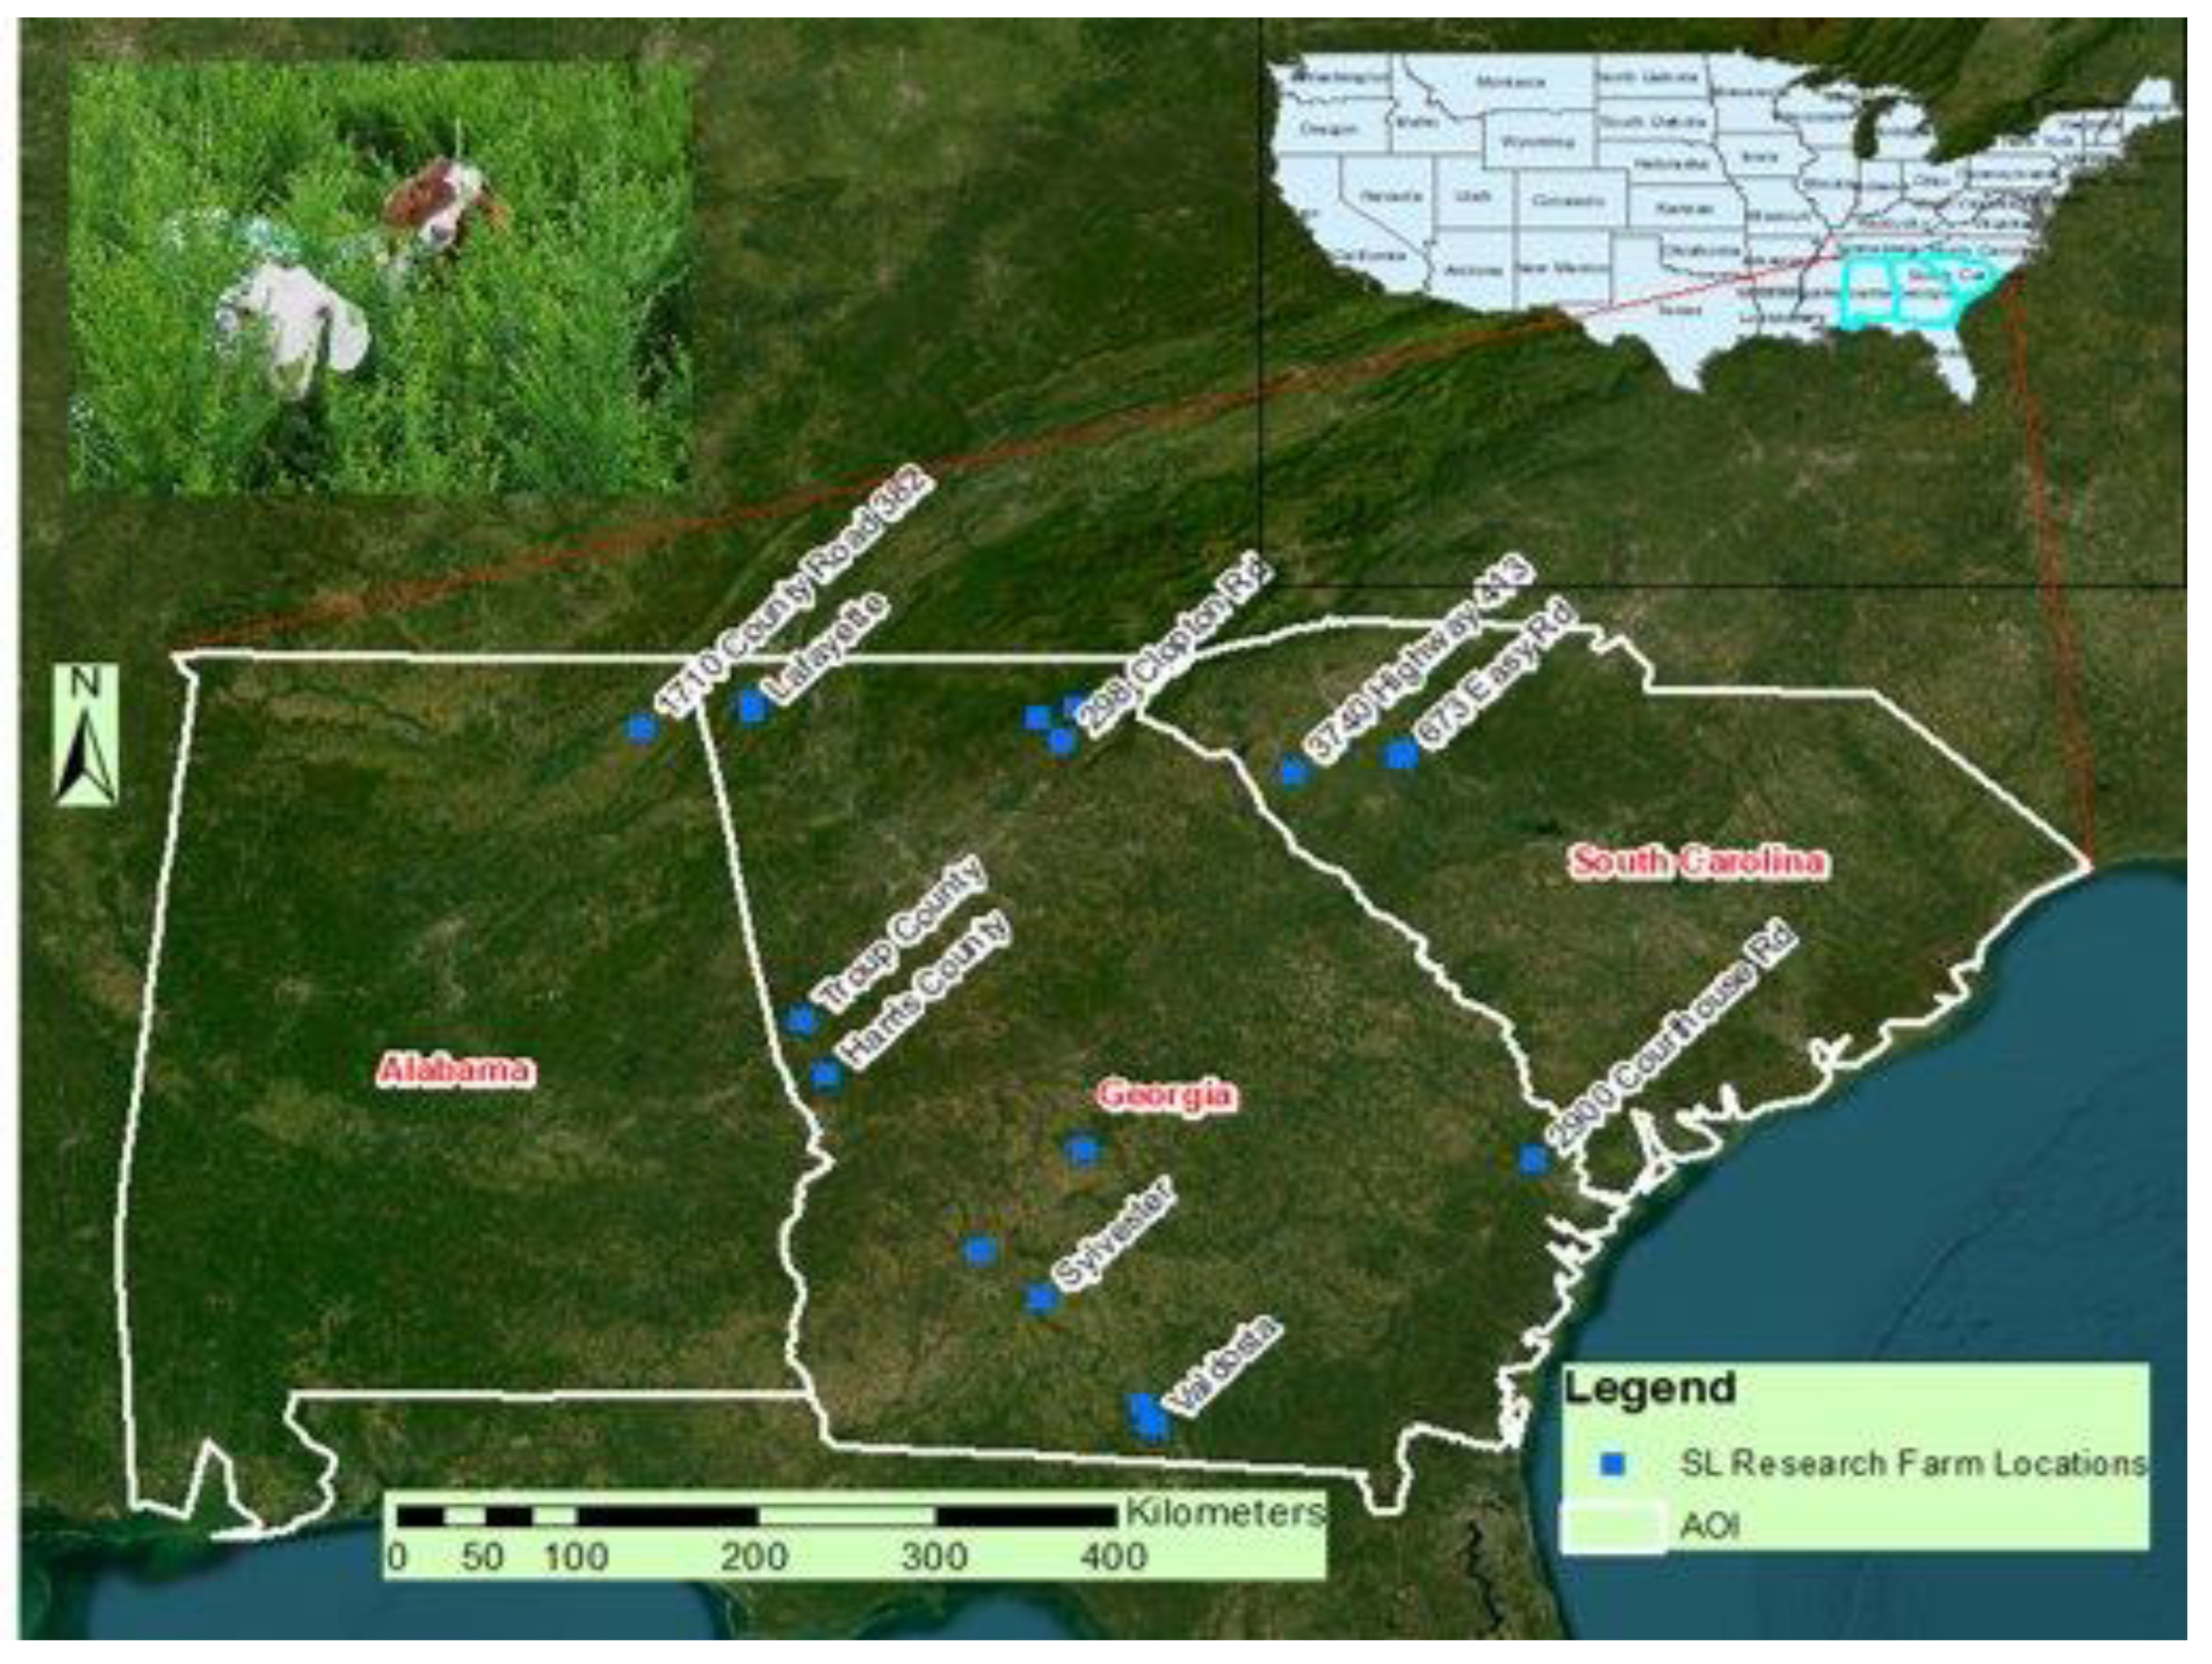
2.1. Study Area
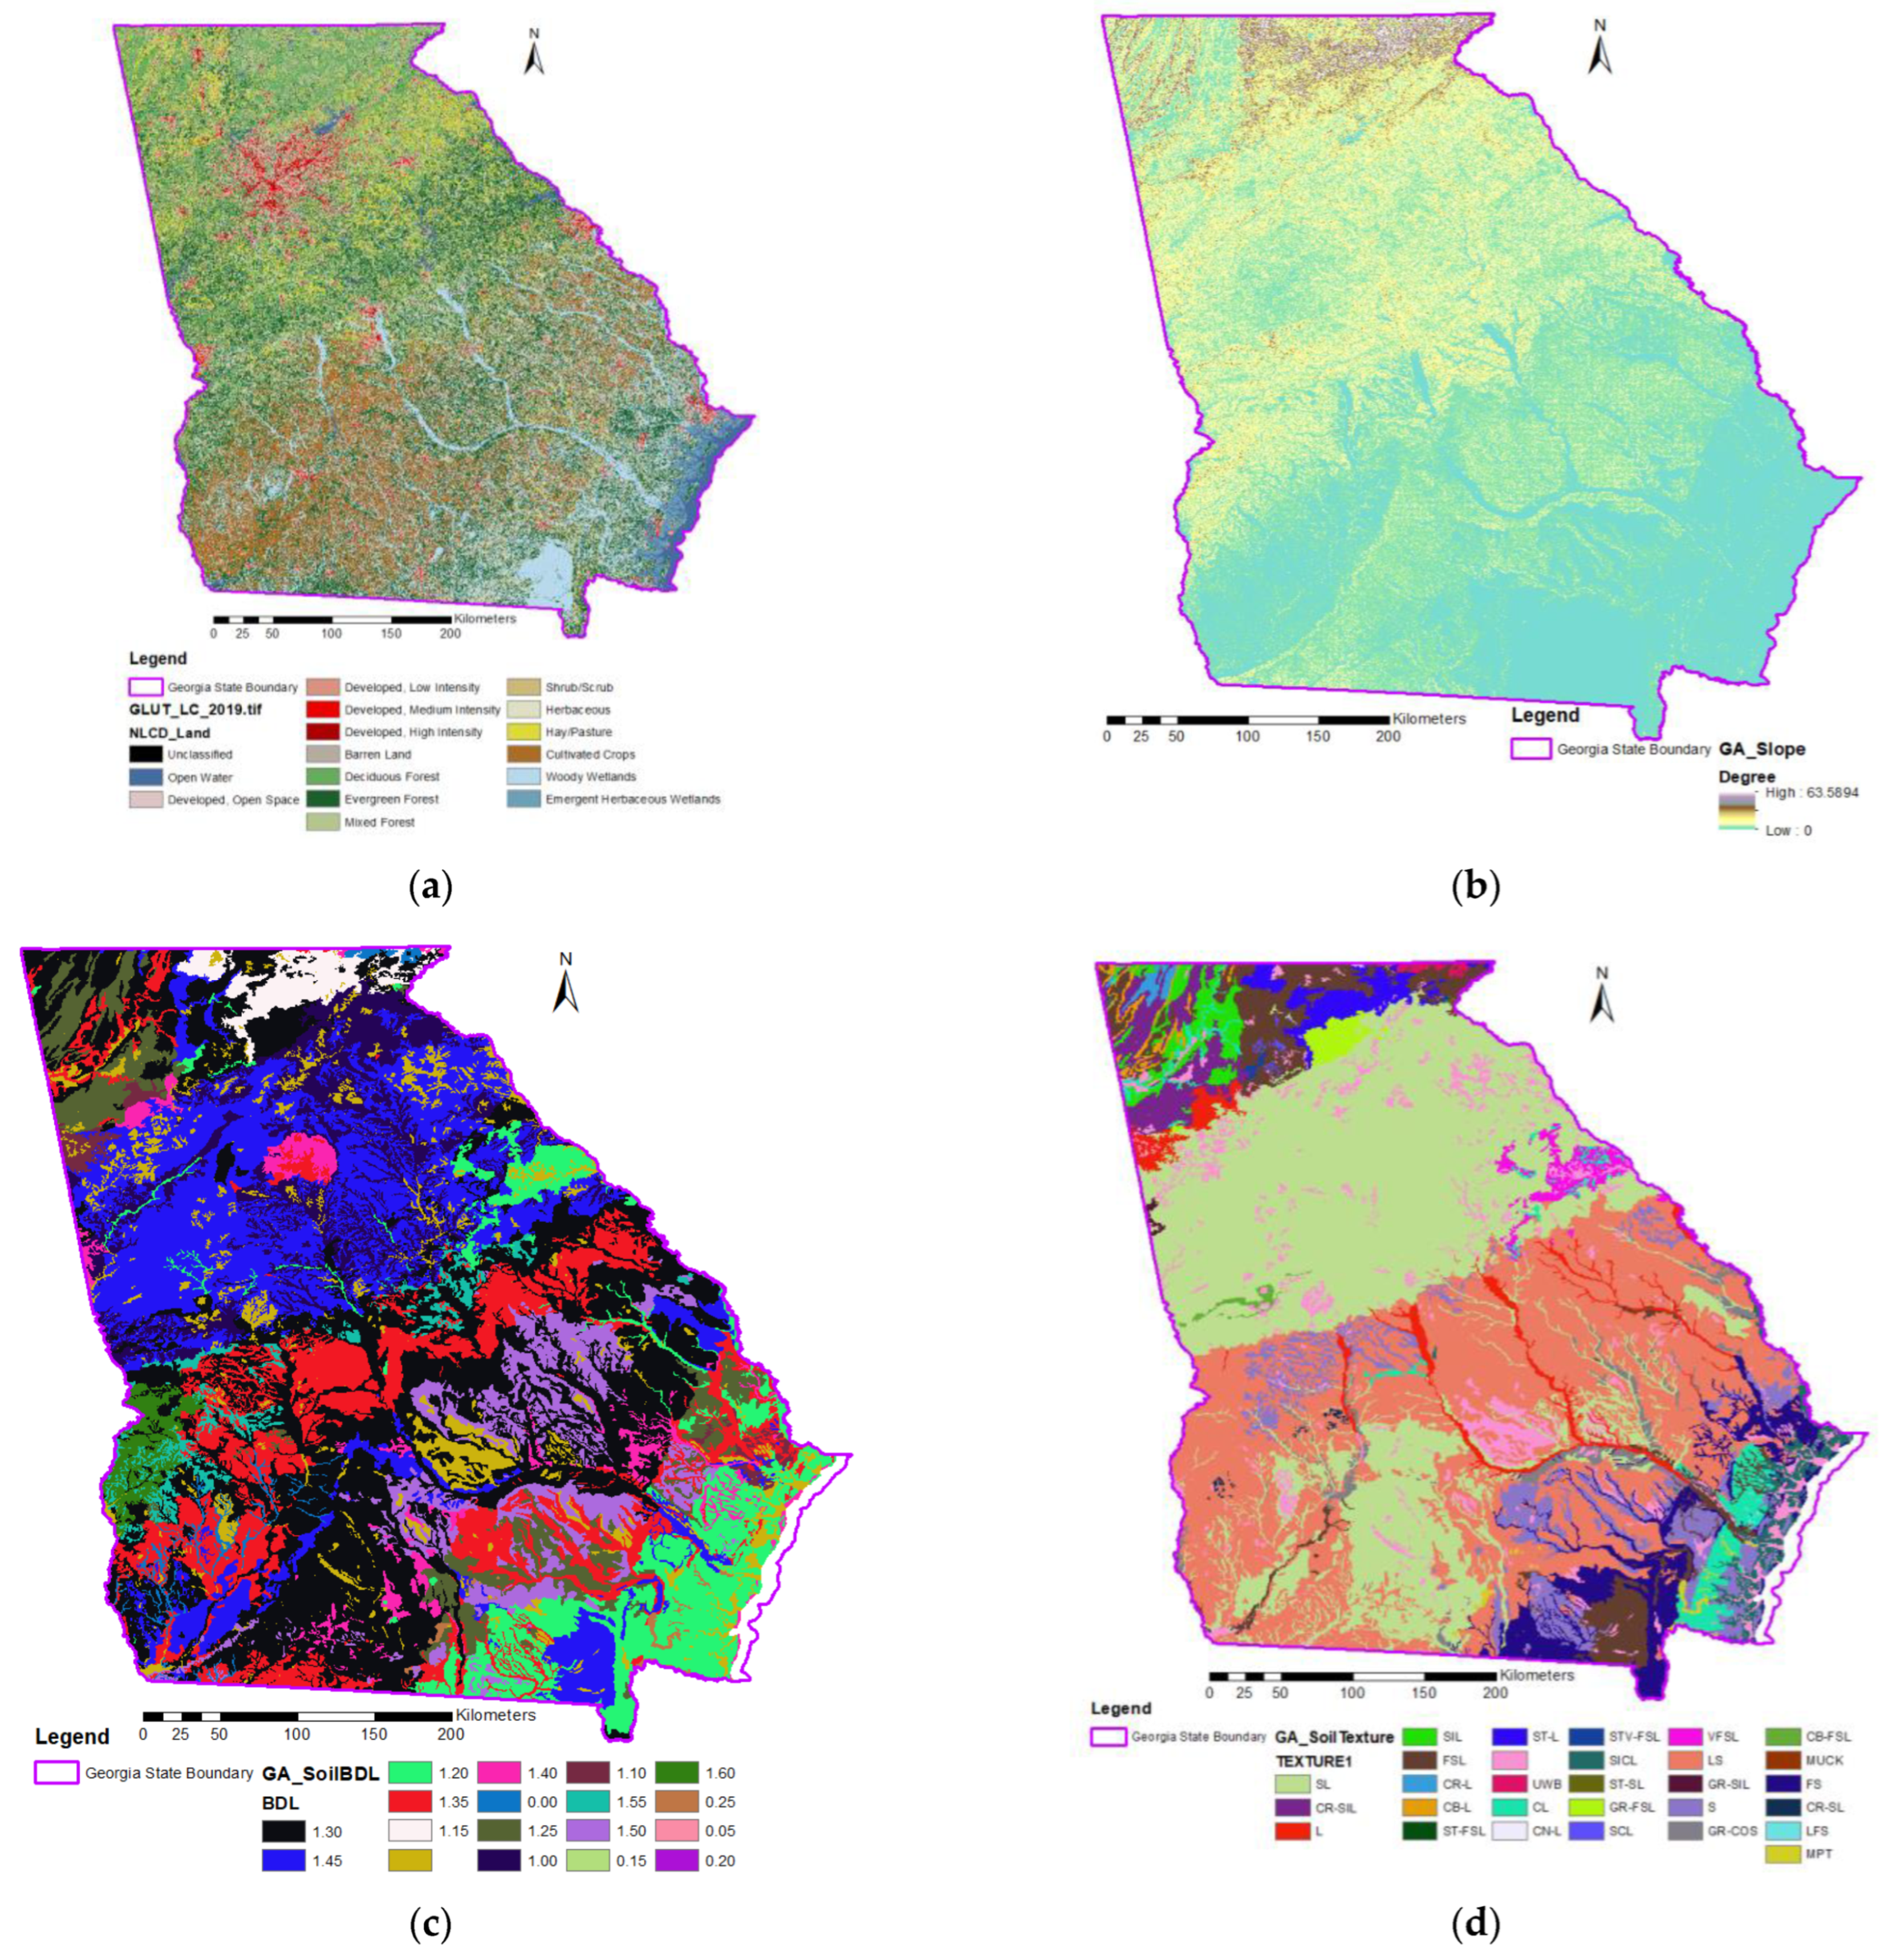
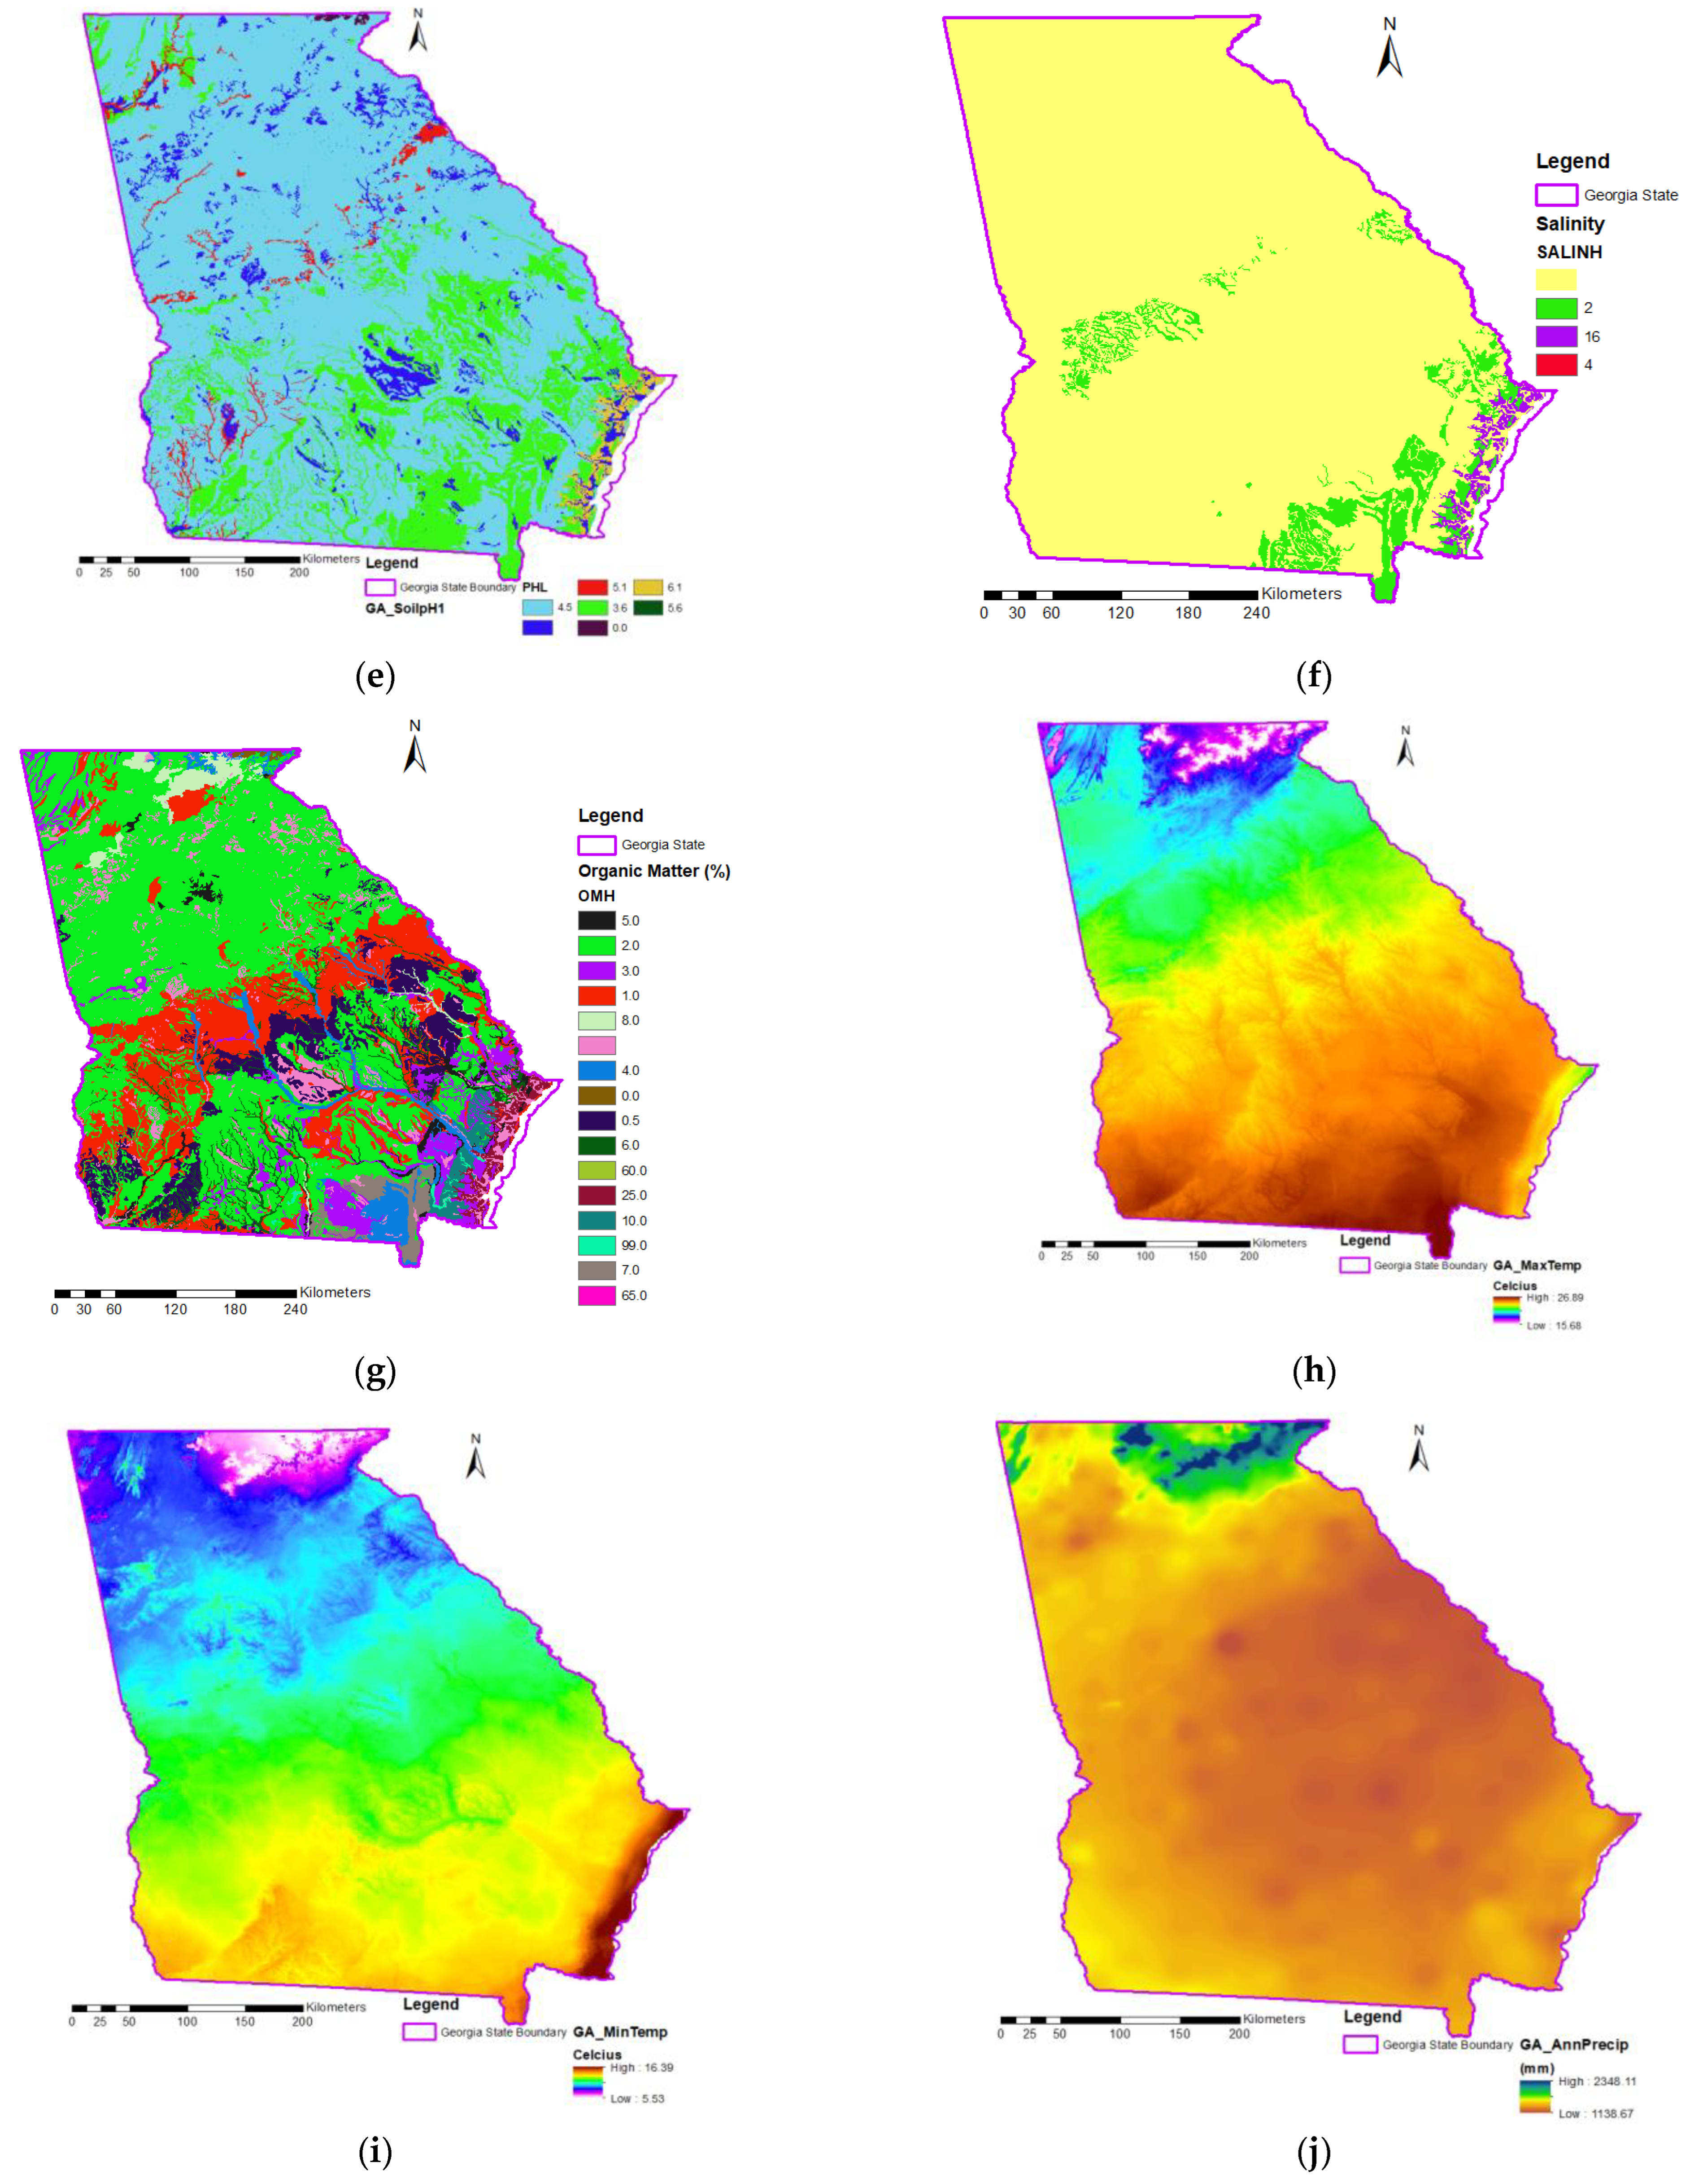
2.2. Environmental Data Collection and Processing
2.3. Precision Agriculture Model Development to Find Most Suitable Biomass Production Crop
2.4. Raster Reclassification
2.5. Spatial Overlay and Result Verification
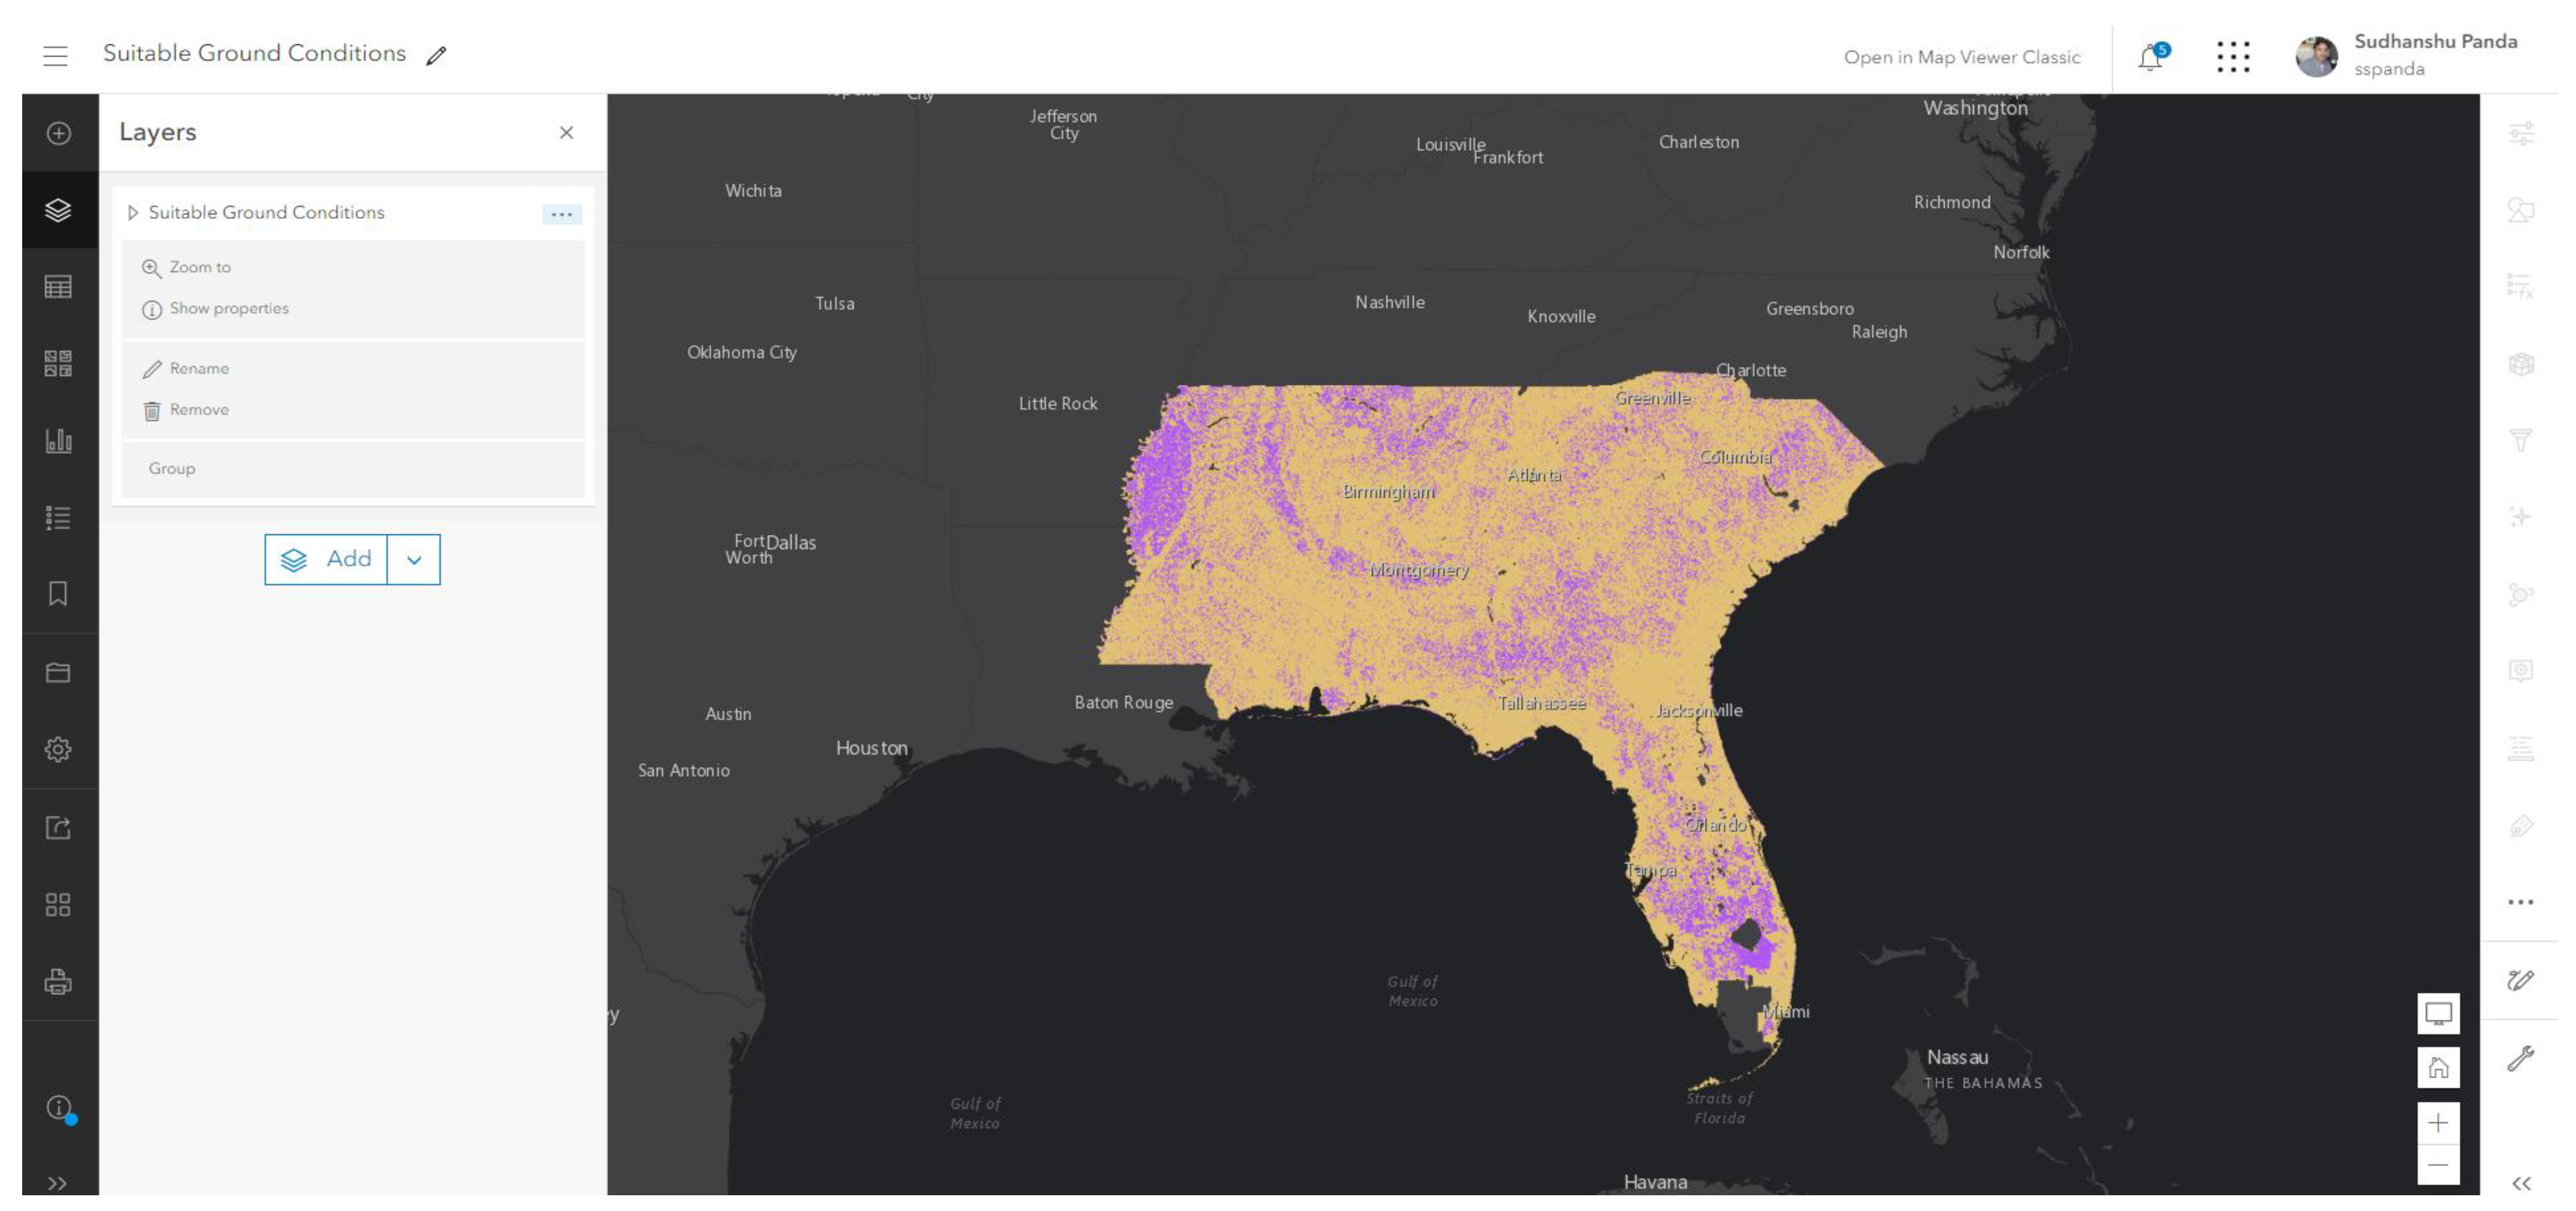
2.6. WebGIS-Based SL Production Interactive Suitability Dashboard Development
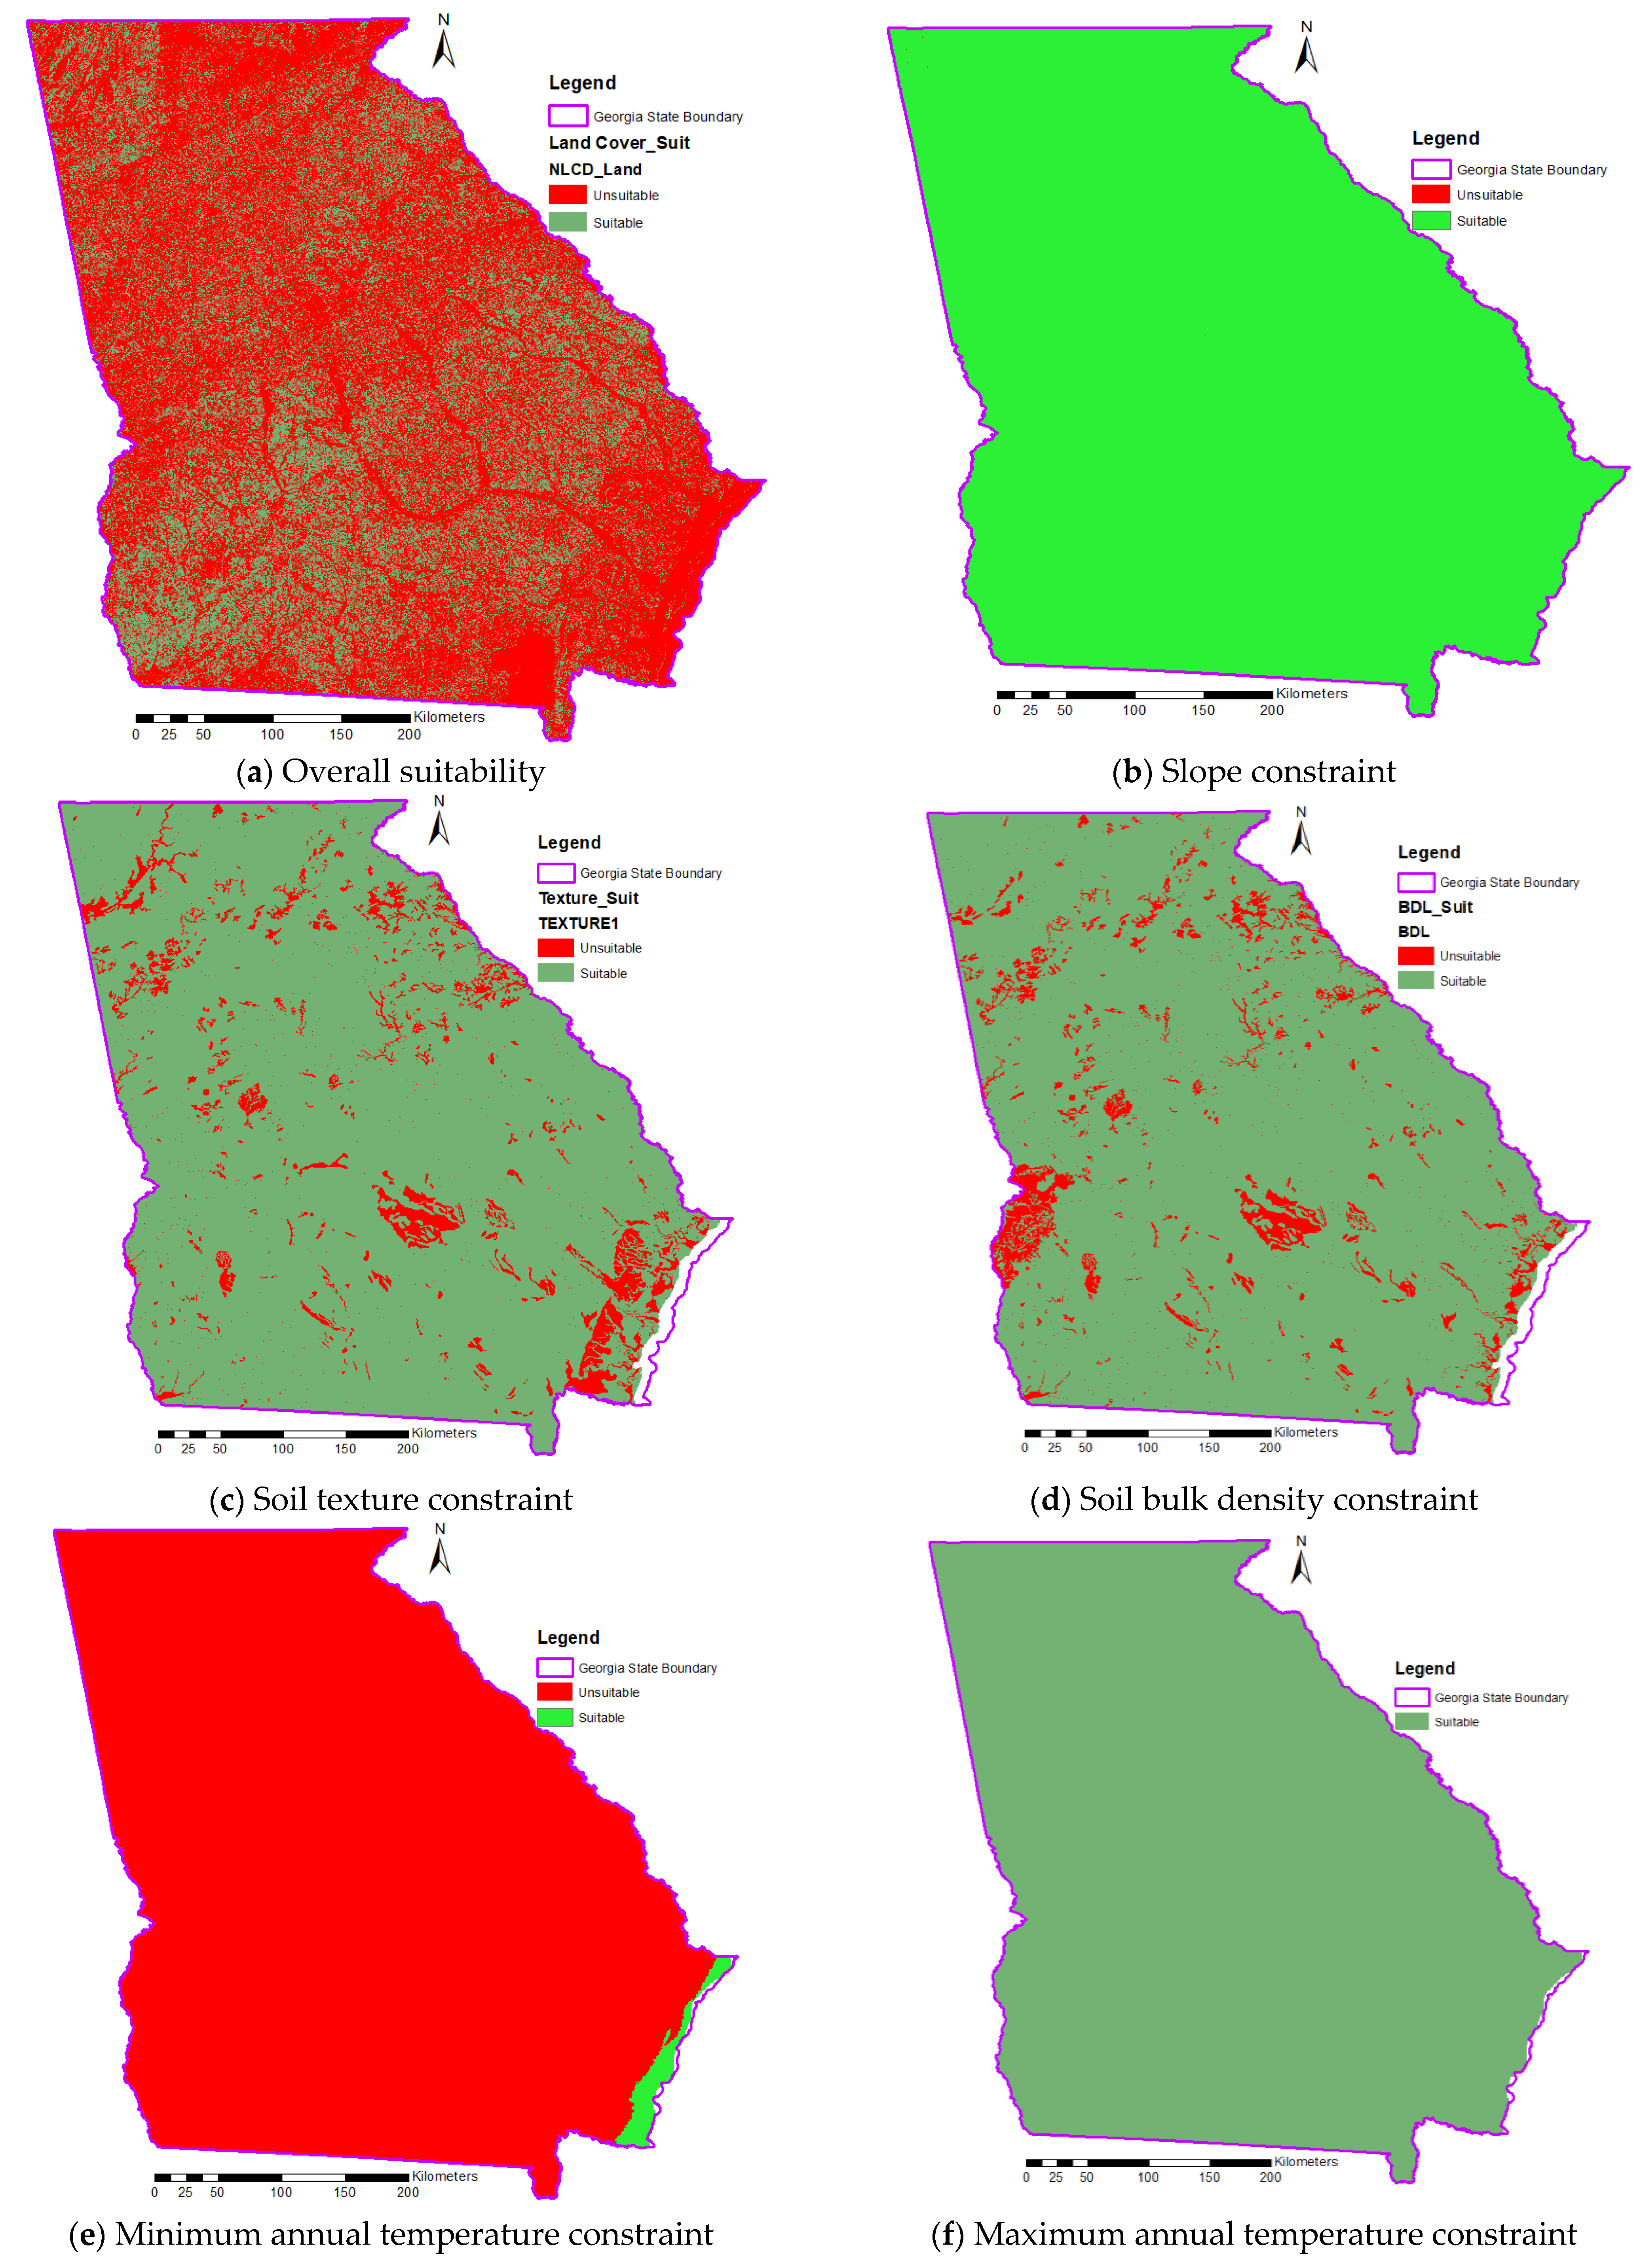
3. Results and Discussion
4. Conclusions
Author Contributions
Funding
Institutional Review Board Statement
Data Availability Statement
Conflicts of Interest
References
- Zajac, A.M. Gastrointestinal nematodes of small ruminants: Life cycle, anthelmintics, and diagnosis. Vet. Clin. Food Anim. Pract. 2006, 22, 529–541. [Google Scholar] [CrossRef] [PubMed]
- Waller, P.J. From discovery to development: Current industry perspectives for the development of novel methods of helminth control in livestock. Vet. Parasitol. 2006, 139, 1–14. [Google Scholar] [CrossRef] [PubMed]
- Lopes, L.B.; Nicolino, R.; Capanema, R.O.; Oliveira, C.S.F.; Haddad, J.P.A.; Eckstein, C. Economic impacts of parasitic diseases in cattle. CABI Rev. 2016, 2015, 1–10. [Google Scholar] [CrossRef]
- Hoveland, C.S.; Windham, W.R.; Boggs, D.L.; Durham, R.G.; Calvert, G.V.; Newsome, J.F. Sericea lespedeza production in Georgia. Res. Bull. Ga. Agric. Exp. Stn. 1990, 393, 11. Available online: https://www.cabdirect.org/cabdirect/abstract/19900738785 (accessed on 24 March 2023).
- Eddy, T.A.; Davidson, J.; Obermeyer, B. Invasion dynamics and biological control prospects for sericea lespedeza in Kansas. Great Plains Res. 2003, 13, 217–230. [Google Scholar]
- Hoste, H.; Torres-Acosta, J.F.J.; Sandoval-Castro, C.A.; Mueller-Harvey, I.; Sotiraki, S.; Louvandini, H.; Thamsborg, S.M.; Terrill, T.H. Tannin containing legumes as a model for nutraceuticals against digestive parasites in livestock. Vet. Parasitol. 2015, 212, 5–17. [Google Scholar] [CrossRef]
- Naumann, H.D.; Muir, J.P.; Lambert, B.D.; Tedeschi, L.O.; Kothmann, M.M. Condensed tannins in the ruminant environment: A perspective on biological activity. J. Agric. Sci. 2013, 1, 8–20. [Google Scholar]
- Terrill, T.H.; Miller, J.E.; Burke, J.M.; Mosjidis, J.A.; Kaplan, R.M. Experiences with integrated concepts for the control of Haemonchus contortus in sheep and goats in the United States. Vet. Parasitol. 2012, 186, 28–37. [Google Scholar] [CrossRef]
- Burke, J.M.; Miller, J.E.; Terrill, T.H.; Orlik, S.T.; Acharya, M.; Garza, J.J.; Mosjidis, J.A. Sericea lespedeza as an aid in the control of Eimeria spp. in lambs. Vet. Parasitol. 2013, 193, 39–46. [Google Scholar] [CrossRef]
- Kommuru, D.S.; Barker, T.; Desai, S.; Burke, J.M.; Ramsay, A.; Mueller-Harvey, I.; Miller, J.E.; Mosjidis, J.A.; Kamisetti, N.; Terrill, T.H. Use of pelleted sericea lespedeza (Lespedeza cuneata) for natural control of coccidia and gastrointestinal nematodes in weaned goats. Vet. Parasitol. 2014, 204, 191–198. [Google Scholar] [CrossRef]
- Messman, M.A.; Weiss, W.P.; Albrecht, K.A. In situ disappearance of individual proteins and nitrogen from legume forages containing varying amounts of tannins. J. Dairy Sci. 1996, 79, 1430–1435. [Google Scholar] [CrossRef] [PubMed]
- Wang, W.; Patra, A.K.; Puchala, R.; Ribeiro, L.; Gipson, T.A.; Goetsch, A.L. Effects of dietary inclusion of sericea lespedeza hay on feed intake, digestion, nutrient utilization, growth performance, and ruminal fermentation and methane emission of alpine doelings and katahdin ewe lambs. Animals 2022, 12, 2064. [Google Scholar] [CrossRef] [PubMed]
- Littlefield, K.A.; Muir, J.P.; Lambert, B.D.; Tomberlin, J.K. Condensed tannins inhibit house fly (Diptera: Muscidae) development in livestock manure. Environ. Entomol. 2011, 40, 1572–1576. [Google Scholar] [CrossRef] [PubMed]
- Mahachi, L.N.; Chikwanha, O.C.; Katiyatiya, C.L.; Marufu, M.C.; Aremu, A.O.; Mapiye, C. Sericea lespedeza (Lespedeza juncea var. sericea) for sustainable small ruminant production: Feed, helminth suppressant and meat preservation capabilities. Anim. Feed. Sci. Technol. 2020, 270, 114688. [Google Scholar] [CrossRef]
- Mangan, J.L. Nutritional effects of tannins in animal feeds. Nutr. Res. Rev. 1988, 1, 209–231. [Google Scholar] [CrossRef]
- Fleming, S.A.; Craig, T.; Kaplan, R.M.; Miller, J.E.; Navarre, C.; Rings, M. Anthelmintic resistance of gastrointestinal parasites in small ruminants. J. Vet. Int. Med. 2006, 20, 435–444. [Google Scholar] [CrossRef]
- Silva, S.R.; Sacarrão-Birrento, L.; Almeida, M.; Ribeiro, D.M.; Guedes, C.; González Montaña, J.R.; Pereira, A.F.; Zaralis, K.; Geraldo, A.; Tzamaloukas, O.; et al. Extensive sheep and goat production: The role of novel technologies towards sustainability and animal welfare. Animals 2022, 12, 885. [Google Scholar] [CrossRef]
- Lüscher, A.; Mueller-Harvey, I.; Soussana, J.F.; Rees, R.M.; Peyraud, J.L. Potential of legume-based grassland–livestock systems in Europe: A review. Grass Forage Sci. 2014, 69, 206–228. [Google Scholar] [CrossRef]
- Özkan, B.; Dengiz, O.; Turan, İ.D. Site suitability analysis for potential agricultural land with spatial fuzzy multi-criteria decision analysis in regional scale under semi-arid terrestrial ecosystem. Sci. Rep. 2020, 10, 22074. [Google Scholar] [CrossRef]
- Hafenrichter, A.L. New grasses and legumes for soil and water conservation. Adv. Agron. 1959, 10, 349–406. [Google Scholar]
- Panda, S.S.; Hoogenboom, G.; Paz, J.O. Remote sensing and geospatial technological applications for site-specific management of fruit and nut crops: A review. Remote Sens. 2010, 2, 1973–1997. [Google Scholar] [CrossRef]
- Panda, S.S.; Terrill, T.H.; Mahapatra, A.K.; Kelly, B.; Morgan, E.R.; van Wyk, J.A. Site-specific forage management of sericea lespedeza: Geospatial technology-based forage quality and yield enhancement model development. Agriculture 2020, 10, 419. [Google Scholar] [CrossRef]
- Panda, S.S.; Hoogenboom, G.; Paz, J. Distinguishing blueberry bushes from mixed vegetation land-use using high resolution satellite imagery and geospatial techniques. Comput. Electron. Agric. 2009, 67, 51–59. [Google Scholar] [CrossRef]
- Jenks, G.F. The data model concept in statistical mapping. Int. Yearb. Cartogr. 1967, 7, 186–190. [Google Scholar]


| SSFM DSS Model Factors | Suitability Criteria | Assigned Weights per Delphi Method |
|---|---|---|
| Land use/land cover (LULC) | Open land (any land cover) | 0.20 (20%) |
| Slope | >45-degree slope | 0.15 (15%) |
| Soil characteristics | Non-Clay Soil (Texture) <1.6 BDL (Bulk Density) | 0.15 (15%) 0.15 (15%) |
| Temperature | >15° Min. Temp. <45 °C Max. Temp. | 0.15 (15%) 0.15 (15%) |
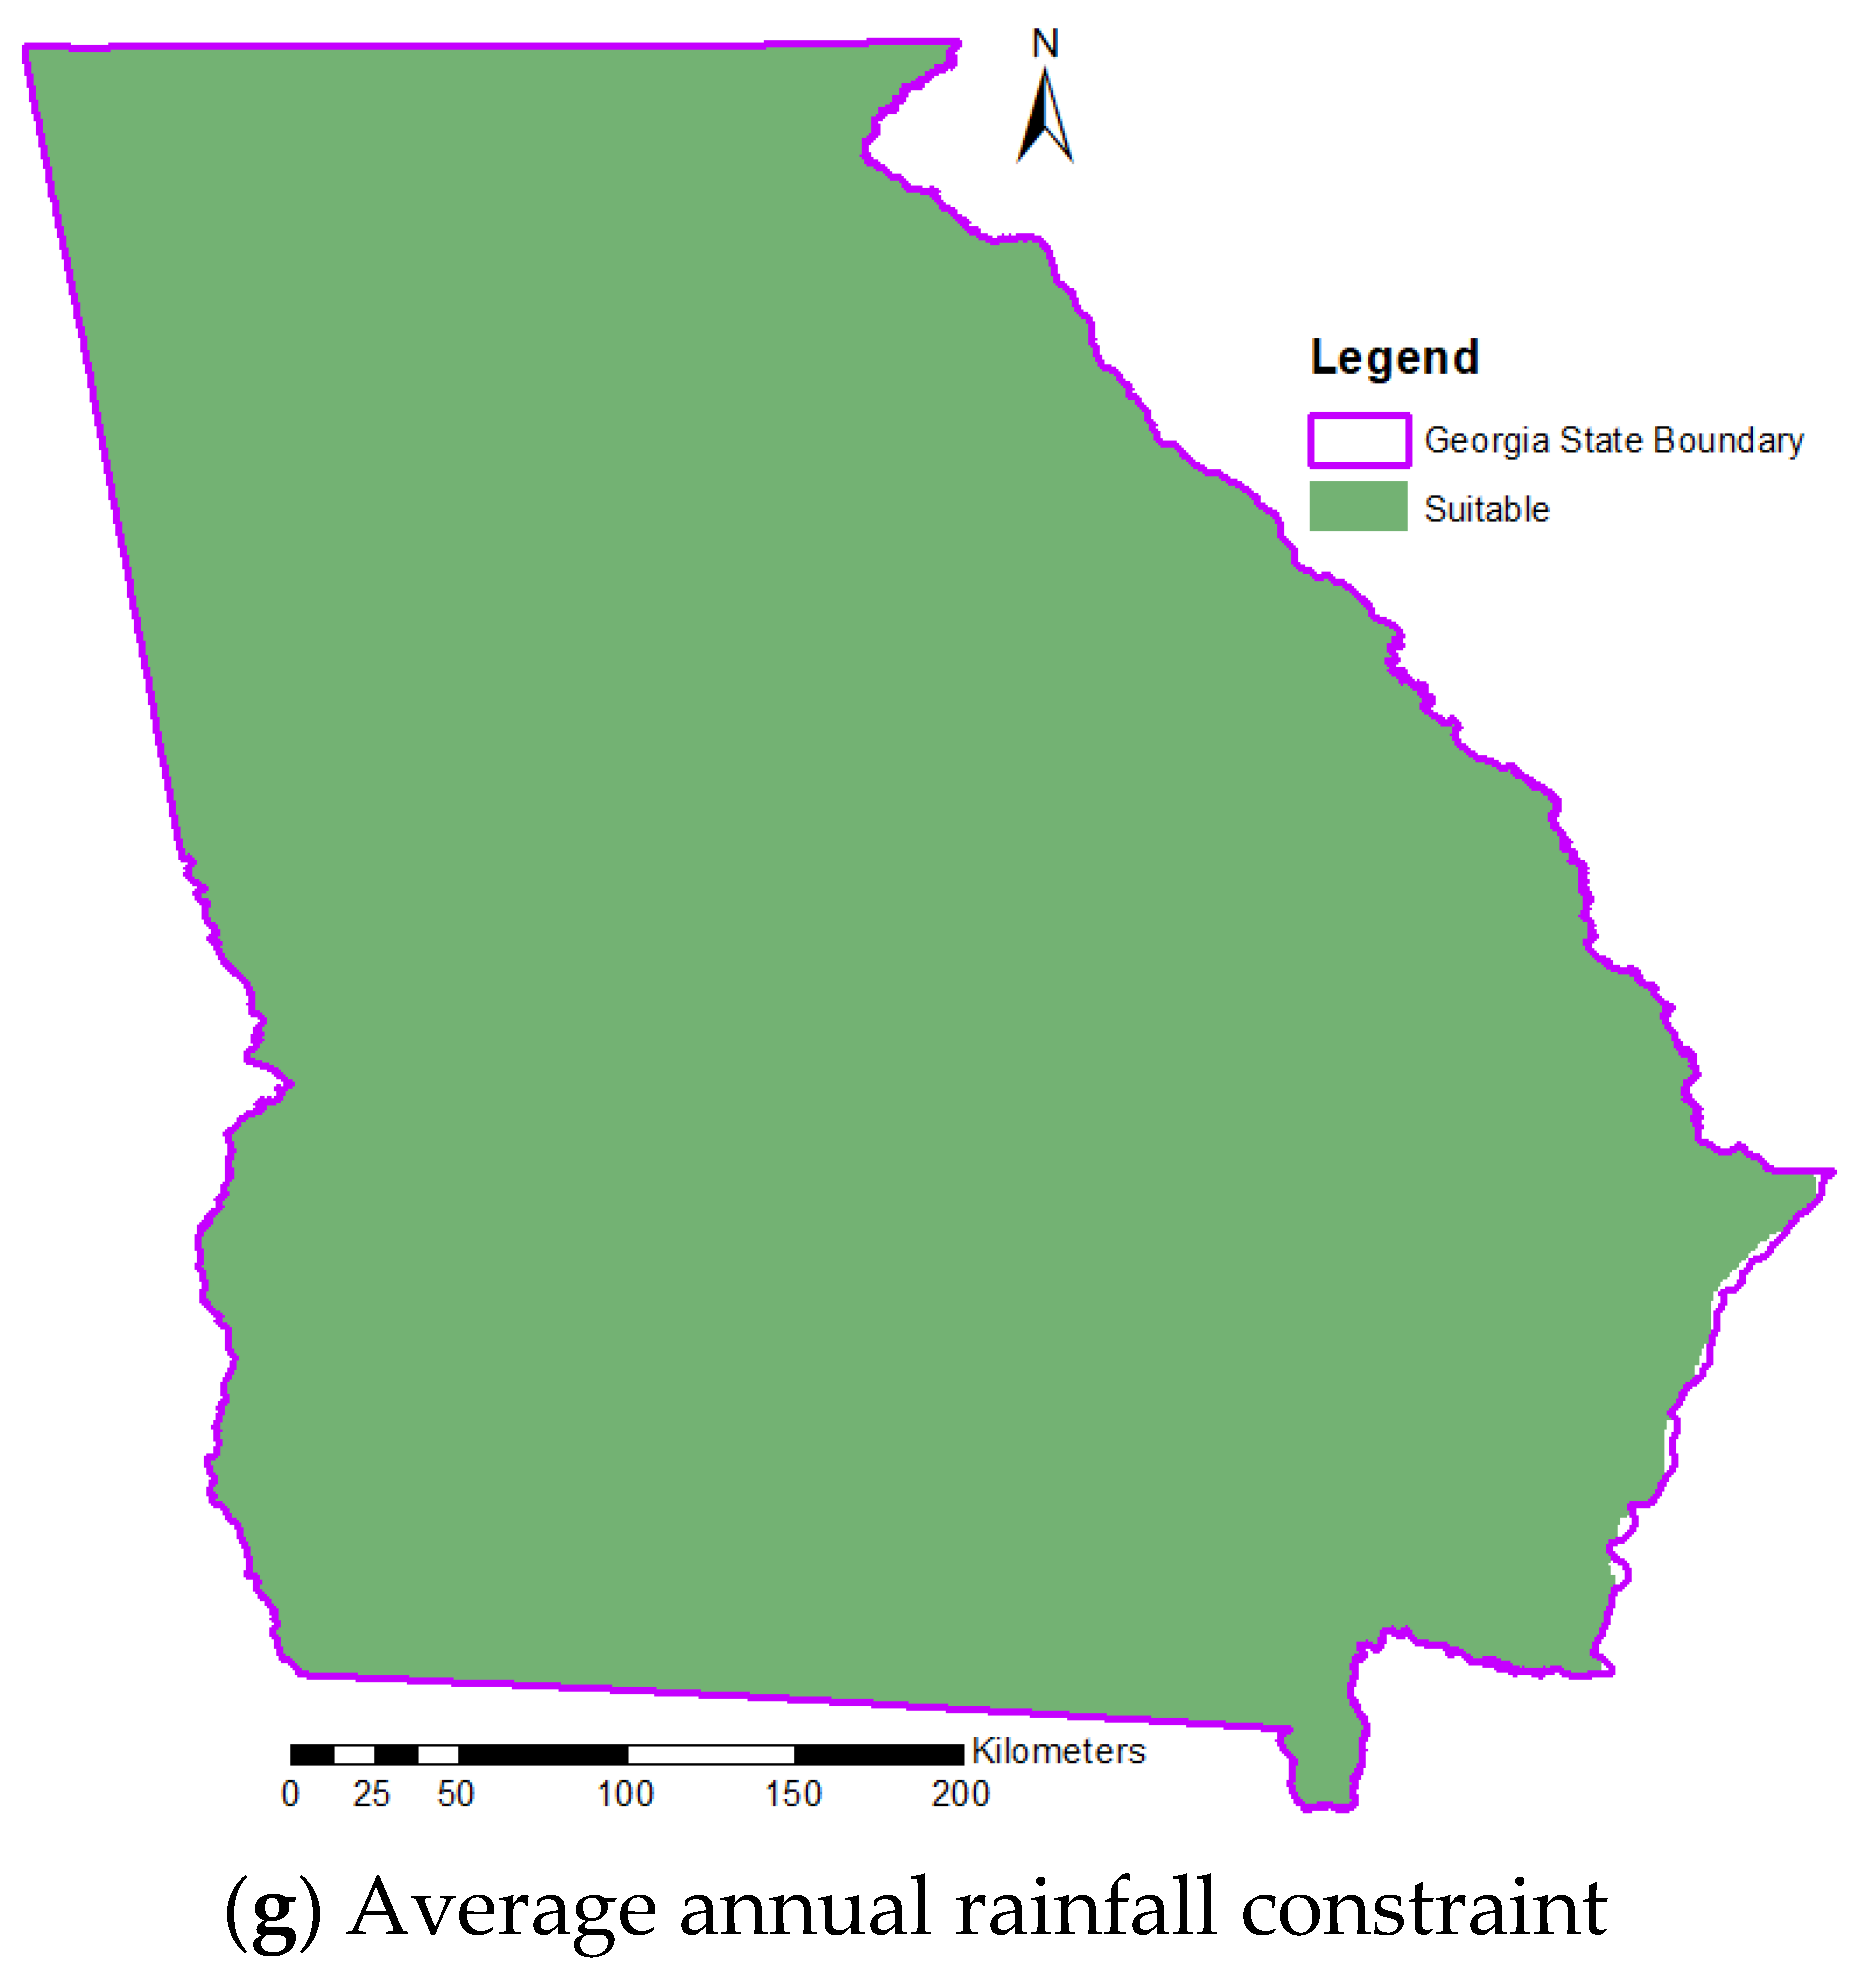
| Precipitation | 0.05 (5%) |
| Farm | NDVI Mean | NDVI Std | SAVI Mean | SAVI Std | Elevation Mean (m) | Elevation Std (m) | Avg. Precipitation (mm) | Min Temp (°C) | Max Temp (°C) | Band10 Mean (16-bit) | Band10 Std (16-bit) |
|---|---|---|---|---|---|---|---|---|---|---|---|
| AL1 | 0.29 | 0.03 | 0.53 | 0.05 | 248.20 | 2.13 | 1414.02 | 8.58 | 20.21 | 43,259.00 | 224.65 |
| GA1 | 0.23 | 0.02 | 0.41 | 0.45 | 158.11 | 2.83 | 1142.61 | 9.61 | 23.26 | 43,141.69 | 565.14 |
| GA2 | 0.37 | 0.03 | 0.67 | 0.06 | 48.20 | 1.00 | 1256.79 | 13.16 | 25.88 | 46,994.49 | 473.31 |
| GA3 | 0.30 | 0.03 | 0.54 | 0.06 | 108.72 | 2.73 | 1168.40 | 11.74 | 24.70 | 47,909.33 | 364.40 |
| GA4 | 0.33 | 0.02 | 0.59 | 0.04 | 115.71 | 0.45 | 1168.40 | 11.74 | 24.70 | 47,857.13 | 323.28 |
| GA5 | 0.31 | 0.03 | 0.56 | 0.05 | 103.96 | 4.37 | 1219.20 | 12.79 | 25.28 | 47,032.92 | 249.50 |
| GA6 | 0.48 | 0.03 | 0.86 | 0.07 | 539.48 | 2.38 | 1625.60 | 7.37 | 19.99 | 47,000.00 | 248.00 |
| GA7 | 0.29 | 0.05 | 0.53 | 0.09 | 278.94 | 4.23 | 1320.80 | 9.03 | 21.32 | 43,364.72 | 261.60 |
| GA8 | 0.29 | 0.03 | 0.53 | 0.05 | 248.20 | 2.13 | 1414.02 | 8.58 | 20.21 | 43,259.00 | 224.65 |
| GA9 | 0.29 | 0.05 | 0.53 | 0.09 | 278.94 | 4.23 | 1320.80 | 9.03 | 21.32 | 43,364.72 | 261.60 |
| SC1 | 0.38 | 0.03 | 0.69 | 0.06 | 174.73 | 7.01 | 1162.30 | 9.70 | 22.67 | 43,455.45 | 130.66 |
| SC2 | 0.25 | 0.02 | 0.45 | 0.03 | 193.82 | 2.25 | 1143.00 | 9.29 | 22.85 | 44,964.82 | 343.21 |
| SC3 | 0.29 | 0.03 | 0.53 | 0.05 | 411.52 | 0.79 | 1625.60 | 7.83 | 20.90 | 43,826.65 | 231.13 |
Disclaimer/Publisher’s Note: The statements, opinions and data contained in all publications are solely those of the individual author(s) and contributor(s) and not of MDPI and/or the editor(s). MDPI and/or the editor(s) disclaim responsibility for any injury to people or property resulting from any ideas, methods, instructions or products referred to in the content. |
© 2023 by the authors. Licensee MDPI, Basel, Switzerland. This article is an open access article distributed under the terms and conditions of the Creative Commons Attribution (CC BY) license (https://creativecommons.org/licenses/by/4.0/).
Share and Cite
Panda, S.S.; Terrill, T.H.; Mahapatra, A.K.; Morgan, E.R.; Siddique, A.; Pech-Cervantes, A.A.; van Wyk, J.A. Optimizing Sericea Lespedeza Fodder Production in the Southeastern US: A Climate-Informed Geospatial Engineering Approach. Agriculture 2023, 13, 1661. https://doi.org/10.3390/agriculture13091661
Panda SS, Terrill TH, Mahapatra AK, Morgan ER, Siddique A, Pech-Cervantes AA, van Wyk JA. Optimizing Sericea Lespedeza Fodder Production in the Southeastern US: A Climate-Informed Geospatial Engineering Approach. Agriculture. 2023; 13(9):1661. https://doi.org/10.3390/agriculture13091661
Chicago/Turabian StylePanda, Sudhanshu S., Thomas H. Terrill, Ajit K. Mahapatra, Eric R. Morgan, Aftab Siddique, Andres A. Pech-Cervantes, and Jan A. van Wyk. 2023. "Optimizing Sericea Lespedeza Fodder Production in the Southeastern US: A Climate-Informed Geospatial Engineering Approach" Agriculture 13, no. 9: 1661. https://doi.org/10.3390/agriculture13091661
APA StylePanda, S. S., Terrill, T. H., Mahapatra, A. K., Morgan, E. R., Siddique, A., Pech-Cervantes, A. A., & van Wyk, J. A. (2023). Optimizing Sericea Lespedeza Fodder Production in the Southeastern US: A Climate-Informed Geospatial Engineering Approach. Agriculture, 13(9), 1661. https://doi.org/10.3390/agriculture13091661