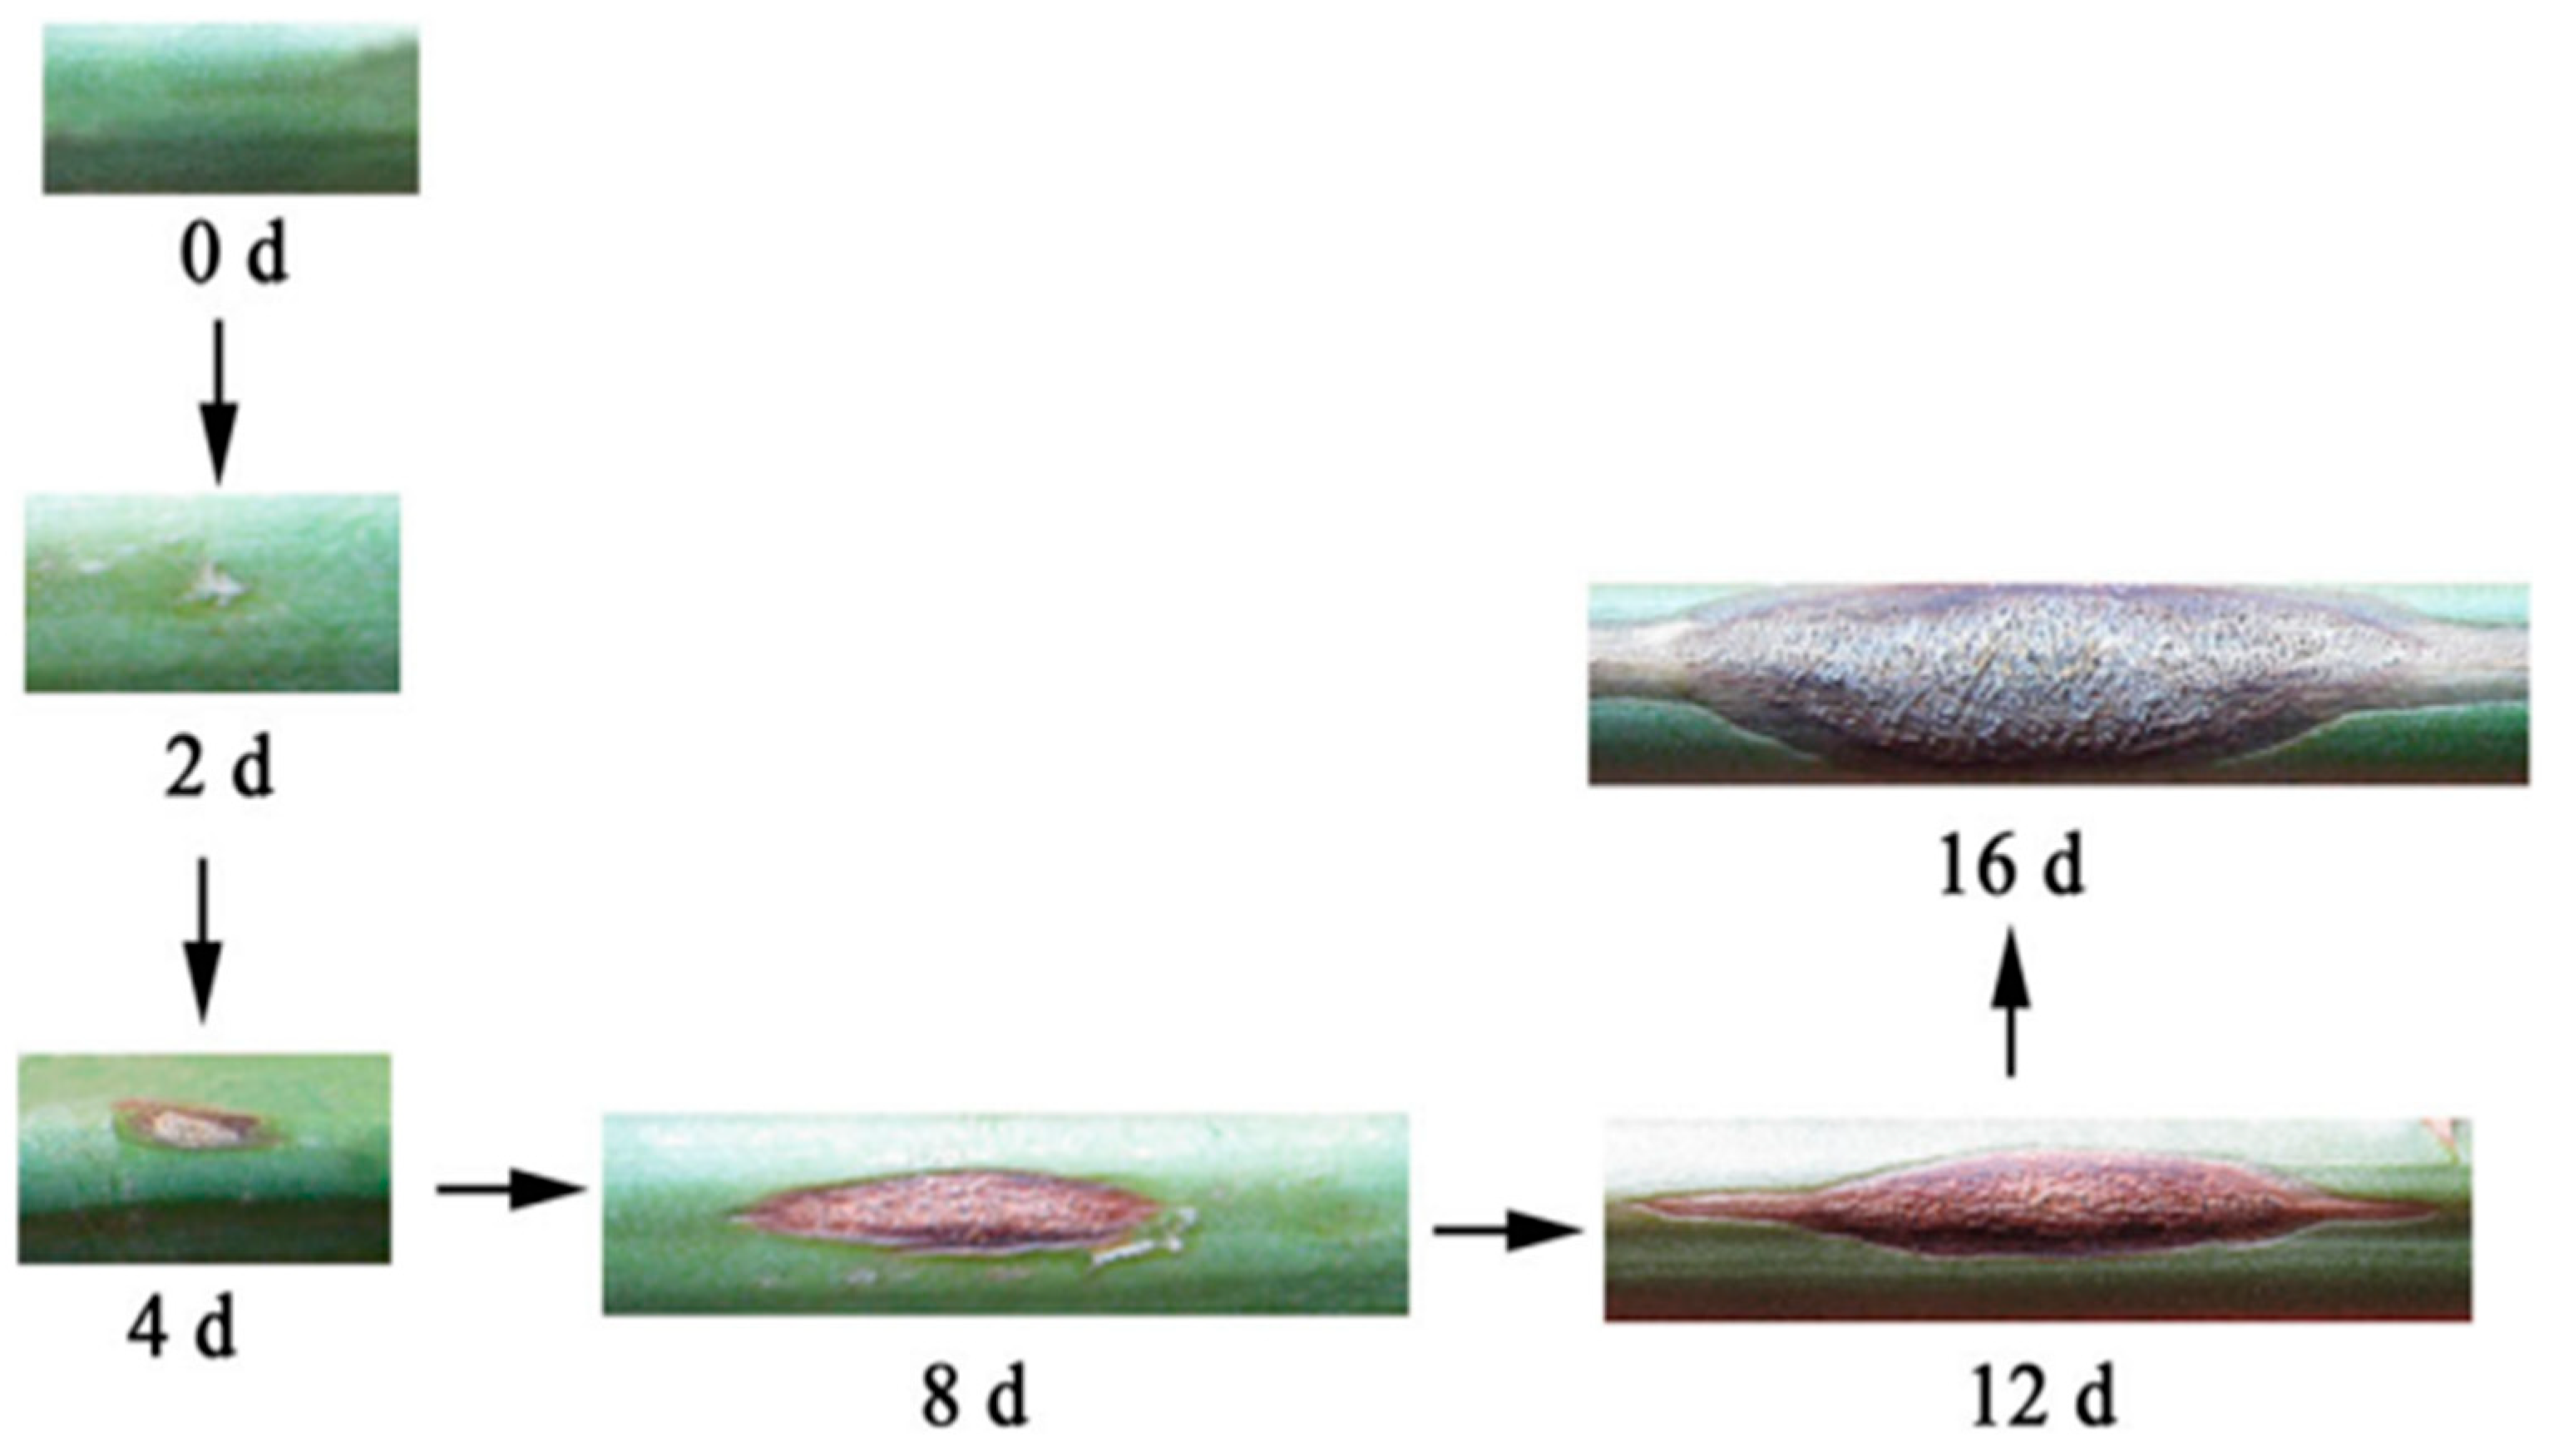
Figure 1.
Symptoms during the infection of asparagus stem blight [
14].
Figure 1.
Symptoms during the infection of asparagus stem blight [
14].
Figure 2.
The structural schematic diagram of hyperspectral imaging system: 1. Sample, 2. Left light source, 3. Camera dark box, 4. Hyperspectral camera, 5. Optical bracket, 6. Right light source, 7. Computer.
Figure 2.
The structural schematic diagram of hyperspectral imaging system: 1. Sample, 2. Left light source, 3. Camera dark box, 4. Hyperspectral camera, 5. Optical bracket, 6. Right light source, 7. Computer.
Figure 3.
Asparagus mother stem plants. (a): the canopy of a healthy plant of grade 1, (b): the stem of the healthy plant showed in (a), (c): the canopy of a mildly diseased plant in grade 2, (d): the stem of the mildly diseased plant showed in (c), (e): the canopy of a moderately and severely diseased plant in grade 3, (f): the stem of the moderately and severely diseased plant showed in (e).
Figure 4.
True-color images of hyperspectral images of asparagus mother stem canopies of three disease grades.
Figure 4.
True-color images of hyperspectral images of asparagus mother stem canopies of three disease grades.
Figure 5.
ELM network topology.
Figure 5.
ELM network topology.
Figure 6.
Reflectance spectral curves of canopies of each disease grade. Different colored lines in (a) denote different reflectance spectral curves of canopies of disease grade 1, different colored lines in (b) denote different reflectance spectral curves of canopies of disease grade 2, and different colored lines in (c) denote different reflectance spectral curves of canopies of disease grade 3.
Figure 7.
Variation coefficient curve of reflectance spectral data of asparagus mother stem canopies, the green line stands for the green peak location, and the red line means the red peak location.
Figure 7.
Variation coefficient curve of reflectance spectral data of asparagus mother stem canopies, the green line stands for the green peak location, and the red line means the red peak location.
Figure 8.
Average reflectance spectral curves of each disease grade.
Figure 8.
Average reflectance spectral curves of each disease grade.
Figure 9.
Reflectance spectra after SG and FD pretreatment. Different colored lines in (a) denote pretreated reflectance spectral curves of canopies of disease grade 1, different colored lines in (b) denote pretreated reflectance spectral curves of canopies of disease grade 2, and different colored lines in (c) denote pretreated reflectance spectral curves of canopies of disease grade 3.
Figure 10.
Two-dimensional distribution of PC1 and PC2.
Figure 10.
Two-dimensional distribution of PC1 and PC2.
Figure 11.
Influence of K value on the performance of FD−MSC−KNN model.
Figure 11.
Influence of K value on the performance of FD−MSC−KNN model.
Figure 12.
The confusion matrix of disease grade discrimination results of FD−MSC−KNN for the test set. G1, G2, and G3 mean the disease grade 1, disease grade 2, and disease grade 3, respectively.
Figure 12.
The confusion matrix of disease grade discrimination results of FD−MSC−KNN for the test set. G1, G2, and G3 mean the disease grade 1, disease grade 2, and disease grade 3, respectively.
Figure 13.
The confusion matrix of disease grade discrimination results of FD−MSC−DT for the test set.
Figure 13.
The confusion matrix of disease grade discrimination results of FD−MSC−DT for the test set.
Figure 14.
Effect of the number of neurons in the hidden layer on the performance of FD−MSC−BPNN model.
Figure 14.
Effect of the number of neurons in the hidden layer on the performance of FD−MSC−BPNN model.
Figure 15.
The confusion matrix of disease grade discrimination results of FD−MSC−BPNN for the test set.
Figure 15.
The confusion matrix of disease grade discrimination results of FD−MSC−BPNN for the test set.
Figure 16.
Effect of the number of neurons in the hidden layer on the performance of FD−MSC−ELM model.
Figure 16.
Effect of the number of neurons in the hidden layer on the performance of FD−MSC−ELM model.
Figure 17.
The confusion matrix of disease grade discrimination results of FD−MSC−ELM for the test set.
Figure 17.
The confusion matrix of disease grade discrimination results of FD−MSC−ELM for the test set.
Figure 18.
Spectral curves extracted from a hyperspectral image.
Figure 18.
Spectral curves extracted from a hyperspectral image.
Table 1.
Statistics of the numbers of spectral data in training set and test set.
Table 1.
Statistics of the numbers of spectral data in training set and test set.
| Disease Grade | Training Set | Test Set |
|---|
| Grade 1 | 165 | 55 |
| Grade 2 | 150 | 50 |
| Grade 3 | 188 | 62 |
| Total | 503 | 167 |
Table 2.
Results of disease grade discrimination models established by KNN based on one preprocessing method.
Table 2.
Results of disease grade discrimination models established by KNN based on one preprocessing method.
| PREM | NPC | CVE | PREC | REC | F1S | ACC |
|---|
| OD | 2 | 0.239 | 0.816 | 0.807 | 0.807 | 0.814 |
| DETR | 2 | 0.131 | 0.862 | 0.861 | 0.860 | 0.862 |
| FD | 13 | 0.004 | 1.000 | 1.000 | 1.000 | 1.000 |
| MSC | 2 | 0.235 | 0.814 | 0.811 | 0.809 | 0.814 |
| SG | 2 | 0.276 | 0.705 | 0.700 | 0.697 | 0.713 |
| SNV | 2 | 0.233 | 0.837 | 0.835 | 0.830 | 0.832 |
Table 3.
Results of disease grade discrimination of models established by KNN based on two combined preprocessing methods.
Table 3.
Results of disease grade discrimination of models established by KNN based on two combined preprocessing methods.
| PREM | NPC | CVE | PREC | REC | F1S | ACC |
|---|
| SG + DETR | 2 | 0.219 | 0.771 | 0.771 | 0.770 | 0.772 |
| SG + FD | 11 | 0.028 | 0.994 | 0.995 | 0.994 | 0.994 |
| SG + MSC | 2 | 0.215 | 0.831 | 0.832 | 0.830 | 0.832 |
| SG + SNV | 2 | 0.243 | 0.780 | 0.774 | 0.773 | 0.778 |
| DETR + FD | 7 | 0.044 | 0.981 | 0.984 | 0.982 | 0.982 |
| MSC + FD | 12 | 0.004 | 1.000 | 1.000 | 1.000 | 1.000 |
| SNV + FD | 15 | 0.004 | 0.993 | 0.995 | 0.994 | 0.994 |
| MSC + DETR | 3 | 0.161 | 0.855 | 0.854 | 0.850 | 0.850 |
| SNV + DETR | 3 | 0.161 | 0.871 | 0.871 | 0.868 | 0.868 |
| MSC + SNV | 2 | 0.233 | 0.837 | 0.835 | 0.830 | 0.832 |
Table 4.
Results of disease grade discrimination of models established by KNN based on three combined preprocessing methods.
Table 4.
Results of disease grade discrimination of models established by KNN based on three combined preprocessing methods.
| PREM | NPC | CVE | PREC | REC | F1S | ACC |
|---|
| SG + DETR + FD | 7 | 0.062 | 0.969 | 0.971 | 0.969 | 0.970 |
| SG + MSC + FD | 10 | 0.038 | 0.988 | 0.988 | 0.988 | 0.988 |
| SG + SNV + FD | 13 | 0.022 | 0.994 | 0.993 | 0.994 | 0.994 |
| SG + MSC + DETR | 3 | 0.163 | 0.883 | 0.871 | 0.872 | 0.874 |
| SG + SNV + DETR | 3 | 0.175 | 0.848 | 0.837 | 0.838 | 0.838 |
| SG + MSC + SNV | 2 | 0.243 | 0.780 | 0.774 | 0.773 | 0.778 |
| DETR + MSC + FD | 11 | 0.014 | 1.000 | 1.000 | 1.000 | 1.000 |
| DETR + SNV + FD | 12 | 0.012 | 0.987 | 0.989 | 0.988 | 0.988 |
| MSC + SNV + FD | 15 | 0.006 | 0.993 | 0.995 | 0.994 | 0.994 |
| DETR + MSC + SNV | 3 | 0.161 | 0.871 | 0.871 | 0.868 | 0.868 |
Table 5.
Results of disease grade discrimination of models established by DT based on one preprocessing method.
Table 5.
Results of disease grade discrimination of models established by DT based on one preprocessing method.
| PREM | NPC | CVE | PREC | REC | F1S | ACC |
|---|
| OD | 2 | 0.256 | 0.767 | 0.757 | 0.758 | 0.760 |
| DETR | 2 | 0.157 | 0.778 | 0.777 | 0.777 | 0.778 |
| FD | 13 | 0.082 | 0.900 | 0.893 | 0.895 | 0.898 |
| MSC | 2 | 0.268 | 0.790 | 0.787 | 0.787 | 0.796 |
| SG | 2 | 0.298 | 0.697 | 0.699 | 0.697 | 0.713 |
| SNV | 2 | 0.237 | 0.776 | 0.774 | 0.775 | 0.778 |
Table 6.
Results of disease grade discrimination of models established by DT based on two combined preprocessing methods.
Table 6.
Results of disease grade discrimination of models established by DT based on two combined preprocessing methods.
| PREM | NPC | CVE | PREC | REC | F1S | ACC |
|---|
| SG + DETR | 2 | 0.252 | 0.731 | 0.729 | 0.729 | 0.737 |
| SG + FD | 11 | 0.117 | 0.909 | 0.908 | 0.908 | 0.910 |
| SG + MSC | 2 | 0.247 | 0.815 | 0.813 | 0.812 | 0.814 |
| SG + SNV | 2 | 0.264 | 0.758 | 0.757 | 0.757 | 0.760 |
| DETR + FD | 7 | 0.117 | 0.951 | 0.952 | 0.951 | 0.952 |
| MSC + FD | 12 | 0.087 | 0.961 | 0.958 | 0.959 | 0.958 |
| SNV + FD | 15 | 0.042 | 0.951 | 0.952 | 0.951 | 0.952 |
| MSC + DETR | 3 | 0.183 | 0.830 | 0.823 | 0.825 | 0.826 |
| SNV + DETR | 3 | 0.225 | 0.801 | 0.799 | 0.799 | 0.802 |
| MSC + SNV | 2 | 0.237 | 0.776 | 0.774 | 0.775 | 0.778 |
Table 7.
Results of disease grade discrimination of models established by DT based on three combined preprocessing methods.
Table 7.
Results of disease grade discrimination of models established by DT based on three combined preprocessing methods.
| PREM | NPC | CVE | PREC | REC | F1S | ACC |
|---|
| SG + DETR + FD | 7 | 0.113 | 0.923 | 0.922 | 0.922 | 0.922 |
| SG + MSC + FD | 10 | 0.099 | 0.946 | 0.946 | 0.946 | 0.946 |
| SG + SNV + FD | 13 | 0.105 | 0.905 | 0.895 | 0.897 | 0.898 |
| SG + MSC + DETR | 3 | 0.197 | 0.824 | 0.812 | 0.812 | 0.814 |
| SG + SNV + DETR | 3 | 0.207 | 0.831 | 0.824 | 0.825 | 0.826 |
| SG + MSC + SNV | 2 | 0.264 | 0.758 | 0.757 | 0.757 | 0.760 |
| DETR + MSC + FD | 11 | 0.097 | 0.939 | 0.941 | 0.939 | 0.940 |
| DETR + SNV + FD | 12 | 0.091 | 0.939 | 0.939 | 0.939 | 0.940 |
| MSC + SNV + FD | 15 | 0.066 | 0.951 | 0.952 | 0.951 | 0.952 |
| DETR + MSC + SNV | 3 | 0.225 | 0.801 | 0.799 | 0.799 | 0.802 |
Table 8.
Results of disease grade discrimination of models established by BPNN based on one preprocessing method.
Table 8.
Results of disease grade discrimination of models established by BPNN based on one preprocessing method.
| PREM | NPC | MSE | PREC | REC | F1S | ACC |
|---|
| OD | 2 | 0.239 | 0.696 | 0.662 | 0.669 | 0.665 |
| DETR | 2 | 0.260 | 0.729 | 0.700 | 0.704 | 0.701 |
| FD | 13 | 0.124 | 0.949 | 0.946 | 0.944 | 0.946 |
| MSC | 2 | 0.233 | 0.812 | 0.781 | 0.780 | 0.778 |
| SG | 2 | 0.350 | 0.751 | 0.710 | 0.712 | 0.707 |
| SNV | 2 | 0.254 | 0.803 | 0.754 | 0.752 | 0.749 |
Table 9.
Results of disease grade discrimination of models established by BPNN based on two combined preprocessing methods.
Table 9.
Results of disease grade discrimination of models established by BPNN based on two combined preprocessing methods.
| PREM | NPC | MSE | PREC | REC | F1S | ACC |
|---|
| SG + DETR | 2 | 0.350 | 0.795 | 0.782 | 0.780 | 0.778 |
| SG + FD | 11 | 0.088 | 0.954 | 0.955 | 0.952 | 0.952 |
| SG + MSC | 2 | 0.148 | 0.787 | 0.748 | 0.746 | 0.743 |
| SG + SNV | 2 | 0.227 | 0.830 | 0.781 | 0.777 | 0.772 |
| DETR + FD | 7 | 0.136 | 0.912 | 0.909 | 0.905 | 0.904 |
| MSC + FD | 12 | 0.117 | 0.954 | 0.957 | 0.952 | 0.952 |
| SNV + FD | 15 | 0.072 | 0.975 | 0.978 | 0.976 | 0.976 |
| MSC + DETR | 3 | 0.237 | 0.726 | 0.698 | 0.695 | 0.695 |
| SNV + DETR | 3 | 0.313 | 0.738 | 0.660 | 0.657 | 0.653 |
| MSC + SNV | 2 | 0.220 | 0.810 | 0.783 | 0.781 | 0.778 |
Table 10.
Results of disease grade discrimination of models established by BPNN based on three combined preprocessing methods.
Table 10.
Results of disease grade discrimination of models established by BPNN based on three combined preprocessing methods.
| PREM | NPC | MSE | PREC | REC | F1S | ACC |
|---|
| SG + DETR + FD | 7 | 0.113 | 0.929 | 0.924 | 0.922 | 0.922 |
| SG + MSC + FD | 10 | 0.156 | 0.916 | 0.915 | 0.914 | 0.916 |
| SG + SNV + FD | 13 | 0.133 | 0.964 | 0.966 | 0.964 | 0.964 |
| SG + MSC + DETR | 3 | 0.339 | 0.681 | 0.585 | 0.571 | 0.581 |
| SG + SNV + DETR | 3 | 0.233 | 0.730 | 0.700 | 0.703 | 0.701 |
| SG + MSC + SNV | 2 | 0.260 | 0.814 | 0.657 | 0.617 | 0.653 |
| DETR + MSC + FD | 11 | 0.107 | 0.970 | 0.972 | 0.970 | 0.970 |
| DETR + SNV + FD | 12 | 0.069 | 0.964 | 0.968 | 0.964 | 0.964 |
| MSC + SNV + FD | 15 | 0.069 | 0.952 | 0.956 | 0.952 | 0.952 |
| DETR + MSC + SNV | 3 | 0.285 | 0.754 | 0.710 | 0.709 | 0.707 |
Table 11.
Results of disease grade discrimination of models established by ELM based on one preprocessing method.
Table 11.
Results of disease grade discrimination of models established by ELM based on one preprocessing method.
| PREM | NPC | NAE | PREC | REC | F1S | ACC |
|---|
| OD | 2 | 7.616 | 0.793 | 0.792 | 0.792 | 0.796 |
| DETR | 2 | 5.831 | 0.848 | 0.848 | 0.847 | 0.850 |
| FD | 13 | 1.000 | 0.995 | 0.993 | 0.994 | 0.994 |
| MSC | 2 | 7.141 | 0.790 | 0.786 | 0.784 | 0.784 |
| SG | 2 | 8.307 | 0.747 | 0.745 | 0.745 | 0.749 |
| SNV | 2 | 6.557 | 0.817 | 0.816 | 0.813 | 0.814 |
Table 12.
Results of disease grade discrimination of models established by ELM based on two combined preprocessing methods.
Table 12.
Results of disease grade discrimination of models established by ELM based on two combined preprocessing methods.
| PREM | NPC | NAE | PREC | REC | F1S | ACC |
|---|
| SG + DETR | 2 | 8.367 | 0.800 | 0.791 | 0.793 | 0.796 |
| SG + FD | 11 | 2.000 | 0.975 | 0.976 | 0.975 | 0.976 |
| SG + MSC | 2 | 7.416 | 0.800 | 0.796 | 0.795 | 0.796 |
| SG + SNV | 2 | 7.550 | 0.805 | 0.804 | 0.801 | 0.802 |
| DETR + FD | 7 | 1.732 | 0.981 | 0.983 | 0.982 | 0.982 |
| MSC + FD | 12 | 0.000 | 1.000 | 1.000 | 1.000 | 1.000 |
| SNV + FD | 15 | 2.000 | 0.975 | 0.977 | 0.976 | 0.976 |
| MSC + DETR | 3 | 6.083 | 0.887 | 0.888 | 0.886 | 0.886 |
| SNV + DETR | 3 | 6.708 | 0.861 | 0.858 | 0.855 | 0.856 |
| MSC + SNV | 2 | 6.557 | 0.817 | 0.816 | 0.813 | 0.814 |
Table 13.
Results of disease grade discrimination of models established by ELM based on three combined preprocessing methods.
Table 13.
Results of disease grade discrimination of models established by ELM based on three combined preprocessing methods.
| PREM | NPC | NAE | PREC | REC | F1S | ACC |
|---|
| SG + DETR + FD | 7 | 2.236 | 0.968 | 0.968 | 0.968 | 0.970 |
| SG + MSC + FD | 10 | 1.732 | 0.981 | 0.981 | 0.981 | 0.982 |
| SG + SNV + FD | 13 | 2.236 | 0.989 | 0.987 | 0.988 | 0.988 |
| SG + MSC + DETR | 3 | 7.000 | 0.835 | 0.833 | 0.831 | 0.832 |
| SG + SNV + DETR | 3 | 7.483 | 0.832 | 0.825 | 0.825 | 0.826 |
| SG + MSC + SNV | 2 | 7.550 | 0.805 | 0.804 | 0.801 | 0.802 |
| DETR + MSC + FD | 11 | 3.464 | 0.983 | 0.984 | 0.983 | 0.982 |
| DETR + SNV + FD | 12 | 1.000 | 0.994 | 0.993 | 0.994 | 0.994 |
| MSC + SNV + FD | 15 | 2.000 | 0.975 | 0.977 | 0.976 | 0.976 |
| DETR + MSC + SNV | 3 | 6.708 | 0.861 | 0.858 | 0.855 | 0.856 |


 ,
, 


