Article

What Is the Willingness to Pay for a Basket of Agricultural Goods? Multi-Features of Organic, Animal Welfare-Based and Natural Products with No Additives

1
Department of Agricultural Extension, Luzhou District Farmers’ Association, New Taipei City 247020, Taiwan
2
Department of Agricultural Economics, National Taiwan University, Taipei 106319, Taiwan
3
The Center for Green Economy, Chung-Hua Institution for Economic Research, Taipei 106220, Taiwan
4
Department of Water Resources and Environmental Engineering, Tamkang University, New Taipei City 251301, Taiwan
5
The Third Research Division, Chung-Hua Institution for Economic Research, Taipei 106319, Taiwan
*
Author to whom correspondence should be addressed.
Agriculture 2023, 13(9), 1743; https://doi.org/10.3390/agriculture13091743
Submission received: 27 July 2023 / Revised: 29 August 2023 / Accepted: 30 August 2023 / Published: 1 September 2023
(This article belongs to the Special Issue Sustainable Rural Development and Agri-Food Systems)

Abstract

:
The purpose of this study is to construct a model by combining the theory of planned behavior (TPB) with conjoint analysis to evaluate baskets of agricultural goods. Each basket of agricultural goods contains various different products, including white rice and leaf vegetables are either organic or non-organic, hens’ eggs and chicken drumsticks obtained from chickens bred with and without due consideration for animal welfare, and soy sauce and jam with or without additives. The evaluation of these various features is innovative and in accordance with the shopping behavior of most consumers who, most of the time, concurrently evaluate these multi-features and multi-products. The price premium for each feature and the willingness to pay, the highest amount that a consumer is willing to pay, for a specific basket of agricultural goods is evaluated by using the multinomial logit model and the linear regression model. The relationship between essential factors in the TPB and the sociodemographic characteristics of consumers is examined. In general, the ranking of the price premium paid for products from the highest to the lowest is soy sauce, jam, chicken drumsticks, white rice, hens’ eggs, and leaf vegetables, respectively. The price premium for natural products with no additives is higher than that for organic and animal welfare-based products. The evaluation of these multi-features of agricultural goods allows us to observe the relative importance of an agricultural product through the price premium, with different combinations of other products. This indicates that the evaluation of the price premium for only a single product or for multiple products with a single feature might be either over-estimated or under-estimated.

1. Introduction

There is a very close relationship between food and agriculture. The production process for different kinds of food and the production environment has a direct impact on the quality, safety, and nutritional value of food. Trust in food safety relies highly upon the perceptions of the consumers. The distance between the farm and the fork or table becomes complicated due to the inappropriate use of chemical materials and land use. The production of food is confronted with additional challenges due to soil degradation, pesticide residues, and wastewater to an extent that is greater than ever before [1]. These phenomena have a high degree of influence on the selection of food by or for consumers.
The purpose of “food and agricultural education” is to enable the public to acquire all kinds of knowledge regarding the nutrition and safety of food through a learning process. The concept of “food and agricultural education” originates from Japan’s food education practice—Shokuiku [2]. Taiwan started to promote a similar concept and idea at a later date. In Taiwan, a similar purpose has been identified, which is to promote food nutrition and safety through food education. Obtaining knowledge about the quality of agricultural goods is not only important for the consumer’s safety but also indirectly supports the development of agriculture and environmental protection. Past studies Oostindjer et al. and Pairs et al. [3,4] indicate that good and healthy dietary behavior will cause the consumer to benefit from their knowledge regarding the quality of various kinds of food. Moreover, the authors of [5] also observed that sufficient knowledge regarding diet will reduce the impulse to consume junk food and increase the consumer’s willingness to purchase healthy food. This will then impact the improper production of food indirectly [6].
An analysis involving text mining and big data was performed; the terms “organic”, “animal welfare”, and “nature and no additives” denoted different features of agricultural goods that were considered to be the most important factors among them all [7]. Organic production involves production without chemical fertilizers and pesticides. Animal welfare is concerned with providing animals with a large enough space and treating poultry and livestock in a humane manner when raising them. As for something being natural with no additives, this refers to products without artificial or chemical flavorings, artificial pigments, or any other artificial materials. The consumption of agricultural goods with these features implies reducing the level of pollution in the environment, avoiding violation of the basic rights of poultry or livestock, and reducing the diseases being contracted by humans.
In order to better understand the selection of food or the willingness to pay (WTP) for specific foods, conjoint analysis is employed to evaluate the preference of a consumer for a specific feature and/or WTP for a particular agricultural product. Gunduz et al. [8] evaluated chicken, while Yang [9] evaluated hens’ eggs based on taking the animal’s welfare into consideration, and Pawlewicz [10] compared the organic egg’s price premium in Poland. Although Rizzo et al. [11] performed a cost-benefit analysis, it was only performed for the hazelnut in the case of conventional and organic production in Italy. Furthermore, Coppola et al. [12] and Bernabéu et al. [13] evaluated the WTP for specific features in the context of organic olive oil and organic tomato ketchup. Similarly, conjoint analysis was conducted by Heng et al. [14] to evaluate the WTP for hens’ eggs and also by Linder et al. [15] to evaluate livestock breeding from the point of view of animal welfare. Although the analyses stated above can evaluate WTP for one product, for a specific feature, or for multiple products with a specific feature, such an evaluation differs from the consumer’s purchasing behavior. That is, a consumer normally purchases various products at once. Thus, the evaluation of a particular product or a specific feature might overestimate or underestimate the WTP for that particular feature or the product itself. The evaluation of a basket of products with various types of features is not only consistent with purchasing behavior but is also essential to determine the WTP for a particular feature of a product or for the product itself.
Moreover, when conjoint analysis is employed to evaluate the price premium or the WTP for a specific feature or for a product, it does not determine the consumer’s underlying past reasons for purchase. The theory of planned behavior, developed by Ajzen [16] in 1985, is concerned with the consumer’s attitude, subjective norms, and perceived behavioral controls and can predict the consumer’s behavior. Examples provided by Gunduz et al. [8], Aungatichart et al. [17], and Trieste et al. [18] indicate that experience and knowledge in relation to consuming products will be reflected in the attitude of a consumer toward a particular product and will further influence their willingness to purchase conventional goods or organic products. Furthermore, the subjective norm of the experience, based on others’ opinions, will impact the consumer’s willingness to purchase an organic product [19,20]. In addition, there are perceived behavioral controls such as the consumer’s income, i.e., the lower their income, the higher the sensitivity of a consumer to purchasing an organic product [21]. A combination of conjoint analysis and the theory of planned behavior is then able to determine the impact of attitude, subjective norms, or perceived behavioral control of a consumer on the WTP for a particular feature of a product or for the product itself.
Thus, the purposes of this study are firstly to construct a model by combining the theory of planned behavior and conjoint analysis to evaluate baskets of agricultural goods. Each basket of agricultural goods contains multiple products of white rice, leaf vegetables, hens’ eggs, chicken drumsticks, soy sauce, and jam, the most commonly consumed agricultural goods in ordinary families in Taiwan. These agricultural goods possess the multi-features of being organic, animal welfare-based, or without additives, which are also referred to as quality features, or they are without such features. Secondly, the model constructed here is then used to evaluate the price premium for each feature of agricultural goods and then to evaluate the WTP for a one-time purchase of a basket of agricultural goods. To the best of our knowledge, the model of combining the theory of planned behavior and conjoint analysis constructed here is the first to be presented in the literature. Such a model has universal significance. Data collected in Taiwan are used to demonstrate the applicability of this model in evaluating the price premium of each feature and total WTP for a specific basket of agricultural goods. Finally, the relationship between the essential factors of attitude, subjective norms, and perceived behavioral control in the theory of planned behavior, the sociodemographic characteristics of consumers, and the WTP with regard to the selection of different baskets of agricultural goods can be observed further.

2. Materials and Methods

2.1. The Connection between Agricultural Education and Diet

The concept of food and agricultural education originated in Japan, where attempts were made to treat the concept of “food education” as the sixth concept of education, along with moral education, intellectual education, physical education, group education, and aesthetic education. This concept thus became a pioneer and paragon for diet education in the world. The bottom-up impetus from various farmers’ associations and non-government farmers’ organizations took on a similar mission to that for food education in Japan with the development of agriculture in Taiwan. The “Diet Education Act” established in 2013 in South Korea sought to effectively promote healthy dietary habits and a correct diet and living style [22,23]. The agricultural literacy program proposed by the United States National Research Council in 1988 had the same purpose, to systematically teach students from kindergarten to grade 12 about agriculture [24]. Since then, the idea of food or agricultural literacy has been the focus of much attention [25,26,27] and is related to the knowledge of agriculture and the environment and attitudes toward maintaining the quality of foods and promoting health.
It is known that keeping a good and healthy diet not only benefits the consumer but also promotes agricultural development in a sustainable manner. The Sustainable Development Commission (SDC) in the United Kingdom has proposed the concept of sustainable food. It indicates that healthy and safe foods are the source of subsistence for farmers, food processors, and retailers. This can further support the economy in rural areas, decrease the consumption of energy, improve the environment, and enhance the health and welfare of animals [28]. A similar idea was proposed by Berry [29]. Thus, the careful selection of goods is both for the consumer’s own health and to protect the earth. The “Healthy, Hunger-Free Kids Act” passed in 2010 in the US suggests that it is more important for adult family members to select appropriate foods than the concept of diet being taught in schools [30,31]. Low-carbon agricultural goods result in no harm to the environment and in farming on the basis of green production procedures within the overall life cycle [32,33,34,35]. Such a concept reflects a common attitude toward the increased purchase of organic foods [36,37].

2.2. Construction of a Model for the Theory of Planned Behavior and Conjoint Analysis

2.2.1. Factors in the Theory of Planned Behavior

The theory of planned behavior (TPB) has evolved from the theory of reasoned action (TRA) propounded by Fishbein and Ajzen [38]. Individual attitudes and subjective norms through personal intention are two major factors in the original TRA. Perceived behavioral control is suggested by Ajzen [16] as being the third factor. These three factors together have an impact on the behavioral intention, after which specific behavior is observed [39]. Factors of attitude, subjective norms, and perceived behavioral control in the TPB are influenced by behavioral beliefs, normative beliefs, and control beliefs, respectively [39]. Behavioral beliefs are key to the evaluation of expected behavior. For the case at hand, the attitude factor includes cognition and emotion. It refers to the preference of a consumer for a particular choice. Their positive or negative evaluation will affect their willingness to conduct such behavior if the consumer thinks that the selection of a healthy diet will have a positive impact on his/her health. This will encourage more of such behavior. The normative beliefs refer to the expectations of society. This includes the support of or criticism by others [40]. The behaviors in relation to consuming agricultural goods will be enforced when social desirability expects such behaviors to be friendly to the environment, i.e., reducing the carbon footprint via reducing meat products [41]. This subjective norm will induce or deter the intention to perform the behavior. The actual behavior will then be implemented one way or the other. The control beliefs revealed by the perceived behavioral control will impact certain behaviors and the resources, such as budgets, rights, and opportunities, to accomplish certain behaviors. This implies that confidence in terms of the behaviors of a consumer is influenced by greater diet and agricultural knowledge.
Since its development, the theory of planned behavior has been applied in various areas. Ajzen and Driver [42] used this theory to predict the leisure activities of undergraduate students in Massachusetts. Conner et al. [43] explored the selection of nutritional food, while Netemeyer and Burton [44] discovered the relationship between the expected outcomes and factors influencing voting behavior. As with the WTP for agricultural goods, Govaerts and Olsen [45] found that consumers’ positive attitudes toward seaweed, i.e., the belief that it is healthy, natural, and good for the environment, guide them with high WTP. Past experience, knowledge, and awareness of health information for food consumption will have an impact on the willingness to purchase foods [8,17,18]. It is known that TPB accounts for psychological and physical factors, subjective and objective influence, and intention and behavior. TPB no doubt satisfies these conditions when a hypothesis purchase model, i.e., conjoint analysis, is introduced into TPB.
Past studies have indicated the enhancement of a sustainable environment, certification, and understanding of animal welfare through changes in consumers’ attitudes that will result in a reduction in purchasing meat products [31,46,47,48,49]. The establishment of trust regarding the identification and detection of issues related to food is essential to improve the consumer’s understanding of a sustainable environment. The opinions or thoughts of others, including family members, will also affect an individual’s behavior when purchasing organic products, through the subjective norms [19,20,50,51]. Some studies have found that perceived behavioral control has a significant impact on purchasing behavior [52,53,54]. However, the sensitivity related to the product’s price is affected by the consumer’s income. The lower the income, the lower the confidence will be, and this brings higher pressure to bear on the consumer to purchase healthy products [21,55,56,57,58].

2.2.2. Price Premiums for Organic, Animal Welfare-Based, and Natural Products with No Additives in Agricultural Goods or WTP for a Basket of Agricultural Goods in Conjoint Selection

The conjoint measurement was developed to measure the preference for goods or services of a consumer and originated in 1964, through the work of Luce and Tukey [59]. Green and Rao [60] then applied it to the marketing arena. Green and Srinivasan [61] then further developed the concept into conjoint analysis. The concept of conjoint analysis involves decomposing the goods and services into a series of characteristics of features and explores the consumer preferences among different features while considering how the consumer seeks to find a balance to achieve his/her maximum utility [62,63]. The application of conjoint analysis can be found in studies on agricultural goods by various authors such as Batte et al. [64], Geng et al. [65], Japutra et al. [66], Kriwy and Mecking [67], Meas et al. [68], Sakagami and Haas [69], and White et al. [70], in order to evaluate the WTP for various types of organic products with certified labels. Similarly, the influence of whether hens’ eggs or poultry and livestock were raised in a humane manner and in a protected environment is also evaluated by conjoint analysis. Studies can be found by Heng [14], Linder et al. [15], Stranieri et al. [49], and Bozzo [71]. In addition to the religious reasons regarding poultry and livestock, it can be concluded that the WTP for an agricultural product is influenced by an awareness of health, truth, and the perception of that agricultural product. Following the end of production, such information can assist the producer in having a proper design for and development of the products [72].
In this study, a model constructed by combining the theory of planned behavior and conjoint analysis is shown in Figure 1. A consumer selects one basket with multi-feature agricultural goods among various baskets and each basket offers different combinations of those features.

2.3. Questionnaire Design

2.3.1. Factors Regarding Attitude, Subjective Norms, and Perceived Behavioral Control

All questions regarding the factors of attitude, subjective norms, or perceived behavioral control under the theory of planned behavior are listed in Table 1. The questions for each factor consistently reflect the concepts discussed above. Each factor comprises 5 questions and is designed to have 5 levels, from “very much disagree” to “very much agree”, and are measured using the popular Likert scales [73], with a scale ranging from 1 to 5 to indicate the intensity of each factor.

2.3.2. Name, Quantity, and Price Determination for Each Basket of Agricultural Goods

This survey selects six frequently consumed and diverse agricultural goods in Taiwan to compose different baskets of combinations. These diverse products include farming crops such as white rice and leaf vegetables, livestock in terms of hens’ eggs and chicken drumsticks, and processed products, namely, soy sauce and jam. To avoid the WTP being influenced by a particular brand, the production firm, the design of the packaging, or any specific label for the product, all agricultural goods are de-labeled to remove the above identification for a specific product in the survey [74,75]. Moreover, the above agricultural goods include three features. These are organic white rice vs. regular rice, organic leaf vegetables vs. regular vegetables; hens’ eggs with consideration given to the animal’s welfare vs. regular ones, chicken drumsticks from chickens bred with consideration given to animal welfare vs. regular ones, soy sauce with no additives vs. the regular one, and jam with no additives vs. the regular one, respectively. It is assumed that a basket of 6 agricultural goods, as shown in Figure 2, with different combinations of quality features will be purchased on a single shopping trip.
In order to assign a price for each theoretical basket of agricultural goods, a price standard for reasonable sizes of products, established through various marketing channels, is used to reflect all potential shopping spots. These marketing channels include traditional markets, supermarkets operated by farmers’ associations, convenience stores, supermarkets in department stores, and warehouses, to reflect the potential price variations. These prices are collected based on the references used in the questionnaire design; thus, it is essential to collect them during those time periods without promotional or discount activities. In total, 49 types of white rice in 1–2 kg packages, comprising 28 organic and 21 non-organic types, are obtained. The size of leaf vegetables ranges from 200–300 g and the prices are almost identical. A total of 20 types of regular leaf vegetables and 25 organic types are collected. As with hens’ eggs, 25 types of cage egg and 21 types of eggs raised in humane conditions, involving packages of 10 eggs, are collected from different channels. Ten types of chicken drumstick of around 600 g from chickens raised in a humane manner and eight types from chickens bred in the regular way are collected. The processed products of soy sauce include 24 of the regular types and 22 that are natural and have no additives. Finally, 8 regular types of jam and 11 types of jam that are natural and have no additives are gathered.
Different price levels are assigned to a basket of agricultural goods from different combinations of regular products or those corresponding to products with specific features. Different total price levels, established through the above market search, for a basket of agricultural goods are determined. The market price is in the range of 480 New Taiwan dollars (hereafter TWD) and TWD 920. Thus, reasonable values for the total price level, i.e., TWD 500, 600, 700, 800, and 900, are used in the questionnaire. Since each product has two features and 5 total prices are determined for a basket with 6 products, it transpires that there are 320 combinations. It is impossible for a consumer to select from all combinations. An operation involving orthogonality is essential to reduce the number of combinations of baskets to a reasonable and manageable selection of only 8. The price for the basket of products varies according to the number of products and the corresponding types of quality features. The respondent is asked to select one basket from 4 combinations, of which 3 are randomly assigned from a total of 8 baskets of agricultural goods. Among those 4 combinations, one is the reference basket containing 6 regular products, which is not known by the respondents. A total of 9 baskets of agricultural goods for the whole sample were selected, with different product features and prices as shown in Table 2.

2.3.3. Sample Size

According to the framework proposed in the previous subsection, a questionnaire was designed to accomplish the purposes of this study. In March and April of 2023, personal interviews were conducted in Taipei City and New Taipei City, two of the municipalities among the six in Taiwan. The total population of both cities accounts for about 28% of the total population of Taiwan [76]. The first stratification of sampling was in proportion to the number of households in 41 districts of these two cities; the number of observations for some districts was of only 1 or 2 households. We then combined these districts with the nearby districts. The final total number of districts was 25. A number of questionnaires were distributed to 25 rearranged districts in these two cities, sent out in proportion to the number of households in each district, after which a convenience survey was conducted within each district via personal interviews.
A total sample size of 385 was required, according to Equation (1), under the assumptions of a population percentage of P = 0.5 , a confidence level of 95%, a maximum sampling error of ± 5 % , and a standard normal distribution for different Z-values of 1.96.
n = 0.5 ( 1 0.5 ) [ 1.96 / 0.05 ] 2
There were 56 permutations in total for randomly selecting 3 baskets of agricultural goods out of 8 possible choices, along with the reference basket. In order to have 56 baskets, with the same number of respondents to reply to each questionnaire, the final sample size was set at 448.

2.3.4. Factors in the Theory of Planned Behavior and the Sociodemographic Characteristics of the Consumer

In order to estimate the factors that influence the price premium and WTP for a basket of agricultural goods, the total score from each factor in the theory of planned behavior was obtained as stated previously. The averages of the total scores for A t T , S u T , and P e T are presented in Table 3. Moreover, personal experience, general views about the consumption of poultry or livestock in relation to the environment or the welfare and health of animals, and the respondent’s attendance at activities, events, or lectures regarding environmentally friendly farming, the animal welfare of livestock or poultry, and human health were also recorded, in order to establish the respondents’ general interactions with these related issues. Dummy variables, including R I , V E , E G , C H , S A , and J A indicated whether white rice, vegetables, hens’ eggs, chicken drumsticks, soy sauce, and jam were organic, were raised in a humane manner, or were natural and had no additives. The respondents’ sociodemographic variables included the cities where the respondents resided, their age, gender, monthly income, which family members were living together, and the types of professions the respondents were in. The notations, definitions, and averages for all the variables used hereafter in the study are presented in Table 3.
The averages in Table 3 indicate when consuming poultry or livestock, the respondents in this sample only occasionally or even only rarely considered environmental harm to the welfare and health of animals, i.e., the average score for the variable A n i was 2.8080, indicating somewhere between the selections of “sometimes” and “rarely”. Similarly, the respondents did not often attend activities, events, or lectures regarding environmentally friendly farming, the animal welfare of livestock or poultry, and human health, i.e., the average score for the variable E v e n t was 2.1228 and was close to the selection of “rarely”. This might have been due to the similar information that can come from various channels and not necessarily from attending these formal events. As with the sociodemographic characteristics, the average monthly income of this sample was close to the average income for the population of these two cities. The income of this sample was only less than one standard deviation of the income for the population [76]. It is known that this sample is a good representation of the population. There were more females who replied to this survey than males. Such a phenomenon is very normal and typical as more females are in charge of grocery shopping and cooking in this region than males.

3. Results

3.1. The First-stage WTP Estimation for Each Basket of Agricultural Goods

In order to estimate the impact of all factors in the theory of planned behavior on the selection of a specific basket of agricultural goods, the first stage of the estimation involves estimating the impacts of these factors when a consumer selects a specific basket of agricultural goods. The whole sample with 448 observations can be treated as one respondent, who selects one basket out of 9 options, i.e., S = 1, 2,…,9. Thus, a multinomial logit model is employed, as in Equation (2), where s is the selection of a particular sample among 448 observations and J = 9 is the number of all options arranged in the questionnaire for selection. Equation (2) is written as follows:
ln [ s ( y = j | x ) s ( y = J | x ) ] = i = 1 I α 1 i x i
There are J options in the multinomial logit model in Equation (2). The options of J − 1 can be written as in Equation (3) below:
ln [ s ( y = 1 | x ) s ( y = J | x ) ] = i = 1 I α 1 i x i ln [ s ( y = 2 | x ) s ( y = J | x ) ] = i = 1 I α 2 i x i ln [ s ( y = ( J 1 ) | x ) s ( y = J | x ) ] = i = 1 I α ( J 1 ) i x i
where basket 9 of the agricultural goods serves as the reference. Thus:
p ( s = 1 | x ) + p ( s = 2 | x ) + p ( s = J | x ) = 1 i . e . , p ( s = 1 | x ) + p ( s = 2 | x ) + p ( s = J | x ) = p ( s = J | x ) [ 1 + j = 1 J 1 e i = j I α j x i ] = 1 .
The probability of selecting each basket of agricultural goods can then be estimated by Equation (5), as follows:
p ( s = j | x ) = l α j + i = 1 I α j i x i 1 + j = 1 J 1 l i = 1 I α j i x i
The factors of attitude, subjective norms, and perceived behavioral control could have interactions with each feature of each agricultural product and the price of the reference basket, which contains only regular agricultural goods. The functional form for this estimation is written as in Equation (6):
S i = α 1 A S C i + α 2 R I i + α 3 V E i + α 4 E G i + α 5 C H + α 6 S A + α 7 J A i + α 8 P r i c e i + α 9 A S C i * A t T i + α 10 R I i * A t T i + α 11 V E i * A t T i + α 12 E G i * A t T i + α 13 C H i * A t T i + α 14 S A i * A t T i + α 15 J A i * A t T i + α 16 P r i c e i * A t T i + α 17 A S C i * S u T i + α 18 R I i * S u T i + α 19 V E i * S u T i + α 20 E G i * S u T i + α 21 C H i * S u T i + α 22 S A i * S u T i + α 23 J A i * S u T i + α 24 P r i c e i * S u T i + α 25 A S C i * P e T i + α 26 R I i * P e T i + α 27 V E i * P e T i + α 28 E G i * P e T i + α 29 C H i * P e T i + α 30 S A i * P e T i + α 31 J A i * P e T i + α 32 P r i c e i * P e T i + ε i ,   i = 1 ,   448
where the A S C is an alternative-specific constant, α s are coefficients to be estimated, and ε i is the residual term.
The results of the first-stage estimations are listed in Table 4. It is clear that 5 quality features out of the 6 are significant. Similarly, the price for the basket with 6 regular agricultural goods ( P r i c e ) and their corresponding features ( A S C ) are also significant. The results also show that the interaction terms for the respondent’s attitude and perceived behavioral control, as well as each feature of the agricultural goods, are mostly significant. This indicates that the respondent’s attitude and perceived behavioral control will reinforce his/her view regarding the quality features of the agricultural goods.

3.2. Second-Stage Estimation of the Impact of Factors in the TPB and Related Sociodemographic Factors on the Estimated WTP

In order to ascertain the impact of the respondent’s view regarding the protection of the environment and animal welfare, socio-demographic variables, and the factors of the TPB on his/her estimated WTP, a second-stage estimation was conducted. The estimated WTP from the first stage was used as the dependent variable and 6 variables regarding the general level of concern about environmental protection and animal welfare, along with 3 major factors in the TPB and 12 socio-demographic variables regarding the respondent were used as the explanatory variables. To exclude any correlation between the variables, the correlation among all variables was examined. Any one of the independent variables was found to have a correlation with the other variable of less than 0.3. The descriptive statistics for all independent variables used in the second-stage estimation are also shown in Table 3. The functional form for the second-stage estimation is calculated using Equation (8), below:
W T P i ^ = β 0 + β 1 A n i i + β 2 E v e n t i + β 3 A t T i + β 4 S u T i + β 5 P e T i + β 6 C i t y i   + β 7 G e n i + β 8 F a m i l y i + β 9 C D 1 i + β 10 C D 2 i + β 11 C D 3 i   + β 12 C D 4 i + β 13 C D 5 i + β 14 C D 6 i + β 15 A g e i + β 16 I n c i + υ i , i = 1 , , 448
W T P i ^ is the result of the first-stage estimation. The β s are the coefficients to be estimated and υ i is the residual term. The relationship is determined using a linear regression model.
The second-stage estimation results are shown in Table 5. The results show that when a respondent is more concerned about the information ( A n i ) on the agricultural goods that he/she consumes, the estimated WTP tends to be higher. The results show that the more activities or events that a respondent attends concerning environmental issues related to farming or the raising of poultry or livestock ( E v e n t ), the lower the estimated WTP for a specific basket of agricultural goods will be. This result could arise because this type of respondent may have marketing routes other than those provided in this questionnaire, i.e., traditional markets, supermarkets operated by farmers’ associations, convenience stores, supermarkets in department stores, and warehouses, where they can obtain quality agricultural goods. Paying higher prices through the above-mentioned marketing routes in this survey may not be their priority. As with the factors in the TPB, the values for attitude ( A t T ) and perceived behavioral control ( P e T ) are significantly different from zero. However, their impacts on the estimated WTP move in the opposite direction. This indicates that the personal capability of a respondent, such as income in this sample, is not a crucial factor in the respondent’s WTP for a specific basket of agricultural goods. This result is consistent with the estimated coefficient of the sociodemographic variables shown in Table 5, whereby income has a positive impact on the estimated WTP but it is insignificant. However, the values for the city ( C i t y ) in which the respondent resides, in the case of those respondents employed in the financial sector ( C D 2 ) and in the service sector ( C D 3 ), are significantly different from zero and all three variables have a positive impact on the estimated WTP.

4. Discussion

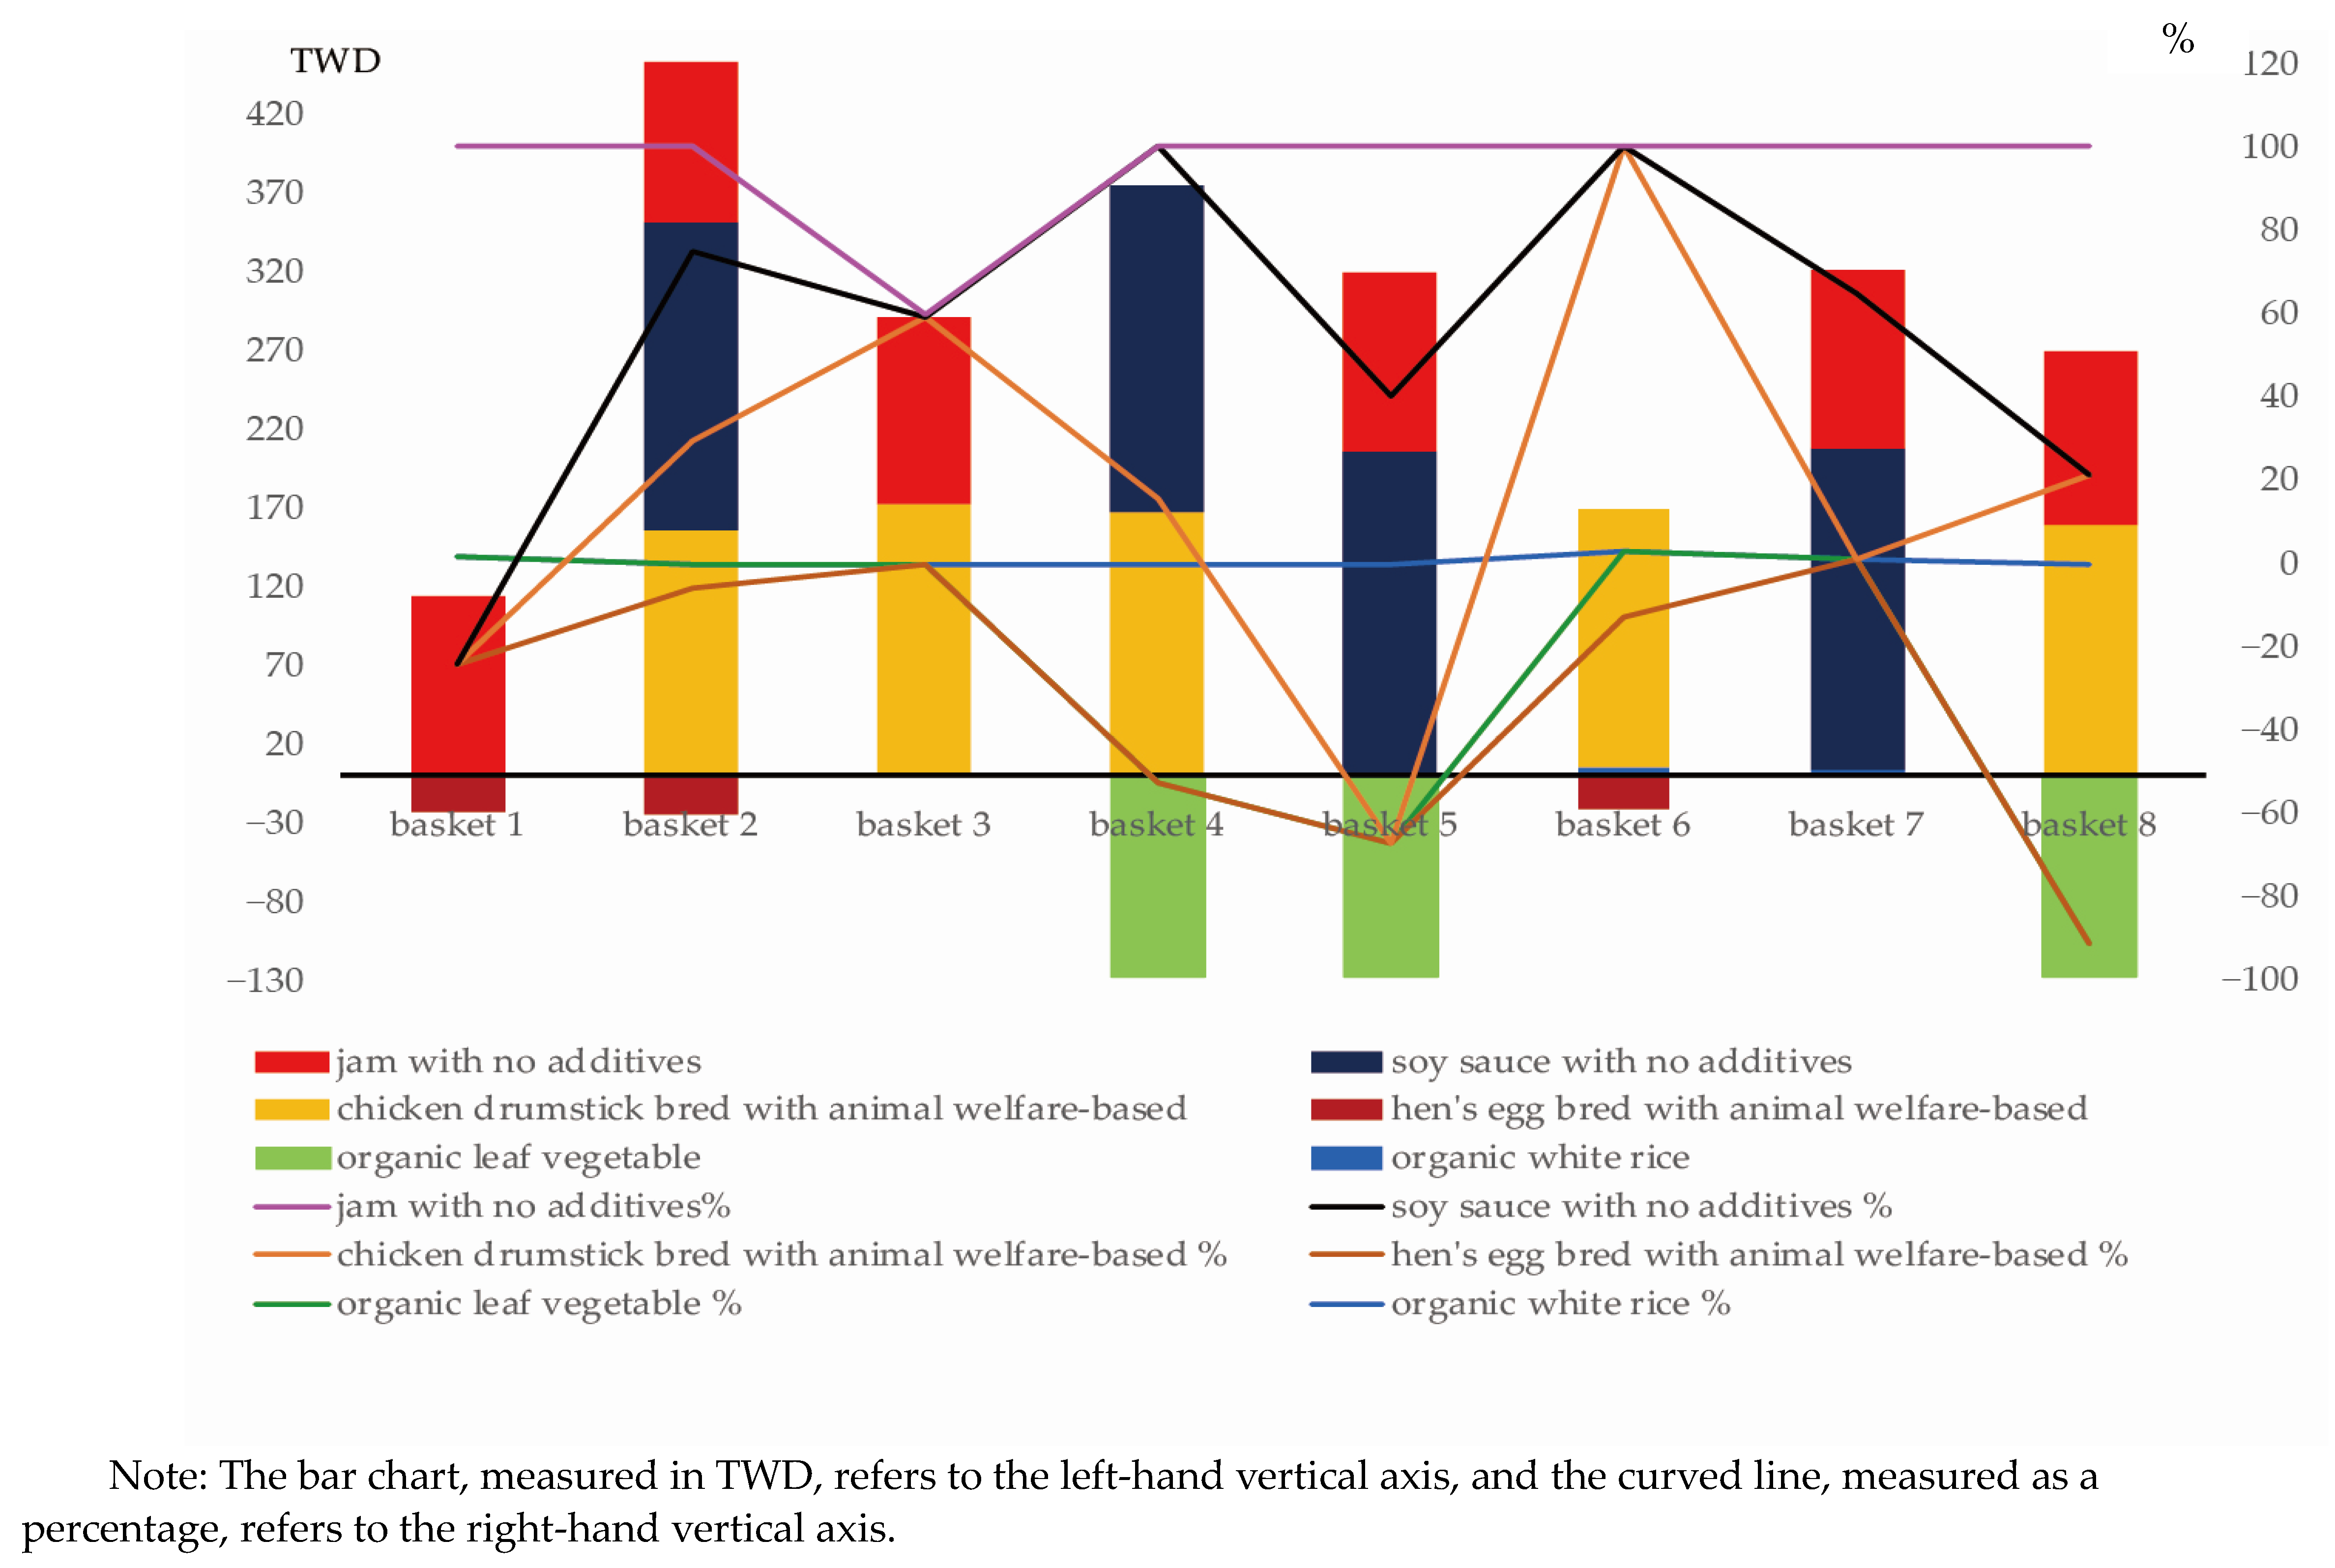
4.1. Computation of Price Premium for Each Quality Feature in Each Basket of Agricultural Goods

From the first stage of the estimation, one can compute the price premium ( P P ) for a specific product feature by taking the total derivative for Equation (6). With organic white rice ( R I ) as an example, the price premium for white rice with the organic feature is computed as in Equation (8) below:
P P i = d R I i d P r i c e i = α 2 + α 10 A t T i + α 18 S u T i + α 26 P e T i α 8 + α 16 A t T i + α 24 S u T i + α 32 P e T i       i = 1 ,   ,   448
A similar procedure is conducted to compute the price premium for organic vegetables, hens’ eggs, drumsticks from chickens bred with consideration for animal welfare, soy sauce with no additives, and jam with no additives. The average price premium regarding each basket of agricultural commodities for the whole sample is computed as shown in Table 6. It is clear that the average price premium for leaf vegetables and hens’ eggs is not expected to be negative. These results indicate that compared to the other agricultural goods, regardless of whether they are cultivated agricultural products, such as white rice and leaf vegetables, poultry or livestock products such as hens’ eggs and chicken drumsticks, and processed agricultural products such as soy sauce and jam, the consumer will have a lower WTP for the leaf vegetables and hens’ eggs with the quality feature.
The rationale for such results is that when a consumer purchases a basket of agricultural goods, he/she is not only considering whether to purchase a product with quality features but his/her behavior is also limited by the budget related to the basket of agricultural goods being purchased. That is, if a consumer has already indicated a high WTP for certain products with quality features, he/she may not simultaneously exhibit a higher WTP for other products with quality features. Such infeasibility might be due to objective conditions, i.e., their budget restricts the consumer from purchasing all goods with quality features, or subjective conditions, i.e., once the consumer purchases a major product with a quality feature, he/she may subjectively think that organic leaf vegetables and hens’ eggs from chickens raised in a humane manner are not as important.
To analyze whether the above rationale applies to the average price premium for each agricultural product in each basket of agricultural goods, we can further compute the percentage for the average price premium in each basket of agricultural goods, as shown in the parentheses underneath the magnitude of the average price premium in Table 6. The results show that the total percentage for the price premium in each basket of agricultural goods is 100%. It is much easier to observe the relative importance from the percentage of the price premium for each quality feature, evaluated by the average consumers who select each basket of agricultural goods.
Furthermore, to verify the reasonable explanation for the negative price premium for leaf vegetables and hens’ eggs, Figure 3 demonstrates, via combining products, the price premium of each quality feature measured in monetary terms and the corresponding percentage of the total price premium for each specific basket of agricultural goods. It clearly indicates that the negative price premium for hens’ eggs and leaf vegetables appears once the consumer purchases a much higher percentage of processed agricultural products, such as jam and soy sauce. These two agricultural goods are normally not consumed all at once. If there is a one-time purchase for a basket of agricultural goods with these two products, the price premium for organic leaf vegetables or hens’ eggs from chickens reared with consideration for animal welfare is inclined to be negative.
This tendency can also be observed in the last row of Table 6. Whether or not to purchase a pack of organic leaf vegetables is not so essential a factor when the consumer has already spent almost 50% of the WTP on other agricultural products that can be used for a period of time, i.e., products that are not consumed all at once. The total positive price premium of the quality features for baskets 4, 5, and 8 take shares of 51.00%, 47.71%, and 46.43%, respectively, which clearly confirms such results. This, however, does not mean that the consumer is not concerned about the consumption of organically cultivated farming products such as leaf vegetables. A consumer will take a trade-off between the purchase of such product and those quality products that have already taken up a significant percentage of expenditure at a specific time of shopping.

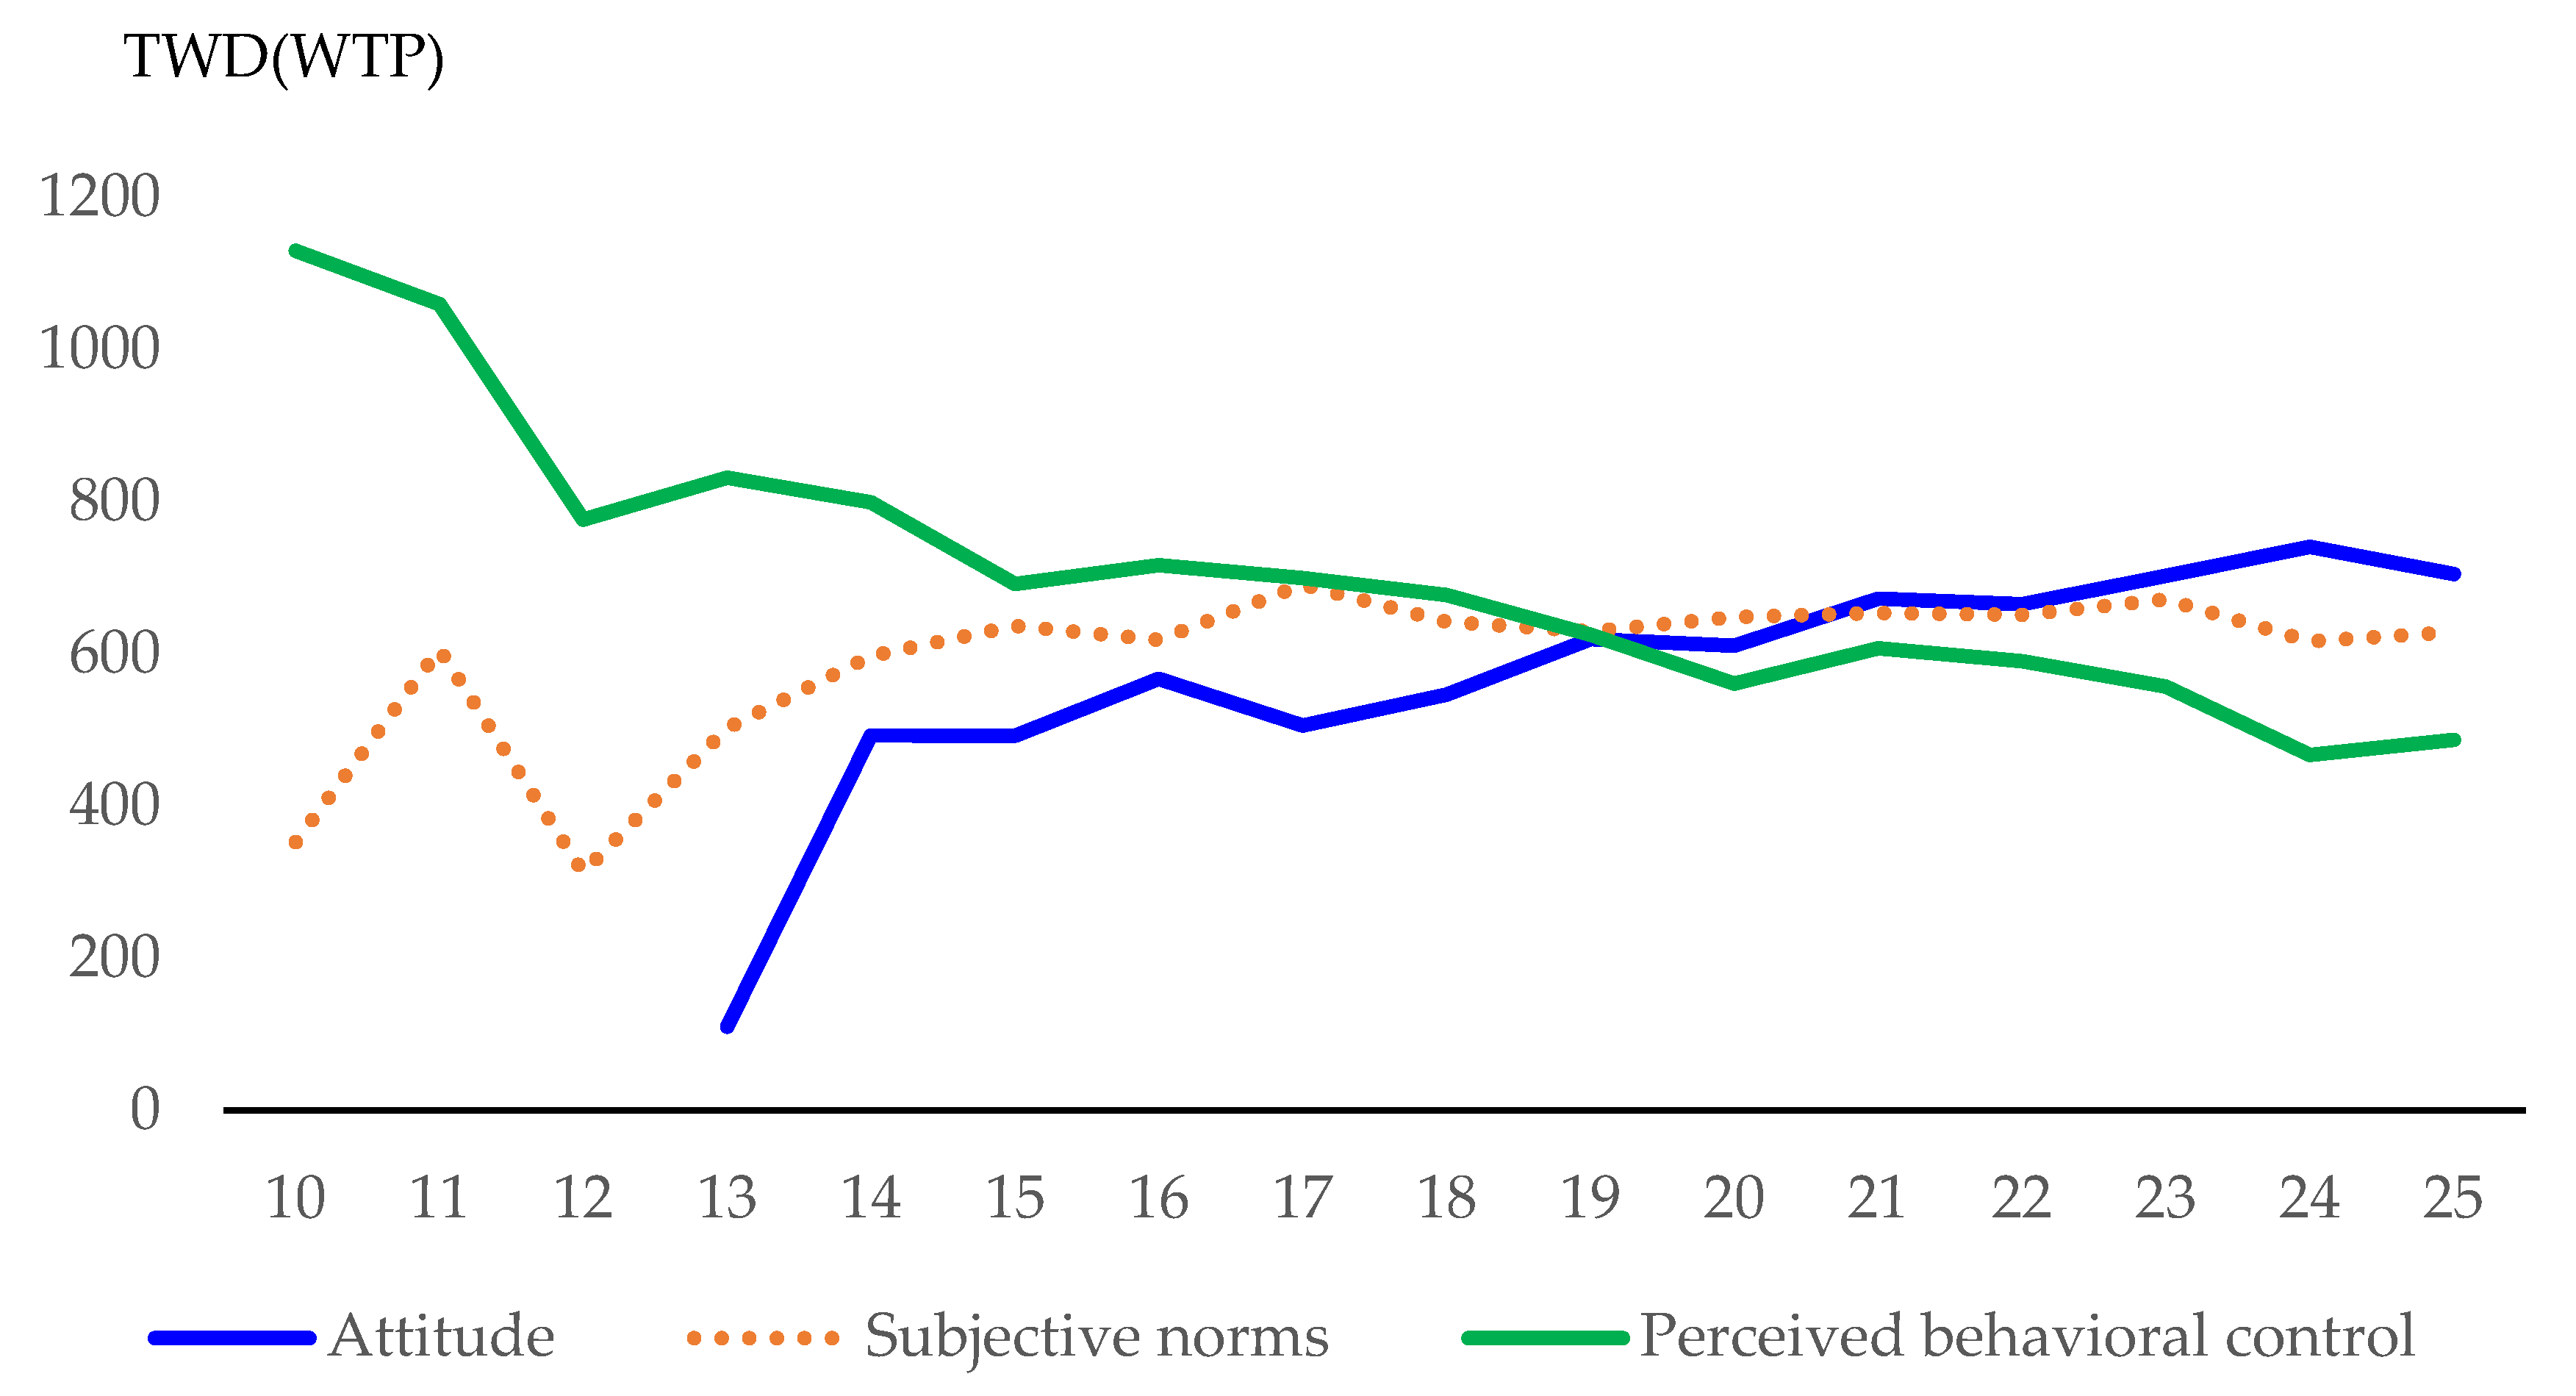
4.2. Impact of the Consumer’s Attitude, Subjective Norms, and Perceived Behavioral Control on the Estimated WTP

The above estimation is conducted to observe the impact of the consumer’s attitude, subjective norms, and perceived behavioral control within the framework of the TPB on the estimated WTP. The results in Table 5 show that the impact of the subjective norms of the consumer is insignificant. The attitude variables regarding the quality features of agricultural goods and perceived behavioral control regarding his/her capacity to purchase quality-feature products are both significant at the 1% significance level. However, the two variables have the opposite impact on the consumer’s WTP. The higher or stronger the positive attitude toward the quality features of agricultural goods, the greater the intention for him/her to purchase organic, natural products with no additives, or food items from poultry or livestock raised with due consideration for animal welfare.
However, the consumer’s final behavior is not determined by his/her attitude only, as the final behavior is concurrently determined by attitude and perceived behavioral control, i.e., the consumer’s ability to purchase the agricultural goods in the given case at hand. Since the impact of perceived behavioral control on WTP is negative here, the results for this sample indicate that even though the consumer may have a strong attitude toward the quality features of agricultural products, he/she may be limited by his/her budget and, thus, be unable to purchase every product with quality features. In order to observe the relationship between the WTP and the change in the total score for attitude and perceived behavioral control, which is ranked between scores of 5 and 25, it can be seen from Figure 4 that the higher the score, i.e., the stronger the attitude toward the quality features of agricultural goods, the higher will be the WTP that is displayed. Conversely, the higher the score for the perceived behavioral control, the lower the WTP will be.

5. Conclusions

This study combines the theory of planned behavior (TPB) with conjoint analysis to evaluate multiple features of the price premium for various baskets of agricultural goods. Such a combination brings the effectiveness of both theory and method into full view. The combined model has been used to determine the relationship between the intensity of attitude, subjective norms, and perceived behavioral control factors in the TPB and the willingness to pay (WTP) for a basket of agricultural goods. To achieve the purposes designated in this study, a multinomial logit model was employed for the first-stage estimation. The relationship between the WTP and the factors of the TPB and sociodemographic characteristics of consumers was obtained using a linear regression model. The results were then used to compute the price premium for each feature that each agricultural product contains. A questionnaire involving a personal survey, conducted in Taipei City and New Taipei City, was circulated and a sample of 448 valid responses was obtained.
The evaluation of multiple features is not only innovative compared to previous studies, rather than evaluating one feature at a time, but is also in accordance with the shopping behavior of most consumers for much of the time. That is, consumers usually purchase a basket of various agricultural goods instead of a single product. This combination of the TPB and conjoint analysis enables us to observe the underlying causes that affect the purchasing behavior of a consumer. Most importantly, an evaluation of the multiple features of agricultural goods allows us to observe the relative importance of an agricultural product through the price premium alongside different combinations of other products. This indicates that when past studies either evaluated the price premium for only a single product or for multiple products with a single feature, this might have given rise to results that are over-estimated or under-estimated.
The results show that the most significant variables affecting the WTP of consumers are attitude and perceived behavioral control. Consumers who are more concerned about environmental harm to the welfare and health of poultry or livestock will exhibit a higher WTP for the basket of agricultural goods with quality features, either organic, animal welfare-related, or natural with no additives. It is surprising to find that consumers who attend more activities or events concerning environmental issues will exhibit less WTP for a specific basket of agricultural goods. This indicates that diverse marketing channels will support consumers in obtaining the requisite information about the production of cultivated farming products or the rearing of poultry or livestock. It is not necessary to attend formal events to acquire similar information. From a marketing viewpoint, the results show that it is effective to enforce an attitude toward buying organic, animal welfare-based, or natural foods with no additives on consumers in Taipei City, the capital of Taiwan, and on consumers with employment in the financial sector and service sector since the WTP for a specific basket of agricultural goods will be higher for these categories of consumers.
Three types of agricultural goods were selected to represent both frequently and commonly consumed agricultural goods. The advantage of conducting the model developed in this study is that it is possible to evaluate the price premium of various characteristics of agricultural goods. However, there are certain limitations when employing the model constructed in this study for all the related evaluations. The price premium for a specific feature of an agricultural product is different, depending upon what other agricultural goods are purchased along with that specific product. Strictly speaking, such an outcome may not be unreasonable as price premiums for a specific feature or WTP for a group of goods for most consumers are not invariable. However, if commanding the price premium to obtain a quality feature of specific agricultural goods, i.e., organic, animal-welfare-based, or natural and with no additives, is essential for marketing, future studies can evaluate a particular feature of a specific agricultural product, as in the existing studies, and further evaluate a basket of the relevant agricultural goods as suggested by this study. The comparison of price premiums from both evaluations might be able to determine the price premium for a particular agricultural product with a specific feature. This information will be useful and reliable when marketing specific goods with a designated quality feature.
Additionally, the model developed in this study can be extended to other areas in future studies. It is believed that a more diverse comparison can be conducted with regard to the influence of the factors analyzed in the TPB and sociodemographic variables when other areas and/or larger areas are included in the analysis. Furthermore, more features and more types of agricultural goods can also be accounted for by adopting the framework constructed in this study. A comprehensive evaluation can also be designed to include more diverse types of shopping behavior.

Author Contributions

Conceptualization, Y.-S.C., P.-I.W. and T.-K.H.; methodology, Y.-S.C., P.-I.W., J.-L.L. and C.-W.C.; software, Y.-S.C., P.-I.W., J.-L.L. and C.-W.C.; validation, Y.-S.C., P.-I.W., J.-L.L. and T.-K.H.; formal analysis, Y.-S.C., P.-I.W. and T.-K.H.; investigation, Y.-S.C., P.-I.W., T.-K.H., J.-L.L. and C.-W.C.; resources, Y.-S.C., P.-I.W. and J.-L.L.; data curation, Y.-S.C., P.-I.W., J.-L.L. and C.-W.C.; writing—original draft preparation, Y.-S.C. and P.-I.W.; writing—review and editing, Y.-S.C., P.-I.W. and T.-K.H.; visualization, Y.-S.C., P.-I.W. and T.-K.H.; supervision, P.-I.W.; funding acquisition, Y.-S.C. and P.-I.W. All authors have read and agreed to the published version of the manuscript.

Funding

This research received no external funding.

Data Availability Statement

All data are available upon request.

Acknowledgments

All authors sincerely appreciate the data coding performed by Pei-Ching Cheng and the surveying conducted by Pei-Ching Cheng and Chia-Hung Lee.

Conflicts of Interest

The authors declare no conflict of interest.

References

  1. Mazoyer, M.; Roudart, L. A History of World Agriculture: From the Neolithic Age to the Current Crisis; NYU Press: New York, NY, USA, 2006. [Google Scholar]
  2. Japanese Ministry of Agriculture, Forestry and Fishery. Shokuiku Promotion Policies: FY2016 (White Paper on Shokuiku) Summary; Japanese Ministry of Agriculture, Forestry and Fishery: Tokyo, Japan, 2017. Available online: https://www.maff.go.jp/e/data/publish/attach/pdf/index-62.pdf (accessed on 2 February 2023).
  3. Oostindjer, M.; Amdam, G.V.; Egelandsdal, B. Getting Norway to eat healthier: What are the opportunities? Scand. J. Public Health 2015, 43, 66–75. [Google Scholar] [CrossRef] [PubMed]
  4. Pais, D.F.; Marques, A.C.; Fuinhas, J.A. How to promote healthier and more sustainable food choices: The case of Portugal. Sustainability 2023, 15, 3868. [Google Scholar] [CrossRef]
  5. Steils, N. Using in-store customer education to act upon the negative effects of impulsiveness in relation to unhealthy food consumption. J. Retail. Consum. Serv. 2021, 59, 102375. [Google Scholar] [CrossRef]
  6. Zaman, G.; Panait, M.C.; Voica, M.C.; Ene, C. Corporate social responsibility in the agri-food sector. In Research Anthology on Strategies for Achieving Agricultural Sustainability; Information Resources Management Association, Ed.; IGI Global: Hershey, PA, USA, 2020; pp. 815–840. [Google Scholar]
  7. Singh, A.; Glińska-Neweś, A. Modeling the public attitude towards organic foods: A big data and text mining approach. J. Big Data 2022, 9, 2. [Google Scholar] [CrossRef]
  8. Gunduz, O.; Bayramoglu, Z. Consumer’s willingness to pay for organic chicken meat in Samsun Province of Turkey. J. Anim. Vet. Adv. 2011, 10, 334–340. [Google Scholar] [CrossRef]
  9. Yang, Y.-C. Factors affecting consumers’ willingness to pay for animal welfare eggs in Taiwan. Int. Food Agribus. Manag. Rev. 2018, 21, 741–754. [Google Scholar] [CrossRef]
  10. Pawlewicz, A. Change of price premiums trend for organic food products: The example of the polish egg market. Agriculture 2020, 10, 35. [Google Scholar] [CrossRef]
  11. Rizzo, G.; Borrello, M.; Guccione, G.D.; Schifani, G.; Cembalo, L. Organic food consumption: The relevance of the health attribute. Sustainability 2020, 12, 595. [Google Scholar] [CrossRef]
  12. Coppola, G.; Costantini, M.; Orsi, L.; Facchinetti, D.; Santoro, F.; Pessina, D.; Bacenetti, J. A comparative cost-benefit analysis of conventional and organic hazelnuts production systems in center Italy. Agriculture 2020, 10, 409. [Google Scholar] [CrossRef]
  13. Bernabéu, R.; Brugarolas, M.; Martínez-Carrasco, L.; Nieto-Villegas, R.; Rabadán, A. The price of organic foods as a limiting factor of the European green deal: The case of tomatoes in Spain. Sustainability 2023, 15, 3238. [Google Scholar] [CrossRef]
  14. Heng, Y.; Peterson, H.H.; Li, X. Consumer attitudes toward farm-animal welfare: The case of laying hens. J. Agric. Resour. Econ. 2013, 38, 418–434. [Google Scholar]
  15. Linder, M.O.; Sidali, K.L.; Fischer, C.; Gauly, M.; Busch, G. Assessing Italians’ preferences for mountain beef production using a best–worst scaling approach. Mt. Res. Dev. 2022, 42, R8–R15. [Google Scholar] [CrossRef]
  16. Ajzen, I. From intentions to actions: A theory of planned behavior. In Action Control: From Cognition to Behavior; Kuhl, J., Beckmann, J., Eds.; Springer-Verlag: New York, NY, USA, 1985; pp. 11–39. [Google Scholar]
  17. Aungatichart, N.; Fukushige, A.; Aryupong, M. Mediating role of consumer identity between factors influencing purchase intention and actual behavior in organic food consumption in Thailand. Pakistan J. Commer. Soc. Sci. 2020, 14, 424–449. [Google Scholar]
  18. Trieste, L.; Bazzani, A.; Amato, A.; Faraguna, U.; Turchetti, G. Food literacy and food choice—A survey-based psychometric profiling of consumer behaviour. Br. Food J. 2021, 123, 124–141. [Google Scholar] [CrossRef]
  19. Ruiz de Maya, S.; López-López, I.; Munuera, J.L. Organic food consumption in Europe: International segmentation based on value system differences. Ecol. Econ. 2011, 70, 1767–1775. [Google Scholar] [CrossRef]
  20. Al-Swidi, A.; Huque, S.M.R.; Hafeez, M.H.; Shariff, M.N.M. The role of subjective norms in theory of planned behavior in the context of organic food consumption. Br. Food J. 2014, 116, 1561–1580. [Google Scholar] [CrossRef]
  21. Kabir, M.R.; Islam, S. Behavioural intention to purchase organic food: Bangladeshi consumers’ perspective. Br. Food J. 2022, 124, 754–774. [Google Scholar] [CrossRef]
  22. Jang, M.; Berry, D. Overweight, obesity, and metabolic syndrome in adults and children in South Korea: A review of the literature. Clin. Nurs. Res. 2011, 20, 276–291. [Google Scholar] [CrossRef]
  23. Lee, Y.; Kim, T.; Jung, H. The relationships between food literacy, health promotion literacy and healthy eating habits among young adults in South Korea. Foods 2022, 11, 2467. [Google Scholar] [CrossRef]
  24. Trexler, C.J.; Hess, A.J. 15 Years of agricultural literacy research: Has the profession only focused on a partial picture of what it means to be literate? National Center for Agricultural Literacy. 2004. Available online: http://www.agedweb.org/WRAEC/2004/WRAEC/Proceedings/Final%20Papers/22Trexler.doc (accessed on 25 February 2023).
  25. Gallegos, D.; Vidgen, H. Food literacy: Time for a new term or just another buzzword? J. Home Econ. Inst. Aust. 2010, 17, 2–8. [Google Scholar]
  26. Frick, M.J.; Kahler, A.A.; Miller, W.W. A definition and the concepts of agricultural literacy. J. Agric. Educ. 1991, 32, 44–53. [Google Scholar] [CrossRef]
  27. Vidgen, H.A.; Gallegos, D. Defining food literacy and its components. Appetite 2014, 76, 50–59. [Google Scholar] [CrossRef] [PubMed]
  28. Sustainable Development Commission (SDC). Sustainability Implications of the Little Red Tractor Scheme; Sustainable Development Commission: London, UK, 2005. [Google Scholar]
  29. Berry, W.E. The Pleasures of Eating. What Are People for? Essays; North Point Press: New York, NY, USA, 1990; Available online: https://thecontraryfarmer.wordpress.com/2009/12/10/the-pleasures-of-eating-wendell-berry/ (accessed on 26 February 2023).
  30. Crockett, S.J.; Sims, L.S. Environmental influences on children’s eating. J. Nutr. Educ. 1995, 27, 235–249. [Google Scholar] [CrossRef]
  31. Zhang, R.; Yu, X.; Yu, Y.; Guo, D.; He, H.; Zhao, Y.; Zhu, W. Family food environments and their association with primary and secondary students’ food consumption in Beijing, China: A cross-sectional study. Nutrients 2022, 14, 1970. [Google Scholar] [CrossRef]
  32. Gadema, Z.; Oglethorpe, D. The use and usefulness of carbon labelling food: A policy perspective from a survey of UK supermarket shoppers. Food Policy 2011, 36, 815–822. [Google Scholar] [CrossRef]
  33. Johansson, E.; Hussain, A.; Kuktaite, R.; Andersson, S.C.; Olsson, M.E. Contribution of organically grown crops to human health. Int. J. Environ. Res. Public Health 2014, 11, 3870–3893. [Google Scholar] [CrossRef]
  34. Pringle, P.; Conway, D. Voices from the frontline: The role of community-generated information in delivering climate adaptation and development objectives at project level. Clim. Dev. 2012, 4, 104–113. [Google Scholar] [CrossRef]
  35. Zhang, Y.; Li, J.; Xu, B. Designing buy-online-and-pick-up-in-store (BOPS) contract of dual-channel low-carbon supply chain considering consumers’ low-carbon preference. Math. Probl. Eng. 2020, 2020, 7476019. [Google Scholar] [CrossRef]
  36. Erdal, B.; Turhan, S.; Guldas, M.; Kilic, T. Motivation and health in the embodiment of organic food consumption trends. Fresenius Environ. Bull. 2020, 29, 5523–5529. [Google Scholar]
  37. Rana, J.; Paul, J. Consumer behavior and purchase intention for organic food: A review and research agenda. J. Retail. Consum. Serv. 2017, 38, 157–165. [Google Scholar] [CrossRef]
  38. Fishbein, M.; Ajzen, I. Belief, Attitude, Intention and Behavior: An Introduction to Theory and Research; Addison-Wesley: Boston, MA, USA, 1975. [Google Scholar]
  39. Ajzen, I. The theory of planned behavior. Organ. Behav. Hum. Decis. Process. 1991, 50, 179–211. [Google Scholar] [CrossRef]
  40. Roșu, M.-M.; Ianole-Călin, R.; Dinescu, R.; Bratu, A.; Papuc, R.-M.; Cosma, A. Understanding consumer stockpiling during the COVID-19 outbreak through the theory of planned behavior. Mathematics 2021, 9, 1950. [Google Scholar] [CrossRef]
  41. Lentz, G.; Connelly, S.; Mirosa, M.; Jowett, T. Gauging attitudes and behaviours: Meat consumption and potential reduction. Appetite 2018, 127, 230–241. [Google Scholar] [CrossRef] [PubMed]
  42. Ajzen, I.; Driver, B.L. Application of the theory of planned behavior to leisure choice. J. Leis. Res. 1992, 24, 207–224. [Google Scholar] [CrossRef]
  43. Conner, M.; Kirk, S.F.L.; Cade, J.E.; Barrett, J.H. Environmental influences: Factors influencing a woman’s decision to use dietary supplements. J. Nutr. 2003, 133, 1978S–1982S. [Google Scholar] [CrossRef] [PubMed]
  44. Netemeyer, R.G.; Burton, S. Examining the relationships between voting behavior, intention, perceived behavioral control, and expectation. J. Appl. Soc. Psychol. 1990, 20, 661–680. [Google Scholar] [CrossRef]
  45. Govaerts, F.; Olsen, S.O. Consumers’ values, attitudes and behaviours towards consuming seaweed food products: The effects of perceived naturalness, uniqueness, and behavioural control. Food Res. Int. 2023, 165, 112417. [Google Scholar] [CrossRef]
  46. Beldad, A.; Hegner, S. A steak for supper if the cow did not suffer: Understanding the mechanisms behind people’s intention to purchase animal welfare-friendly (AWF) meat products. J. Agric. Environ. Ethics 2020, 33, 461–486. [Google Scholar] [CrossRef]
  47. Genevie, E.R.; Ungku Zainal Abidin, U.F.; Lihan, S.; Jambari, N.N.; Radu, S. Predicting intention on safe food handling among adult consumers: A cross sectional study in Sibu district, Malaysia. Food Control 2019, 106, 106696. [Google Scholar] [CrossRef]
  48. Jalambadani, Z.; Garmarodi, G.; Yaseri, M.; Tavousi, M.; Jafarian, K. The effect of education on reducing fast food consumption in obese Iranian female adolescents: An application of the transtheoretical model and the theory of planned behaviour. Iran. Red Crescent Med. J. 2017, 19, e13017. [Google Scholar] [CrossRef]
  49. Stranieri, S.; Ricci, E.C.; Stiletto, A.; Trestini, S. How about choosing environmentally friendly beef? exploring purchase intentions among Italian consumers. Renew. Agric. Food Syst. 2023, 38, e2. [Google Scholar]
  50. Khani Jeihooni, A.; Jormand, H.; Saadat, N.; Hatami, M.; Manaf, R.A.; Harsini, P.A. The application of the theory of planned behavior to nutritional behaviors related to cardiovascular disease among the women. BMC Cardiovasc. Disord. 2021, 21, 589. [Google Scholar] [CrossRef] [PubMed]
  51. Nova, P.; Pinto, E.; Chaves, B.; Silva, M. Urban organic community gardening to promote environmental sustainability practices and increase fruit, vegetables and organic food consumption. Gac. Sanit. 2020, 34, 4–9. [Google Scholar] [CrossRef] [PubMed]
  52. Premlata, S.; Sudipta, P.; Sukanya, B.; Pulkit, M.; Himanshi, R.; Sangeetha, V. Consumer behavioural intention and perception towards organic foods in national capital of India. Indian J. Agric. Sci. 2019, 89, 588–595. [Google Scholar]
  53. Van Tran, A.T.; Nguyen, N.T. Organic food consumption among households in Hanoi: Importance of situational factors. Sustainability 2021, 13, 12496. [Google Scholar] [CrossRef]
  54. Xing, Y.; Li, M.; Liao, Y. Trust, price sensitivity and consumers’ organic food purchasing behaviour in China. Food Sci. Technol. 2022, 42, e42422. [Google Scholar] [CrossRef]
  55. Yang, K.; Vassanadumrongdee, S. Assessing consumers’ intentions towards green alternatives of disposable packaging: A case study in Beijing and Shanghai. Environ. Sci. Eng. 2022, 2, 339–352. [Google Scholar]
  56. Dominguez-Viera, M.E.; van den Berg, M.; Handgraaf, M.; Donovan, J. Influence of poverty concerns on demand for healthier processed foods: A field experiment in Mexico City. Econ. Hum. Biol. 2023, 49, 101215. [Google Scholar] [CrossRef]
  57. Xu, X.; Wang, S.; Yu, Y. Consumer’s intention to purchase green furniture: Do health consciousness and environmental awareness matter? Sci. Total Environ. 2020, 704, 135275. [Google Scholar] [CrossRef]
  58. Bai, L.; Tang, J.; Yang, Y.; Gong, S. Hygienic food handling intention. An application of the theory of planned behavior in the Chinese cultural context. Food Control 2014, 42, 172–180. [Google Scholar]
  59. Luce, R.D.; Tukey, J.W. Simultaneous conjoint measurement: A new type of fundamental measurement. J. Math. Psychol. 1964, 1, 1–27. [Google Scholar] [CrossRef]
  60. Green, P.E.; Rao, V.R. Conjoint measurement-for quantifying judgmental data. J. Mark. Res. 1971, 8, 355–363. [Google Scholar]
  61. Green, P.E.; Srinivasan, V. Conjoint analysis in consumer research: Issues and outlook. J. Consum. Res. 1978, 5, 103–123. [Google Scholar] [CrossRef]
  62. Baker, G.A. Consumer preferences for food safety attributes in fresh apples: Market segments, consumer characteristics, and marketing opportunities. J. Agric. Resour. Econ. 1999, 24, 80–97. [Google Scholar]
  63. Yangui, A.; Akaichi, F.; Costa-Font, M.; Gil, J.M. Comparing results of ranking conjoint analyses, best–worst scaling and discrete choice experiments in a nonhypothetical context. Aust. J. Agric. Resour. Econ. 2019, 63, 221–246. [Google Scholar] [CrossRef]
  64. Batte, M.T.; Hooker, N.H.; Haab, T.C.; Beaverson, J. Putting their money where their mouths are: Consumer willingness to pay for multi-ingredient, processed organic food products. Food Policy 2007, 32, 145–159. [Google Scholar] [CrossRef]
  65. Geng, N.; Liu, Z.; Han, X.; Zhang, X. Influencing factors and group differences of urban consumers’ willingness to pay for low-carbon agricultural products in China. Int. J. Environ. Res. Public Health 2023, 20, 358. [Google Scholar] [CrossRef]
  66. Japutra, A.; Vidal-Branco, M.; Higueras-Castillo, E.; Molinillo, S. Unraveling the mechanism to develop health consciousness from organic food: A cross-comparison of Brazilian and Spanish millennials. Br. Food J. 2021, 124, 197–220. [Google Scholar] [CrossRef]
  67. Kriwy, P.; Mecking, R.-A. Health and environmental consciousness, Costs of behaviour and the purchase of organic food. Int. J. Consum. Stud. 2012, 36, 30–37. [Google Scholar] [CrossRef]
  68. Meas, T.; Hu, W.; Batte, M.T.; Woods, T.A.; Ernst, S. Substitutes or complements? Consumer preference for local and organic food attributes. Am. J. Agric. Econ. 2015, 97, 1044–1071. [Google Scholar]
  69. Sakagami, M.; Haas, R. Consumer preferences for organic products in Austria using stated preference methods. Curr. Nutr. Food Sci. 2012, 8, 122–125. [Google Scholar] [CrossRef]
  70. White, K.; Habib, R.; Hardisty, D.J. How to SHIFT consumer behaviors to be more sustainable: A literature review and guiding framework. J. Mark. 2019, 83, 22–49. [Google Scholar] [CrossRef]
  71. Bozzo, G.; Barrasso, R.; Grimaldi, C.A.; Tantillo, G.; Roma, R. Consumer attitudes towards animal welfare and their willingness to pay. Vet. Ital. 2019, 55, 289–297. [Google Scholar] [PubMed]
  72. Kulshreshtha, K.; Sharma, G.; Bajpai, N. Conjoint analysis: The assumptions, applications, concerns, remedies and future research direction. Int. J. Qual. Reliab. Manag. 2023, 40, 607–627. [Google Scholar] [CrossRef]
  73. Uebersax, J.S. Likert scales: Dispelling the confusion. Statistical Methods for Rater Agreement. 2006. Available online: http://john-uebersax.com/stat/likert.htm (accessed on 2 March 2023).
  74. Chung, J.; Eoh, J. Naming strategies as a tool for communication: Application to movie titles. Int. J. Advert. 2019, 38, 1139–1152. [Google Scholar] [CrossRef]
  75. Stoner, J.L.; Loken, B.; Blank, A.S. The name game: How naming products increases psychological ownership and subsequent consumer evaluations. J. Consum. Psychol. 2018, 28, 130–137. [Google Scholar] [CrossRef]
  76. National Statistics, R.O.C. (Taiwan). The Survey of Family Income and Expenditure; National Statistics, R.O.C.: Taiwan, 2023. Available online: https://www.stat.gov.tw/News.aspx?n=3908&sms=11530 (accessed on 20 March 2023).
Figure 1. The framework of the theory of planned behavior and conjoint analysis. Source: Designed by this study and rearranged from Ajzen [39].
Agriculture 13 01743 g001
Figure 2. An illustration of a basket of agricultural goods used in the questionnaire.
Agriculture 13 01743 g002
Figure 3. Price premium for each feature of the agricultural goods in the baskets and its share of the total price premium for each basket.
Agriculture 13 01743 g003
Figure 4. The relationship between WTP for a basket of agricultural goods and the total score for each factor according to the theory of planned behavior.
Agriculture 13 01743 g004
Table 1. Survey questions for each factor according to the theory of planned behavior.
ConceptQuestion
Attitude
  • The agricultural good produced is friendly to the environment and also benefits my health.
  • There is a positive impact on environmental protection by reducing kitchen waste.
  • There should be enough space to raise poultry and livestock.
  • It will be harmful to the environment and health of human beings if chemical pesticides and fertilizers for cultivating agricultural goods are used.
  • The product will assist in the sustainable development of the environment by reducing the consumption of meat products.
Subjective norms
  • I pay much attention to the health of my friends and relatives.
  • My friends and relatives normally care a lot about the information regarding food safety.
  • I normally consume those agricultural goods with labels with organic or certified agricultural standards.
  • I will cooperate with the policy and reduce using one-time use plastic types of products.
  • I will refuse to purchase the agricultural goods if the farm treats poultry or livestock improperly or inhumanely.
Perceived behavioral control
  • I fully understand the production information for those agricultural goods that I consume.
  • I have enough income to purchase healthy agricultural products.
  • It is easy for me to purchase agricultural goods produced in a friendly environment.
  • I always pay attention to additives when I consume processed agricultural goods.
  • Understanding the production process will assist me when selecting agricultural goods.
Table 2. Price combination of each basket of agricultural goods.
Product Basket NumberWhite RiceLeaf VegetableHen’s EggChicken
Drumstick
Soy SauceJamPrice
(TWD)
1Organicregularanimal welfarecageregularno additives600
2Regularregularanimal welfareanimal welfareno additivesno additives900
3Regularregularcageanimal welfareregularno additives600
4Regularorganiccageanimal welfareno additivesRegular600
5Regularorganiccagecageno additivesno additives700
6Organicregularanimal welfareanimal welfareregularRegular800
7Organicregularcagecageno additivesno additives800
8Organicorganiccageanimal welfareregularno additives700
9RegularregularcagecageregularRegular500
Table 3. Notations, definitions, and averages of all variables used in the analyses.
NotationDefinitionAverageStandard
Deviation
A t T Total score of 5–25, with 5 questions regarding attitude toward features of agricultural goods
(Likert scale with 5 for very much agree, 4 for agree, 3 for normal, 2 for disagree, and 1 for very much disagree)
20.97542.6107
S u T Total score of 5–25 with 5 questions regarding subjective norm (scale measured in the same way as that for attitude)20.10942.9793
P e T Total score of 5–25 with 5 questions regarding perceived behavioral control (scale measured in the same way as that for attitude)18.72102.9371
A n i When the respondent consumes poultry or livestock, they will consider the environmental harm to the welfare and health of animals (Likert scale with 5 for very frequently, 4 for always, 3 for sometimes, 2 for rarely, and 1 for almost never)2.80801.0571
E v e n t How often the respondent attends activities, events, or lectures regarding environmentally friendly farming, the animal welfare of livestock or poultry, and human health, measured in the same manner as for the variable A n i 2.12281.0768
R I Dummy variable for white rice feature,
with 1 for organic and 0 otherwise
0.48660.5004
V E Dummy variable for leaf vegetables feature,
with 1 for organic and 0 otherwise
0.49110.5005
E G Dummy variable for hens’ eggs feature,
with 1 for animal welfare-bred and 0 otherwise
0.31030.4631
C H Dummy variable for chicken drumsticks feature,
with 1 for animal welfare-bred and 0 otherwise
0.58260.4937
S A Dummy variable for soy sauce,
with 1 for no additives and 0 otherwise
0.42190.4944
J A Dummy variable for jam,
with 1 for no additives and 0 otherwise
0.61830.4863
P r i c e Average total price for a basket of 6 regular products (the reference basket)675.4464106.0783
C i t y Dummy variable for the respondent’s city,
with 1 for Taipei City and 0 for New Taipei City
0.39290.4889
G e n Dummy variable for gender,
with 1 for male and 0 otherwise
0.37280.4841
A g e Age of respondent (in years)47.390614.7392
F a m i l y Total number of family members living together3.52681.6760
C D 1 CD1 = 1 if the respondent is an employee in any type of
manufacturing company, and CD1 = 0 otherwise
0.14460.3521
C D 2 CD2 = 1 if the respondent is an employee in the financial sector, and CD2 = 0 otherwise0.20310.4028
C D 3 CD3 = 1 if the respondent is an employee in any service sector, and CD3 = 0 otherwise0.26120.4398
C D 4 CD4 = 1 if the respondent is a freelancer, and CD4 = 0 otherwise0.08260.2756
C D 5 CD5 = 1 if the respondent is an employee in the restaurant industry, and CD5 = 0 otherwise0.18750.3907
C D 6 CD6 = 1 if the respondent is a student, housekeeper, or retired person, and CD6 = 0 otherwise0.05800.2341
I n c Household monthly income (TWD/month)100,859.375065,918.8054
Note: The reference group comprises civil servants, teachers, soldiers, and policemen.
Table 4. Coefficient estimation of price premium and WTP according to the theory of planned behavior †.
VariableEstimated CoefficientStandard ErrorZ-Value
A S C 9.00004 ***2.959133.04
R I 0.99703 *0.518761.92
V E 0.82926 **0.408752.03
E G 0.94615 **0.448842.11
C H 1.59752 ***0.529993.01
S A 1.79334 ***0.674812.66
J A 0.689190.470101.47
P r i c e −0.00785 ***0.00243−3.23
A S C A t T −10.29220 ***3.79680−2.71
R I A t T −1.24480 *0.65771−1.89
V E A t T 0.503740.515720.98
E G A t T −0.254140.57168−0.44
C H A t T −2.26546 ***0.65301−3.47
S A A t T −1.80294 **0.82789−2.18
J A A t T −1.18618 **0.56689−2.09
P r i c e A t T 0.003850.002941.31
A S C S u T −0.658363.54035−0.19
R I S u T 0.720560.602431.20
V E S u T −0.076590.48759−0.16
E G S u T −0.280040.55449−0.51
C H S u T 0.241420.587070.41
S A S u T −0.305100.76108−0.40
J A S u T −0.130300.53200−0.24
P r i c e S u T 0.000260.002580.10
A S C P e T 6.23160 *3.532161.76
R I P e T 0.537110.593190.91
V E P e T 1.02280 **0.509122.01
E G P e T 0.819910.571681.43
C H P e T 0.234220.556170.42
S A P e T −0.187720.75597−0.25
J A P e T 0.726510.490811.48
P r i c e P e T 0.00793 ***0.002443.25
Log-likelihood function−478.56102
n = 448
Note †: Numbers with *, **, and *** indicate that the estimated coefficients are significantly different from zero at the 10%, 5%, and 1% significance levels, respectively. The price premium can then be computed for white rice ( R I ), leaf vegetables ( V E ), hens’ eggs ( E G ), chicken drumsticks ( C H ), soy sauce ( S A ), and jam ( J A ), with organic, animal welfare-based, or no-additive features. Estimates of the price premium for the multi-features of each agricultural product can thus be computed accordingly. It will then be possible to compute the estimated WTP for the basket of agricultural goods that each respondent selects.
Table 5. Coefficients estimation of a respondent’s general view regarding environmental protection and animal welfare, the factors of the TPB, and sociodemographic variables †.
VariableEstimated CoefficientStandard ErrorZ-Value
C o n s t 427.9524 ***50.31198.51
A n i 10.8398 *6.19661.75
E n e n t −12.8922 **5.9631−2.16
A t T 51.8181 ***2.681819.32
S u T 3.11522.72751.14
P e T −51.6884 ***2.4005−21.53
C i t y 30.0940 ***11.10472.71
G e n −10.549510.8851−0.97
A g e −0.18400.4022−0.46
F a m i l y −3.40862.7149−1.26
C D 1 19.408424.66950.79
C D 2 56.7469 ***23.55542.41
C D 3 42.4817 **23.26351.83
C D 4 4.351224.89250.17
C D 5 28.135324.23861.04
C D 6 20.139128.33270.71
I n c 0.00010.000091.43
R2 = 0.6851
n = 448
Note †: Numbers with *, **, and *** indicate that the estimated coefficients are significantly different from zero at the 10%, 5%, and 1% significance levels, respectively.
Table 6. Estimated price premium for specific features in different baskets of agricultural goods a.
FeatureAverage Price Premium of Each Feature in Each Basket of Agri-Food Combinations (TWD) b
Basket 1Basket 2Basket 3Basket 4Basket 5Basket 6Basket 7Basket 8Basket 9 c
Organic white rice1.64
(1.82%)
------------3.85
(2.65%)
3.47
(1.09%)
−0.54
(−0.38%)
---
Organic leaf vegetable---------−128.26
(−52.52%)
−128.21
(−67.49%)
------−127.60
(−90.78%)
---
Hen’s eggs from chickens bred in animal welfare-based conditions−23.60
(−26.23%)
−25.98
(−6.03%)
---------−22.61
(−15.55%)
---------
Drumsticks from chickens bred in animal welfare-based conditions---153.72
(35.68%)
171.21
(59.22%)
166.73
(68.27%)
---164.16
(112.90%)
---158.06
(112.45%)
---
Soy sauce without additives---195.20
(45.32%)
---205.76
(84.25%)
204.00
(107.39%)
---202.60
(63.49%)
------
Jam without additives111.95
(124.40%)
107.82
(25.03%)
117.90
(40.78%)
---114.17
(60.10%)
---113.04
(35.42%)
110.64
(78.71%)
---
Total WTP for the basket of agricultural goods with quality features d542.36
(20.94%)
840.07
(54.37%)
802.29
(36.04%)
730.39
(51.00%)
666.84
(47.71%)
616.16
(27.27%)
783.93
(40.71%)
578.69
(46.43%)
---
Note a: Numbers in parentheses are the percentages that the price premium for a specific feature takes as a share of the total price premium for that basket of agricultural goods. Note b: The notation “---” indicates that the agricultural goods in the basket are of the regular type. That is, there is no quality feature in this specific basket of agricultural goods. Note c: Basket 9 is the reference basket for all regular agricultural goods, without any products with quality features. Note d: Numbers in parentheses are the summation of the positive price premium for all quality features, compared to the total WTP for a specific basket of agricultural goods.
Disclaimer/Publisher’s Note: The statements, opinions and data contained in all publications are solely those of the individual author(s) and contributor(s) and not of MDPI and/or the editor(s). MDPI and/or the editor(s) disclaim responsibility for any injury to people or property resulting from any ideas, methods, instructions or products referred to in the content.

