Article

Phosphate Fertilizer Type and Liming Affect the Growth and Phosphorus Uptake of Two Maize Cultivars

1
Department of Agronomy (340 a), Institute of Crop Science, University of Hohenheim, 70599 Stuttgart, Germany
2
Department of Fertilization and Soil Matter Dynamics (340 i), Institute of Crop Science, University of Hohenheim, 70599 Stuttgart, Germany
3
Biostatistics Unit, Institute for Crop Science, University of Hohenheim, 70599 Stuttgart, Germany
4
College of Agronomy and Biotechnology, China Agricultural University, Beijing 100193, China
*
Author to whom correspondence should be addressed.
Agriculture 2023, 13(9), 1771; https://doi.org/10.3390/agriculture13091771
Submission received: 4 August 2023 / Revised: 31 August 2023 / Accepted: 5 September 2023 / Published: 7 September 2023
(This article belongs to the Section Crop Production)

Abstract

:
In the context of phosphorus (P) exhaustion and low P use efficiency (PUE) in crop production, a field trial was designed on a low-P soil in southwestern Germany in 2020 and 2021 to investigate the effects of P fertilizer type and liming on maize growth and P uptake and PUE. The experimental factors were (i) two P fertilizer types, rock phosphate (RP) and diammonium phosphate (DAP); (ii) lime application, lime and no lime; and (iii) two maize cultivars. The results showed that RP resulted in a lower leaf area index and light interception compared with DAP, a 33% lower silage yield, and a 29% lower P content at harvest. The PUE of RP was 18%, which was 37% lower than DAP. Soil liming reduced shoot biomass and led to 35% less shoot P content at the six-leaf stage. The maize cultivar Stabil expressed higher yielding and P acquisition characteristics. In conclusion, DAP cannot be replaced by placed RP, regardless of the lime application in silage maize production in this study. Future research on the PUE of maize cultivars should also consider root characteristics in response to P fertilizer type and soil pH.

1. Introduction

Phosphorus (P) is an essential macronutrient for plant growth which is non-substitutable and non-renewable. However, P is characterized by low bioavailability, and most P is fixed in soils; thus, the P use efficiency (PUE) of plants is still quite low. and P plays a limiting role in plant growth in most cropping systems [1,2,3]. Additionally, it is estimated that the reserves of rock phosphate (RP) from which P is extracted for fertilizer production will be exhausted during the next 300 to 400 years [4,5].
In crop production, the physical and chemical properties of the applied P-fertilizers are important factors for solubility and thus plant availability. Owing to differences in water solubility, the crop PUE of RP is low, whereas that of diammonium phosphate (DAP) is high [6,7,8]. During the process from the mining of RP to the production of P-rich fertilizers like DAP, around 16% of the initial P is lost as monoammonium phosphate to the environment [9]. Fertilizing with DAP may be desirable due to its high PUE and thus its potential for higher crop yields, but it may be less attractive in comparison to RP due to the larger environmental footprint associated with its use [8]. Therefore, a cropping system designed to improve the PUE of RP will not only save costs associated with a more expensive water-soluble P fertilizer like DAP, but in addition will reduce P losses in the production chain, thus reducing the environmental impact of crop production. Localized P fertilizer application could effectively enhance the effect of fertilizer on plant growth, resulting in root proliferation and higher yields of maize [10,11,12,13].
Soil pH is another factor that influences the bioavailability of soil P for plant growth, and therefore the PUE of fertilizers. It is called the “master soil variable” because it influences a large number of soil biological, chemical, and physical properties and processes, which affect the bioavailability of P from soil, and thus plant growth and biomass yield [14]. Soil liming has been used in many studies to modify soil pH, and thus plant P availability and crop P uptake [15,16,17]. The influence of soil pH on soil plant-available P is mainly expressed as changes in the ratio of H2PO4 to HPO42− in soil. The uptake rate for HPO42− was around one-tenth of H2PO4 when soil pH varied from 4.7 to 8.3 [18]. On the other hand, P uptake by plant roots increases with the decrease in soil pH, and is most effective at pH close to 5, where H2PO4 dominates in soil [19,20]. The utilization of sparingly soluble phosphate, e.g., rock phosphate (RP), can be improved by a soil pH of 6 or lower [15,17,19]. However, the P uptake of applied DAP is better in neutral soil (pH 7.2) than acidic soil (pH 5.0) [20]. Therefore, adjusting soil pH via the application of lime may be a potential strategy to alter the plant-availability of soil P and affect the utilization of RP for maize growth [17,18,21,22].
Maize (Zea mays L.) is sensitive to low plant-available soil P levels. The growth and development processes of maize can be irreversibly limited under conditions of P deficiency, especially in the early growth stages, e.g., reduced leaf area expansion, and thus lower light interception and biomass accumulation [1,23,24]. As a consequence of maize breeding over the last few decades, the roots of modern maize genotypes exude lower amounts of beneficial organic anions to mobilize soil P under limited P supply than older genotypes, resulting in lower PUE [25,26]. Several studies have shown that variations in PUE exist between cultivars, resulting from differences in root systems, biomass accumulation, and tolerance to soil P deficiency [25,27,28]. Weiß et al. [29] investigated the interaction between maize cultivars and starter-P fertilizer in a multi-location field study, and showed that the best-performing cultivar can be identified irrespective of the presence of starter-P fertilizer. Different cultivars were grouped in different categories: high yielding P utilizers, low yielding cultivars independent of P-supply, and P-sensitive cultivars. Therefore, selection of efficient P utilizers plays an important role in improving maize yields under moderate to low soil P conditions [29,30].
Therefore, this study investigated the impact of two P fertilizer types, DAP and RP, in combination with soil liming on the growth, P uptake, and silage yield of two maize cultivars in a low-P soil.

2. Materials and Methods

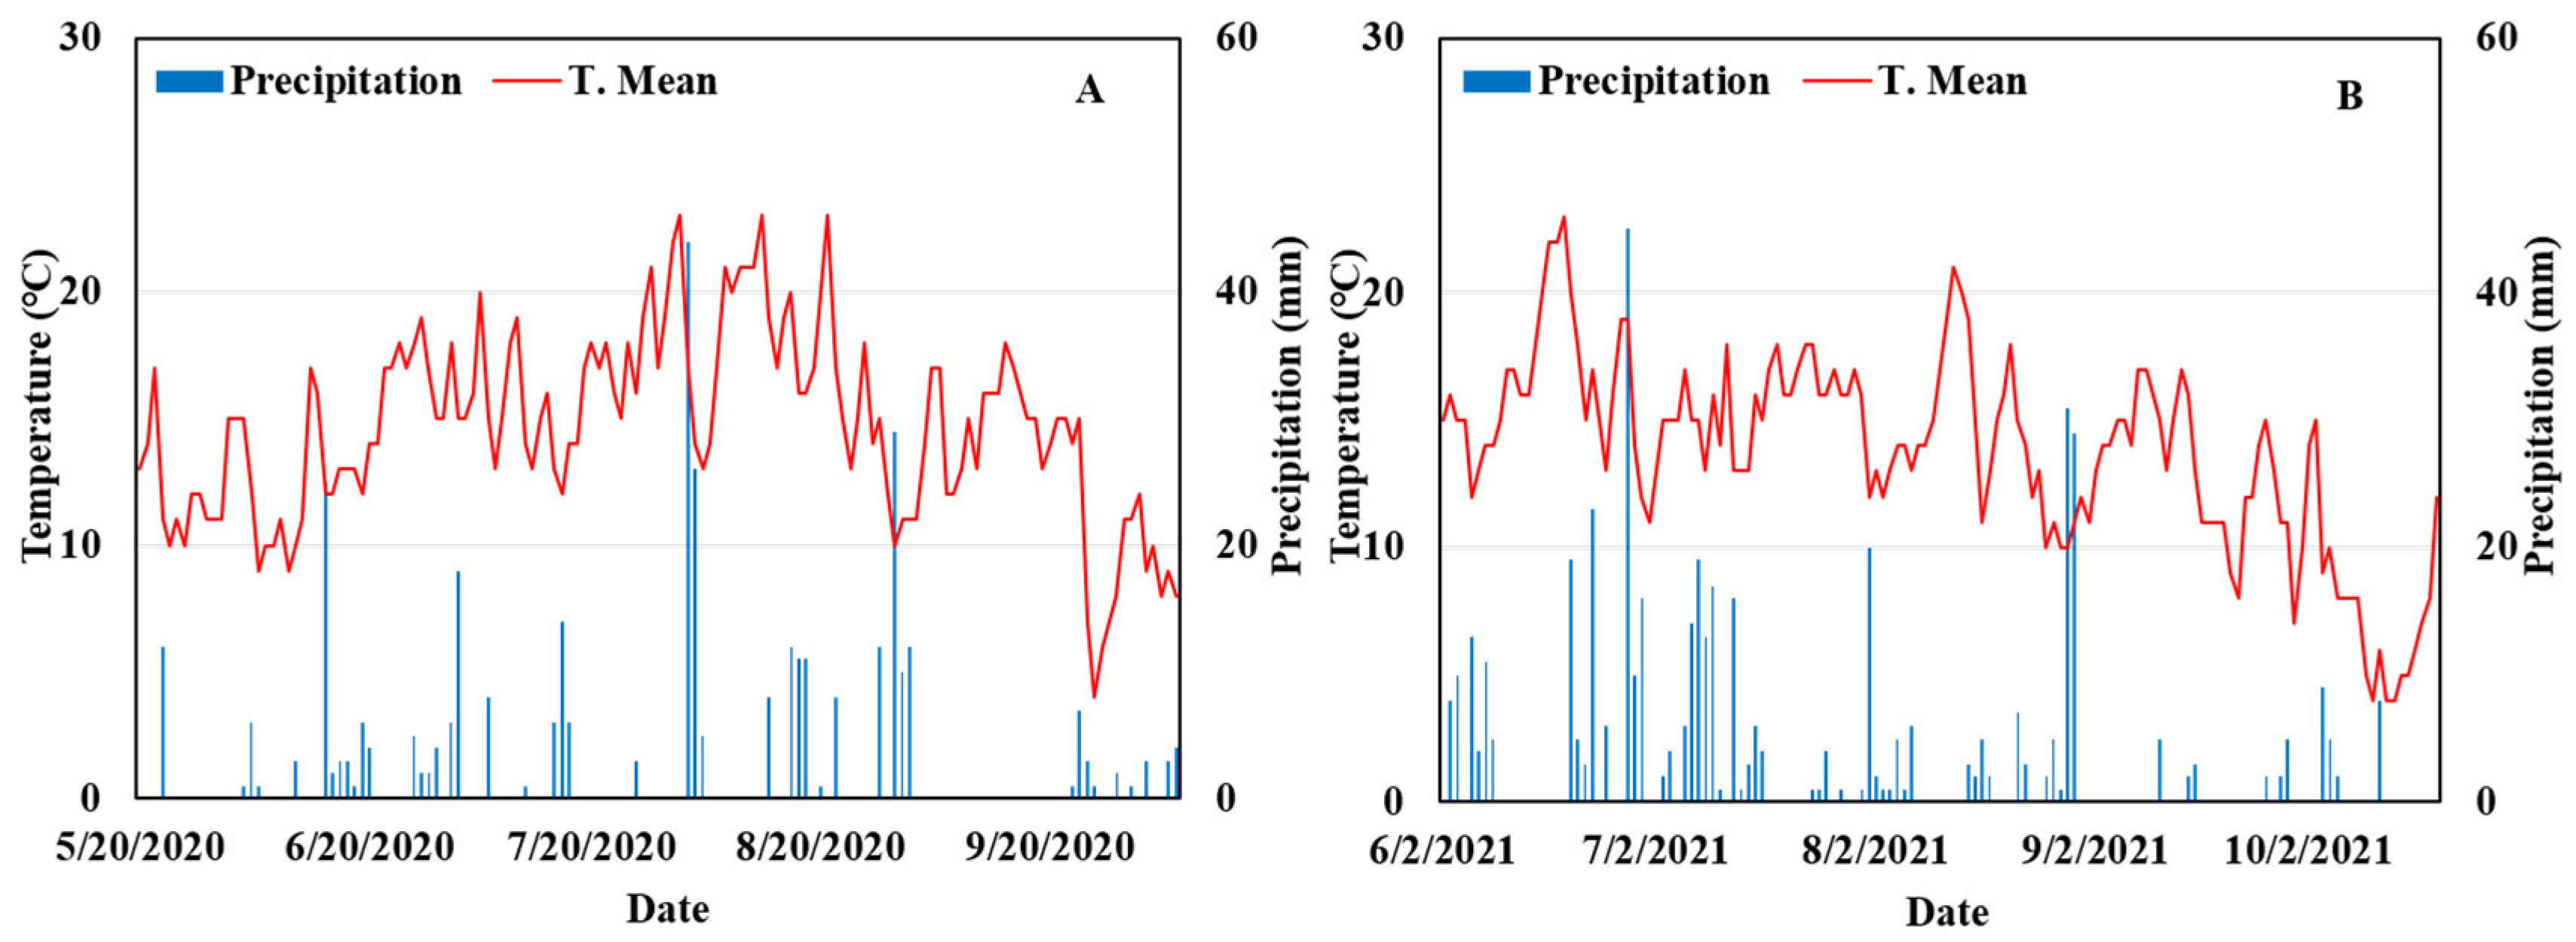
2.1. Experimental Site

The field experiments were conducted in southwestern Germany at the research station Oberer Lindenhof (48°28′26″ N, 9°18′12″ E) of the University of Hohenheim in 2020 and 2021. The site was selected due to its very low soil plant-available P level, defined as 0.9 mg P per 100 g−1 soil dry matter (DM) in the top 0–30 cm (using the calcium-acetate-lactate method (CAL)), which corresponds to the lowest class “A” (very poor), according to the classification system used in Germany [31]. During the growing season, the mean temperature and total precipitation were 14.6 °C and 356 mm in 2020 and 13.8 °C and 461 mm in 2021, respectively. The weather in 2021 in the first period was characterized by higher temperatures, and frequent and more precipitation than in 2020 (Figure 1).
The field experiments were set up in both years on the same field. The field was split into two halves, one for each year. Soil samples at three depths (0–30 cm, 30–60 cm, and 60–90 cm) were collected from the field on 8 April 2020 and 10 May 2021, and the soil properties were analyzed each year before sowing (Table 1). According to a soil texture analysis of the entire field, the soil was categorized as silty clay loam with a bulk density of 1.3–1.4 g cm−3. The average soil pH in 0–30 cm depth for both years was 5. In the two years, mineral nitrogen contents (Nmin) from 0–90 cm depth were 66 and 79 kg N ha−1, respectively. Plant-available P (measured as CAL-P) was consistently within the lowest class “A”.

2.2. Field Experiments

In 2020, the field trial was a 2 × 2 × 2 factorial design of eight treatments tested in four replicates. The experimental factors were (i) P fertilizer type, rock phosphate (RP, Dolophos® 26; NATURKALK, Barbing, Germany) and diammonium phosphate (DAP, 18% N–20% P, DAP; Van de Reijt Meststoffen B.V., Moerdijk, The Netherlands); (ii) maize cultivar (Zea mays L. cv. Stabil (high-yielding P utilizer) and Ricardinio (P-sensitive cultivar) (both from KWS SAAT SE & Co. KGaA, Einbeck, Germany); and (iii) liming, no lime application and 16,800 kg CaCO3 ha−1 lime application (75% CaCO3 and 15% MgCO3, Kohlensaurer Magnesiumkalk 90; Zement- und Kalkwerke Otterbein GmbH & Co. KG, Grossenlüder-Müs, Germany). The two cultivars were chosen due to their difference in terms of yield response to P fertilizer and P uptake [29]. The change in soil pH from 0–10 cm was 4.9 for no lime treatment and 6.0 for lime treatment at the six-leaf stage. Treatments were allocated to plots according to a design comparable to a split-plot design, where the combination of lime application and maize cultivar was used as the main plot and the P fertilizer type as subplot factors. In contrast to a common split-plot design, wherein main plots are randomized according to a randomized complete block design, the main plot factor combinations were randomized as a Latin square design. The 16 main-plots were arranged in a 4 × 4 grid. Each main plot is split into two plots. In total, there were 32 plots each, with an area of 66 m2 (11 m length × 6 m width) (Figure S1).
In 2021, control plots with no P fertilizer were included as another level of the factor P fertilizer type, giving a total of 48 plots. A total of six main plots were arranged in a randomized complete block design with complete blocks within a row. Due to space limitation, the area of the control sub-plots was 33 m2 (11 m length × 3 m width), whereas the area of the other sub-plots was kept the same as in 2020, at 66 m2 (Figure S2).
The application amount of P fertilizer was 75 kg P ha−1 in both years. RP was co-placed with stabilized ammonium sulfate fertilizer (21% N, NovaTec® Solub 21; Compo Expert, Münster, Germany) to achieve the same N quantity (68 kg N ha−1) as is present in DAP. For the DAP treatment, N and P were applied as DAP. DAP and RP + stabilized NH4-N were each locally placed at 5 cm to the side and 7 cm below the maize seed upon sowing, using a single seed sowing machine equipped for fertilizer placement (Unisem; RAU Landmaschinen GmbH, Korntal-Münchingen, Germany). In 2020, a 46 kg N ha−1 area was treated with urea stabilized with a urease inhibitor (46% N, Alzon® neo-N; SKW Stickstoffwerke Piesteritz GmbH, Lutherstadt Wittenberg, Germany), and 34 kg N ha−1 in 2021, after accounting for soil Nmin (Table 1), in order to meet a total N supply of 180 kg N ha−1 over the whole maize growing season in each year.
After broadcast and incorporation (5 cm depth) of the stabilized urea fertilizer, maize was sown on the same day at 3 cm depth on 20 May 2020 and 2 June 2021 (incl. placement of fertilizer). The sowing density in both years was 100,000 plants ha−1. The inter-row distance was 0.75 m. Silage maize was harvested at 141 days after sowing (DAS) on 7 October 2020 and 20 October 2021.

2.3. Data Collection

Three representative plants were selected from the middle rows of each plot on a bi-weekly basis after sowing in 2020 for the determination of plant leaf area. On the first three dates, plant leaf area was calculated for each plant as the sum of the leaf area of all leaves (n), according to the following:
P l a n t   l e a f   a r e a = i = 1 n ( l e a f   l e n g t h i × m a x i m u m   l e a f   w i d t h i ) × 0.75 ,
where i refers to each single leaf of a plant.
During later samplings, leaf area was measured using a Leaf Area Meter (LI-3100; LI-COR, Lincoln, NE, USA). Leaf area index (LAI) was calculated by multiplying the plant density m−2 with the plant leaf area [32].
At the six-leaf stage (48 DAS in 2020 and 43 DAS in 2021), three selected plants of each plot were cut and dried at 60 °C (VTU 125/200; Vötsch, Borken, Germany) to a constant weight for plant dry shoot biomass. At harvest (141 DAS in 2020 and 2021), a border strip of 1 m width was discarded, all plants from the two adjacent rows in the center of each plot were harvested, and fresh silage biomass was determined using a plot combine harvester (Silager SF2000; Baural, Blois, France). A subsample of around 3000 g fresh silage biomass was weighed and also dried to a constant weight at 60 °C. The silage yield of each treatment was determined using the dry biomass concentration and total fresh silage biomass.
All dried samples were ground using a cutting mill equipped with a 0.5 mm sieve (SM 200; Retsch, Haan, Germany). After microwave digestion, the biomass P concentration was measured via inductively coupled plasma-optical emission spectrometry (5110 ICP-OES; Agilent Technologies Germany GmbH & Co. KG, Waldbronn, Germany). Plant P content was calculated using the P concentration and plant aboveground dry biomass.
The fraction of midday photosynthetically active radiation (PAR) intercepted by the maize canopy was measured with a ceptometer (AccuPAR LP 80; Meter Group Inc., Pullman, WA, USA) to be 65, 93, and 118 DAS in 2020, and 99 DAS in 2021. The ceptometer was placed perpendicular to the row within the center of the plots recording the mean value of PAR at four different positions. The percentage of PAR intercepted by the canopy was calculated for each plot using the formula below [33]:
I   = [ ( I 0 -   R   -   T ) / I 0   ] × 100
where I is the intercepted PAR (%), I0 the incident PAR (μmol m−2 s−1) about 20 cm above the plant canopy, R is the reflected PAR (μmol m−2 s−1) about 20 cm above the canopy with the sensor area facing downwards, and T is the transmitted PAR (μmol m−2 s−1) measured below the plants at the soil surface.

2.4. Statistical Analysis

Data from each year were statistically analyzed according to the experimental design (both field plans are given in Figures S1 and S2). Both trials were randomized as split-plot designs with main plots randomized as a Latin square design in 2020 and as an RCBD in 2021. Both trials include the same three treatment factors. Data were analyzed using a mixed-model approach in SAS v9.4 (SAS Institute, Cary, NC, USA). For 2020, the model is described as follows:
y h i j k l m = μ + r i + c j + m i j + α k + β l + γ m + α β k l + α γ k m + β γ l m + α β γ k l m + e h i j k l m ,
where r i , c j , and m i j represent the design and α k , β l , and γ m represent the three treatment factors. In detail, y h i j k l m is the observation of plot h in the ith row and jth column treated with the kth level of maize cultivar, the lth level of lime application and mth level of P fertilizer,   μ is the intercept, and r i and c j are the fixed effects of the ith complete row and jth column. The term m i j is the random main plot effect associated with the area of two plots in a combination of row and column, α k , β l , and γ m are the fixed main effects of the kth maize cultivar, the lth lime application level and mth P fertilizer, respectively, α β k l , α γ k m , β γ l m , and α β γ k l m are the fixed two- and three-way interaction effects of the corresponding factors involved, and e h i j k l m is the plot error of y h i j k l m . In 2021, the experiment was slightly modified. First, two main plots were added per row as control. The main plot factor was now either a lime application level-by-P fertilizer combination or a lime application level-by-maize cultivar combination. The latter allowed us to test maize cultivar-by-lime application level combinations additionally under the no-fertilizer control treatment. Additionally, PUE can be calculated from the analysis of total P content from the treatment with P application. As the P fertilizer amount was constant at a rate of 75 kg P ha−1, the treatment-to-control difference in total P harvested divided by 75 can be interpreted as the PUE. Second, as control plots were sown with four rows instead of eight rows, data were weighted by the number of rows per plot. The model is similar to [3], but dropping the fixed-column effect and adding a weight statement.
For both statistical analyses, residuals were checked graphically for normal distribution and homogeneous variances. Afterwards, global F tests were performed to test for differences between the levels of main effects and their interaction effects. In cases of significant differences, a Fisher’s LSD test was performed at α = 0.05. The results of the LSD test were presented using a letter display [34]. Additionally, simple means for cultivar-by-lime application-by-P fertilizer combinations were calculated for presentation purposes (Tables S1 and S2 in the Supplementary Materials).

3. Results

3.1. Leaf Area Index and Light Interception

During 2020, leaf area index (LAI) was mainly influenced by P fertilizer (Table S3). From 34 DAS onwards, maize plants supplied with DAP had a higher LAI than those supplied with RP (Figure 2A). Fertilization with DAP resulted in a 30% higher maximum LAI (4.2) compared with RP plots (3.2).
In 2020 and 2021, P fertilizer significantly influenced intercepted midday photosynthetically active radiation (PAR) measured at different growth stages (Table S4). At 65, 93, and 118 DAS in 2020, the intercepted PAR for DAP was 45%, 89%, and 93%, compared with 28%, 77%, and 89% for RP, respectively (Figure 2B). Therefore, DAP contributed to 60%, 17%, and 4% higher intercepted PAR at 65, 93, and 118 DAS. In 2021, the intercepted PAR in the DAP treatment was significantly higher, with 93%, compared to similar values of No-P and RP with around 84%, as measured at 99 DAS. No significant difference in intercepted PAR was found between No-P and RP.

3.2. Biomass Accumulation

The factor P fertilizer was significant for shoot biomass accumulation at the six-leaf stage and the harvest of silage maize in 2020 (Table 2). In 2021, the cultivar factors and the interaction of P fertilizer and lime application were significant.
In 2020, shoot biomass at the six-leaf stage was 2.4 times higher in plots fertilized with DAP compared with RP (Figure 3A). Results were in general similar in 2021; however, within the DAP treatments, shoot biomass was 37% higher without liming compared with the treatment with lime application (Figure 3B). Shoot biomass was around two times higher in plots with No-P*No lime compared with RP and No-P*Lime, both being lower than treatments fertilized with DAP. Significant differences were found between cultivars, with a 30% higher shoot biomass for Stabil compared with Ricardinio across treatments (Figure 3C).
Application of DAP led to a 38% higher silage yield compared with the application of RP in 2020 (Figure 3D). These results were confirmed in 2021 with a higher silage yield with application of DAP in comparison to plots of RP and also No-P (Figure 3E). Lime application resulted in a 15% lower silage yield, indicating the influence of the change in soil pH. Among the combinations of P fertilizer and lime application, No-P*No lime showed a 22% higher silage yield than RP and No-P*Lime, all being lower compared with the application of DAP. At harvest, Stabil produced a 21% higher silage yield than Ricardinio (Figure 3F).

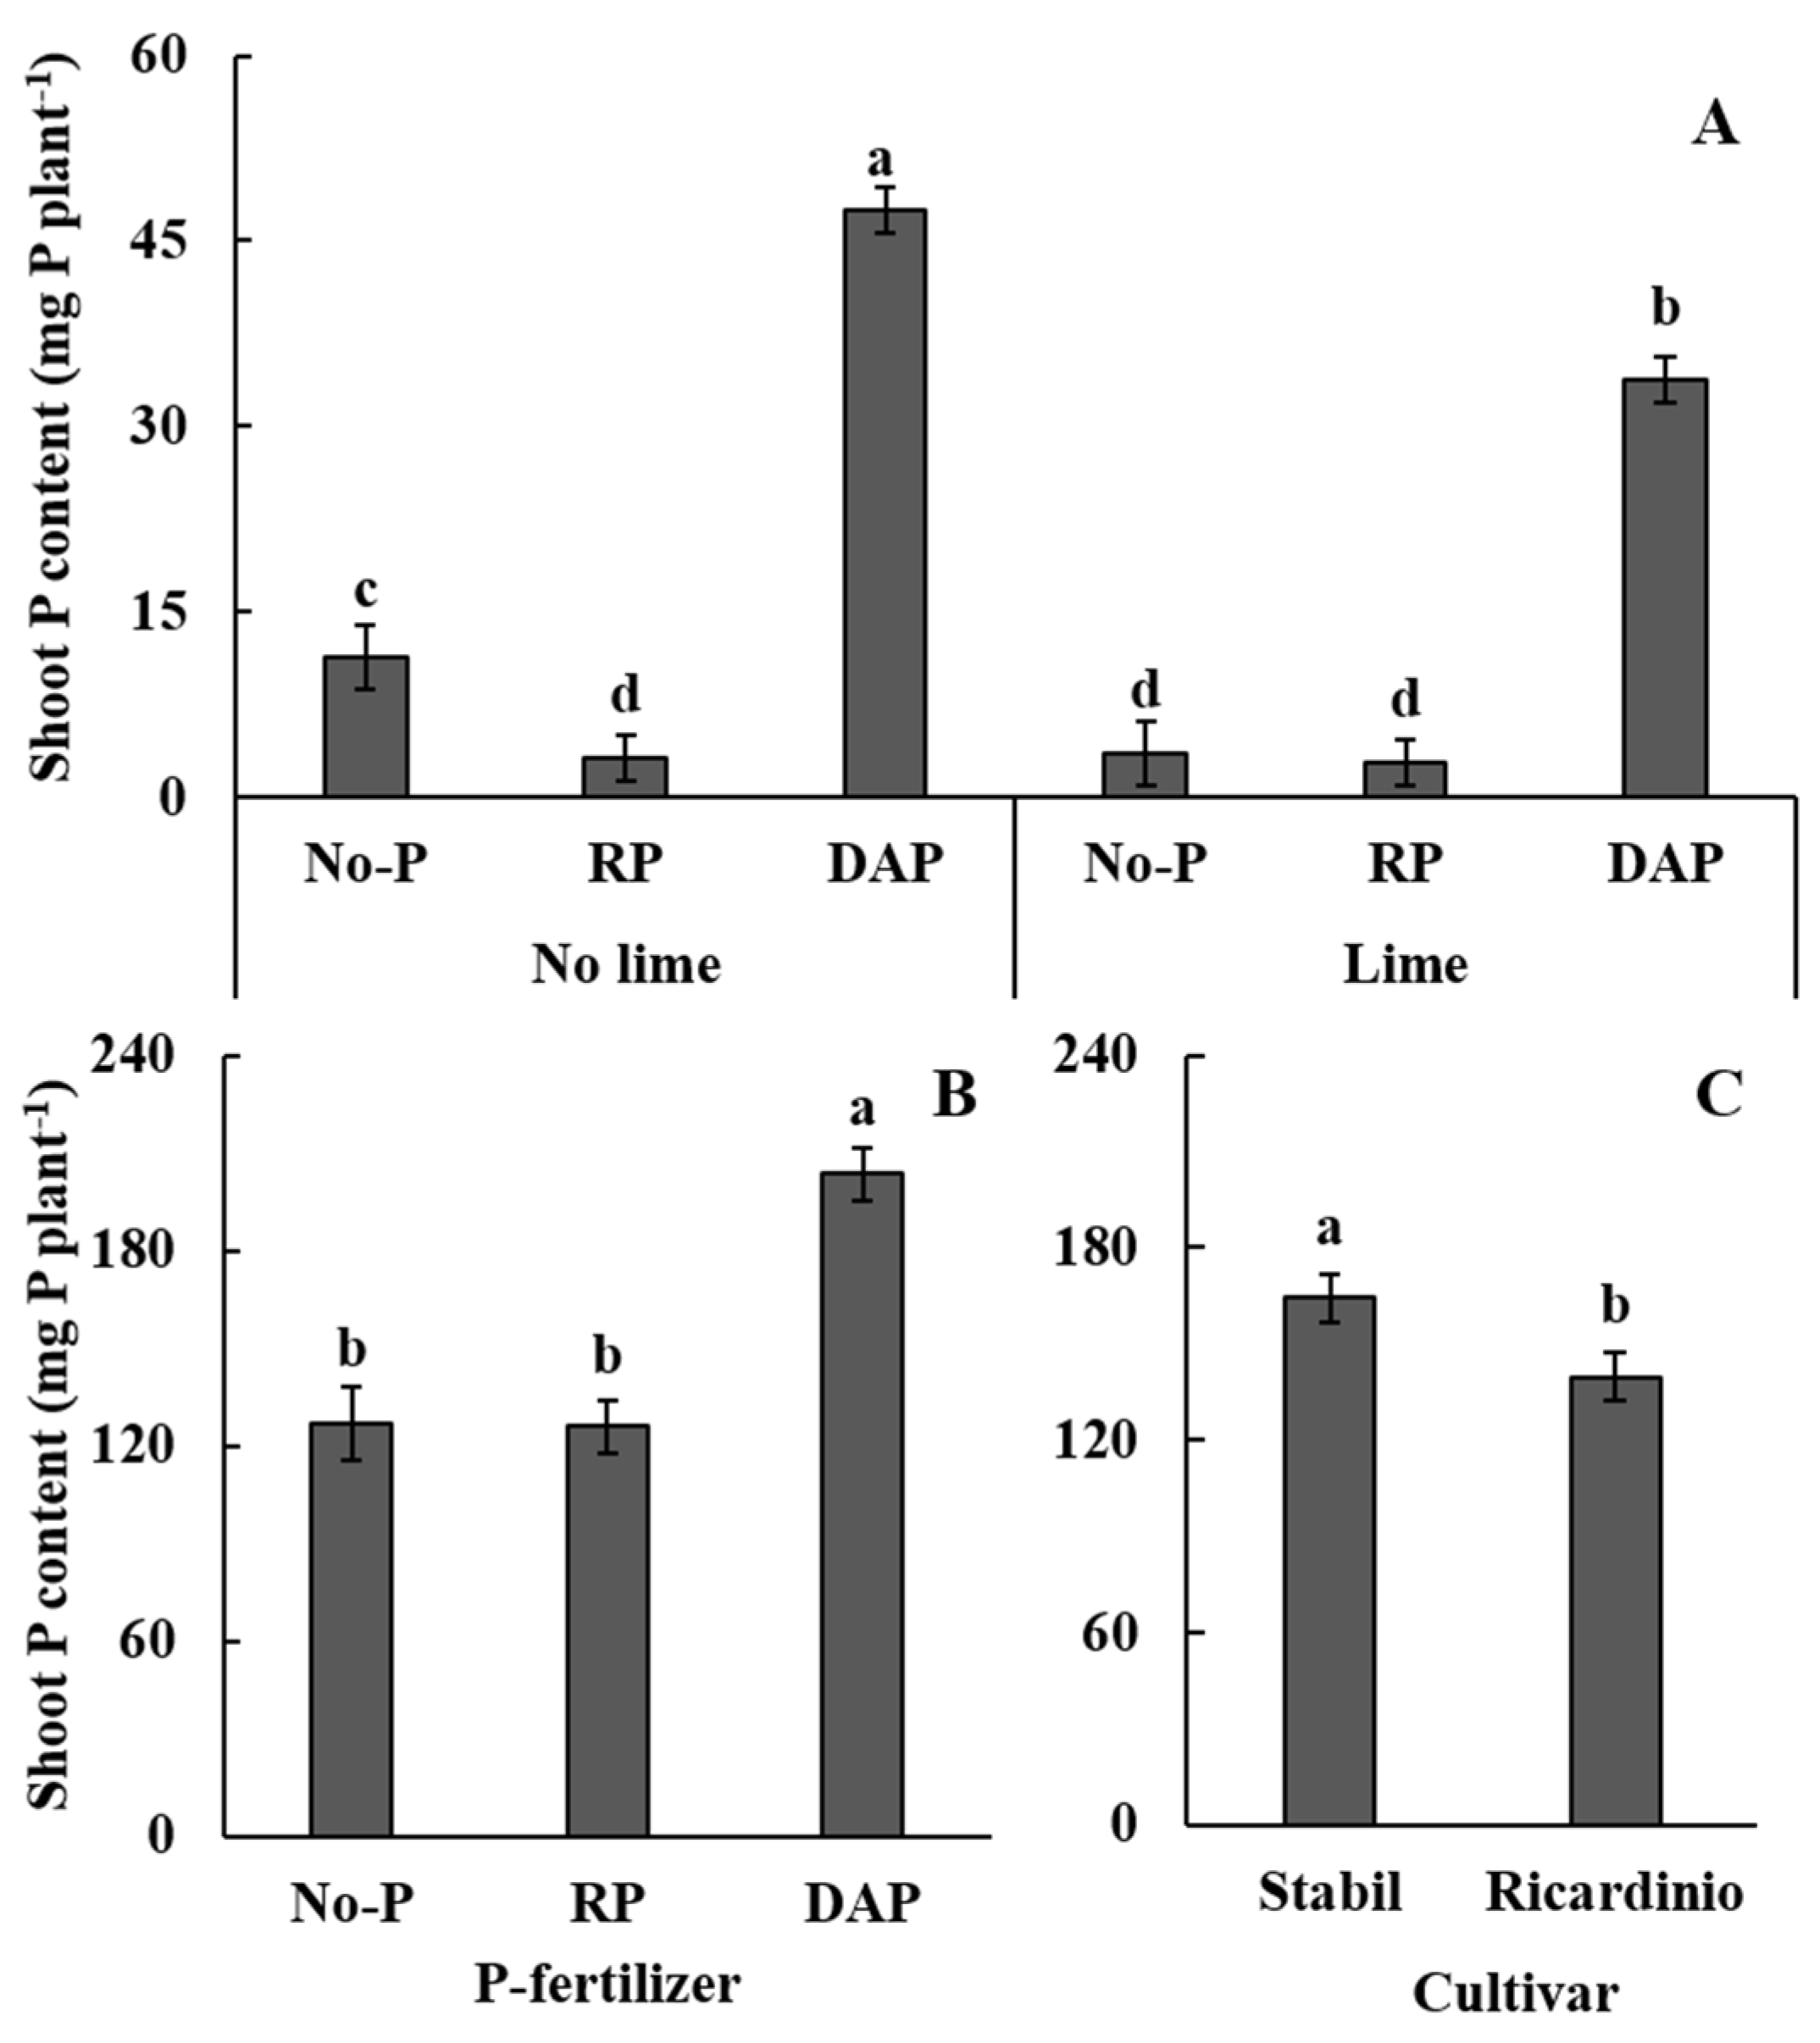
3.3. P Concentration, P Content, and PUE

In both years, P fertilizer significantly affected shoot P concentration at the six-leaf stage, but not at harvest (Table 3). At the six-leaf stage, shoot P content was influenced by P fertilizer in 2020, and by the interaction of P fertilizer*lime application in 2021, respectively. At harvest in 2020, the interactions of P fertilizer*cultivar and P fertilizer*lime application were significant for shoot P content, whereas P fertilizer and cultivar were significant in 2021. At the six-leaf stage, PUE in 2021 was affected by the interaction of P fertilizer*cultivar*lime application, and P fertilizer and cultivar were significant for PUE at harvest.
The application of DAP resulted in a significantly higher shoot P concentration of 3.37 g P kg−1 in comparison with 2.53 g P kg−1 for RP in 2020, and 4.11 g P kg−1 compared with 2.15 g P kg−1 for No-P and 2.05 g P kg−1 for RP in 2021, respectively (Table 4).
The application of DAP resulted in higher shoot P content at the six-leaf stage, compared to No-P and RP, while No-P applied with No-lime caused a 2.5 times higher shoot P content than the RP and No-P*Lime plots (Figure 4A). At harvest, shoot P content was around 61% higher with the application of DAP compared with No-P and RP (Figure 4B). The cultivar Stabil had a 18% higher shoot P content than Ricardinio (Figure 4C).
PUE analyzed for the year 2021 showed a higher PUE with the application of DAP (5.2–7.2%) compared with RP (0.4–0.5%) at the six-leaf stage (Figure 5A). At harvest in 2021, the application of DAP resulted in a PUE of 29.4%, which was 60% higher than that found when applying RP (Figure 5B). The cultivar Stabil led to a 16% higher PUE (23.8%), compared with Ricardinio (Figure 5C).

4. Discussion

4.1. Effect of Phosphate Fertilizer Type on the Growth and P Uptake of Maize

P fertilization plays an important role in the growth, development, and nutrient uptake of maize plants, while differences in the solubility of P fertilizers result in a wide variation in the P availability for plants and thus the effectiveness of different fertilizers [8]. The results of this study are consistent with previous observations that the expansion and the maximum leaf area decreased when the P supply was limited. Thus, with the application of DAP—with a higher water-solubility than RP—a 30% higher canopy LAI was reached in a relatively shorter period, while lower LAI occurred in RP treatments. Lower LAI caused by P deficiency is attributed to two factors: lower leaf appearance rate and slower leaf expansion [1]. Canopy-intercepted PAR is closely associated with LAI [1,35]. The temporal difference in intercepted PAR between maize canopies under different soil plant-available P levels became smaller at later growth stages, which may be attributed to the delayed leaf area expansion process at earlier growth stages [1].
Plant shoot biomass is influenced by P availability due to its effects on LAI, absorbed PAR, and the conversion of PAR into biomass [1,35,36]. Maize biomass accumulation is affected by P fertilizer type, which also determines the plant-availability of P fertilizer [8,37]. As a water-soluble P fertilizer, DAP is highly plant-available, resulting in no P limitation and thus a higher LAI, which increases intercepted PAR and finally plant biomass. Our results showed that the application of DAP resulted in more than a 37% higher shoot biomass at the six-leaf stage, and a 38–67% higher silage yield than RP, respectively. In 2021, shoot biomass with the application of DAP was 1.8 times higher than in 2020, which could be attributed to the higher temperature and greater precipitation during the early stages of 2021. This difference in shoot biomass between years was not found for RP, indicating that P deficiency was the most limiting factor, rather than an influence of water and temperature, as was apparent for DAP.
As well as shoot biomass, differences in P concentration and P content in shoots and in PUE were also found for different P fertilizer types [29,37]. P fertilizers with a higher water-solubility, e.g., DAP and monoammonium phosphate, can contribute to a higher plant P concentration and P acquisition efficiency. Our results clearly show that the application of DAP resulted in at least a 33% higher shoot P concentration besides higher LAI, PAR interception, and shoot biomass, in comparison to RP at the six-leaf stage. As shown in the results of Li et al. [26], the shoot P concentration of maize ranged from around 0.1–0.4 mg g−1 at the six-leaf stage under low (CAL-P: 9.8 mg kg−1) to high (CAL-P: 61.8 mg kg−1) levels of plant-available P in the soil. In our study, shoot P content was around 12 times higher with the application of DAP compared with RP at the six-leaf stage, and 61% higher at harvest, respectively. The difference in shoot P content became smaller over time, as also shown for LAI and biomass accumulation. Thus, for the same amount of P acquired by the plants, more RP fertilizer is needed compared with DAP. However, the relative effectiveness of rock phosphate was proven to decline with the increase in the amount of RP applied [7]. Therefore, even though P loss to the environment during processes from the mining of RP to DAP is higher than for other P fertilizer types, the high efficiency of DAP is unsubstituted [8]. The inoculation of RP with phosphate-solubilizing bacteria could be a another way to increase the P-availability of RP, as shown by the 55% higher shoot biomass of maize compared with the application of DAP [38,39]. The addition of phosphate-solubilizing bacteria decreased the soil pH (8.2 to 7.7) and increased plant-available P (74%) mainly by acid and alkaline phosphatase and dehydrogenase enzyme activities [38,40,41]. The effectiveness of phosphate-solubilizing bacteria is, however, still difficult to generalize, given the effect of local site conditions and the limited number of studies conducted under field conditions [42]. Therefore, although some studies have also been published on the use of soil amendments to increase P availability (e.g., organic acids [43], biochar [44]), improving P use efficiency and reducing P losses in crop production remains a challenge to be further investigated.
The localized application of P fertilizer has shown in general positive effects on biomass accumulation, silage and grain yield, and P uptake, mainly due to the reduction in P deficiency during early growth stages [10,11]. In our study, however, placement of RP did not increase P uptake compared with no P fertilizer application. Thus, considering maize yield and PUE, the applied RP fertilizer could not replace DAP, at least under the environmental conditions in our study.

4.2. Effect of Soil Liming on Growth and P Uptake of Maize

Recent studies have shown that soil pH affects the performance of P fertilizers and P uptake by plants [20,45]. In neutral soil (pH 7.2), DAP showed a 23% and 40% higher yield and plant P uptake, respectively, and thus higher PUE than in acid soil (pH 5.0). Soil liming affects the soil’s chemical properties and is used to increase the soil pH, which can influence P availability [15,18,46]. Alemu et al. [46] reported around a 20% increase in maize grain and silage yield with lime application (4000 kg ha−1 lime), in which the soil pH was initially 5. Appropriate liming could lower the amount of P fertilizer for maize grown in low-P soils [47]. The authors showed that maize accumulated at least 17% more biomass at low rate of lime application combined with moderate amounts of P, compared with lower and higher rates of P fertilizer with and without lime application, as measured six weeks after sowing. In our study, on the contrary, lime application caused around 15% less dry biomass at harvest and lower P uptake. This might be related to a decrease in water-extractable P and P diffusion in the soil due to a lower distance of movement from the point of lime application and adsorption of P onto the clay mineral surfaces, caused by lime [48]. These results agrees that at a soil pH near 5.0, plant roots take up P more effectively [45].

4.3. Maize Cultivar and PUE

The plant effect is strong in the process of P uptake, and even stronger than the soil effect [45]. Plants of different maize cultivars differ in biomass accumulation during vegetative and reproductive stages, and during final P utilization [25,29,30]. The improvement of the PUE in cultivars is an important factor in maize production, and high PUE cultivars may be selected without taking P fertilizer into consideration [29]. In our study, differences in shoot biomass and P uptake were found between the cultivars Stabil and Ricardinio, which is consistent with a study about the reaction of modern maize cultivars to starter P fertilizer [29]. The cultivar Stabil led to a 30% and 21% higher shoot biomass at the six-leaf stage and harvest compared with Ricardinio, respectively. At harvest, the P content of Stabil was 18% higher, resulting in an increase in PUE of around 16%. Based on the assumption that P-efficient cultivars can be selected regardless of soil P-status, Stabil could be regarded as a high-yielding P utilizer, and tested in further research. The different expressions in biomass accumulation and P uptake of Stabil and Ricardinio might be attributed to differences in root architecture [49]. Maize cultivars can differ in their roots’ morphological and physiological aspects, e.g., the release of organic acid anions mobilizing soil P, the accessibility of nutrients, and their metabolic cost [26,49].

5. Conclusions

This study has shown that under the local environmental conditions, DAP could not be substituted by RP in a silage maize cropping system under P-limiting conditions. The cultivar differences in PUE found in this study suggest that future research on the PUE of cultivars should take root morphology into account, in response to P fertilizer type and soil pH.

Supplementary Materials

The following supporting information can be downloaded at: https://www.mdpi.com/article/10.3390/agriculture13091771/s1, Figure S1: Experimental design in 2020; Figure S2: Experimental design in 2021; Table S1: Simple means for interactions of P-fertilizer (Pf), cultivar (Cul), lime application (Lime) on different traits in 2020 and at different stages; Table S2: Simple means for interactions of P-fertilizer (Pf), cultivar (Cul), lime application (Lime) on different traits in 2021 and at different stages; Table S3: ANOVA for the effects of P-fertilizer (Pf), cultivar (Cul), lime application (Lime), and their interactions on LAI at different DAS in 2020; Table S4: ANOVA for the effects of P-fertilizer (Pf), cultivar (Cul), lime application (Lime), and their interactions on the percentage of canopy absorbed PAR (%) at 65, 93, and 118 DAS in 2020, and at 99 DAS in 2021.

Author Contributions

Conceptualization, F.N. and P.M.N.; methodology, F.N. and P.M.N.; software, F.N. and J.H.; validation, F.N. and J.H.; formal analysis, F.N.; investigation, F.N. and P.M.N.; writing—original draft preparation, F.N.; writing—review and editing, P.M.N., S.M., S.H., S.Z. and S.G.-H.; visualization, F.N.; supervision, P.M.N., S.M. and S.G.-H.; funding acquisition, S.G.-H. All authors have read and agreed to the published version of the manuscript.

Funding

This research was funded by the Deutsche Forschungsgemeinschaft (DFG, German Research Foundation) Award No. 328017493/GRK 2366 (Sino-German International Research Training Group AMAIZE-P). We would like to thank the China Scholarship Council (Award No. 201906350058) for supporting F.N.

Institutional Review Board Statement

The study did not require ethical approval.

Data Availability Statement

The data presented in this study are available upon request from the corresponding author.

Conflicts of Interest

The authors declare no conflict of interest.

References

  1. Colomb, B.; Kiniry, J.R.; Debaeke, P. Effect of soil phosphorus on leaf development and senescence dynamics of field-grown maize. Agron. J. 2000, 92, 428–435. [Google Scholar] [CrossRef]
  2. Dzotsi, K.A.; Jones, J.W.; Adiku, S.G.K.; Naab, J.B.; Singh, U.; Porter, C.H.; Gijsman, A.J. Modeling soil and plant phosphorus within DSSAT. Ecol. Model. 2010, 221, 2839–2849. [Google Scholar] [CrossRef]
  3. Alewell, C.; Ringeval, B.; Ballabio, C.; Robinson, D.A.; Panagos, P.; Borrelli, P. Global phosphorus shortage will be aggravated by soil erosion. Nat. Commun. 2020, 11, 4546. [Google Scholar] [CrossRef]
  4. Cooper, J.; Lombardi, R.; Boardman, D.; Carliell-Marquet, C. The future distribution and production of global phosphate rock reserves. Resour. Conserv. Recycl. 2011, 57, 78–86. [Google Scholar] [CrossRef]
  5. Johnston, A.E.; Poulton, P.R.; Fixen, P.E.; Curtin, D. Phosphorus: Its efficient use in agriculture. Adv. Agron. 2014, 123, 177–228. [Google Scholar] [CrossRef]
  6. Abbasi, M.K.; Musa, N.; Manzoor, M. Mineralization of soluble P fertilizers and insoluble rock phosphate in response to phosphate-solubilizing bacteria and poultry manure and their effect on the growth and P utilization efficiency of chilli (Capsicum annuum L.). Biogeosciences 2015, 12, 4607–4619. [Google Scholar] [CrossRef]
  7. Bolland, M.; Barrow, N. Effect of level of application on the relative effectiveness of rock phosphate. Fertil. Res. 1988, 15, 181–192. [Google Scholar] [CrossRef]
  8. Gong, H.Q.; Meng, F.L.; Wang, G.H.; Hartmann, T.E.; Feng, G.; Wu, J.C.; Jiao, X.Q.; Zhang, F.S. Toward the sustainable use of mineral phosphorus fertilizers for crop production in China: From primary resource demand to final agricultural use. Sci. Total Environ. 2022, 804, 150183. [Google Scholar] [CrossRef]
  9. Wang, Z.H.; Hartmann, T.E.; Wang, X.H.; Cui, Z.L.; Hou, Y.; Meng, F.L.; Yu, X.C.; Wu, J.C.; Zhang, F.S. Phosphorus flow analysis in the maize based food-feed-energy systems in China. Environ. Res. 2020, 184, 109319. [Google Scholar] [CrossRef]
  10. Freiling, M.; von Tucher, S.; Schmidhalter, U. Factors influencing phosphorus placement and effects on yield and yield parameters: A meta-analysis. Soil Tillage Res. 2022, 216, 105257. [Google Scholar] [CrossRef]
  11. Nkebiwe, P.M.; Weinmann, M.; Bar-Tal, A.; Müller, T. Fertilizer placement to improve crop nutrient acquisition and yield: A review and meta-analysis. Field Crops Res. 2016, 196, 389–401. [Google Scholar] [CrossRef]
  12. Jing, J.; Rui, Y.; Zhang, F.; Rengel, Z.; Shen, J. Localized application of phosphorus and ammonium improves growth of maize seedlings by stimulating root proliferation and rhizosphere acidification. Field Crops Res. 2010, 119, 355–364. [Google Scholar] [CrossRef]
  13. Bouten, M.; Meinel, T.; Kath-Petersen, W. Effects of precise fertilizer placement in corn. Landtechnik 2020, 75, 206–216. [Google Scholar] [CrossRef]
  14. Minasny, B.; Hong, S.Y.; Hartemink, A.E.; Kim, Y.H.; Kang, S.S. Soil pH increase under paddy in South Korea between 2000 and 2012. Agric. Ecosyst. Environ. 2016, 221, 205–213. [Google Scholar] [CrossRef]
  15. Haynes, R.J. Effects of liming on phosphate availability in acid soils. Plant Soil 1982, 68, 289–308. [Google Scholar] [CrossRef]
  16. Holland, J.E.; Bennett, A.E.; Newton, A.C.; White, P.J.; McKenzie, B.M.; George, T.S.; Pakeman, R.J.; Bailey, J.S.; Fornara, D.A.; Hayes, R.C. Liming impacts on soils, crops and biodiversity in the UK: A review. Sci. Total Environ. 2018, 610–611, 316–332. [Google Scholar] [CrossRef]
  17. Ellis, R., Jr.; Quader, M.A.; Truog, E. Rock phosphate availability as influenced by soil pH. Soil Sci. Soc. Am. J. 1955, 19, 484–487. [Google Scholar] [CrossRef]
  18. Chen, J.H.; Barber, S.A. Soil pH and phosphorus and potassium uptake by maize evaluated with an uptake model. Soil Sci. Soc. Am. J. 1990, 54, 1032–1036. [Google Scholar] [CrossRef]
  19. Gomes, E.A.; Silva, U.C.; Marriel, I.E.; Oliveira, C.A.; Lana, U.G.P. Rock phosphate solubilizing microorganisms isolated from maize rhizosphere soil. Rev. Bras. Milho Sorgo 2014, 13, 69–81. [Google Scholar] [CrossRef]
  20. Zhao, Y.N.; Li, R.K.; Huang, Y.F.; Sun, X.M.; Qin, W.; Wei, F.F.; Ye, Y.L. Effects of various phosphorus fertilizers on maize yield and phosphorus uptake in soils with different pH values. Arch. Agron. Soil Sci. 2022, 68, 1746–1754. [Google Scholar] [CrossRef]
  21. Barrow, N.J. The effects of pH on phosphate uptake from the soil. Plant Soil 2017, 410, 401–410. [Google Scholar] [CrossRef]
  22. Buczko, U.; van Laak, M.; Eichler-Löbermann, B.; Gans, W.; Merbach, I.; Panten, K.; Peiter, E.; Reitz, T.; Spiegel, H.; von Tucher, S. Re-evaluation of the yield response to phosphorus fertilization based on meta-analyses of long-term field experiments. Ambio 2018, 47, 50–61. [Google Scholar] [CrossRef] [PubMed]
  23. Usuda, H.; Shimogawara, K. Phosphate deficiency in maize. I. leaf phosphate status, growth, photosynthesis and carbon Partitioning. Plant Cell Physiol. 1991, 32, 497–504. [Google Scholar]
  24. Timlin, D.J.; Naidu, T.C.M.; Fleisher, D.H.; Reddy, V.R. Quantitative effects of phosphorus on maize canopy photosynthesis and biomass. Crop Sci. 2017, 57, 3156–3169. [Google Scholar] [CrossRef]
  25. Li, X.L.; Mang, M.; Piepho, H.P.; Melchinger, A.; Ludewig, U. Decline of seedling phosphorus use efficiency in the heterotic pool of flint maize breeding lines since the onset of hybrid breeding. J. Agron. Crop Sci. 2021, 207, 857–872. [Google Scholar] [CrossRef]
  26. Li, X.L.; Quan, X.H.; Mang, M.; Neumann, G.; Melchinger, A.; Ludewig, U. Flint maize root mycorrhization and organic acid exudates under phosphorus deficiency: Trends in breeding lines and doubled haploid lines from landraces. J. Plant Nutr. Soil Sci. 2021, 184, 346–359. [Google Scholar] [CrossRef]
  27. Ciarelli, D.M.; Furlani, A.M.C.; Dechen, A.R.; Lima, M. Genetic variation among maize genotypes for phosphorus-uptake and phosphorus-use efficiency in nutrient solution. J. Plant Nutr. 1998, 21, 2219–2229. [Google Scholar] [CrossRef]
  28. Gong, Y.M.; Guo, Z.H.; He, L.Y.; Li, J.S. Identification of maize genotypes with high tolerance or sensitivity to phosphorus deficiency. J. Plant Nutr. 2011, 34, 1290–1302. [Google Scholar] [CrossRef]
  29. Weiß, T.M.; Leiser, W.L.; Reineke, A.J.; Li, D.D.; Liu, W.X.; Hahn, V.; Würschum, T. Optimizing the P balance: How do modern maize hybrids react to different starter fertilizers? PLoS ONE 2021, 16, e0250496. [Google Scholar] [CrossRef]
  30. Li, D.D.; Chen, Z.; Wang, M.; Leiser, W.L.; Weiß, T.M.; Zhao, Z.; Cheng, S.; Chen, S.J.; Chen, F.J.; Yuan, L.X.; et al. Dissecting the phenotypic response of maize to low phosphorus soils by field screening of a large diversity panel. Euphytica 2021, 217, 12. [Google Scholar] [CrossRef]
  31. Wiesler, F.; Appel, T.; Dittert, K.; Ebertseder, T.; Müller, T.; Nätscher, L.; Olfs, H.W.; Rex, M.; Schweitzer, K.; Steffens, D.; et al. Phosphordüngung nach Bodenuntersuchung und Pflanzenbedarf. Standpunkt des VDLUFA 2018, 1–11. [Google Scholar]
  32. Nguy-Robertson, A.L.; Gitelson, A.A. Algorithms for estimating green leaf area index in C3 and C4 crops for MODIS, Landsat TM/ETM+, MERIS, Sentinel MSI/OLCI, and Venµs sensors. Remote Sens. Lett. 2015, 6, 360–369. [Google Scholar] [CrossRef]
  33. Tan, C.W.; Wang, D.L.; Zhou, J.; Du, Y.; Luo, M.; Zhang, Y.J.; Guo, W.S. Remotely assessing fraction of photosynthetically active radiation (FPAR) for wheat canopies based on hyperspectral vegetation indexes. Front. Plant Sci. 2018, 9, 776. [Google Scholar] [CrossRef] [PubMed]
  34. Piepho, H.P. A SAS macro for generating letter displays of pairwise mean comparisons. Commun. Biometry Crop Sci. 2012, 7, 4–13. [Google Scholar]
  35. Graffitti, M.S.; Umburanas, R.C.; Fontana, D.C.; Pilau, F.G.; Reichardt, K.; Dourado Neto, D. Performance of maize hybrids as a function of spatial arrangements during second growth season under irrigation. Bragantia 2021, 80, 1–17. [Google Scholar] [CrossRef]
  36. Zhang, W.; Chen, X.X.; Liu, Y.M.; Liu, D.Y.; Du, Y.F.; Chen, X.P.; Zou, C.Q. The role of phosphorus supply in maximizing the leaf area, photosynthetic rate, coordinated to grain yield of summer maize. Field Crops Res. 2018, 219, 113–119. [Google Scholar] [CrossRef]
  37. You, Y.W.; Klein, J.; Hartmann, T.E.; Nkebiwe, P.M.; Yang, H.Y.; Zhang, W.; Chen, X.P.; Müller, T. Producing superphosphate with sewage sludge ash: Assessment of phosphorus availability and potential Toxic Element Contamination. Agronomy 2021, 11, 1506. [Google Scholar] [CrossRef]
  38. Kaur, G.; Reddy, M.S. Effects of phosphate-solubilizing bacteria, rock phosphate and chemical fertilizers on maize-wheat cropping cycle and economics. Pedosphere 2015, 25, 428–437. [Google Scholar] [CrossRef]
  39. Qarni, A.; Billah, M.; Hussain, K.; Shah, S.H.; Ahmed, W.; Alam, S.; Sheikh, A.A.; Jafri, L.; Munir, A.; Malik, K.M.; et al. Isolation and Characterization of Phosphate Solubilizing Microbes from Rock Phosphate Mines and Their Potential Effect for Sustainable Agriculture. Sustainability 2021, 13, 2151. [Google Scholar] [CrossRef]
  40. Bowman, W.D.; Cleveland, C.C.; Halada, Ĺ.; Hreško, J.; Baron, J.S. Negative impact of nitrogen deposition on soil buffering capacity. Nat. Geosci. 2008, 1, 767–770. [Google Scholar] [CrossRef]
  41. Zhang, Y.G.; Zhang, Y.Y.; Cai, J.P.; Zhu, P.; Gao, H.J.; Jiang, Y. Variation in available micronutrients in black soil after 30-year fertilization treatment. Plant Soil Environ. 2014, 60, 387–393. [Google Scholar] [CrossRef]
  42. Schmidt, J.E.; Gaudin, A.C.M. What is the agronomic potential of biofertilizers for maize? A meta-analysis. FEMS Microbiol. Ecol. 2018, 94, fiy094. [Google Scholar] [CrossRef] [PubMed]
  43. Ström, L.; Owen, A.; Godbold, D.; Jones, D. Organic acid mediated P mobilization in the rhizosphere and uptake by maize roots. Soil Biol. Biochem. 2002, 34, 703–710. [Google Scholar] [CrossRef]
  44. Tesfaye, F.; Liu, X.; Zheng, J.; Cheng, K.; Bian, R.; Zhang, X.; Li, L.; Drosos, M.; Joseph, S.; Pan, G. Could biochar amendment be a tool to improve soil availability and plant uptake of phosphorus? A meta-analysis of published experiments. Environ. Sci. Pollut. Res. Int. 2021, 28, 34108–34120. [Google Scholar] [CrossRef] [PubMed]
  45. Barrow, N.J.; Hartemink, A.E. The effects of pH on nutrient availability depend on both soils and plants. Plant Soil 2023, 487, 21–37. [Google Scholar] [CrossRef]
  46. Alemu, E.; Selassie, Y.G.; Yitaferu, B. Effect of lime on selected soil chemical properties, maize (Zea mays L.) yield and determination of rate and method of its application in Northwestern Ethiopia. Heliyon 2022, 8, e08657. [Google Scholar] [CrossRef] [PubMed]
  47. Opala, P.A. Influence of lime and phosphorus application rates on growth of maize in an acid soil. Adv. Agric. 2017, 2017, 7083206. [Google Scholar] [CrossRef]
  48. Hao, X.; Cho, C.M.; Racz, G.J.; Chang, C. Chemical retardation of phosphate diffusion in an acid soil as affected by liming. Nutr. Cycl. Agroecosyst. 2002, 64, 213–224. [Google Scholar] [CrossRef]
  49. Lynch, J. Root architecture and plant productivity. Plant Physiol. 1995, 109, 7–13. [Google Scholar] [CrossRef]
Figure 1. Daily precipitation (blue bars) and mean daily temperatures (red line) during the experimental period in 2020 (A) and 2021 (B).
Agriculture 13 01771 g001
Figure 2. Effect of P fertilizer on LAI (A) in 2020 and intercepted PAR (%) (B) in 2021 at different days after sowing (DAS). No-P, no P fertilizer; RP, rock phosphate; DAP, diammonium phosphate. For each DAS, bars headed by at least one identical letter did not differ significantly according to Fisher’s LSD test, p < 0.05. Error bars indicate the standard error of the least squares means.
Agriculture 13 01771 g002
Figure 3. Effects of P fertilizer (No-P, RP, DAP), cultivar (Stabil, Ricardinio), and lime application (No lime, Lime) on shoot biomass at the six-leaf stage in 2020 (A) and 2021 (B,C) and silage yield at harvest in 2020 (D) and 2021 (E,F). No-P, no P fertilizer; RP, rock phosphate; DAP, diammonium phosphate; with (Lime) and without (No lime) lime application. Bars headed by at least one identical letter did not differ significantly according to Fisher’s LSD test, p < 0.05. In case of non-significant interactions, letters from marginal mean comparisons were presented. Error bars indicate the standard error of the least-squares means.
Agriculture 13 01771 g003
Figure 4. Effects of P fertilizer (No-P, RP, DAP), cultivar (Stabil, Ricardinio), and lime application (No lime, Lime) on shoot P content (mg P plant−1) at the six-leaf stage (A) and harvest (B,C) in 2021. No-P, no P fertilizer applied; RP, rock phosphate; DAP, diammonium phosphate; with (Lime) and without (No lime) lime application. Bars headed by at least one identical letter did not differ significantly according to Fisher’s LSD test, p < 0.05. Error bars indicate the standard error of the least squares means.
Agriculture 13 01771 g004
Figure 5. Effects of P fertilizer (RP, DAP), cultivar (Stabil, Ricardinio), and lime application (No lime, Lime) on phosphorus use efficiency (PUE, %) at the six-leaf stage (A) and harvest (B,C) in 2021. RP, rock phosphate; DAP, diammonium phosphate; with (Lime) and without (No lime) lime application. Bars headed by at least one identical letter did not differ significantly according to Fisher’s LSD test, p < 0.05. In (A), letters compare P fertilizers within each combination of cultivar and lime application. Error bars indicate the standard error of the least-squares means.
Agriculture 13 01771 g005
Table 1. Soil properties.
YearDepthClaySiltSandBulk DensitypHNmin
cm%%%g cm−3kg N ha−1
20200–3032.660.96.51.35.323.4
30–6035.359.35.41.35.513.1
60–9034.954.510.61.46.029.9
20210–30----4.723.9
30–60----4.821.3
60–90----4.333.4
Table 2. ANOVA for the effects of P fertilizer (Pf), cultivar (Cul), lime application (Lime), and their interactions on shoot biomass at the six-leaf stage and silage yield at harvest in 2020 and 2021. ns: not significant at α = 0.05.
TraitShoot Biomass at Six-Leaf StageSilage Yield at Harvest
Unitkg DM ha−1
Year2020202120202021
Pf<0.001<0.001<0.001<0.001
Culns0.035ns<0.001
Limens0.002ns<0.001
Pf × Culnsnsnsns
Pf × Limens0.033ns0.002
Cul × Limensnsnsns
Pf × Cul × Limensnsnsns
Table 3. ANOVA for the effects of P fertilizer (Pf), cultivar (Cul), lime application (Lime), and their interactions on plant shoot P concentration, and P content and PUE at the six-leaf stage and harvest in 2020 and 2021. ns: not significant at α = 0.05.
Six-Leaf StageHarvest
TraitP ConcentrationP ContentPUEP ConcentrationP ContentPUE
Unitg P kg−1mg P Plant−1%g P kg−1mg P Plant−1%
Year2020202120202021202120202021202020212021
Pf<0.001<0.001<0.001<0.001<0.001nsns<0.001<0.001<0.001
Culnsnsnsnsnsnsnsns0.0250.016
Limensnsns<0.0010.003nsnsnsnsns
Pf × Culnsnsnsns0.003nsns0.010nsns
Pf × Limensnsns0.0040.018nsns0.026nsns
Cul × Limensnsnsnsnsnsnsnsnsns
Pf × Cul × Limensnsnsns0.004nsnsnsnsns
Table 4. Mean values for the effects of P fertilizer (rock phosphate, RP; diammonium phosphate, DAP) and the control without P fertilizer (No-P) on shoot P concentration at the six-leaf stage in 2020 and 2021. Within each column, means followed by at least one identical letter did not differ significantly according to Fisher’s LSD test, p < 0.05.
P FertilizerP Concentration
g P kg−1
20202021
No-P-2.15 b
RP2.53 b2.05 b
DAP3.37 a4.11 a
Disclaimer/Publisher’s Note: The statements, opinions and data contained in all publications are solely those of the individual author(s) and contributor(s) and not of MDPI and/or the editor(s). MDPI and/or the editor(s) disclaim responsibility for any injury to people or property resulting from any ideas, methods, instructions or products referred to in the content.

