
A Smart Farm DNN Survival Model Considering Tomato Farm Effect


Abstract
:1. Introduction
2. Tomato Data
2.1. Data Description
2.2. Definition of Harvest Time Data
3. Survival Regression Models
3.1. Accelerated Failure Time Model
3.2. The Cox Proportional Hazards Model
4. DNN Survival Models
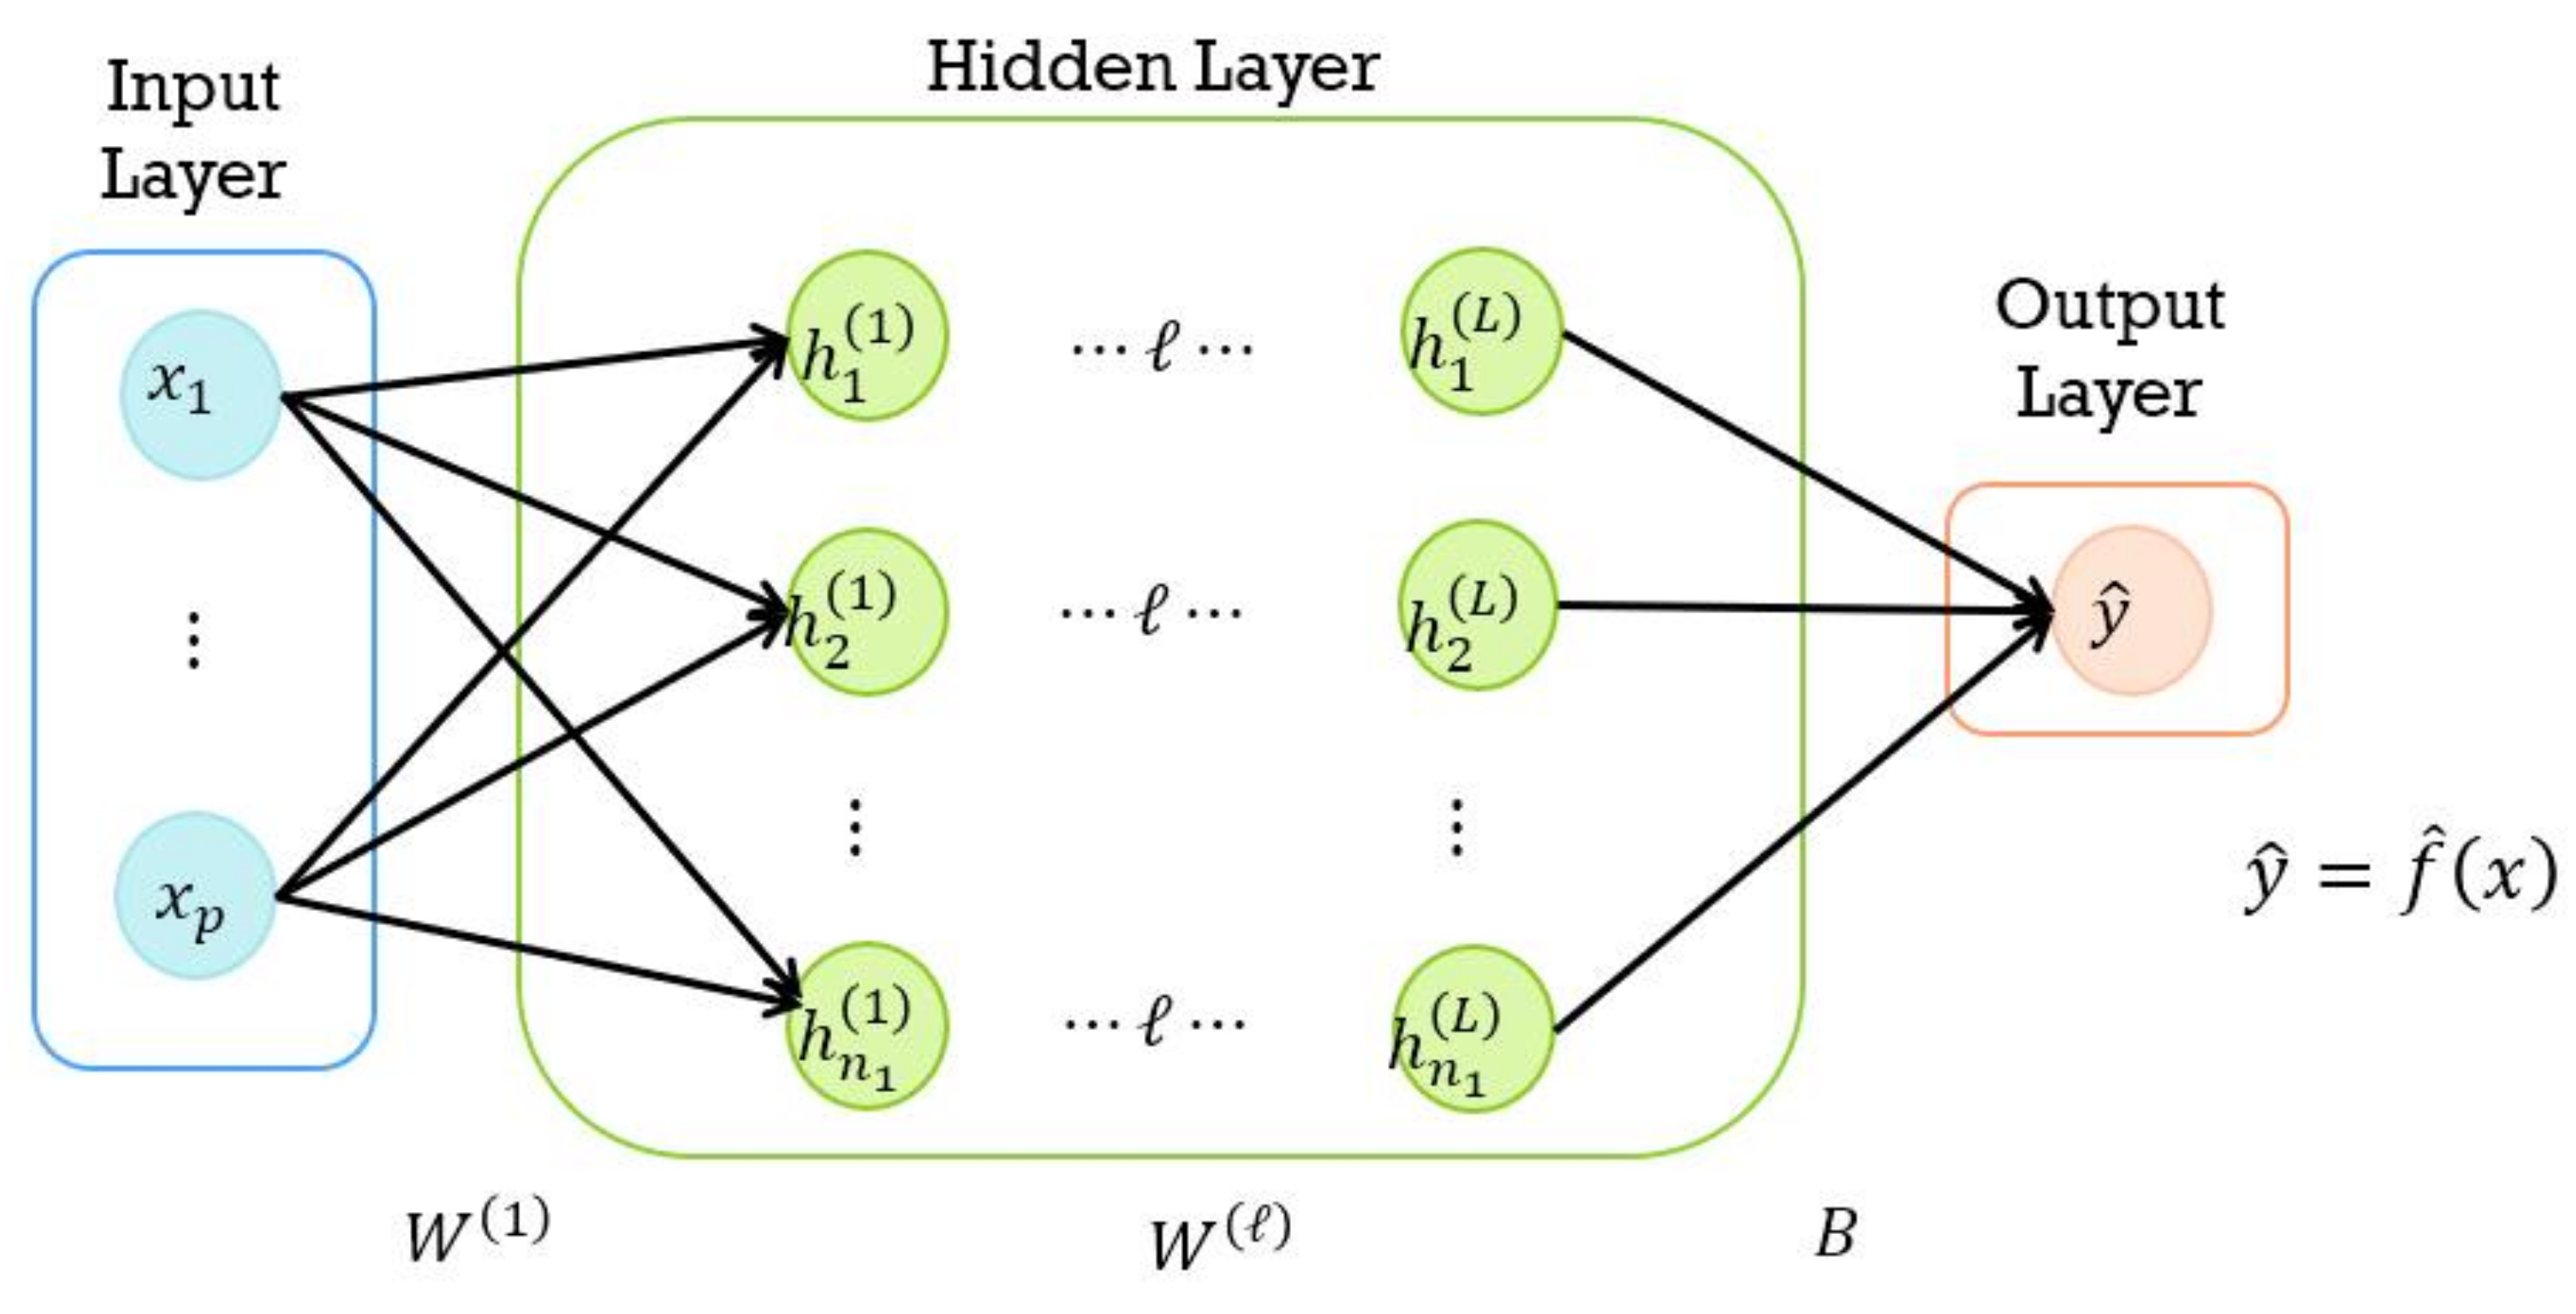
4.1. DNN Model
- Input layer:
- Hidden layer:
- Output layer:
4.2. Learning Procedure of DNN
4.3. One-Hot Encoding (OHE)
4.4. DNN–OHE Survival Models
- DNN-I (DNN OHE-input): the DNN model applies OHE to the input layer (I).
- DNN-L (DNN OHE-last): the DNN model applies OHE to the last hidden layer (L).
5. Prediction Performance Results of DNN Survival Models
5.1. Model Fitting and Predictive Measures
5.2. Prediction Results for AFT-Type DNN Models
5.3. Prediction Results for Cox-Type DNN Hazard Models
6. Discussion and Conclusions
Author Contributions
Funding
Institutional Review Board Statement
Data Availability Statement
Conflicts of Interest
Abbreviations
| AFT | Accelerated Failure Time |
| BS | Brier Score |
| DNN | Deep Neural Network |
| IBS | Integrated Brier Score |
| IoT | Internet of Things |
| OHE | One-Hot Encoding |
References
- Na, M.H.; Park, Y.; Cho, W.H. A study on optimal environmental factors of tomato using smart farm data. JKDISS 2008, 10, 1427–1435. [Google Scholar]
- Gadekallu, T.R.; Rajput, D.S.; Reddy, M.P.K.; Lakshmanna, K.; Bhattacharya, S.; Singh, S.; Jolfaei, A.; Alazab, M. A novel PCA–whale optimization-based deep neural network model for classification of tomato plant diseases using GPU. J. Real-Time Image Process. 2021, 18, 1383–1396. [Google Scholar] [CrossRef]
- Minagawa, D.; Kim, J. Prediction of harvest time of tomato using mask R-CNN. AgriEngineering 2022, 4, 356–366. [Google Scholar] [CrossRef]
- Hancock, J.T.; Khoshgoftaar, T.M. Survey on categorical data for neural networks. J. Big Data 2020, 7, 28. [Google Scholar] [CrossRef]
- Cho, W.; Kim, S.; Na, M.; Na, I. Forecasting of tomato yields using attention-based LSTM network and ARMA Model. Electronics 2021, 10, 1576. [Google Scholar] [CrossRef]
- Kim, J.C.; Kwon, S.; Ha, I.D.; Na, M.H. Survival analysis for tomato big data in smart farming. JKDISS 2021, 32, 361–374. [Google Scholar] [CrossRef]
- Kim, J.C.; Kwon, S.; Ha, I.D.; Na, M.H. Prediction of smart farm tomato harvest time: Comparison of machine learning and deep learning approaches. JKDISS 2022, 33, 283–298. [Google Scholar] [CrossRef]
- Luna, R.; Dadios, E.; Bandala, A.; Vicerra, R. Tomato growth stage monitoring for smart farm using deep transfer learning with machine learning-based maturity grading. Agrivita 2020, 42, 24–36. [Google Scholar]
- Haggag, M.; Abdelhay, S.; Mecheter, A.; Gowid, S.; Musharavati, F.; Ghani, S. An intelligent hybrid experimental-based deep learning algorithm for tomato-sorting controllers. IEEE Access 2019, 7, 106890–106898. [Google Scholar] [CrossRef]
- Alajrami, A.; Abu-Naser, S. Type of tomato classification using deep learning. IJAPR 2019, 12, 21–25. [Google Scholar]
- Grimberg, R.; Teitel, M.; Ozer, S.; Levi, A.; Levy, A. Estimation of greenhouse tomato foliage temperature using DNN and ML models. Agriculture 2022, 12, 1034. [Google Scholar] [CrossRef]
- Jeong, S.; Jeong, S.; Bong, J. Detection of tomato leaf miner using deep neural network. Sensors 2022, 22, 9959. [Google Scholar] [CrossRef] [PubMed]
- Lawless, J.F. Statistical Models and Methods for Lifetime Data, 2nd ed.; Wiley: New York, NY, USA, 2003. [Google Scholar]
- Ha, I.D.; Jeong, J.H.; Lee, Y. Statistical Modelling of Survival Data with Random Effects: H-Likelihood Approach; Springer: Singapore, 2017. [Google Scholar]
- Kalbfleisch, J.D.; Prentice, R.L. The Statistical Analysis of Failure Time Data; Wiley: New York, NY, USA, 1980. [Google Scholar]
- Kumar, U.A. Comparison of neural networks and regression analysis: A new insight. Expert Syst. Appl. 2005, 29, 424–430. [Google Scholar] [CrossRef]
- Cox, D.R. Regression models and life tables (with Discussion). J. R. Stat. Soc. B 1972, 74, 187–220. [Google Scholar]
- Breslow, N.E. Covariance analysis of censored survival data. Biometrics 1974, 30, 89–99. [Google Scholar] [CrossRef] [PubMed]
- LeCun, Y.; Bengio, Y.; Hinton, G. Deep learning. Nature 2015, 521, 436–444. [Google Scholar] [CrossRef] [PubMed]
- Goodfellow, I.; Bengio, Y.; Courville, A. Deep Learning; MIT Press: Cambridge, MA, USA, 2016. [Google Scholar]
- Rumelhart, D.E.; Hinton, G.E.; Williams, R.J. Learning representations by back-propagating errors. Nature 1986, 323, 533–536. [Google Scholar] [CrossRef]
- Sun, T.; Wei, Y.; Chen, W.; Ding, Y. Genome-wide association study-based deep learning for survival prediction. Stat. Med. 2020, 39, 4605–4620. [Google Scholar] [CrossRef]
- Harrell, F.E.; Lee, K.L.; Mark, D.B. Multivariable prognostic models: Issues in developing models, evaluating assumptions and adequacy, and measuring and reducing errors. Stat. Med. 1996, 15, 361–387. [Google Scholar] [CrossRef]
- Graf, E.; Schmoor, C.; Sauerbrei, W.; Schumacher, M. Assessment and comparison of prognostic classification schemes for survival data. Stat. Med. 1999, 18, 2529–2545. [Google Scholar] [CrossRef]
- Breiman, L. Random forests. Mach. Learn. 2001, 45, 5–32. [Google Scholar] [CrossRef]
- Chen, T.; Guestrin, C. XGBoost: A scalable tree boosting system. In Proceedings of the 22nd ACM SIGKDD International Conference on Knowledge Discovery and Data Mining, San Francisco, CA, USA, 13–17 August 2016; pp. 785–794. [Google Scholar]
- Vapnik, V.; Golowich, S.E.; Smola, A.J. Support vector method for function approximation, regression estimation, and signal processing. Adv. Neural Inf. Process. Syst. 1997, 9, 281–287. [Google Scholar]
- Liu, S.-C.; Jian, Q.-Y.; Wen, H.-Y.; Chung, C.-H. A crop harvest time prediction model for better sustainability, integrating feature selection and artificial intelligence methods. Sustainability 2022, 14, 14101. [Google Scholar] [CrossRef]
- Belouz, K.; Nourani, A.; Zereg, S.; Bencheikh, A. Prediction of greenhouse tomato yield using artificial neural networks combined with sensitivity analysis. Sci. Hortic. 2022, 293, 110666. [Google Scholar] [CrossRef]
- He, K.; Gkioxari, G.; Dollár, P.; Girshick, R. Mask R-CNN. IEEE Int. Conf. Comput. Vis. 2017, 322, 2980–2988. [Google Scholar]
- Nugroho, D.P.; Widiyanto, S.; Wardani, D.T. Comparison of deep learning-based object classification methods for detecting tomato ripeness. Int. J. Fuzzy Log. Intell. 2022, 22, 223–232. [Google Scholar] [CrossRef]
- Afonso, M.; Fonteijn, H.; Fiorentin, F.S.; Lensink, D.; Mooij, M.; Faber, N.; Polder, G.; Wehrens, R. Tomato fruit detection and counting in greenhouses using deep learning. Front. Plant Sci. 2020, 11, 571299. [Google Scholar] [CrossRef] [PubMed]
- Mishra1, A.M.; Harnal1, S.; Gautam, V.; Tiwari, R.; Upadhyay, S. Weed density estimation in soya bean crop using deep convolutional neural networks in smart agriculture. J. Plant Dis. Prot. 2022, 129, 593–604. [Google Scholar] [CrossRef]
- Kaur, P.; Harnal, S.; Tiwari, R.; Upadhyay, S.; Bhatia, S.; Mashat, A.; Alabdali, A.M. Recognition of leaf disease using hybrid convolutional neural network by applying feature reduction. Sensors 2022, 22, 575. [Google Scholar] [CrossRef]
- Ireri, D.; Belal, E.; Okinda, C.; Makange, N.; Ji, C. A computer vision system for defect discrimination and grading in tomatoes using machine learning and image processing. Artif. Intell. Agric. 2019, 2, 28–37. [Google Scholar] [CrossRef]
- Arthur, Z.; Hugo, E.; Juliana, A. Computer vision based detection of external defects on tomatoes using deep learning. Biosyst. Eng. 2020, 190, 131–144. [Google Scholar]


| Variable | Description | Average | Variable | Description | Average |
|---|---|---|---|---|---|
| Cumulative insolation | 1275.89 | Internal humidity-sunset | 80.59 | ||
| Internal temperature-all | 19.36 | Internal humidity-evening | 84.24 | ||
| Internal temperature-daytime1 | 21.94 | Internal humidity-night | 86.36 | ||
| Internal temperature-daytime2 | 16.67 | Internal humidity-dawn | 87.40 | ||
| Internal temperature-am | 20.28 | CO-am | 417.91 | ||
| Internal temperature-pm | 24.34 | CO-daytime1 | 433.11 | ||
| Internal temperature-sunset | 20.05 | CO-daytime2 | 507.47 | ||
| Internal temperature-am | 17.33 | CO-am | 478.38 | ||
| Internal temperature-night | 16.53 | CO-pm | 404.59 | ||
| Internal temperature-dawn | 16.76 | CO-sunset | 398.67 | ||
| Internal humidity-all | 82.25 | CO-evening | 429.18 | ||
| Internal humidity-daytime1 | 78.74 | CO-night | 506.41 | ||
| Internal humidity-daytime2 | 86.08 | CO-dawn | 580.32 | ||
| Internal humidity-am | 81.92 | Greenhouse type † | · | ||
| Internal humidity-pm | 74.41 | Region ‡ | · |
| Week | fgroup | hgroup | Harvtime |
|---|---|---|---|
| 34 | 0.9775 | · | · |
| 35 | 2.0000 | · | · |
| 36 | 2.7275 | · | · |
| 37 | 3.6625 | · | · |
| 38 | 4.3975 | · | · |
| 39 | 5.0000 | · | · |
| 40 | 5.6413 | 0.6663 | 6.3112 |
| 41 | 6.2825 | 1.3325 | 6.6675 |
| 42 | 7.0625 | 1.8750 | 6.8525 |
| Hyper Parameter | Setting |
|---|---|
| No. of hidden layers | 3 |
| No. of nodes per layer | |
| Learning rate | 0.001 |
| Batch size | length of validation set of y |
| No. of epoch | 1000 |
| Activation function (hidden layer) | elu |
| Activation function (output layer) | linear |
| Optimizer (AFT-type models) | AdamW |
| Optimizer (Cox-type models) | Nadam |
| Predictive Measure | AFT | AFT-DNN | AFT-DNN-I | AFT-DNN-L |
|---|---|---|---|---|
| RMSE | 0.8257 | 0.8124 | 0.9726 | 0.8067 |
| MAE | 0.6487 | 0.6167 | 0.7375 | 0.6090 |
| Predictive Measure | Cox | Cox-DNN | Cox-DNN-I | Cox-DNN-L |
|---|---|---|---|---|
| C-index | 0.6582 | 0.6527 | 0.6506 | 0.6600 |
| IBS | 0.1125 | 0.0471 | 0.0584 | 0.0468 |
Disclaimer/Publisher’s Note: The statements, opinions and data contained in all publications are solely those of the individual author(s) and contributor(s) and not of MDPI and/or the editor(s). MDPI and/or the editor(s) disclaim responsibility for any injury to people or property resulting from any ideas, methods, instructions or products referred to in the content. |
© 2023 by the authors. Licensee MDPI, Basel, Switzerland. This article is an open access article distributed under the terms and conditions of the Creative Commons Attribution (CC BY) license (https://creativecommons.org/licenses/by/4.0/).
Share and Cite
Kim, J.; Ha, I.D.; Kwon, S.; Jang, I.; Na, M.H. A Smart Farm DNN Survival Model Considering Tomato Farm Effect. Agriculture 2023, 13, 1782. https://doi.org/10.3390/agriculture13091782
Kim J, Ha ID, Kwon S, Jang I, Na MH. A Smart Farm DNN Survival Model Considering Tomato Farm Effect. Agriculture. 2023; 13(9):1782. https://doi.org/10.3390/agriculture13091782
Chicago/Turabian StyleKim, Jihun, Il Do Ha, Sookhee Kwon, Ikhoon Jang, and Myung Hwan Na. 2023. "A Smart Farm DNN Survival Model Considering Tomato Farm Effect" Agriculture 13, no. 9: 1782. https://doi.org/10.3390/agriculture13091782
APA StyleKim, J., Ha, I. D., Kwon, S., Jang, I., & Na, M. H. (2023). A Smart Farm DNN Survival Model Considering Tomato Farm Effect. Agriculture, 13(9), 1782. https://doi.org/10.3390/agriculture13091782