Article

Spatial Characteristics and Driving Forces of the Water Footprint of Spring Maize Production in Northern China

1
Institute of Environment and Sustainable Development in Agriculture, Chinese Academy of Agricultural Sciences, Beijing 100081, China
2
Key Laboratory of Dryland Agriculture, Ministry of Agriculture and Rural Affairs of the People’s Republic of China, Beijing 100081, China
3
Department of Soil & Environmental Sciences, The University of Agriculture Peshawar, Peshawar 25130, Pakistan
4
Department of Environmental Sciences, University of Peshawar, Peshawar 25120, Pakistan
5
Institute of Agricultural Resources and Regional Planning, Chinese Academy of Agricultural Sciences, Beijing 100081, China
*
Authors to whom correspondence should be addressed.
Agriculture 2023, 13(9), 1808; https://doi.org/10.3390/agriculture13091808
Submission received: 5 July 2023 / Revised: 27 August 2023 / Accepted: 30 August 2023 / Published: 14 September 2023
(This article belongs to the Section Crop Production)

Abstract

:
Using the water footprint (WF) approach to evaluate the water-use efficiency in agricultural production is crucial for assessing the sustainable use of water resources and mitigating water scarcity and pollution. This study calculated the blue, grey, green and total water footprints of spring maize production in Northeast China in 2019 and 2020 and compared the water footprint values at the provincial and municipal scales. In addition, this study analyzed the spatial variation and drivers of the water footprint. The results show that the average water footprints of spring maize production in Northeast China in 2019 and 2020 were 1.78 m3kg−1 and 2.00 m3kg−1, out of which the grey water footprint contributed the most, accounting for 55.19% and 49.85% of the total water footprint, respectively, while the blue water footprint contributed the least, accounting for only 17.44% and 18.68% of the total water footprint. At the provincial level, the water footprint of spring maize production in Northeast China was spatially clustered, with the lowest total water footprint in Heilongjiang Province and the highest total water footprint in Jilin Province. The spatial distribution difference of the spring maize unit yield was the fundamental factor explaining the difference in the water footprint. The precipitation, surface water resources, average temperature, effective irrigated area and the proportion of effective irrigated area also had impacts on the water footprint. This study provides a scientific basis for optimizing the distribution of spring maize production in Northeast China, formulating appropriate sustainable water resource management plans, improving water-use efficiency and realizing sustainable water resource management in Northeast China.

1. Introduction

In the coming decades, water scarcity will intensify in many regions of the world due to socioeconomic development and climate change [1]. As one of the largest developing countries, China is facing a severe water shortage situation; there is a prominent contradiction between water supply and demand. Along with the mismatch between available water resources and water demand, regional water resource shortage has been exacerbated. The optimal allocation and strategy research of water resource systems is a significantly vital way to achieve sustainable development in the region [2]. Agriculture is the most water-intensive sector, with food accounting for the highest proportion, which can be a powerful lever to alleviate the dilemma of water scarcity [3].
The concept of a “Water Footprint” (WF) proposed by Hoekstra (2003) is used to describe the impact of human consumption on the water resources system [4]. The total water footprint (TWF) has three components: blue water footprint (BWF), green water footprint (GWF) and grey water footprint (GYWF). BWF is crops’ consumption of surface water and groundwater (irrigation water), while GWF is crops’ consumption of precipitation water [5]. The GYWF is the amount of fresh water required to dilute the pollutant load based on natural background concentrations and existing ambient water quality standards during crop production. A water footprint is an indicator of the direct and indirect occupation of freshwater resources, which not only measures water use, but also reflects the degree of water pollution in the production process.
In recent years, a growing number of studies have extensively studied the WF in crop production at different spatio-temporal scales using various models. Scholars have studied water footprints globally [6,7,8] and nationally [9,10,11,12,13] and have studied regional [14,15,16,17] scales for crop production water footprints. Scholars have undertaken calculations of crop WFs across varying time scales, encompassing days [18], months [19] and years [20,21]. The prominent models employed for these computations encompass the hydrological model, which is grounded in regional distribution [22]; the Aquacrop model, which is derived from water productivity analysis [23]; the DSSAT model, which is hinged on crop growth simulation [24] and the CROPWAT model that centers on crop water demand estimation [25]. These models have gained global traction, with the CROPWAT model emerging as the dominant choice for studies related to water footprint assessment in crop production within China [26,27].
Of notable significance, Northeast China constitutes the largest grain production base in the country, with spring maize occupying a central role as the primary grain crop in this region. The escalating demands of food and energy production have led to increasing water stress in Northeast China [28]. Consequently, a multitude of researchers have elected Northeast China as their focal research locale, with spring maize serving as the principal subject of investigation. These research endeavors have yielded insights into the temporal and spatial disparities of water footprints in spring maize production. Duan et al. estimated the WF of spring maize production in Northeast China for the period of 1998–2012 and then examined differences in the spatial distribution of the WF at the prefecture scale [29]. Dang et al. quantified the GWF and BWF of rain-fed maize in five growth stages in Northeast China in the 1996–2018 period and made a comprehensive assessment of the water use in each growth stage of the crop. He found that the WF of rain-fed maize in each growth stage was different [30]. Although there are some studies on the water footprint of spring maize in Northeast China, there are problems in that the research scope is limited to the province and the research years of former studies are earlier than 2018. Determining the impact of the factors that most influence water use for crop production will help to optimize farmland management and achieve sustainable agricultural production [31]. Therefore, more and more studies are focusing on the climatic factors and socioeconomic drivers of crop-related WF changes, using linear correlation and sensitivity analysis methods to explore the drivers of WF changes. Huang et al. used the extended STIRPAT model to determine the driving forces of the WF and virtual water (VW) flows and found that irrigation infrastructure in China’s water-scarce regions is the most critical driving force to effectively reduce the water footprint of crops per unit mass, especially BWF [12]. However, Hu et al. used the LMDI method to analyze the driving factors of changes in the total water footprint (TWF) and believed that the effective irrigation quota of maize in the Heilongjiang region would contribute to the increase in the WF [21]. Bocchiola et al. evaluated the sensitivity of the maize water footprint to climate changes and found that the increase in temperature and the decrease in precipitation would lead to a decrease in crop yield and an increase in the water footprint (especially BWF) [10].
So far, scholars have carried out a series of studies on the WF of spring maize production in Northeast China on different scales. However, revealing the nonlinear relationship between drivers and water footprint (WF) through a correlation analysis presents challenges. Simultaneously, a comprehensive analysis and systematic evaluation of the water footprint of spring maize in Northeast China, encompassing Heilongjiang, Jilin, Liaoning, and Dong-simeng City, remain notably absent.
In response to these gaps, this study leverages the FAO-56 CROPWAT framework to compute the crop water requirements of spring maize production in Northeast China. This approach is further enriched via integration with the ArcGIS platform, facilitating the calculation and analysis of the water footprint associated with spring maize cultivation in Northeast China. The study is oriented towards achieving the following objectives: (1) To examine the distribution of the green water footprint (GWF), blue water footprint (BWF) and grey water footprint (GYWF), as well as the comprehensive water footprint of spring maize production across Northeast China in both 2019 and 2020. (2) To investigate the spatial characteristics and underlying driving factors influencing the water footprint of spring maize production within the Northeast China region.
Drawing insights from these research findings, a judicious water management strategy is proposed to enhance the level of agricultural production. This study serves as a robust scientific foundation for spring maize production in Northeast China, offering novel perspectives and methodologies for regional agricultural management and development. Moreover, it provides a basis for water resources management in arid areas and is poised to foster the sustainable advancement of agricultural production in Northeast China.

2. Materials and Methods

2.1. Study Area

Northeast China lies between 38°43′–53°33′ N and 115°31′–135°05′ E, covering an area of 1.45 million square kilometers, including Liaoning Province, Jilin Province, Heilongjiang Province and the four eastern leagues of Inner Mongolia (City) for a total of 40 league cities. Northeast China is characterized by fertile soil and vast territory. It encompasses three major plains: the Songnen Plain, the Sanjiang Plain and the Liaohe Plain. Northeast China is characterized by a temperate monsoon climate with an uneven spatial distribution of temperature and precipitation, a hot and rainy summer and a cold and dry winter. Northeast China receives 300~800 mm of annual precipitation, 60% of which is concentrated in July~September. The average annual temperature in Northeast China is generally between −3 and 9 °C, and the accumulated temperature of ≥10 °C is between 1600 and 3600 °C∙d with sufficient sunshine, which is suitable for the growth and development of spring maize and is the main production area of spring maize in China.

2.2. Data Sources

This study utilized meteorological, phenological and statistical data to analyze spring maize production. Meteorological data were obtained from the National Earth System Science Data Center, National Science and Technology Infrastructure of China (http://www.geodata.cn) URL (accessed on 18 November 2022) and includes monthly average maximum and minimum temperatures, average wind speed, sunshine hours, relative humidity and rainfall. The data were collected from four provinces in Northeast China. Phenological data were sourced from the illustrated book of crop growth periods in China, providing information on the dates of maize sowing and harvest. Statistical data were sourced from the statistical yearbooks of provinces and the compilation of national agricultural product cost–benefit data, covering spring maize planting area, yield, fertilizer application, agricultural machinery power, effective irrigation area and per capita disposable income of rural permanent residents.

2.3. CROPWAT Model

In our study, the CROPWAT8.0 model was used to calculate effective precipitation, reference crop evapotranspiration and actual crop evapotranspiration in each prefecture [32]. The CROPWAT model was developed by the World Food and Agriculture Organization (FAO) and can be used to calculate evapotranspiration and irrigation water requirements. It enables the implementation of crop water use studies and the design and management of irrigation schemes. All calculation procedures used in the CROPWAT model are based on FAO publication No. 56 titled “Crop evapotranspiration—A guide to calculating crop water requirements” [30]. In this study, crop fertility data were obtained from the illustrated book of crop growth periods in China, and crop coefficient (Kc) data were calculated from the study of spring maize crop coefficients in Northeast China by Li et al. [33].

2.4. Calculation of WF

The international methods for quantifying water footprint comprise “bottom-up” and “top-down” approaches [34]. The “Bottom-up” approach is based on the “production tree” method of agricultural product virtual water [35]. The current commonly used method for calculating the water footprint of crop production was proposed by Hoekstra, which is based on crop evapotranspiration. The WF is calculated as the total water consumed during the crop growth process and includes GWF, BWF and GYWF. The GWF and BWF were calculated using Equations (1)–(4):
G W F = C W U g r e e n = 10 E T g r e e n Y
E T green = m i n E T c , P e
B W F = C W U b l u e / Y = 10 E T b l u e / Y
E T b l u e = max ( 0 , E T c P e )
where CWUgreen and CWUblue denote crop green and blue water uses for spring maize (m3 ha−1); ETgreen and ETblue represent the green and blue evapotranspiration (mm); Factor 10 converts water depth (in millimeters) into the water volume per land surface (m3 ha−1); Y is the spring maize yield (ton ha−1) and Pe is effective precipitation (mm), calculated according to the USDA Soil Conservation Service Method [36]. The crop evapotranspiration is calculated using the single crop coefficient approach, and ETc is computed as
E T c = K c × E T 0
where Kc is the crop coefficient.
Reference crop evapotranspiration is accounted for using the FAO Penman–Monteith formula given by FAO [37,38].
E T 0 = 0.408 R n G + γ 900 T + 273 u 2 e s e a + r 1 + 0.34 u 2
where G is the soil heat flux density (MJ m−2 day−1); T is the average temperature at a height of 2 m (°C); u2 is the wind speed at a height of 2 m (m s−1); es is the saturated vapor pressure (kPa); ea is the actual vapor pressure (kPa); ∆ is the slope of the saturated vapor pressure curve (kPa °C−1); r is the hygrometer constant (kPa °C−1) and Rn is the net radiation (MJ m−2 day−1).
Pe is the effective precipitation over the crop growing period (mm) and is calculated according to the following formula developed by the USDA Soil Conservation Service (USDA SCS) [38]:
P e d e c = P × 125 0.2 × P 125   P 250   m m 125 + 0.1 × P   P 250   mm
where P is precipitation at a month step(mm).
A portion of agricultural chemicals used in crop cultivation is absorbed by plants, while another portion enters water bodies through surface runoff and underground leaching due to precipitation and irrigation, leading to non-point source pollution. The number of freshwater resources required to comply with environmental standards is referred to as the grey water footprint. Nitrogen fertilizer constitutes a similar proportion of compound fertilizer, and nitrate nitrogen is the most active form of nitrogen during migration in the soil. Thus, nitrogen fertilizer is chosen as the representative pollutant for calculating the grey water footprint, with the nitrate nitrogen leaching rate used as a parameter. The grey water footprint is calculated using the following formula:
G Y W F = α × A R / c m a x c n a t Y
where α is the leaching rate, which is the proportion of pollution entering the water body to the total application of chemical substances; AR is the amount of fertilizer per unit in the planting area; cmax is the maximum allowable pollutant concentration and cnat is the natural background concentration of pollutants. The Cnat cannot be obtained, so it is assumed to be 0.
With regard to AR calculation, the fertilization data collected represent the total amount of fertilizers used for all crops at the city level, and there is a lack of separate data for spring maize fertilization rates. To overcome this limitation, this paper employs the method of fertilization ratio distribution to obtain maize fertilization rate data at the city level, as described in the “China Agrochemical Service Fertilizer and Fertilization Handbook”. The main crops fertilized in the Northeast Plain are classified into four categories: maize, wheat, rice and soybean. The specific allocation method is outlined as follows:
F N i = F N t o t a l × s i f i i = 1 n = 4 s i f i
A R i = F N i S i
where FNtotal is the consumption of nitrogenous fertilizer (kg); FNi is the nitrogenous fertilizer of crop i (kg); si is the sown areas of crop i (ha); fi is the nitrogenous fertilization rate, (kg ha−1) (i = 1, 2, 3 and 4; 1 is maize, 2 is wheat, 3 is rice and 4 is soja); and ARi is the fertilization rate (kg ha−1).

2.5. Spatial Autocorrelation Analysis (SAA)

SAA reflects the degree of spatial dependence among variables within a geographic area and has been widely used in water footprint studies to quantify variables in geospatial patterns [39]. Global Moran’s I and Local Moran’s I were used to conduct global spatial autocorrelation analysis and local spatial autocorrelation analysis, respectively. The former is a measure used to assess the degree of spatial autocorrelation, while the latter reflects the overall spatial aggregation degree of a certain phenomenon or thing in the research area.

2.6. Driving Factors

The driving factors of crop WF are affected by rainfall intensity [4], sunshine duration [40], average temperature [40], total power of agricultural machinery [4], unit yield, effective irrigated area [4] and per capita food consumption [4].
To evaluate the importance and influence of the driving forces of WF, we used two feature importance evaluation procedures: Pearson correlation and random forest feature importance. The Pearson correlation coefficient was used to measure the linear correlation between each driving factor and WF. It is a normalized measure of covariance, so its value is always between −1 and 1. The closer the correlation coefficient is to 1 or −1, the stronger the correlation is, and the closer the correlation coefficient is to 0, the weaker the correlation is. The Pearson correlation of two random variables X and Y (ρX, Y) is defined as follows [41]:
ρ X , Y = c o v X , Y σ X σ Y
where cov(X, Y) is the covariance of two variables, and σX and σY are the standard deviations of X and Y, respectively. Pearson correlation measures the linear correlation between two random variables. Because the relationship between ET0 and its driving forces is inherently nonlinear, random forest feature importance was used to examine nonlinear correlations, and we used Python to build the random forest model.
In this study, Pearson correlation analysis was conducted using SPSS 22.0 software, and random forest analysis was conducted using Python to determine the impact of related factors.

3. Results

3.1. WF Characteristics of Spring Maize Production

3.1.1. Characteristics of the Spring Maize GWF

The GWF is crops’ consumption of precipitation water (Figure 1). The average GWFs of spring maize production in the sample cities in 2019 and 2020 were 0.48 m3kg−1 and 0.63 m3kg−1, accounting for 23.90% and 29.01% of the total water footprint, respectively. The GWF of spring maize production is relatively concentrated, and 85% of the cities have a GWF of 0.4–0.7 m3kg−1. The city with the highest GWF in 2019 is Jilin City, Jilin Province (0.71 m3kg−1), and the city with the lowest is Shuangyashan City, Heilongjiang Province (0.085 m3kg−1). The city with the highest GWF in 2020 is Dandong City, Liaoning Province (0.88 m3kg−1), and the city with the lowest GWF is Daqing City, Heilongjiang Province (0.47 m3kg−1). At the same time, the agricultural GWF in Northeast China has no obvious characteristics of provincial-scale concentration. The agricultural GWF of Liaoning Province in 2020 increased significantly compared with 2019, and the average GWF of spring maize production in 2020 increased by 0.21 m3kg−1 compared with 2019. Shuangyashan City has the largest increase at the city level, with an increase of 644.93% in 2020 compared with 2019.

3.1.2. Characteristics of the Spring Maize BWF

The BWF is the amount of surface water and groundwater resources used directly for production. The average agricultural BWF of the sample cities is 0.34 m3kg−1, accounting for 18.10% of the total water footprint. Figure 2 shows that cities with a high BWF are distributed in all provinces. The provincial data show that the average BWF of spring maize production in Inner Mongolia in 2019 and 2020 is the highest (0.41 m3kg−1), which is 1.47 times the average, and the BWF of spring maize production in Heilongjiang Province is the lowest (0.22 m3kg−1), which is 77.8% of the average. According to the municipal data from 2019, Baicheng City, Jilin Province has the highest BWF of 0.79 m3kg−1, and the BWFs of Heilongjiang Daxing’anling, Harbin, Heihe, Jixi, Yichun and Yanbian Korean Autonomous Prefecture of Jilin Province are the lowest, at 0 m3kg−1 (Null). According to the water footprint data from 2020, Huludao City, Liaoning Province has the highest BWF of 1.07 m3kg−1, and Hegang City of Heilongjiang Province, Baishan City of Jilin Province, Benxi City of Liaoning Province, Dalian City and Dandong City have the lowest value of BWF, which is null, 0 m3kg−1. This means that there was no irrigation in the spring maize production process in these cities, and that it was purely rain-fed spring maize. From 2019 to 2020, the average BWF of each province did not change much, but the BWF of the city changed significantly. In 2020, the BWFs of Heihe City and Jixi City in Heilongjiang Province and Huludao City in Liaoning Province both increased by more than 0.50 m3kg−1, and Dalian City in Liaoning Province reduced its BWF by 0.52 m3kg−1 compared with 2019.

3.1.3. Characteristics of the Spring Maize GYWF

The grey water footprint of spring maize production is an assumed amount of water that is potentially needed to assimilate pollution (Figure 3). The average GYWFs of the sample cities from 2019 to 2020 were 0.9 m3kg−1 and 1.00 m3kg−1, accounting for 55.19% and 49.85% of the total, with a large inter-provincial variation range and obvious regional differences. At the provincial level in 2019, Jilin Province had the highest average grey water footprint of 1.33 m3kg−1, which was 34.94% higher than the average and 2.38 times that of Heilongjiang Province. In 2019, the average water footprint of spring maize in Heilongjiang Province was the lowest at 0.56 m3kg−1, which was only 56.74% of the average value in Northeast China, and the grey water footprint in Heilongjiang Province was between 0.25 and 0.80 m3kg−1, with the smallest fluctuation. At the provincial level in 2020, Jilin Province still had the highest grey water footprint (1.26 m3kg−1), and Heilongjiang Province had the lowest grey water footprint (0.56 m3kg−1). At the city level in 2019 and 2020, the grey water footprints of Dalian City and Huludao City in Liaoning Province ranked first in the sample data (2.03 m3kg−1 2.62 m3kg−1). The lowest values of the grey water footprint in the two years occurred in Hegang City, Heilongjiang Province, which were 0.27 m3kg−1 and 0.26 m3kg−1, which were only 47.61% of the average value of Heilongjiang Province.

3.1.4. Total Water Footprint (TWF)

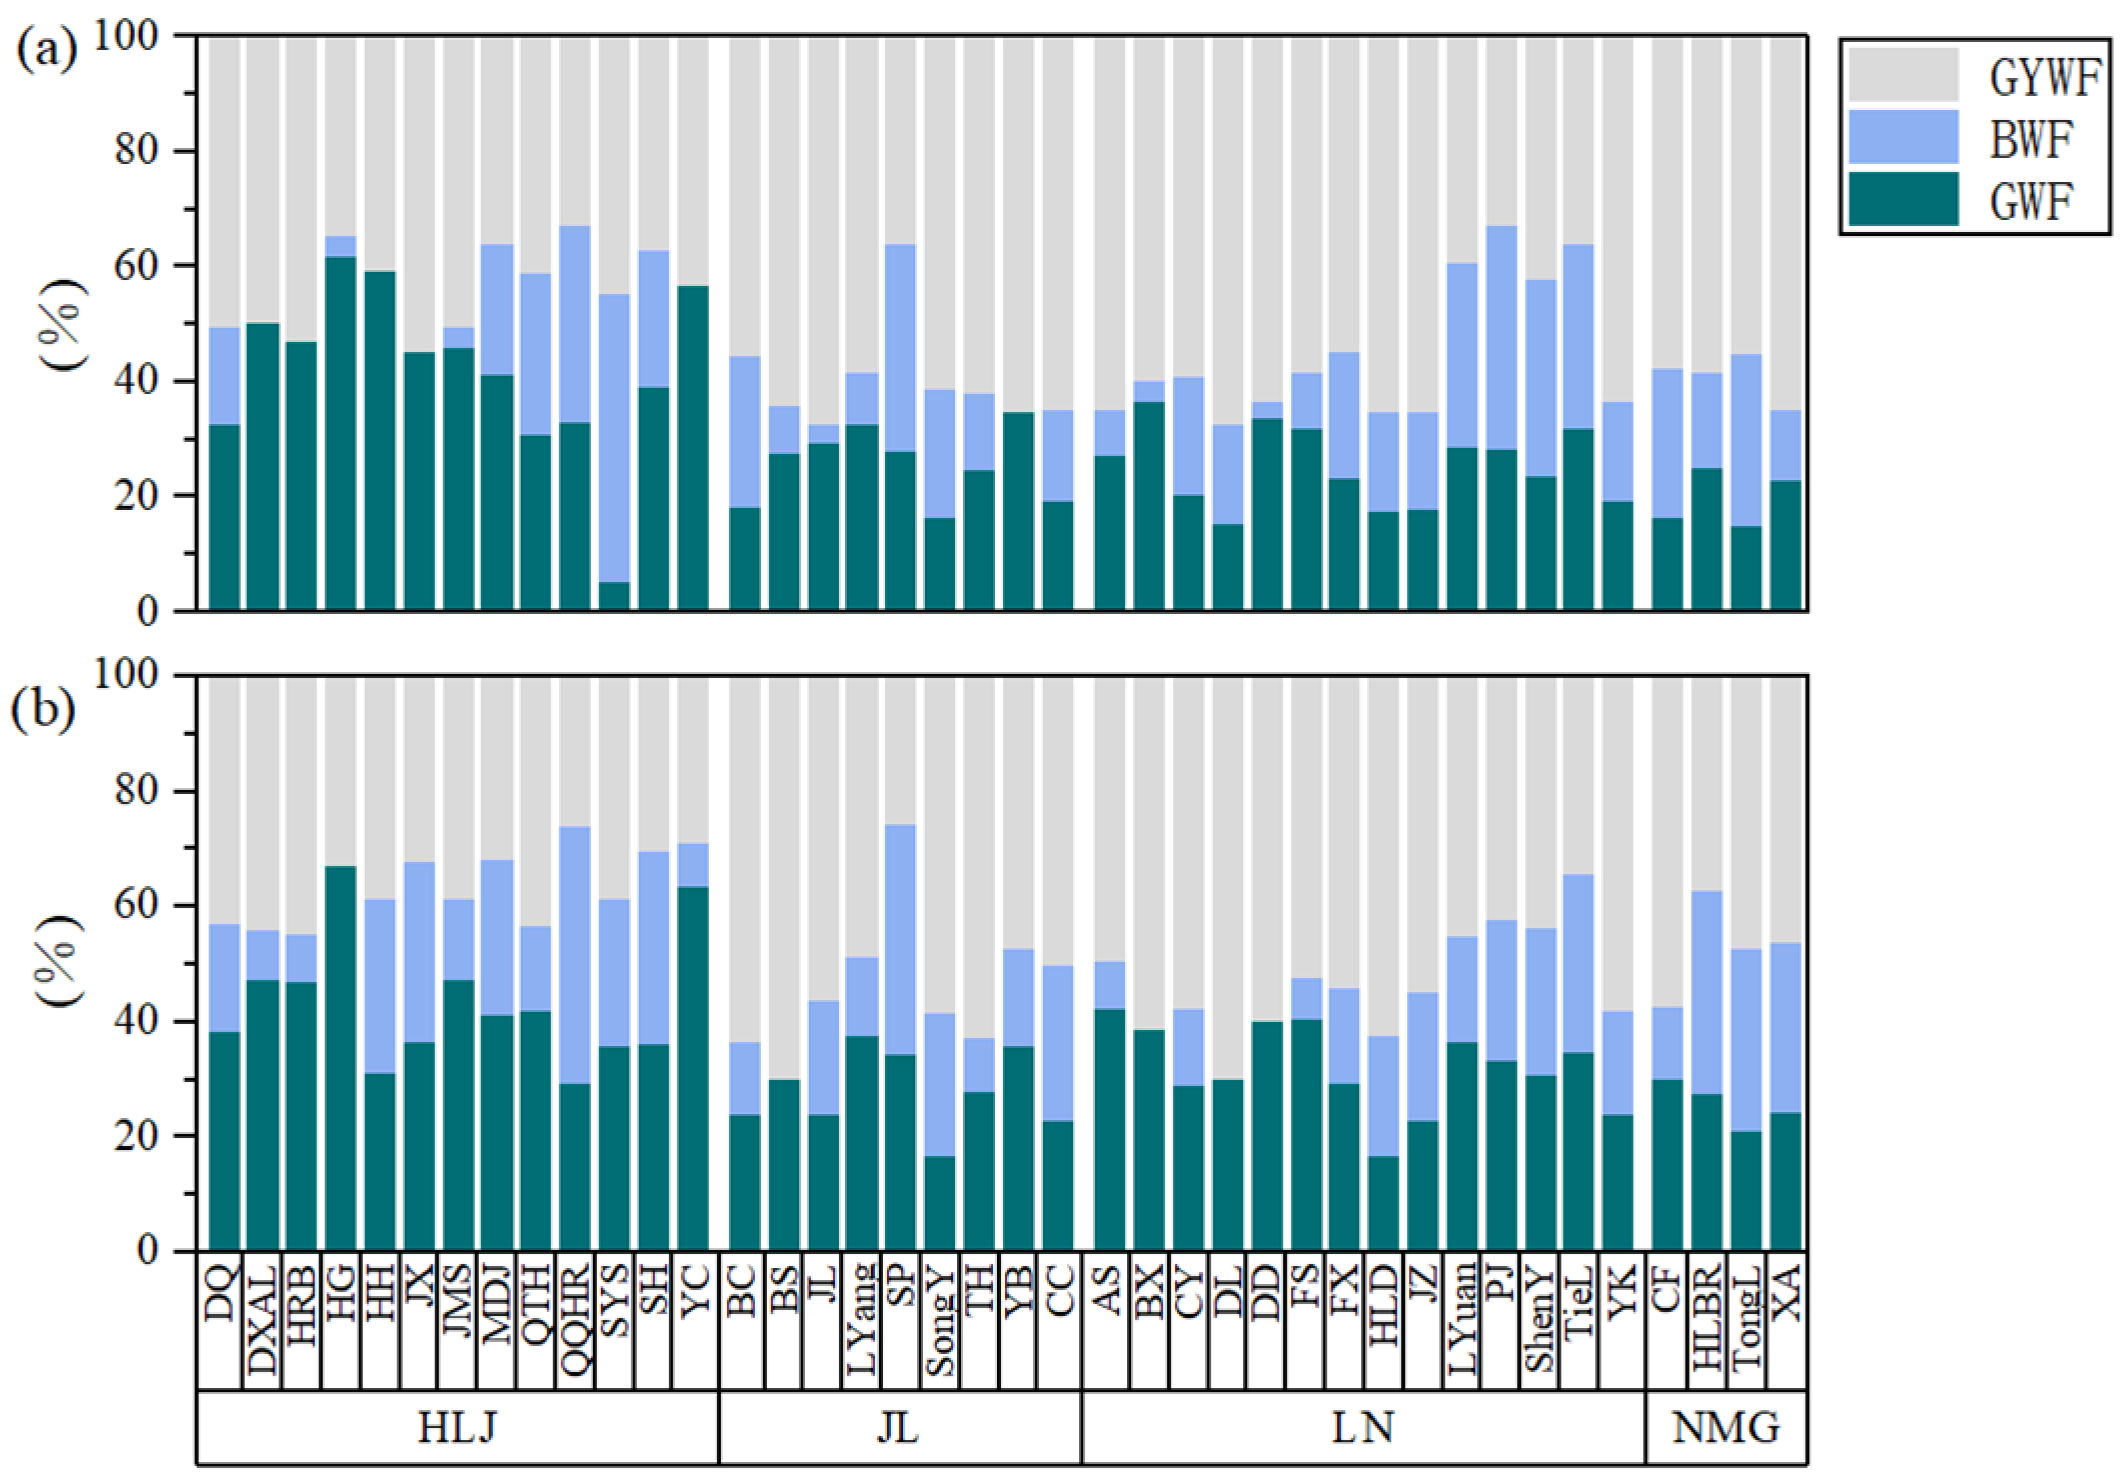
In 2019, the average water footprint of spring maize production in Northeast China was 1.78 m3kg−1. The GWF, BWF and GYWF were 0.49, 0.32 and 1.15 m3kg−1, respectively. In 2020, the average water footprint of spring maize production in Northeast China was 2.00 m3kg−1, and the GWF, BWF and GYWF were 0.65, 0.36 and 1.16 m3kg−1, respectively. The GYWF accounted for 52.5%, which is more than half of the crop TWF over the two-year period. Figure 4 shows the water footprint composition of spring maize production in 40 cities (banners) in four provinces (regions) in Northeast China in 2019 and 2020. In terms of water footprint composition, during the 2019–2020 period, the TWF of the grey water footprint of crops accounted for the highest proportion (52.4%), followed by GWF (29.5%) and BWF, which accounted for only 18.1%. In terms of spatial distribution, there are obvious spatial differences in the water footprint of maize production in Northeast China. From the perspective of each province (region), the water footprint of maize production in Jilin Province was the highest (2.20 m3kg−1 2.23 m3kg−1), and the water footprint of maize production in Heilongjiang Province was the lowest (1.28 m3kg−1 1.54 m3kg−1). Heilongjiang, which had the lowest water footprint, is 36.7% lower than Jilin. In prefecture-level cities, the city with the highest water footprint of maize production in Heilongjiang Province in 2019 was Qitaihe City (2.17 m3kg−1), and the city with the lowest water footprint was Hegang City (0.78 m3kg−1). In 2019, the city with the highest water footprint of maize production in Jilin Province was Baicheng (3.01 m3kg−1), and the city with the lowest water footprint was Siping (1.46 m3kg−1). In 2019, the city with the highest water footprint of maize production in Liaoning Province was Huludao City (3.10 m3kg−1), and the city with the lowest water footprint was Panjin City (1.24 m3kg−1). In 2019, the city with the highest water footprint of maize production in the four eastern leagues of Inner Mongolia was Xing’an League (2.54 m3kg−1), and the city with the lowest water footprint was Hulunbuir (1.47 m3kg−1). In 2020, the city with the highest water footprint of maize production in Heilongjiang Province was Heihe City (2.02 m3kg−1), and the city with the lowest water footprint was Hegang City (0.79 m3kg−1). In 2020, the city with the highest water footprint of maize production in Jilin Province was Jilin City (2.88 m3kg−1), and the city with the lowest water footprint was Liaoyang City (1.52 m3kg−1). In 2020, the city with the highest water footprint of maize production in Liaoning Province was Huludao City (5.14 m3kg−1), and the city with the lowest water footprint was Panjin City (1.43 m3kg−1). In 2020, the city with the highest water footprint of maize production in the four eastern leagues of Inner Mongolia was Tongliao City (2.23 m3kg−1), and the city with the lowest water footprint was Hulunbeier City (1.73 m3kg−1).
From 2019 to 2020, the water footprint of maize production in Northeast China had certain time differences. The water footprint of maize production in Northeast China increased by 12.3 percent in 2020 compared to 2019. Among them, the green water footprint increased the most, accounting for 64.7% of the total increase. At the provincial level, the total water footprints of Heilongjiang, Jilin and Liaoning all increased in 2020, among which Heilongjiang and Liaoning saw the largest changes, increasing by 19.9% and 18.6%, respectively. Inner Mongolia was the only province (region) in 2020 where the total water footprint decreased, which was primarily due to a reduction in the grey water footprint. At the city level, Huludao City in Liaoning Province had the largest increase in its water footprint in 2020, with an increase of 2.05 m3kg−1. Huludao City’s green, blue and grey water footprints increased, with the grey water footprints accounting for the largest proportion. The water footprints of maize production in Baicheng City, Jilin Province and in Xing’an League, Inner Mongolia Autonomous Region in 2020 were more than 0.50 m3kg−1 lower than those in 2019.

3.2. Spatial Characteristics of WFs of Spring Maize Production

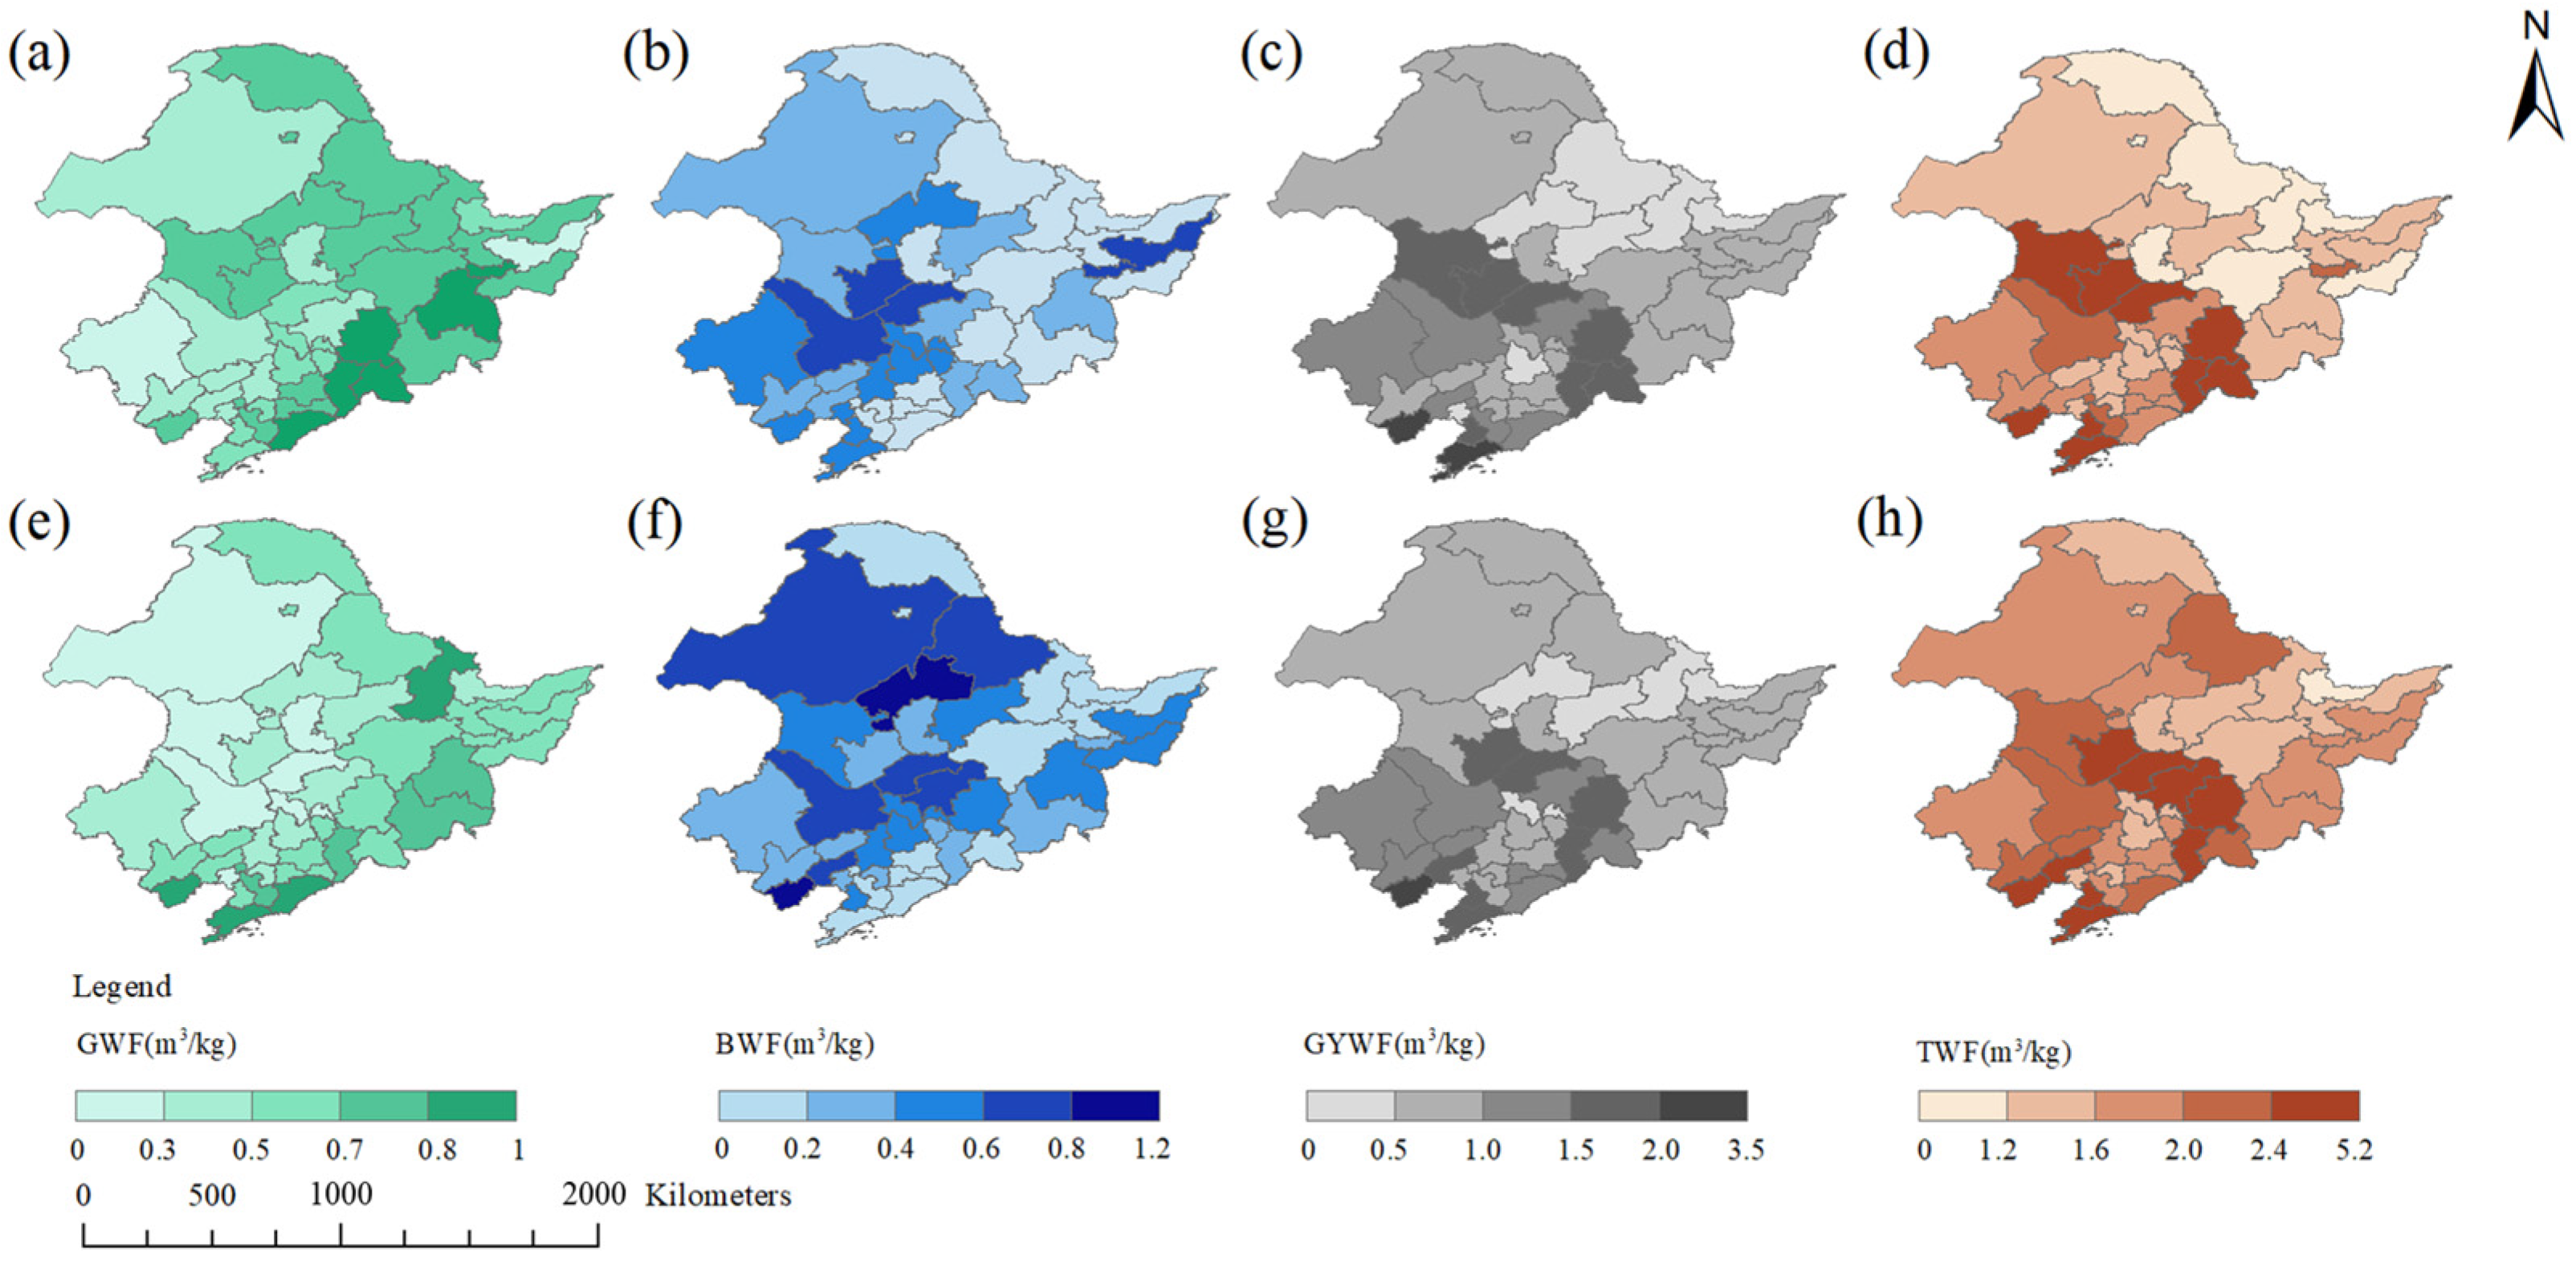
Figure 5 shows the spatial characteristics of the water footprint of maize production in Northeast China. The spatial autocorrelation method was used to analyze the spatial heterogeneity and interdependence of WF. As shown in Table 1, in 2019 and 2020, the Moran’s I of the global autocorrelation of GWF, BWF, GYWF and TWF among the cities in Northeast China was >0, indicating that the water footprint among the cities is positively correlated in space. At the same time, except for GWF and BWF in 2019, the standardized Z values of other WFs were higher than the critical value (2.58), which indicated significant spatial autocorrelation (p < 0.01).
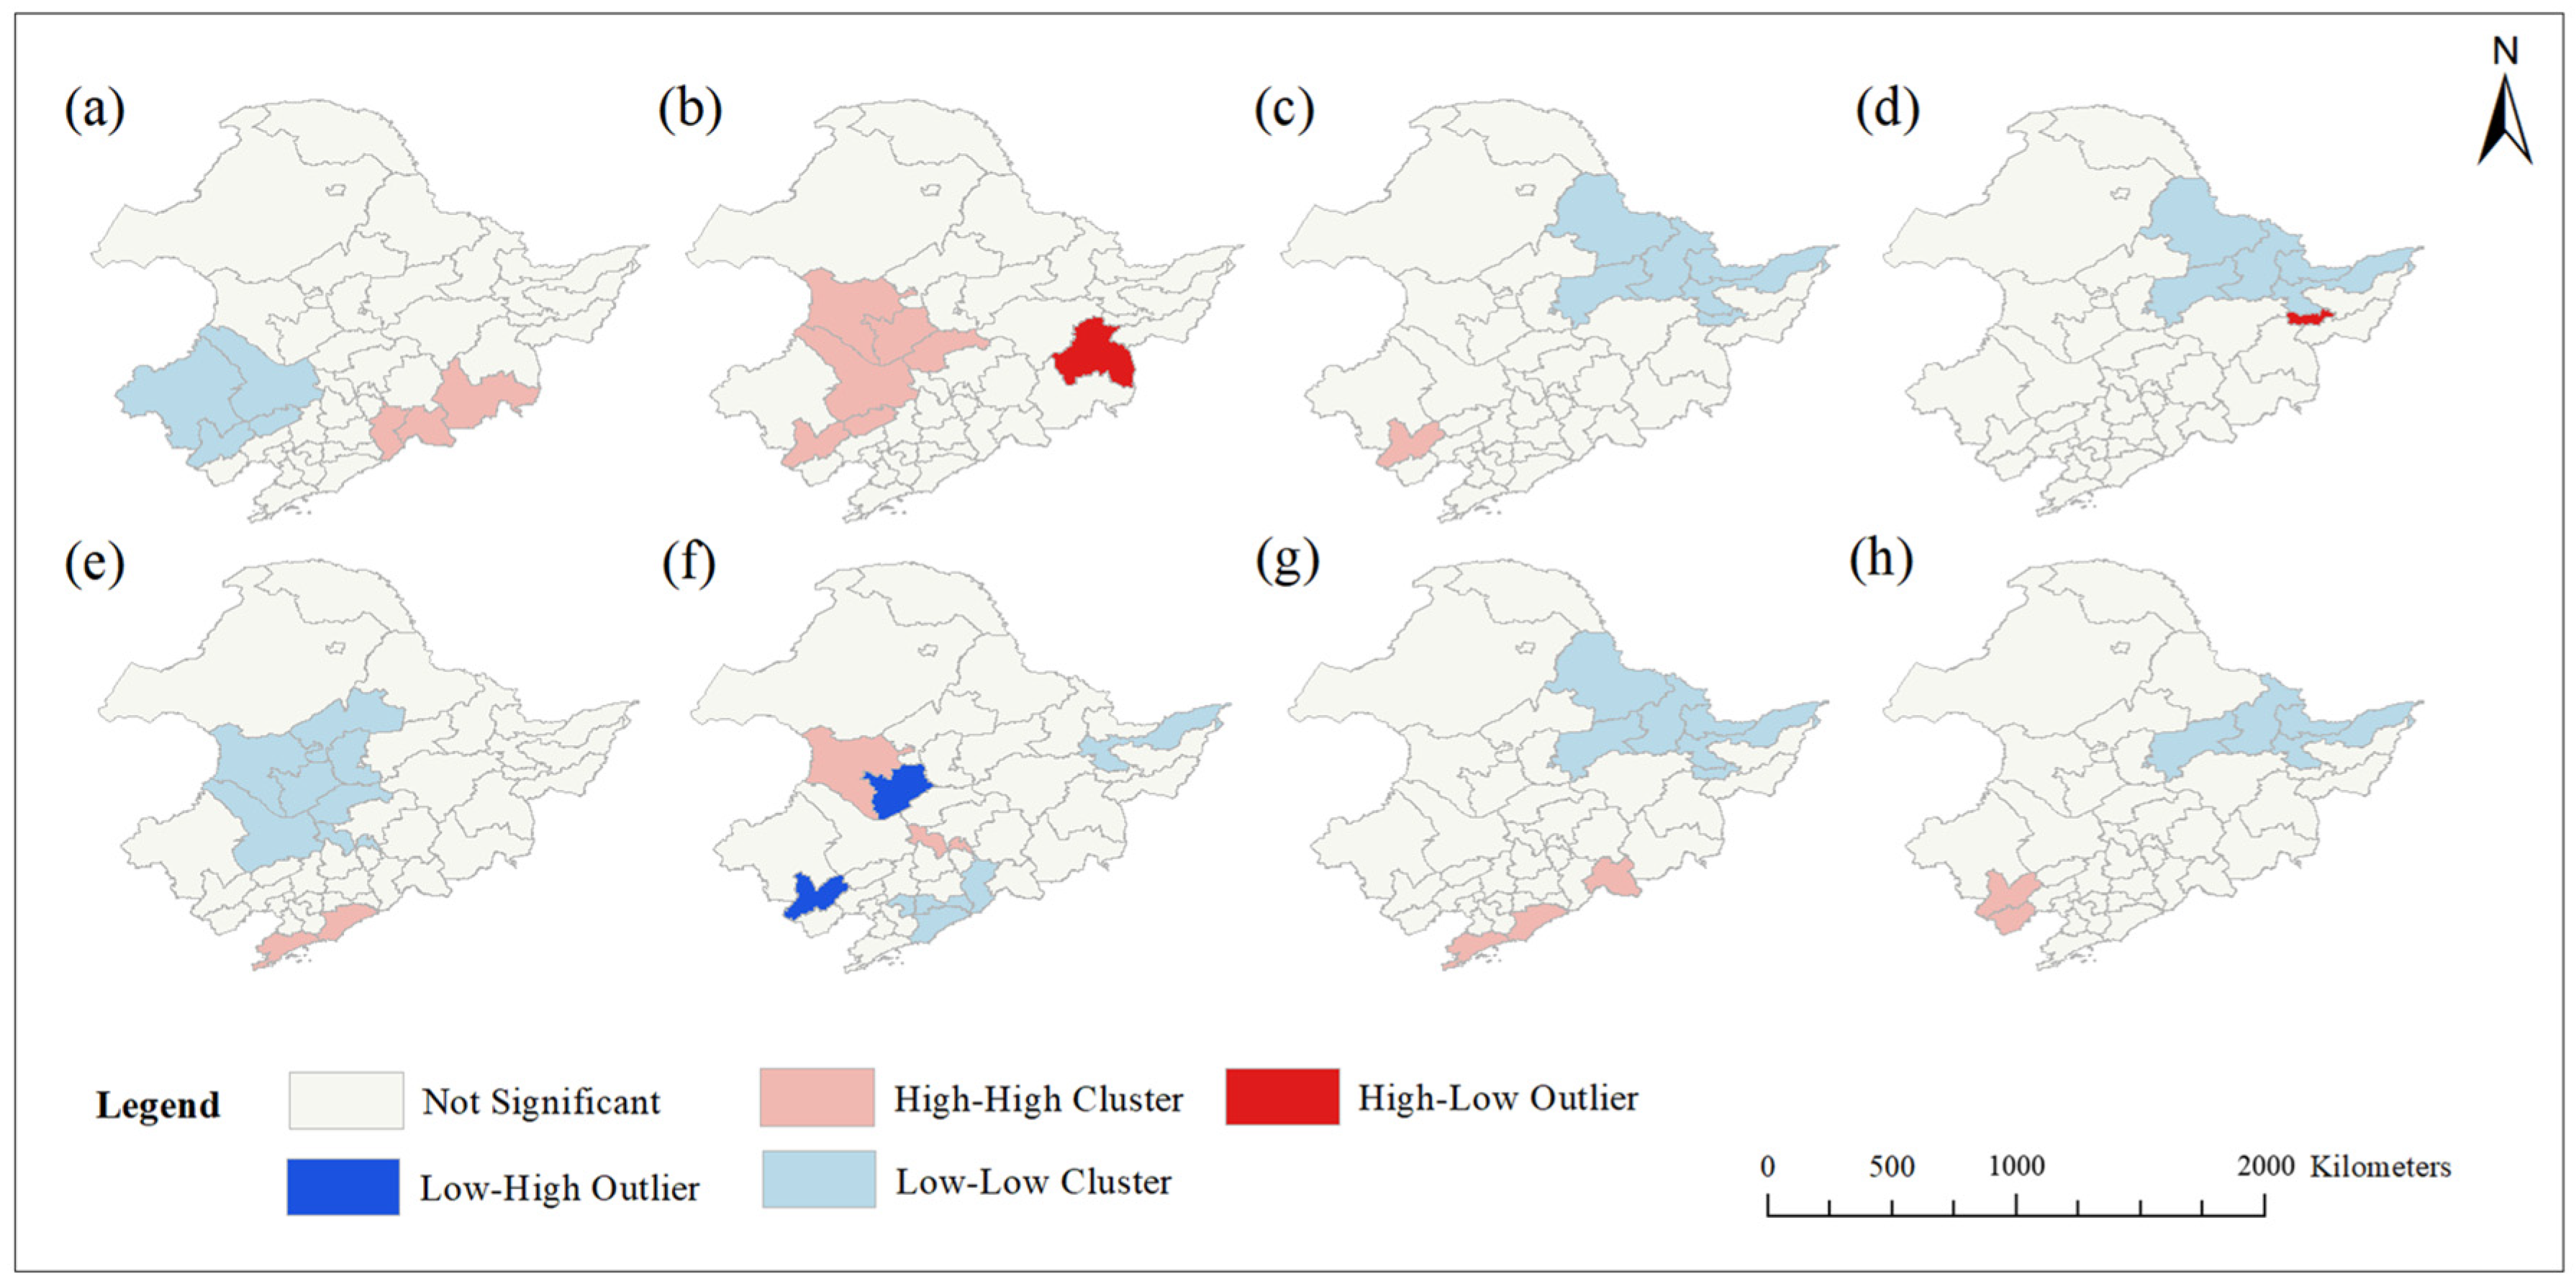
An analysis of the WF in Northeast China using LISA is shown in Figure 6. The analysis shows that for the spatial autocorrelation results of TWF, there are two high–high agglomeration states, which are located in the southwestern region of Liaoning Province. Low–low agglomeration states are mainly distributed in the northern part of Heilongjiang Province. Qitaihe City in Heilongjiang Province has a high–low agglomeration state, but no low–high agglomeration state was found. According to the LISA results of the GWF, high–high agglomeration states are mainly distributed in the eastern coastal areas of Jilin and Liaoning provinces, and low–low agglomeration states are mainly distributed in the southwest of Northeast China. No high–low agglomeration or low–high agglomeration states were found. According to the LISA results of the BWF, the high–high agglomeration states are mainly distributed in the southwest of Heilongjiang Province, and the low–low agglomeration states are mainly distributed in the southeastern part of Jilin Province and the northeastern part of Liaoning Province. In 2019, Mudanjiang City had a high–low agglomeration state, and in 2020, Chaoyang City and Baicheng City had low–high agglomeration states. According to the LISA results of the GYWF, high–high agglomeration states are mainly distributed in the southeastern part of Liaoning Province, and low–low agglomeration states are mainly distributed in the northern part of Heilongjiang Province. Low–high and high–low agglomeration states were not found.

3.3. Driving Force Analysis

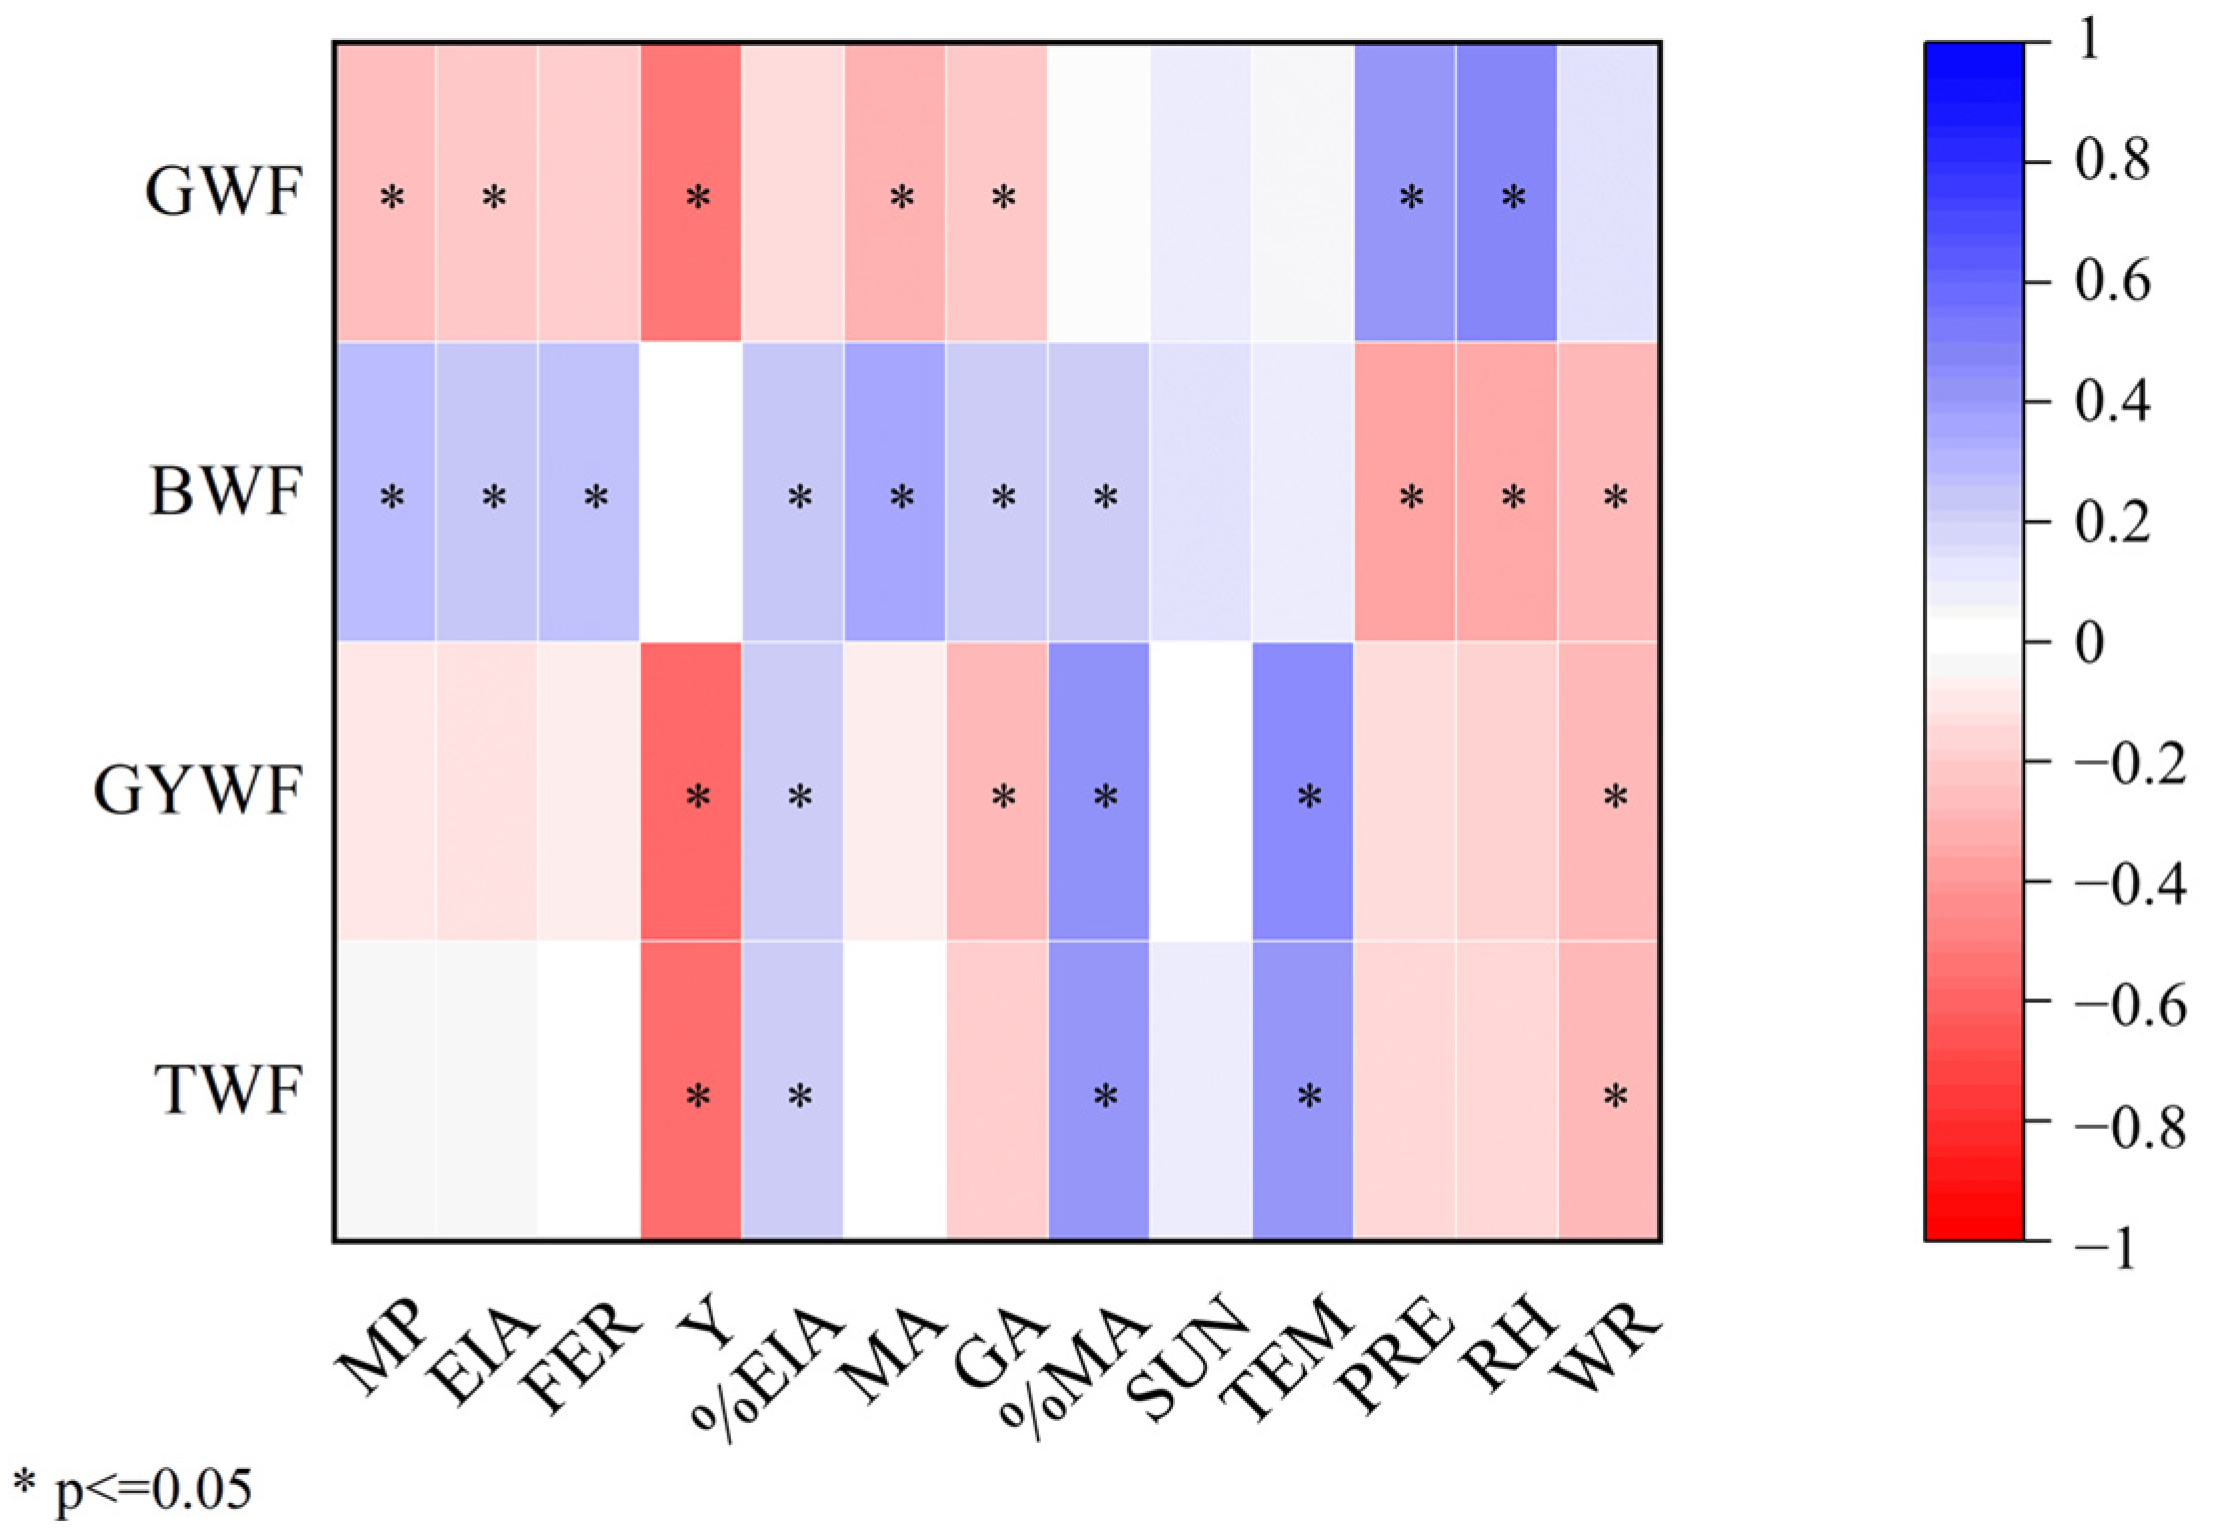
The influence of the total power of maize production was studied, and the water footprint of maize is closely related to climatic factors and socioeconomic factors. The heat map of the correlation between each influencing factor and the WF is shown in Figure 7. From the perspective of water footprint components, precipitation and phase humidity are significantly positively correlated with the GWF (p < 0.05), and the total power of agricultural machinery, effective irrigated area, maize yield per unit area, area of sown maize and area of sown grain are significantly negatively correlated with the GWF of maize production in Northeast China (p < 0.05). The total power of agricultural machinery, effective irrigated area, amount of fertilizer application, proportion of effective irrigated area, area of sown maize, area of sown grain and maize planting proportion were significantly positively correlated with the BWF (p < 0.05). Precipitation, phase humidity and surface water resources were significantly negatively correlated with the BWF. The proportion of effective irrigated area, the proportion of maize planting and the average temperature were significantly positively correlated with the grey water footprint of maize production, and the yield per unit area of maize, the sown area of grain and the amount of surface water resources were significantly negatively correlated with the GYWF. The proportion of effectively irrigated area, the proportion of maize planting and the average temperature were significantly positively correlated with the TWF of maize production and the yield per unit area of maize, and the amount of surface water resources were significantly negatively correlated with the TWF (p < 0.05). From the perspective of the influence of each driving factor, the yield factor has the greatest impact on the water footprint and has a very significant negative correlation with the GWF, GYWF and TWF (p < 0.01).
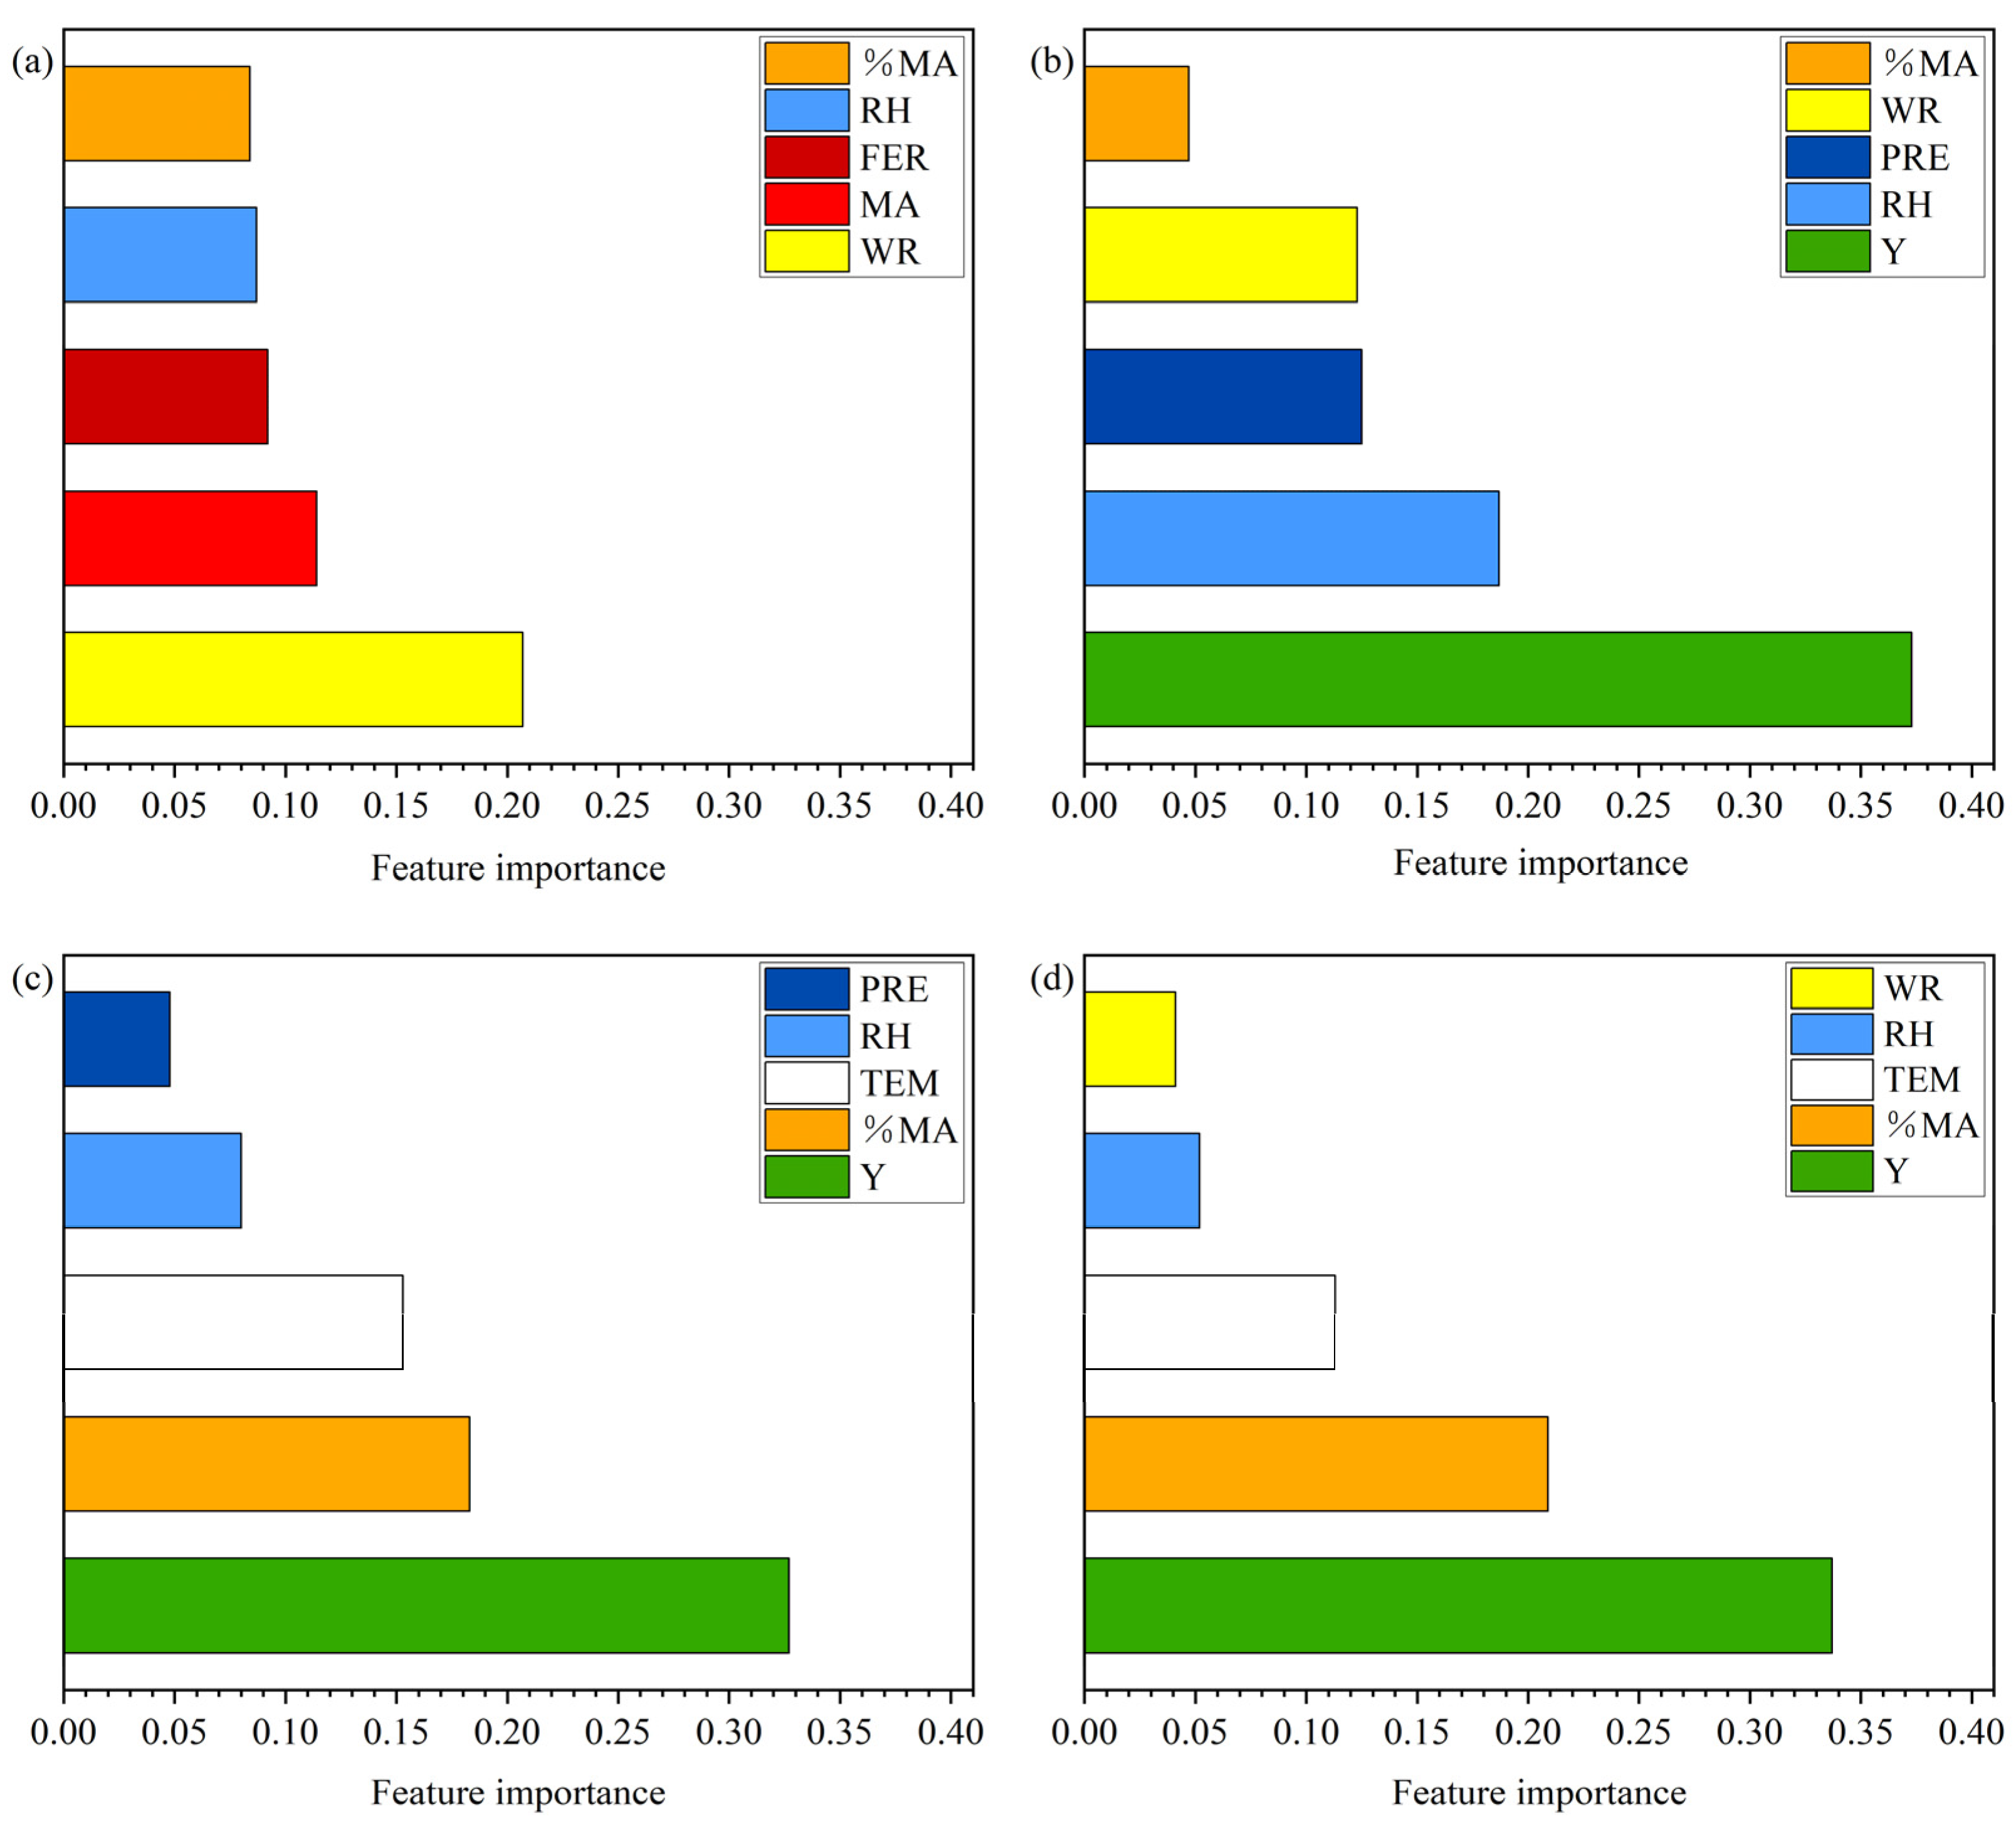
The random forest algorithm was used to analyze the importance of factors affecting change in the water footprint of maize production, and the importance of variables was compared. The results in Figure 8 show that the yield per unit area of maize is the most important factor affecting the GWF, GYWF and TWF, and the importance ratios are 33.70%, 37.30% and 32.70%, respectively. The amount of surface water resources is the most important factor affecting the BWF. The ratio is 20.70%. The importance of influencing factors on the GWF is ranked from high to low: yield per unit area of maize > sunshine hours > rainfall > surface water resources > proportion of maize planting area. The order of importance of influencing factors on the BWF is as follows: surface water > the amount of resources > maize planting area > fertilization rate > sunshine hours > effective irrigated area ratio. The order of importance of influencing factors on the GYWF from high to low is as follows: maize yield per unit area > maize planting area ratio > average temperature > sunshine hours > rainfall. The ranking of the importance of influencing factors on the TWF from high to low is as follows: yield per unit area of maize > proportion of maize planting area > average temperature > sunshine hours > surface water resources.

4. Discussion

Due to the advantage of the crop–water relationship, reducing the water footprint is considered a fundamental way to improve water-use efficiency and relieve regional water stress (both quantitatively and qualitatively) [42,43]. This study investigated the water footprint of maize production in Northeast China, taking into account both natural and social factors impacting the water footprint. The results show that yield factors are one of the key drivers of water use in maize production.
Notably, in this study, solar radiation, temperature, wind speed, and relative humidity/dew point were utilized to simulate the process of evapotranspiration. The employed dataset consisted of monthly measurements. This method is widely used internationally [29,44,45]. This approach obviated the need for field monitoring data and water consumption records, making the data acquisition process straightforward. It enabled the calculation of the water footprint over a wide range and extended periods. However, there were certain limitations. For instance, the estimated evapotranspiration differed from that observed in the field, agronomic measures’ influence on the water footprint was not considered, and ideal conditions were assumed. In addition, in the calculation of the grey water footprint, the statistical yearbook does not have data on the nitrogen application of each crop, and can only be simulated according to the distribution rules, so the nitrogen application may be different from the actual situation. Therefore, future research endeavors should focus on refining the model and calculation method to suit varying production conditions across different regions and to better reflect actual agricultural practices.

4.1. Analysis of Spatial Differences in the Water Footprint of Spring Maize Production in Northeast China

The maize planting area in Northeast China accounts for 26.6% of the country’s total and plays an important role in China’s grain production [43]. Therefore, the evaluation of the spring maize WF is of great significance for regulating regional water resources and alleviating water shortages. Previous studies of the WF, which calculated the maize yield in Northeast China on a global scale, provided a reference for our study. In this study, the average values of the GWF, BWF, GYWF and TWF of municipal spring maize production in Northeast China from 2019 to 2020 were estimated via evapotranspiration to be 0.558, 0.342, 0.989 and 1.889 m3kg1, respectively. Mekonnen and Hoekstra calculated the water footprint of global crop production from 1996 to 2005 based on a grid-based dynamic water balance model, and the global average water footprint of maize was 1.222 m3kg1 [44]. Dang et al., based on the CROPWAT model, estimated that the GWF, BWF, GYWF and TWF of maize production in Northeast China from 1996 to 2018 were 0.696, 0.040, 0.271 and 1.007 m3kg1, respectively [30]. Duan et al. explored the spatial variation of the WF in Northeast China from 1998 to 2012, and the calculation results of the GWF, BWF, GYWF and TWF were 0.525, 0.216, 0.288 and 1.029 m3kg1, respectively [45]. Variations in the maize WF results were associated with different models under different study periods.
From the results of each province (autonomous region), this study estimated that the TWFs in Heilongjiang, Jilin, Liaoning and Inner Mongolia in the 2019–2020 period were 1.413, 2.233, 2.087 and 1.965 m3kg1, respectively. The WF of maize production in Jilin Province was 1.58 times and 1.13 times that of Heilongjiang Province and Inner Mongolia, respectively. The main reason is that Jilin Province consumes the most GYWF. The main reasons for the high GYWF in the Jilin area were put forward. The amount of agricultural chemical fertilizer per mu in Jilin Province was higher than that of other provinces, and excessive chemical fertilizer pollutes the water resources of maize. The excessive application of chemical fertilizers in Northeast China is common in crop production in the region. Inner Mongolia has the highest BWF (0.474 m3kg1) and the lowest GWF (0.442 m3kg1), because Inner Mongolia has little rainfall, lacks water resources and relies on irrigation water. Due to low rainfall and a lack of water resources in Inner Mongolia, the BWF is significantly higher in Inner Mongolia. In addition, the BWF of maize production in the water-rich Heilongjiang region is relatively low at 0.28 m3kg1. Due to the high rainfall in some cities, the water demand for crop growth has been met, and the BWF of some cities is zero.

4.2. Driving Factors and Spring Maize WF

The spatial distribution difference of the unit yield of maize is the fundamental factor explaining the difference in the WF. Yield factors were significantly negatively correlated with the GWF, GYWF and TWF in every province in Northeast China, indicating that the maize water footprint is largely influenced by agricultural management. According to Zhuo et al.’s research, it is believed that an increase in the crop yield can help to reduce the per capita crop consumption WF across the nation [46], so it can improve the level of agricultural management, increase the crop yield and then reduce the water footprint.
Climate factors had a significant impact on the water footprint in Northeast China. Precipitation had a great impact on regional water resources and the GWF of maize production. The reduction in effective precipitation led to the dependence of maize on irrigation water [47], thus increasing the BWF and reducing the GWF, which is consistent with Cao’s 2020 research results. This is consistent with the conclusion that it is one of the main driving factors of WF [42]. Surface water resources in different regions of Northeast China vary greatly and have a significant impact on both the GWF and BWF (p < 0.05). The lack of surface water resources will increase the water footprint, which is consistent with the actual situation. There is a high concentration of WF in Liaoning, but the total water resources in Liaoning Province are the lowest among the four provinces (regions), which shows that it is necessary to adjust the maize cultivation measures according to local water resource conditions and to appropriately use straw and plastic film mulching to reduce field water evapotranspiration. The sunshine hours had no significant effect on the water footprint of maize production. The sunshine hours in Northeast China gradually decrease from southeast to northwest, but there is no obvious difference in the WF distribution between the east and west. Although maize is a short-day plant, the requirement for sunshine is not very strict, so the response to sunshine hours is weak. However, the research by Tan et al. believes that the sunshine duration is the determinant of summer maize ETc [48]. The different results may be due to differences in the analysis locations and crop varieties. The mean temperature was significantly positively correlated with the GYWF and TWF of maize production, possibly because the low temperature during the maize growth period in Northeast China reduced crop evapotranspiration [49].
The Impact of socioeconomic drivers on the water footprint was equally important. The effective irrigated area had a great influence on the GWF and BWF. The increase in the effective irrigated area significantly increased the BWF of maize production. This conclusion is different from the conclusion of Huang et al., who believed that irrigation infrastructure is the most critical driving factor to effectively reduce the water footprint of crops per unit mass, especially the BWF [12]. At the same time, an increase in the proportion of effective irrigated areas will also increase the BWF, GYWF and TWF of maize production, but Cao’s research results suggest that the proportion of irrigated area was the main driver of the WF and that these factors guide the reduction in the water footprint [42]. In this study, the effective irrigated area is positively correlated with the irrigation water consumption, and the increase in the effective irrigated area will also increase the irrigation water and thus enhance the BWF of crop production. The proportion of the area of sown maize has a certain influence on the BWF, GYWF and TWF of maize production. This is because the Northeast region has attached great importance to maize production in recent years, concentrating on the research of maize planting technology and the demonstration and promotion of the whole mechanization technology to increase maize production, thereby reducing the WF.

4.3. Recommendations for the Future Development of Spring Maize Production in Northeast China Based on Water Footprint

Northeast China is one of the important grain production areas in China. Maize is also a major contributor to the water footprint of crops in Northeast China. This study found that there were significant differences in the TWF of maize production in the provincial and municipal regions of Northeast China. As a whole, although Heilongjiang Province has the largest maize planting area in Northeast China and even in the country, its maize production TWF still maintains at a relatively low level in the region. According to the results of the correlation analysis, the average temperature and annual precipitation have significant positive effects on the GWF of maize production in Heilongjiang, while the per capita disposable income of rural permanent residents has a negative correlation with the GWF of maize production in Heilongjiang. The complete production facilities and mature farming model brought about by the positive cycle of high income and high investment have potentially created the lowest TWF status in Heilongjiang Province. Studies have found that the establishment of more complete farmland rain collection or irrigation facilities will help to improve agricultural water-use efficiency and optimize the water-use structure in maize production [50]. The average grey water footprint of maize production in Heilongjiang Province is 0.56 m3kg−1, which is only 56.44% of the average value in Northeast China. Fertilizer use, precipitation and agricultural irrigation management practices are usually significantly related to the crop grey water footprint [51]. Although the application of fertilizers has brought about an increase in the yield, it has also brought about an increase in soil pollutants and freshwater ecotoxicity and a decrease in the ecosystem quality [52]. According to the water footprint accounting results, it is particularly important to reasonably balance the increases in fertilizer application and crop yield. Heilongjiang is the largest commercial grain production base in China. Although there are many problems such as aging equipment and backward management models, the complete water-saving irrigation facilities and mature large-scale agricultural production experience are worthy of regional promotion [53]. In addition, the integrated mulching technology of conservation tillage promoted in Northeast China can effectively coordinate the relationship between crop yield, water consumption and carbon emission reduction, and is also one of the effective ways to improve the water-use efficiency and production efficiency of maize [54]. Therefore, based on the analysis results of the water footprint of maize production in Northeast China, it is recommended to learn from Heilongjiang Province, which has the most reasonable water footprint structure in the region, to increase the construction of agricultural infrastructure, improve the degree of agricultural mechanization, rationally use fertilizers and update advanced agricultural management measures [55] to increase maize productivity and reduce the WF for sustainable water resource management in Northeast China.
This study revealed significant differences in the water footprint of maize production within provincial regions in Northeast China. Therefore, it is necessary to formulate different maize production strategies for different provinces and cities in the region. The southern area of Jilin Province is the spatial concentration area of a high WF in maize production, and an excessive fertilization level is the main reason for the high WF and GRWF [56]. Although increasing the amount of fertilizer application can increase the maize yield, based on the actual local situation, excessive fertilization has created a risk of damage to the structure of the black soil layer and has had a large number of negative impacts on the ecosystem. Therefore, the rational application of fertilizers according to maize fertilizer requirements, considering the marginal effects of fertilization and advocating the combined application of organic and inorganic fertilizers, is conducive to the long-term sustainable development of local agricultural production [57]. Inner Mongolia has a high BWF and a low GWF gathering area for maize production. This is because Inner Mongolia is located inland and the annual rainfall is small, so it cannot meet the needs of crop growth, and irrigation is needed to meet the water demand of crops. Therefore, Inner Mongolia can introduce water-saving irrigation technology, which improves the irrigation management system, reduces the consumption of blue water in transportation [58] and increases the utilization coefficient of irrigation water. The southeast area of Liaoning Province is the spatial aggregation area of a high maize yield WF. The soil in this area is poor and not suitable for growing maize. At the same time, the eastern part of Liaoning Province is a mountainous area, and the cultivated land is loosely distributed, which is not conducive to large-scale machinery operations. Therefore, it is necessary to rationally plan the maize planting area and optimize the layout of maize production.

5. Conclusions

So far, scholars have conducted studies on the WF at different scales (such as global, national and regional scales). This study calculated the water footprint of spring maize production in 40 cities in Northeast China and analyzed the climatic and socioeconomic drivers associated with maize production. From the perspective of water footprint composition, the grey water footprint contributed the most to the total water footprint, accounting for 52.5%, and the BWF accounted for the smallest contribution, accounting for 18.1%. The water footprint in Northeast China presents spatial aggregation, and the global spatial autocorrelation of the water footprint is significant. From 2019 to 2020, the TWFs of Heilongjiang, Jilin, Liaoning Province and the four eastern leagues of Inner Mongolia were 1.413, 2.233, 2.087 and 1.965 m3kg−1, respectively. Among them, the water footprint of maize production in Heilongjiang was the lowest, and the water footprint of maize production in Jilin was the highest. Socioeconomic driving factors and climatic factors are the main factors causing the difference in the water footprint, and the difference in the spatial distribution of maize unit yield is the fundamental factor explaining the difference in the WF. Among the climatic factors, precipitation, surface water resources and average temperature all have a great influence on the WF of maize production, while sunshine hours have no significant effect on the water footprint of maize production. Among the socioeconomic driving factors, the increase in effective irrigated areas and the proportion of effective irrigated areas will lead to the increase in crop water consumption and the WF, and so the increase in the proportion of maize planting areas will reduce the WF of maize production. Therefore, different maize production strategies should be formulated for different provinces and cities in the region, and it is necessary for the government to formulate appropriate sustainable water resource management plans to improve the water-use efficiency and achieve sustainable water resource management in Northeast China.

Author Contributions

Conceptualization, X.Z., Y.Z. and W.D.; data curation, X.Z., J.S. and E.L.; funding acquisition, I.A.M., W.D. and E.L.; methodology, J.S.; project administration, W.D.; resources, Y.Z.; software, M.L. and I.A.M.; supervision, M.L., S.K. and E.L.; validation, Q.L. and W.D.; visualization, X.Z.; writing—original draft, X.Z., Y.Z. and W.D.; writing—review and editing, S.U.Z., B.K. and Y.Z. All authors have read and agreed to the published version of the manuscript.

Funding

This work was supported by the National Key Research and Development Program of China (2021YFE0101300), Chinese Academy of Agricultural Sciences Basic Research Operating Expenses (Y2023LM22) and the Bio-Water Saving and Dry Farming Innovation Team Project of CAAS.

Institutional Review Board Statement

Not applicable.

Data Availability Statement

The data provided in this study are available from the corresponding authors upon request.

Conflicts of Interest

The authors declare no conflict of interest.

References

  1. Greve, P.; Kahil, T.; Mochizuki, J.; Schinko, T.; Satoh, Y.; Burek, P.; Fischer, G.; Tramberend, S.; Burtscher, R.; Langan, S.; et al. Global Assessment of Water Challenges under Uncertainty in Water Scarcity Projections. Nat. Sustain. 2018, 1, 486–494. [Google Scholar] [CrossRef]
  2. Cai, B.; Zhang, W.; Hubacek, K.; Feng, K.; Li, Z.; Liu, Y.; Liu, Y. Drivers of Virtual Water Flows on Regional Water Scarcity in China. J. Clean. Prod. 2019, 207, 1112–1122. [Google Scholar] [CrossRef]
  3. Li, C.; Jiang, T.T.; Luan, X.B.; Yin, Y.L.; Wu, P.T.; Wang, Y.B.; Sun, S.K. Determinants of Agricultural Water Demand in China. J. Clean. Prod. 2021, 288, 125508. [Google Scholar] [CrossRef]
  4. Zhao, J.; Han, T.; Wang, C.; Shi, X.; Wang, K.; Zhao, M.; Chen, F.; Chu, Q. Combined Application of the EM-DEA and EX-ACT Approaches for Integrated Assessment of Resource Use Efficiency, Sustainability and Carbon Footprint of Smallholder Maize Production Practices in Sub-Saharan Africa. Sustain. Prod. Consum. 2022, 263, 60366–60382. [Google Scholar] [CrossRef]
  5. Hoekstra, A.Y.; Chapagain, A.K.; Aldaya, M.M.; Hoekstra, M. The Water Footprint Assessment Manual: Setting the Global Standard; Routledge: London, UK, 2011. [Google Scholar]
  6. Holmatov, B.; Schyns, J.F.; Krol, M.S.; Gerbens-Leenes, P.W.; Hoekstra, A.Y. Can Crop Residues Provide Fuel for Future Transport? Limited Global Residue Bioethanol Potentials and Large Associated Land, Water and Carbon Footprints. Renew. Sustain. Energy Rev. 2021, 149, 111417. [Google Scholar] [CrossRef]
  7. Wen, M.; Chen, L. Global Food Crop Redistribution Reduces Water Footprint without Compromising Species Diversity. J. Clean. Prod. 2023, 383, 135437. [Google Scholar] [CrossRef]
  8. Zhao, H.; Miller, T.R.; Ishii, N.; Kawasaki, A. Global Spatio-Temporal Change Assessment in Interregional Water Stress Footprint in China by a High Resolution MRIO Model. Sci. Total Environ. 2022, 841, 156682. [Google Scholar] [CrossRef]
  9. Arunrat, N.; Sereenonchai, S.; Chaowiwat, W.; Wang, C. Climate Change Impact on Major Crop Yield and Water Footprint under CMIP6 Climate Projections in Repeated Drought and Flood Areas in Thailand. Sci. Total Environ. 2022, 807, 150741. [Google Scholar] [CrossRef]
  10. Bocchiola, D.; Nana, E.; Soncini, A. Impact of Climate Change Scenarios on Crop Yield and Water Footprint of Maize in the Po Valley of Italy. Agric. Water Manag. 2013, 116, 50–61. [Google Scholar] [CrossRef]
  11. Cao, X.; Wang, Y.; Wu, P.; Zhao, X. Water Productivity Evaluation for Grain Crops in Irrigated Regions of China. Ecol. Indic. 2015, 55, 107–117. [Google Scholar] [CrossRef]
  12. Huang, H.; Zhuo, L.; Wang, R.; Shang, K.; Li, M.; Yang, X.; Wu, P. Agricultural Infrastructure: The Forgotten Key Driving Force of Crop-Related Water Footprints and Virtual Water Flows in China. J. Clean. Prod. 2021, 309, 127455. [Google Scholar] [CrossRef]
  13. Zoumides, C.; Bruggeman, A.; Hadjikakou, M.; Zachariadis, T. Policy-Relevant Indicators for Semi-Arid Nations: The Water Footprint of Crop Production and Supply Utilization of Cyprus. Ecol. Indic. 2014, 43, 205–214. [Google Scholar] [CrossRef]
  14. Jiang, C.M.; Yu, W.T.; Ma, Q.; Xu, Y.G.; Zou, H. Alleviating Global Warming Potential by Soil Carbon Sequestration: A Multi-Level Straw Incorporation Experiment from a Maize Cropping System in Northeast China. Soil Tillage Res. 2017, 170, 77–84. [Google Scholar] [CrossRef]
  15. Noya, I.; González-García, S.; Berzosa, J.; Baucells, F.; Feijoo, G.; Moreira, M.T. Environmental and Water Sustainability of Milk Production in Northeast Spain. Sci. Total Environ. 2018, 616–617, 1317–1329. [Google Scholar] [CrossRef]
  16. Park, J.; Baik, J.; Choi, M. Satellite-Based Crop Coefficient and Evapotranspiration Using Surface Soil Moisture and Vegetation Indices in Northeast Asia. Catena 2017, 156, 305–314. [Google Scholar] [CrossRef]
  17. Gobin, A.; Kersebaum, K.C.; Eitzinger, J.; Trnka, M.; Hlavinka, P.; Takáč, J.; Kroes, J.; Ventrella, D.; Marta, A.D.; Deelstra, J.; et al. Variability in the Water Footprint of Arable Crop Production across European Regions. Water 2017, 9, 93. [Google Scholar] [CrossRef]
  18. Deihimfard, R.; Rahimi-Moghaddam, S.; Collins, B.; Azizi, K. Future Climate Change Could Reduce Irrigated and Rainfed Wheat Water Footprint in Arid Environments. Sci. Total Environ. 2022, 807, 150991. [Google Scholar] [CrossRef] [PubMed]
  19. Cao, X.; Bao, Y.; Li, Y.; Li, J.; Wu, M. Unravelling the Effects of Crop Blue, Green and Grey Virtual Water Flows on Regional Agricultural Water Footprint and Scarcity. Agric. Water Manag. 2023, 278, 108165. [Google Scholar] [CrossRef]
  20. Gao, J.; Xie, P.; Zhuo, L.; Shang, K.; Ji, X.; Wu, P. Water Footprints of Irrigated Crop Production and Meteorological Driving Factors at Multiple Temporal Scales. Agric. Water Manag. 2021, 255, 107014. [Google Scholar] [CrossRef]
  21. Hu, M.; Wu, W.; Yu, Q.; Tang, H.; Wen, Y.; Zhao, F. Spatial-Temporal Variations in Green, Blue and Gray Water Footprints of Crops: How Do Socioeconomic Drivers Influence? Environ. Res. Lett. 2022, 17, 124024. [Google Scholar] [CrossRef]
  22. Gao, X.; Gu, F.; Hao, W.; Mei, X.; Li, H.; Gong, D.; Mao, L.; Zhang, Z. Carbon Budget of a Rainfed Spring Maize Cropland with Straw Returning on the Loess Plateau, China. Sci. Total Environ. 2017, 586, 1193–1203. [Google Scholar] [CrossRef]
  23. Jiang, T.; Sun, S.; Li, Z.; Li, Q.; Lu, Y.; Li, C.; Wang, Y.; Wu, P. Vulnerability of Crop Water Footprint in Rain-Fed and Irrigation Agricultural Production System under Future Climate Scenarios. Agric. For. Meteorol. 2022, 326, 109164. [Google Scholar] [CrossRef]
  24. Yeşilköy, S.; Şaylan, L. Yields and Water Footprints of Sunflower and Winter Wheat under Different Climate Projections. J. Clean. Prod. 2021, 298, 126780. [Google Scholar] [CrossRef]
  25. Li, Z.; Wu, H.; Deng, X. Spatial Pattern of Water Footprints for Crop Production in Northeast China. Sustainability 2022, 14, 13649. [Google Scholar] [CrossRef]
  26. Ma, W.; Opp, C.; Yang, D. Spatiotemporal Supply-Demand Characteristics and Economic Benefits of Crop Water Footprint in the Semi-Arid Region. Sci. Total Environ. 2020, 738, 139502. [Google Scholar] [CrossRef]
  27. Li, Q.; Huang, W.; Wang, J.; Zhang, Z.; Li, Y.; Han, Y.; Feng, L.; Li, X.; Yang, B.; Wang, G.; et al. Quantitative Evaluation of Variation and Driving Factors of the Regional Water Footprint for Cotton Production in China. Sustain. Prod. Consum. 2023, 35, 684–696. [Google Scholar] [CrossRef]
  28. Lu, S.; Bai, X.; Zhang, J.; Li, J.; Li, W.; Lin, J. Impact of Virtual Water Export on Water Resource Security Associated with the Energy and Food Bases in Northeast China. Technol. Forecast. Soc. Change 2022, 180, 121635. [Google Scholar] [CrossRef]
  29. Duan, P.; Qin, L.; Wang, Y.; He, H. Spatial Pattern Characteristics of Water Footprint for Maize Production in Northeast China: Water Footprint for Maize Production in China. J. Sci. Food Agric. 2016, 96, 561–568. [Google Scholar] [CrossRef]
  30. Dang, Y.; Qin, L.; Huang, L.; Wang, J.; Li, B.; He, H. Water Footprint of Rain-Fed Maize in Different Growth Stages and Associated Climatic Driving Forces in Northeast China. Agric. Water Manag. 2022, 263, 107463. [Google Scholar] [CrossRef]
  31. Zheng, X.; Qin, L.; He, H. Impacts of Climatic and Agricultural Input Factors on the Water Footprint of Crop Production in Jilin Province, China. Sustainability 2020, 12, 6904. [Google Scholar] [CrossRef]
  32. Xu, Y.; Huang, K.; Yu, Y.; Wang, X. Changes in Water Footprint of Crop Production in Beijing from 1978 to 2012: A Logarithmic Mean Divisia Index Decomposition Analysis. J. Clean. Prod. 2015, 87, 180–187. [Google Scholar] [CrossRef]
  33. Li, B.; Jing, Z.; Wei, X.; Sun, J.; Fu, S.; Ge, D. Spatial and Temporal Distribution Characteristics of Spring Maize Coefficients in Northeast China. Trans. Chin. Soc. Agric. Mach. 2020, 51, 279–290. [Google Scholar]
  34. Liu, L.; Hu, X.; Zhan, Y.; Sun, Z.; Zhang, Q. China’s Dietary Changes Would Increase Agricultural Blue and Green Water Footprint. Sci. Total Environ. 2023, 903, 165763. [Google Scholar] [CrossRef] [PubMed]
  35. Hoekstra, A.Y.; Hung, P.Q. Globalisation of Water Resources: International Virtual Water Flows in Relation to Crop Trade. Glob. Environ. Change 2005, 15, 45–56. [Google Scholar] [CrossRef]
  36. Li, B.; Qin, L.; Wang, J.; Dang, Y.; He, H. Multi-Source Data-Based Spatial Variations of Blue and Green Water Footprints for Rice Production in Jilin Province, China. Environ. Sci. Pollut. Res. 2021, 28, 38106–38116. [Google Scholar] [CrossRef] [PubMed]
  37. Allen, R.G.; Pruitt, W.O.; Wright, J.L.; Howell, T.A.; Ventura, F.; Snyder, R.; Itenfisu, D.; Steduto, P.; Berengena, J.; Yrisarry, J.B.; et al. A Recommendation on Standardized Surface Resistance for Hourly Calculation of Reference ETo by the FAO56 Penman-Monteith Method. Agric. Water Manag. 2006, 81, 1–22. [Google Scholar] [CrossRef]
  38. Allen, R.G.; Pereira, L.S.; Raes, D.; Smith, M.; FAO—Food and Agriculture Organization of the United Nations. Crop Evapotranspiration—Guidelines for Computing Crop Water Requirements—FAO Irrigation and Drainage Paper 56; Food and Agriculture Organization of the United Nations: Rome, Italy, 1998; ISBN 92-5-104219-5. [Google Scholar]
  39. Smith, M.; Food and Agriculture Organization of the United Nations. CROPWAT: A Computer Program for Irrigation Planning and Management; Food & Agriculture Organization: Rome, Italy, 1992; ISBN 978-92-5-103106-3. [Google Scholar]
  40. Severo Santos, J.F.; Naval, L.P. Spatial and Temporal Dynamics of Water Footprint for Soybean Production in Areas of Recent Agricultural Expansion of the Brazilian Savannah (Cerrado). J. Clean. Prod. 2020, 251, 119482. [Google Scholar] [CrossRef]
  41. Zeng, W.; Lu, T.; Liu, Z.; Xu, Q.; Peng, H.; Li, C.; Yang, S.; Yao, F. Research on a Laser Ultrasonic Visualization Detection Method for Human Skin Tumors Based on Pearson Correlation Coefficient. Opt. Laser Technol. 2021, 141, 107117. [Google Scholar] [CrossRef]
  42. Sriram, N. Decomposing the Pearson Correlation; SSRN: Rochester, NY, USA, 2013. [Google Scholar]
  43. Cao, X.; Shu, R.; Ren, J.; Wu, M.; Huang, X.; Guo, X. Variation and Driving Mechanism Analysis of Water Footprint Efficiency in Crop Cultivation in China. Sci. Total Environ. 2020, 725, 138537. [Google Scholar] [CrossRef]
  44. Govere, S.; Nyamangara, J.; Nyakatawa, E.Z. Climate Change Signals in the Historical Water Footprint of Wheat Production in Zimbabwe. Sci. Total Environ. 2020, 742, 140473. [Google Scholar] [CrossRef]
  45. Ding, X.; Wang, S.; Chen, B. The Blue, Green and Grey Water Consumption for Crop Production in Heilongjiang. Energy Procedia 2019, 158, 3908–3914. [Google Scholar] [CrossRef]
  46. Yuan, B.; Guo, J.; Ye, M.; Zhao, J. Variety Distribution Pattern and Climatic Potential Productivity of Spring Maize in Northeast China under Climate Change. Chin. Sci. Bull. 2012, 57, 3497–3508. [Google Scholar] [CrossRef]
  47. Mekonnen, M.M.; Hoekstra, A.Y. The Green, Blue and Grey Water Footprint of Crops and Derived Crop Products. Hydrol. Earth Syst. Sci. 2011, 15, 1577–1600. [Google Scholar] [CrossRef]
  48. Duan, P.; Qin, L.; Wang, Y.; He, H. Spatiotemporal Correlations between Water Footprint and Agricultural Inputs: A Case Study of Maize Production in Northeast China. Water 2015, 7, 4026–4040. [Google Scholar] [CrossRef]
  49. Zhuo, L.; Mekonnen, M.M.; Hoekstra, A.Y. The Effect of Inter-Annual Variability of Consumption, Production, Trade and Climate on Crop-Related Green and Blue Water Footprints and Inter-Regional Virtual Water Trade: A Study for China (1978–2008). Water Res. 2016, 94, 73–85. [Google Scholar] [CrossRef] [PubMed]
  50. Ma, Y.; Zhang, J.; Zhao, C.; Li, K.; Dong, S.; Liu, X.; Tong, Z. Spatiotemporal Variation of Water Supply and Demand Balance under Drought Risk and Its Relationship with Maize Yield: A Case Study in Midwestern Jilin Province, China. Water 2021, 13, 2490. [Google Scholar] [CrossRef]
  51. Tan, Q.; Liu, Y.; Pan, T.; Song, X.; Li, X. Changes and Determining Factors of Crop Evapotranspiration Derived from Satellite-Based Dual Crop Coefficients in North China Plain. Crop J. 2022, 10, 1496–1506. [Google Scholar] [CrossRef]
  52. Tang, Y.X.; Guo, J.P. Risk Assessment of Maize Chilling Injury in Northeast China. J. Appl. Meteorol. Sci. 2016, 27, 352–360. [Google Scholar]
  53. García Morillo, J.; Rodríguez Díaz, J.A.; Camacho, E.; Montesinos, P. Linking Water Footprint Accounting with Irrigation Management in High Value Crops. J. Clean. Prod. 2015, 87, 594–602. [Google Scholar] [CrossRef]
  54. Zhang, D.; Li, D.; Li, H.; Wang, H.; Liu, J.; Ju, H.; Batchelor, W.D.; Li, R.; Li, Y. Strategies to Reduce Crop Water Footprint in Intensive Wheat-Maize Rotations in North China Plain. Agronomy 2022, 12, 357. [Google Scholar] [CrossRef]
  55. Bai, Y.; Zhang, T.; Zhai, Y.; Shen, X.; Ma, X.; Zhang, R.; Ji, C.; Hong, J. Water Footprint Coupled Economic Impact Assessment for Maize Production in China. Sci. Total Environ. 2021, 752, 141963. [Google Scholar] [CrossRef]
  56. Liu, W.; Ma, Z.; Lei, B. Spatiotemporal Distribution of Irrigation Water Use Efficiency from the Perspective of Water Footprints in Heilongjiang Province. Water 2022, 14, 1232. [Google Scholar] [CrossRef]
  57. Wang, J.; Hu, X. Research on Corn Production Efficiency and Influencing Factors of Typical Farms: Based on Data from 12 Corn-Producing Countries from 2012 to 2019. PLoS ONE 2021, 16, e0254423. [Google Scholar] [CrossRef]
  58. Koelmans, A.A.; Redondo-Hasselerharm, P.E.; Nor, N.H.M.; de Ruijter, V.N.; Mintenig, S.M.; Kooi, M. Risk Assessment of Microplastic Particles. Nat. Rev. Mater. 2022, 7, 138–152. [Google Scholar] [CrossRef]
Figure 1. Composition of the GWF of spring maize production in Northeast China cities in 2019 and 2020.
Agriculture 13 01808 g001
Figure 2. Composition of the BWF of spring maize production in Northeast China cities in 2019 and 2020.
Agriculture 13 01808 g002
Figure 3. Composition of the GYWF of spring maize production in Northeast China cities in 2019 and 2020.
Agriculture 13 01808 g003
Figure 4. Composition of the WF of maize production in Northeast China cities in 2019 (a) and 2020 (b).
Agriculture 13 01808 g004
Figure 5. Maps of water footprints of Northeast China cities. (a) GWF in 2019, (b) BWF in 2019, (c) GYWF in 2019, (d) TWF in 2019, (e) GWF in 2020, (f) BWF in 2020, (g) GYWF in 2020 and (h) TWF in 2020.
Agriculture 13 01808 g005
Figure 6. Maps of spatial autocorrelation cluster of Northeast China cities. (a) GWF in 2019, (b) BWF in 2019, (c) GYWF in 2019, (d) TWF in 2019, (e) GWF in 2020, (f) BWF in 2020, (g) GYWF in 2020 and (h) TWF in 2020.
Agriculture 13 01808 g006
Figure 7. Correlation between driving factors and WF of maize production; * indicates significance at p < 0.05. MP, IEA, FER, Y, %EIA, MA, GA, %MA, SUN, TEM, PRE, RH and WR represent the total power of agricultural machinery, effective irrigated area, fertilizer application amount, yield per unit area, effective irrigated area proportion, area of sown maize, area of sown grain, sown maize area proportion, sunshine duration, temperature, precipitation, phase humidity and surface water resources, respectively.
Agriculture 13 01808 g007
Figure 8. Feature importance of driving factors to variability (a) in the GWF, (b) in the BWF, (c) in the GYWF and (d) in the TWF. FER, Y, MA, %MA, TEM, PRE, RH and WR represent the fertilizer application amount, yield per unit area, area of sown maize, sown maize area proportion, temperature, precipitation, phase humidity and surface water resources, respectively.
Agriculture 13 01808 g008
Table 1. Global Moran’s I summary.
20192020
TWFGWFBWFGYWFTWFGWFBWFGYWF
Moran’s Index0.2800.1870.1970.3240.2180.3230.2370.318
Expected Index−0.026−0.026−0.026−0.026−0.026−0.026−0.026−0.026
Variance0.0100.0100.0100.0100.0080.0100.0100.009
z-score3.0372.1572.2073.4612.7393.4702.6193.647
p-value0.0020.0310.0270.0010.0060.0010.0090.000
Disclaimer/Publisher’s Note: The statements, opinions and data contained in all publications are solely those of the individual author(s) and contributor(s) and not of MDPI and/or the editor(s). MDPI and/or the editor(s) disclaim responsibility for any injury to people or property resulting from any ideas, methods, instructions or products referred to in the content.