
Single-Season Rice Area Mapping by Combining Multi-Temporal Polarization Decomposition Components and the Two-Stage Segmentation Method

 , ,
, ,
Abstract
:1. Introduction
2. Materials and Methods
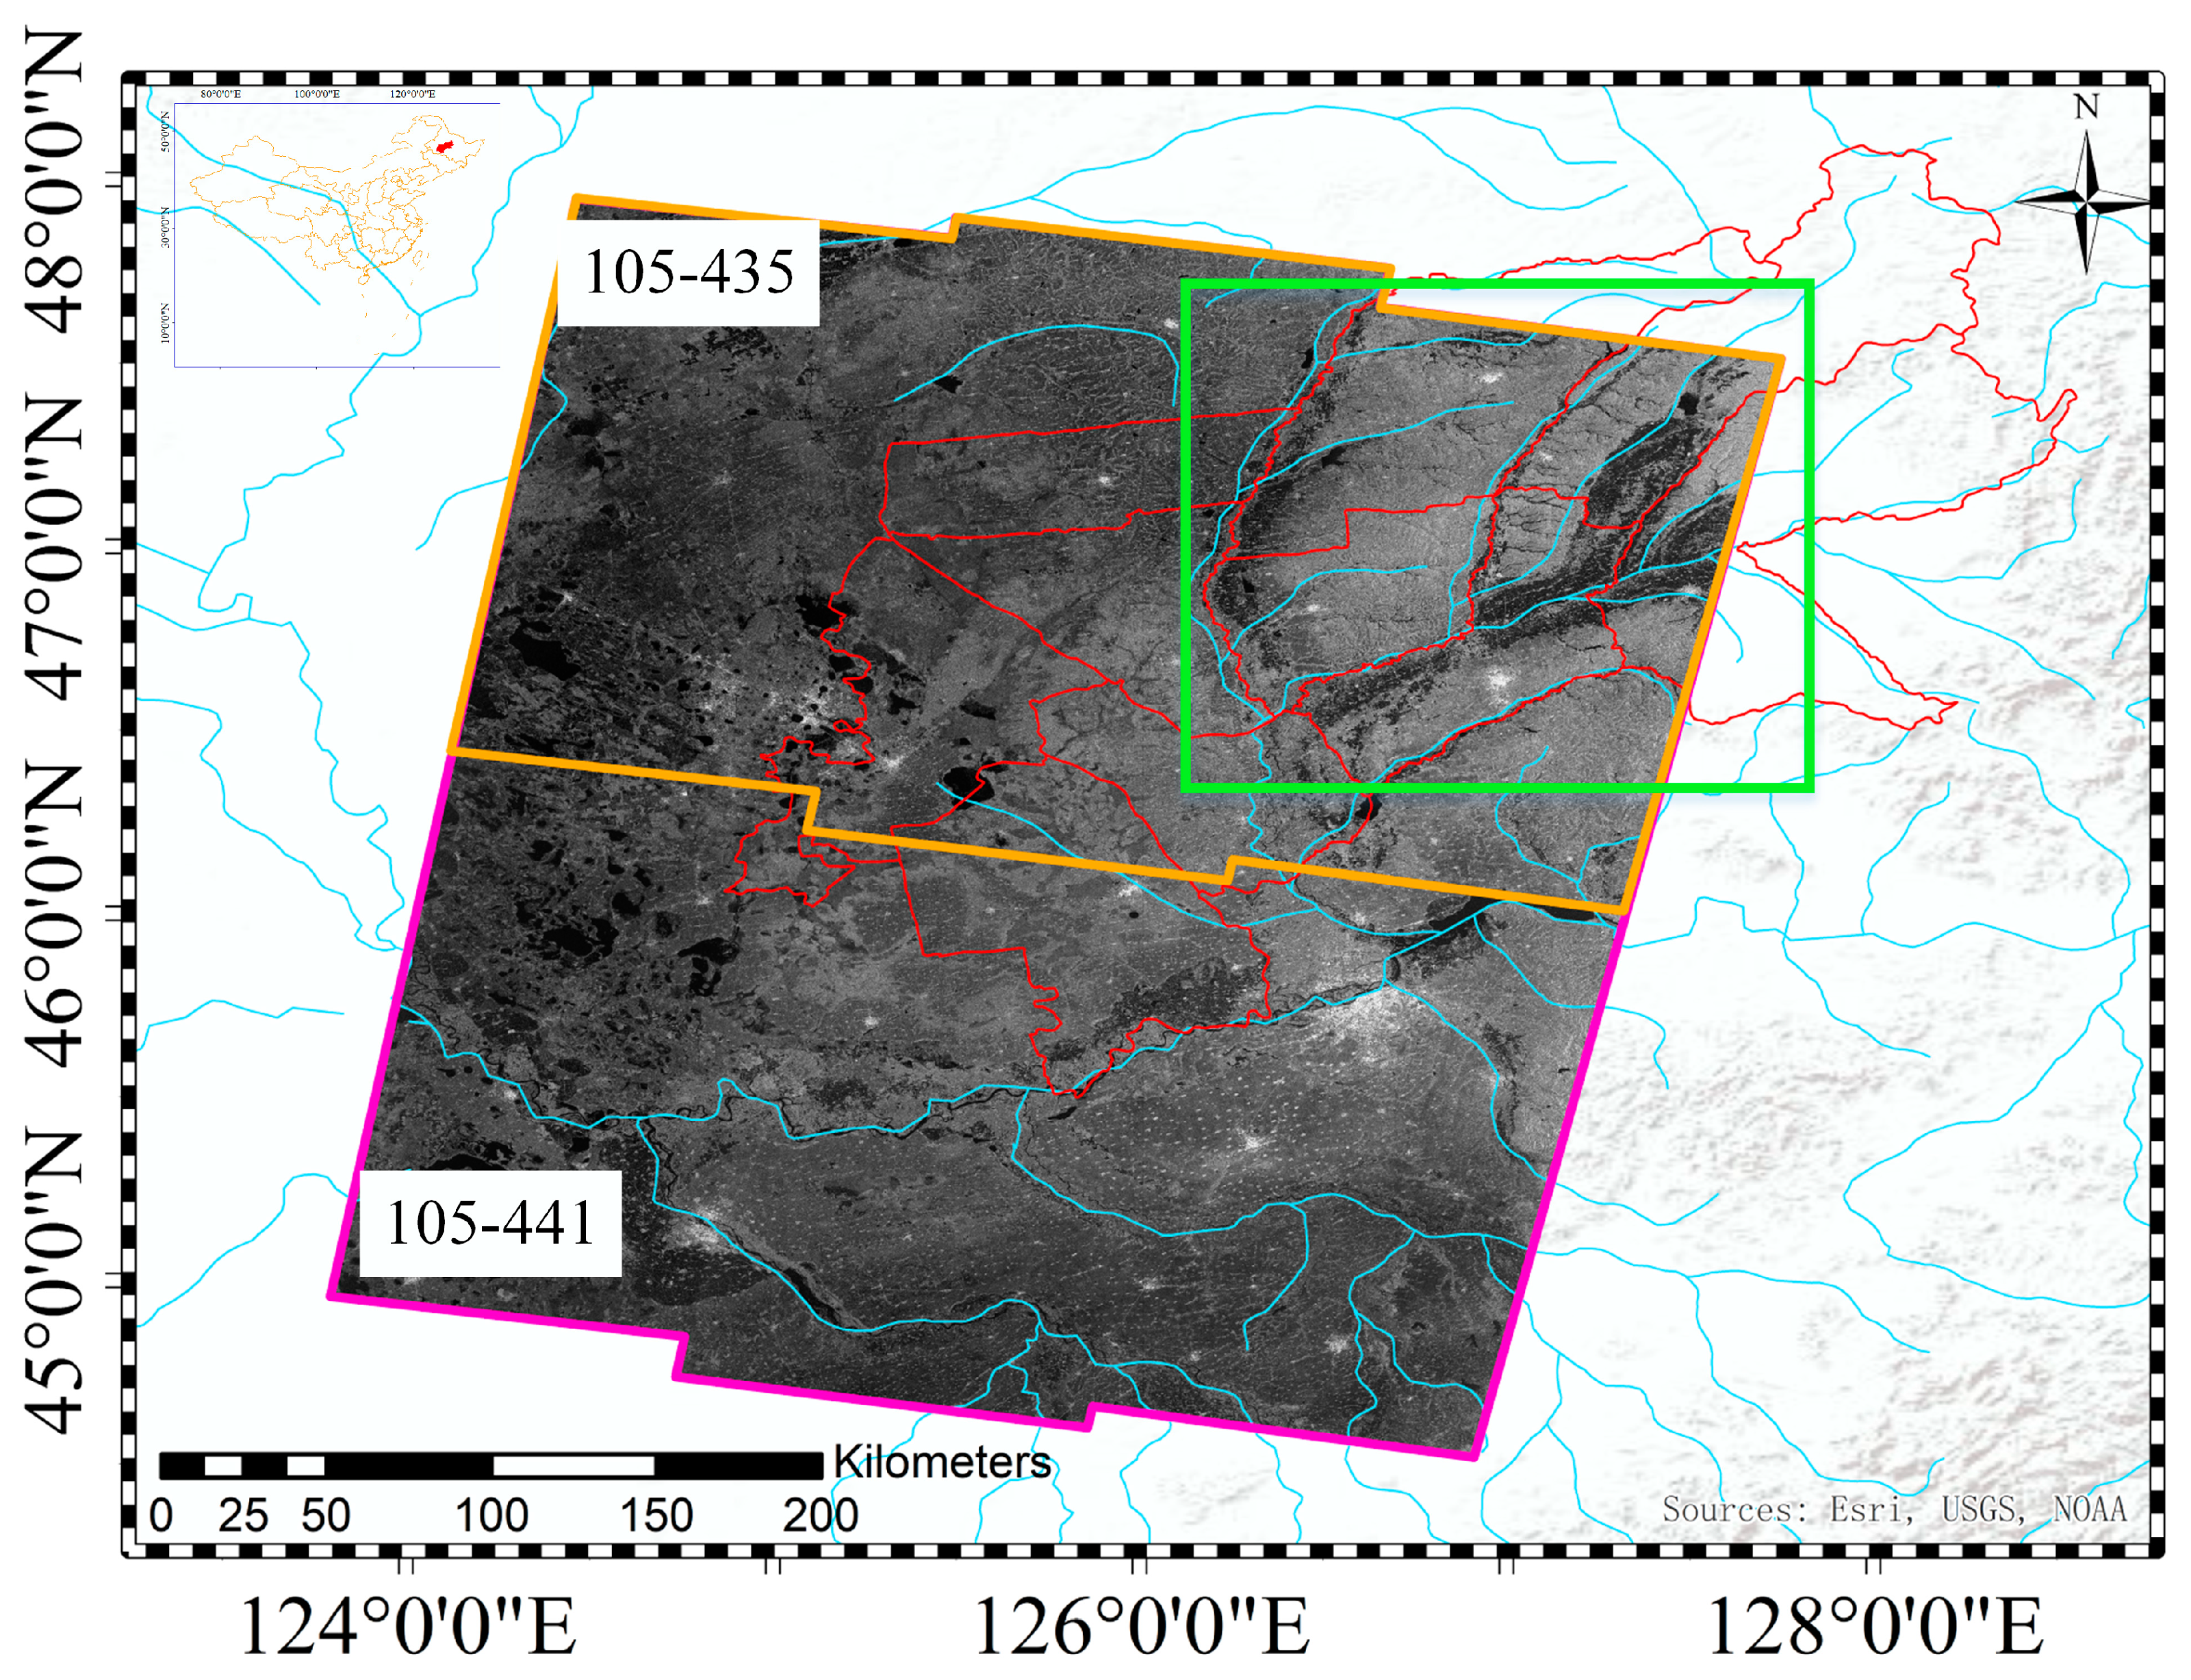
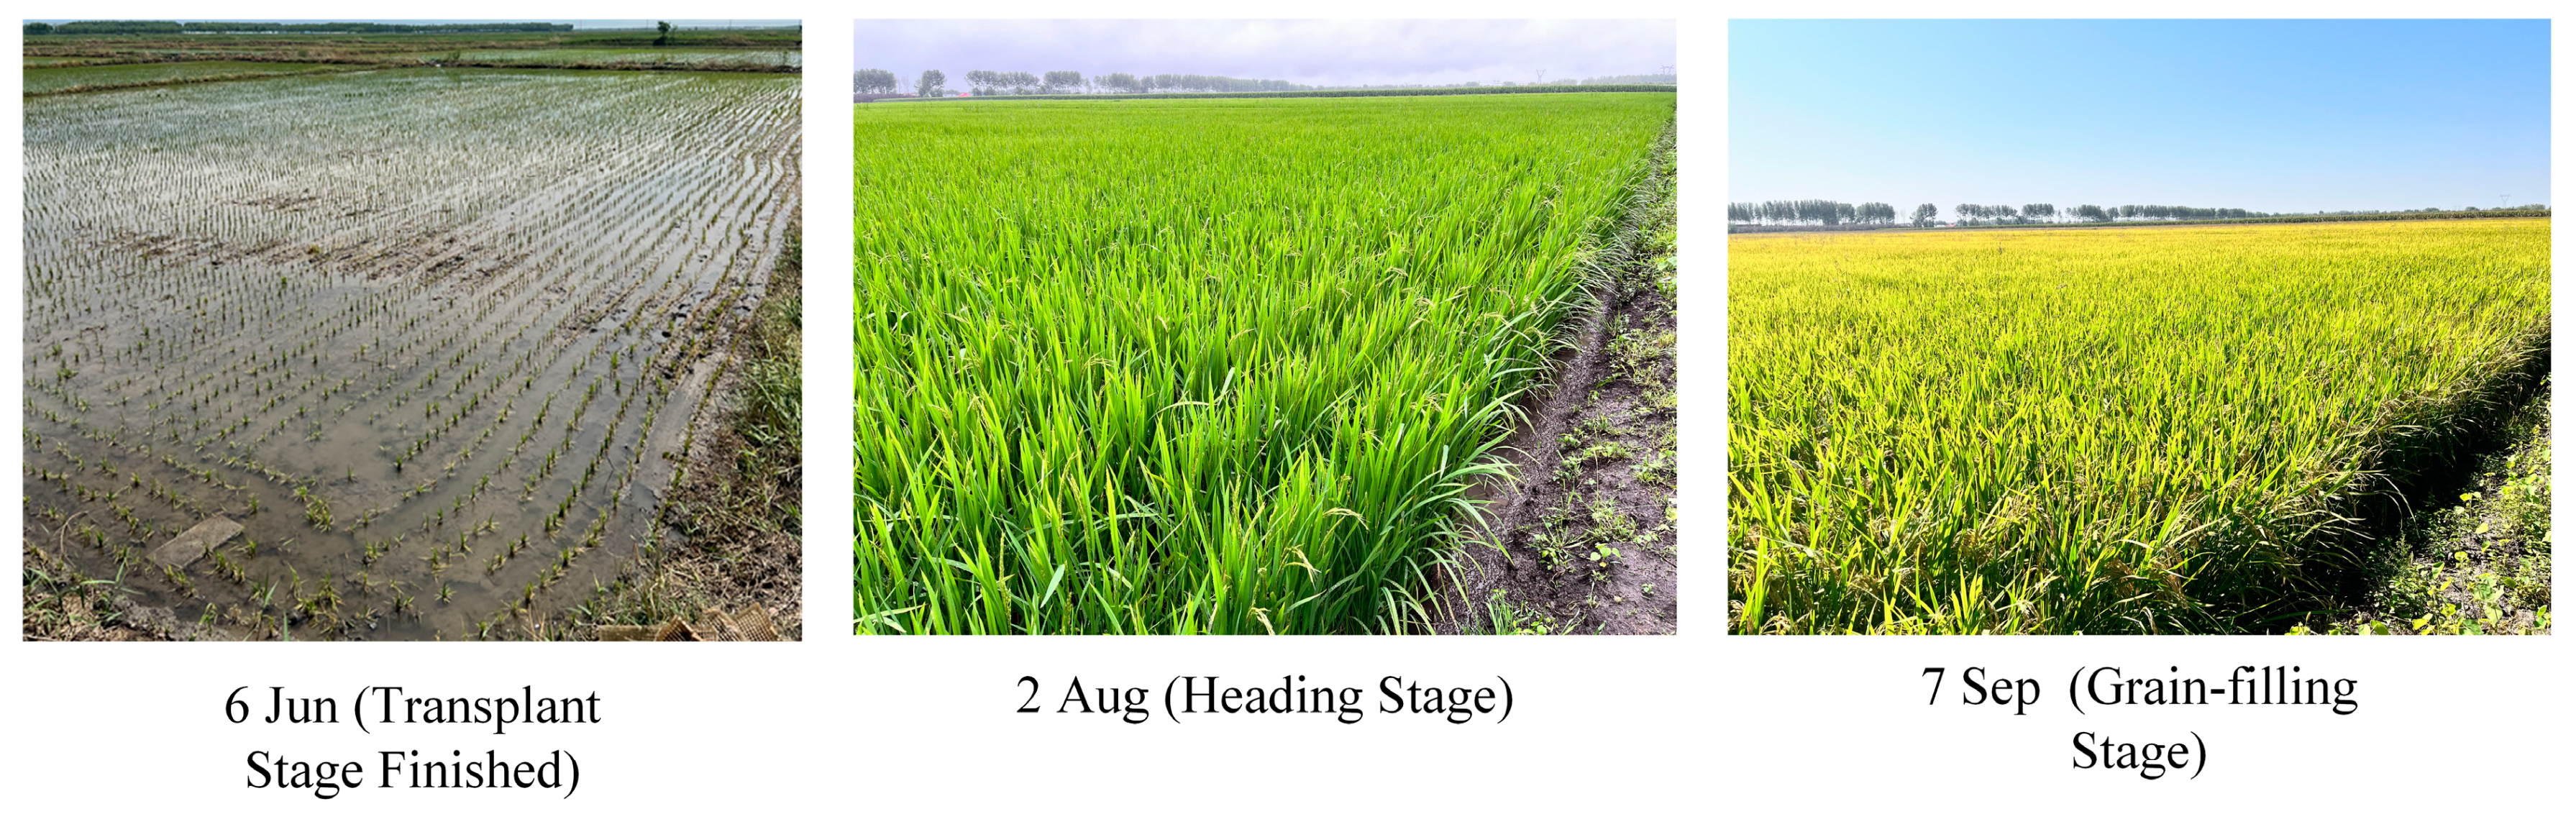
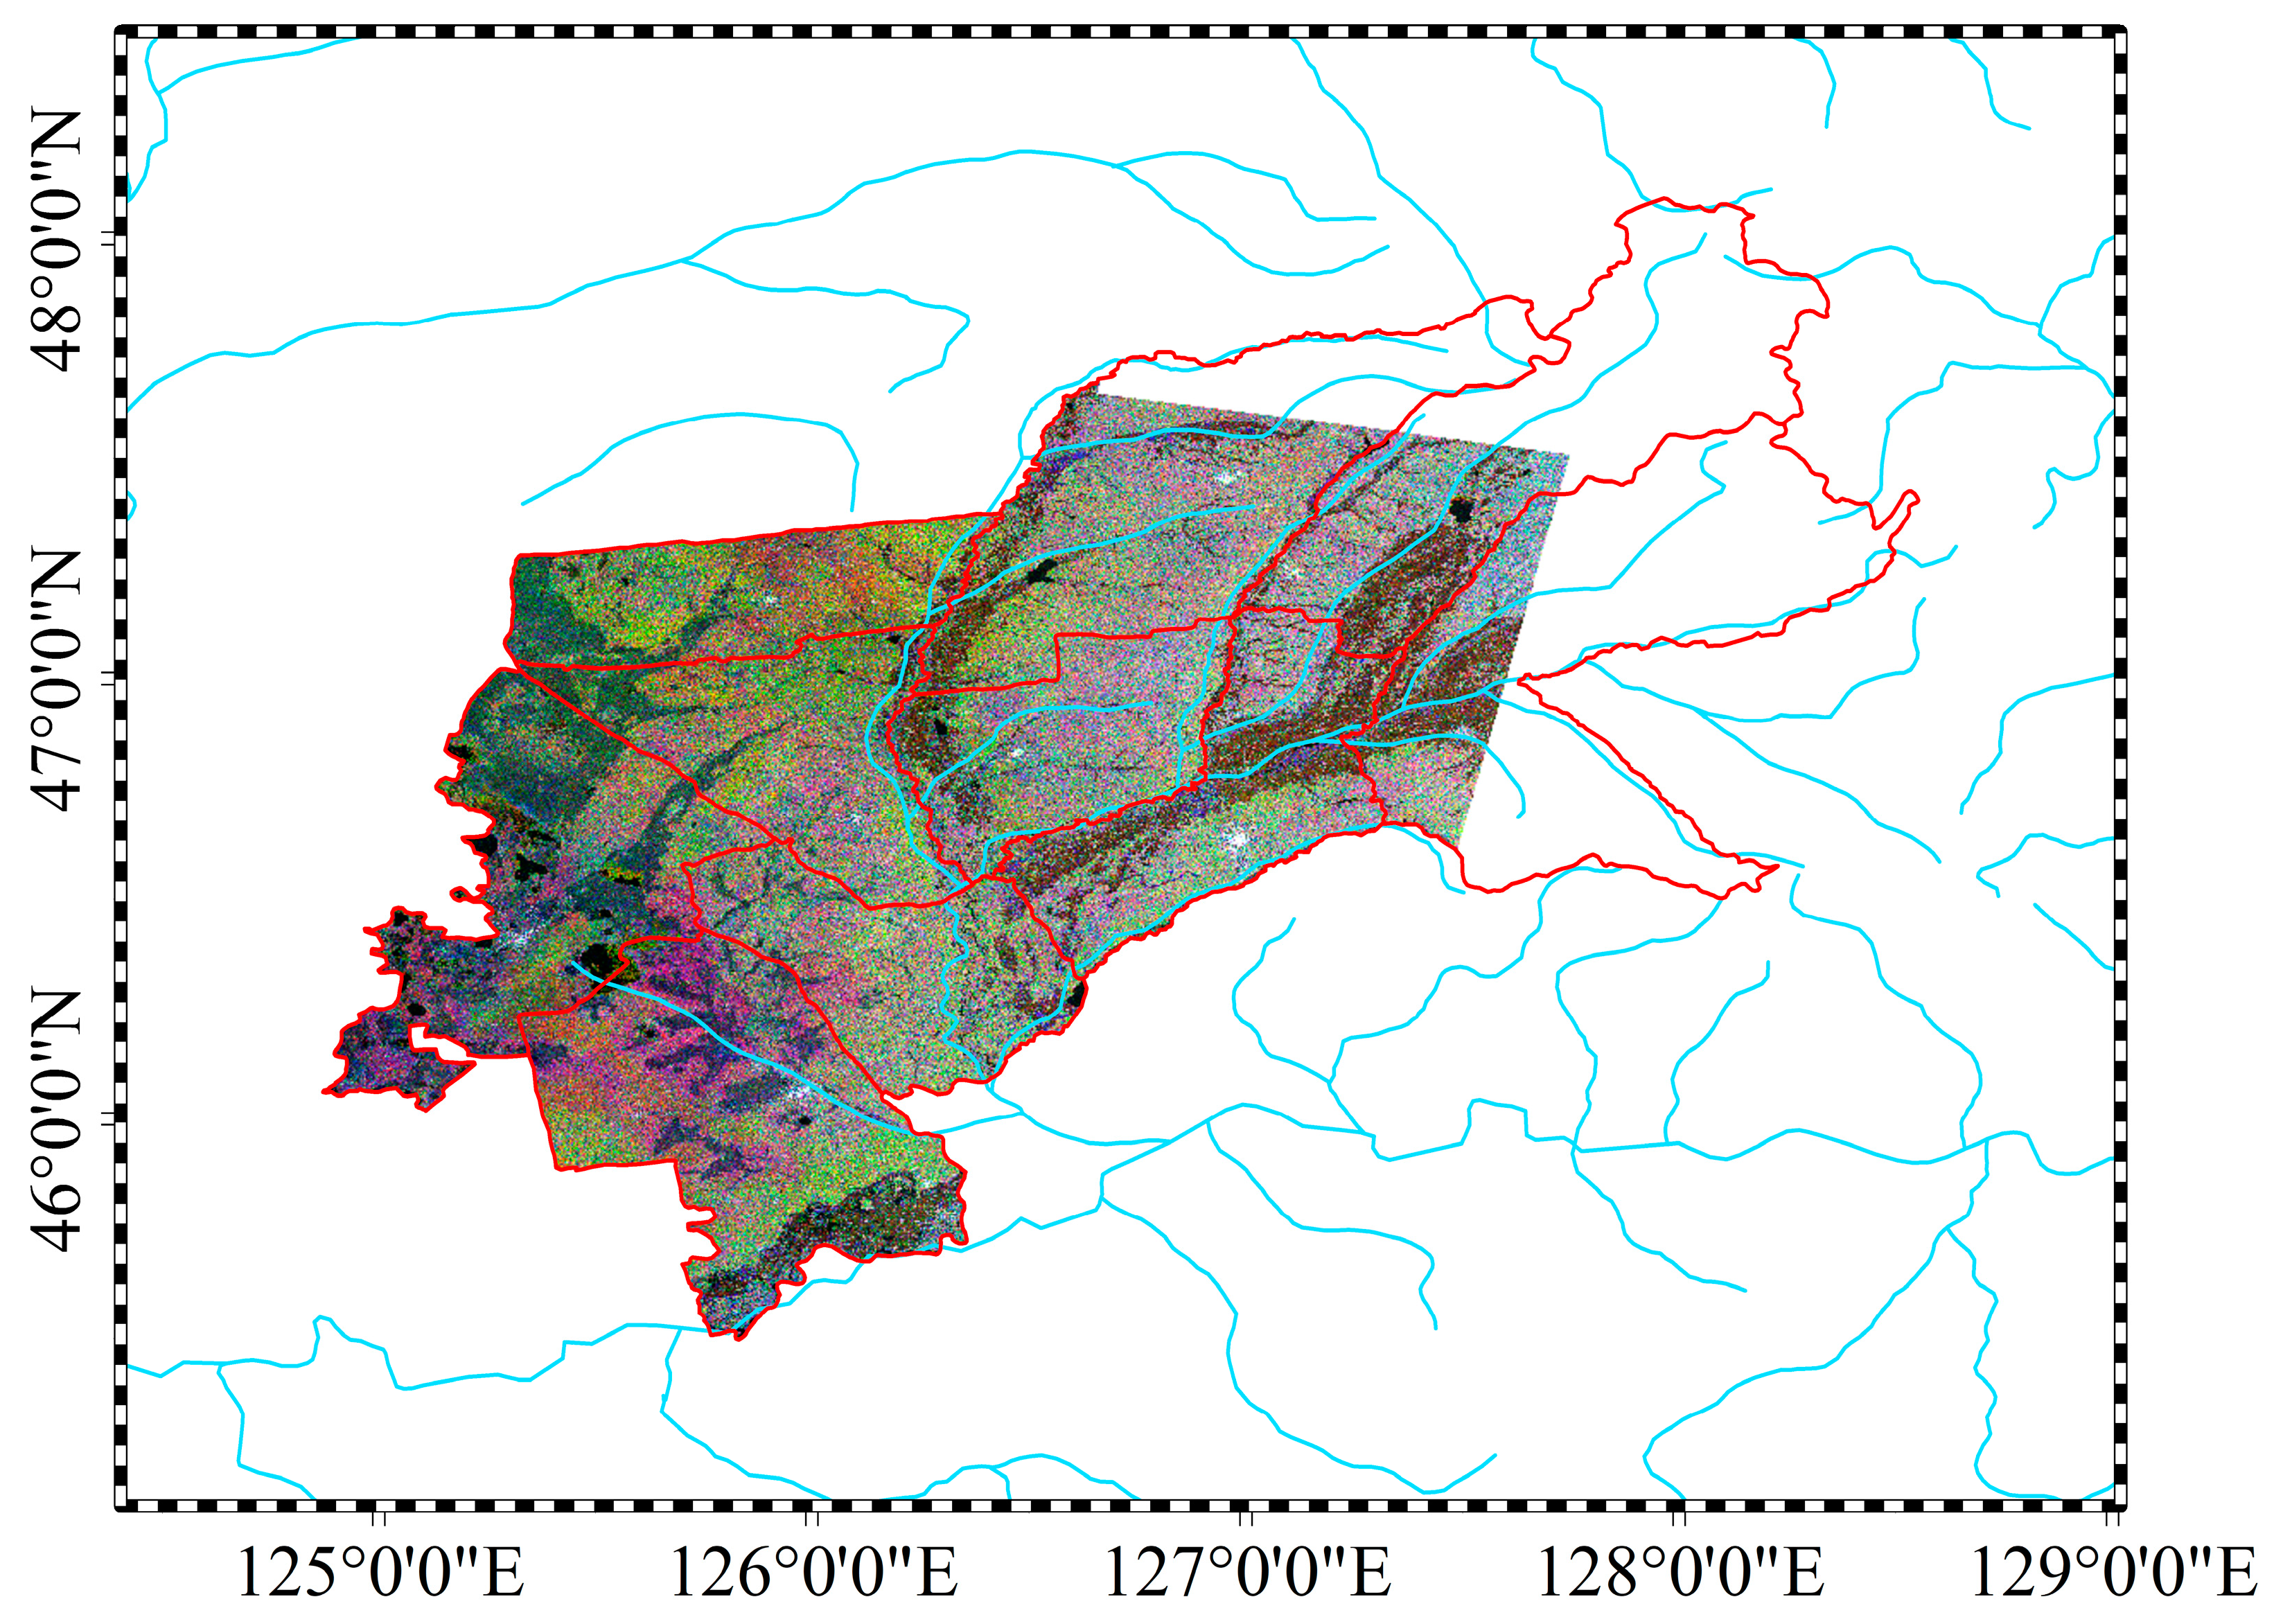
2.1. Study Site
2.2. Dataset
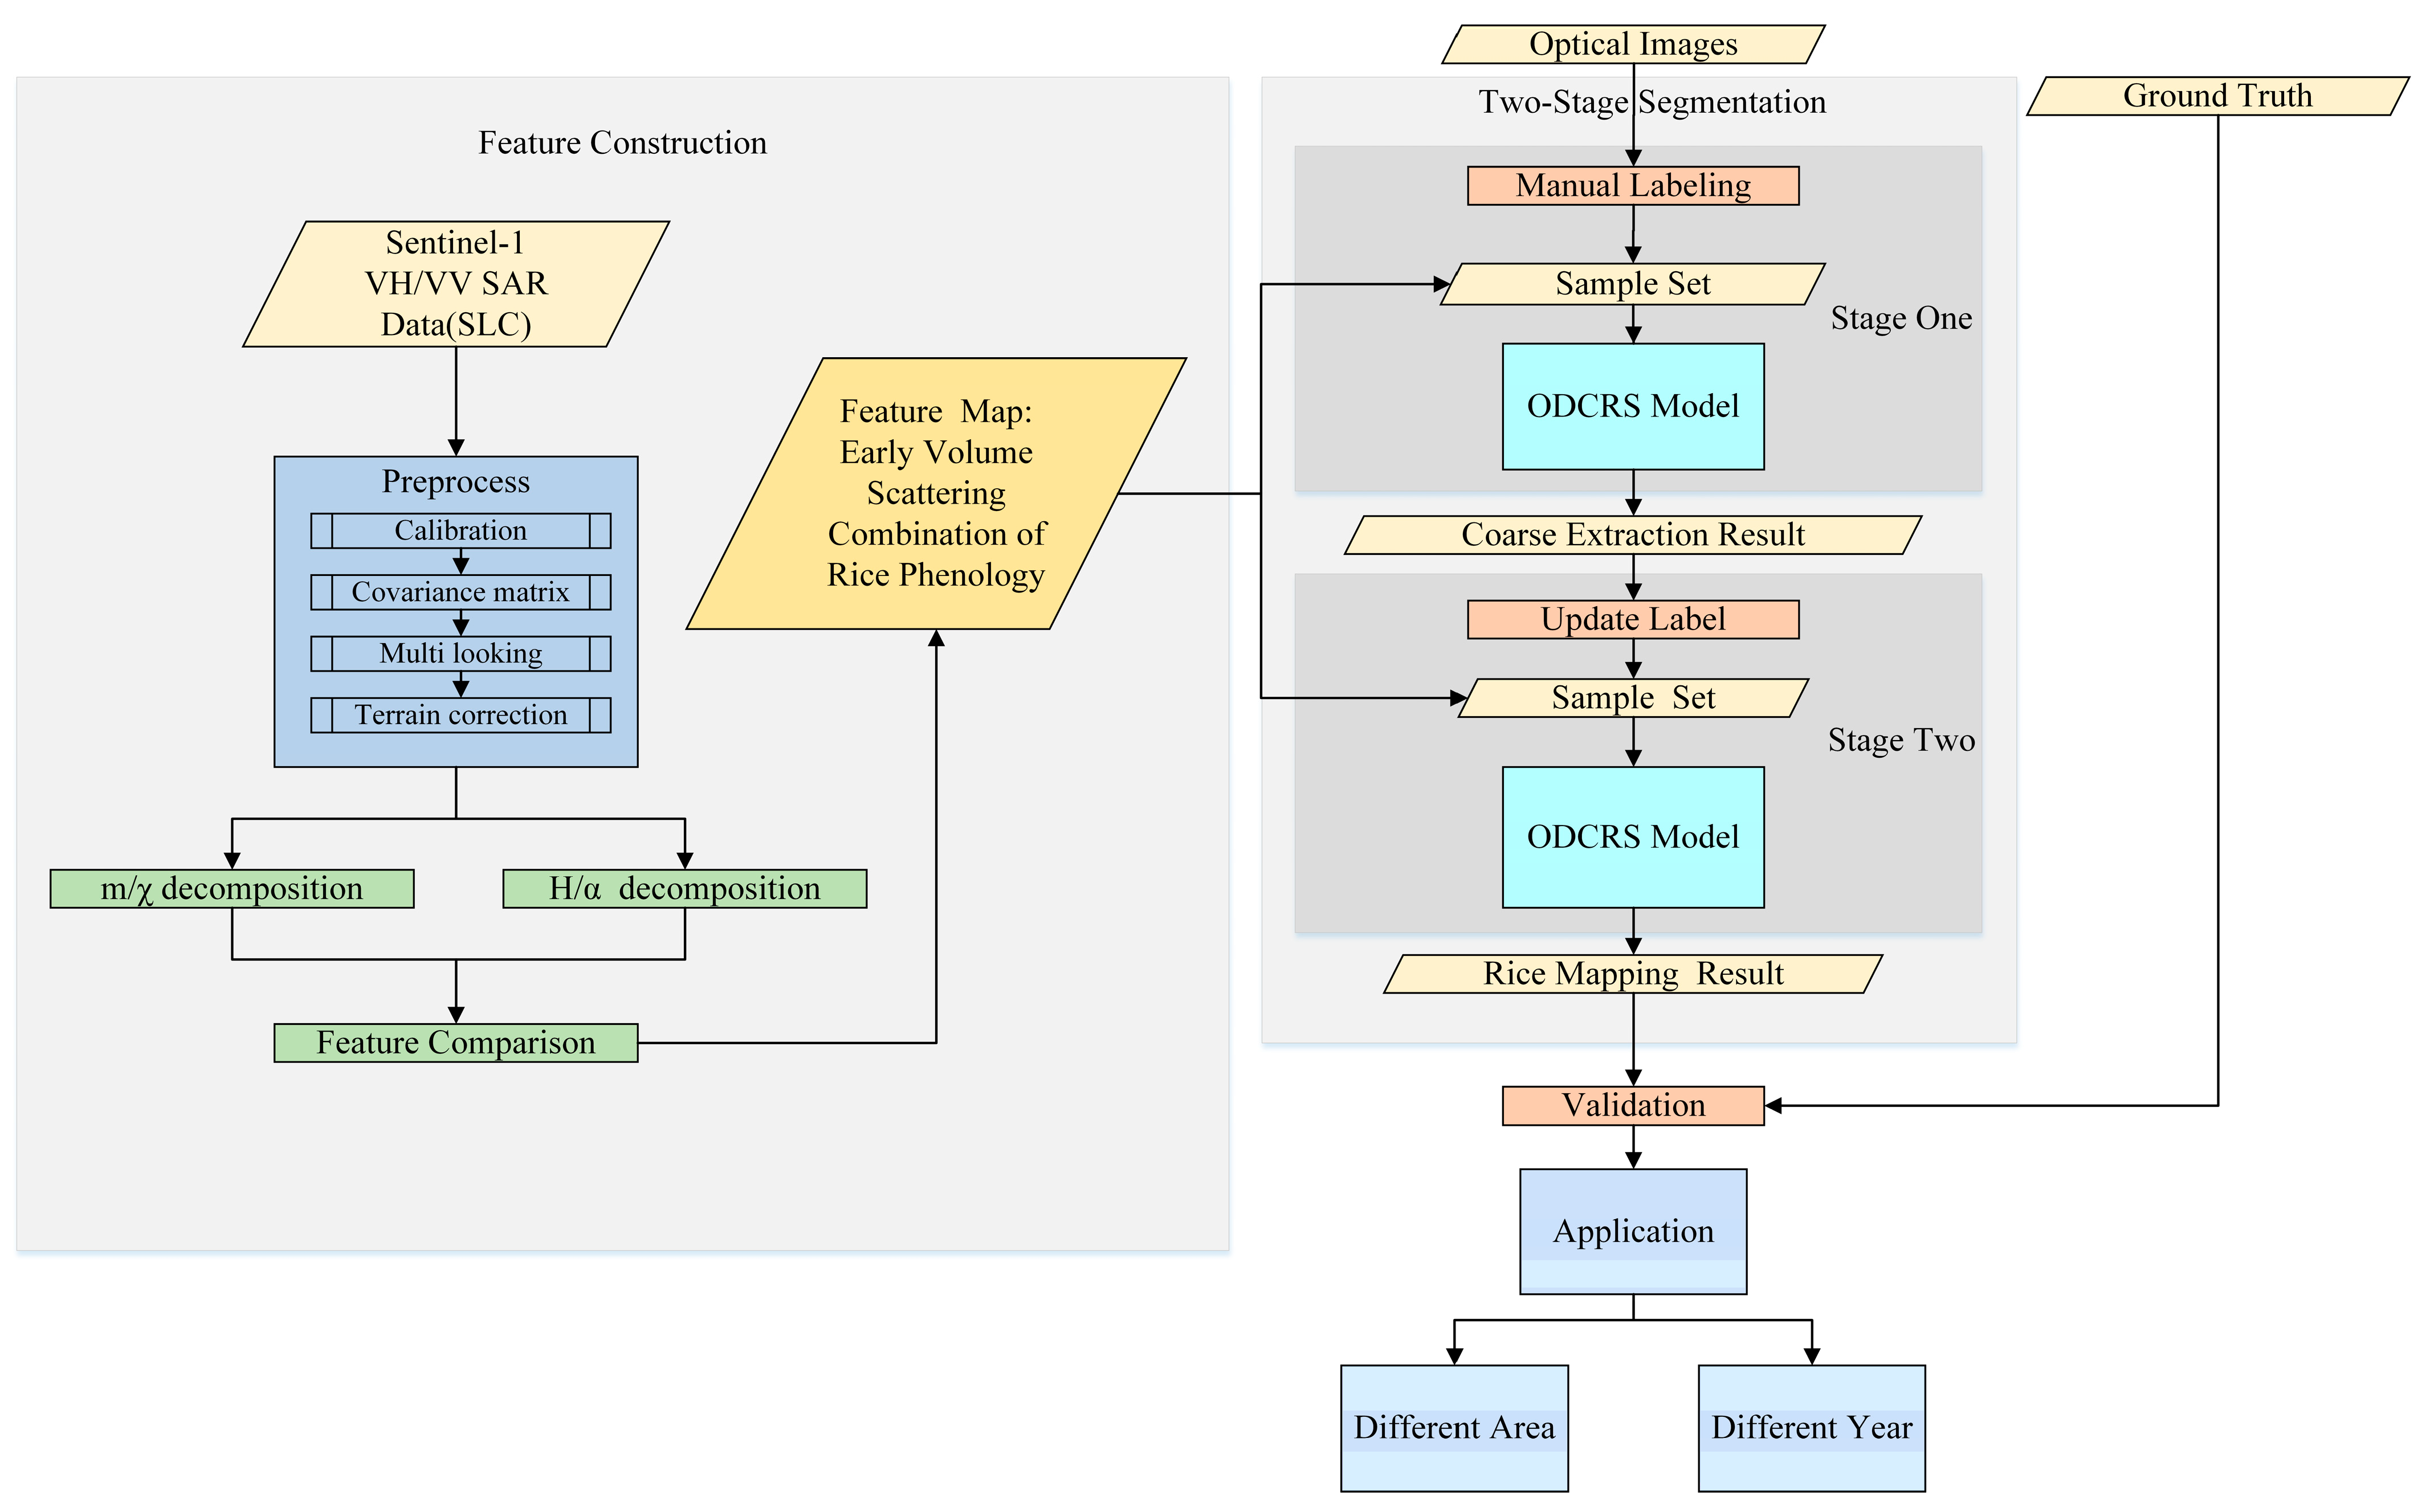
2.3. Method
2.3.1. Feature Construction
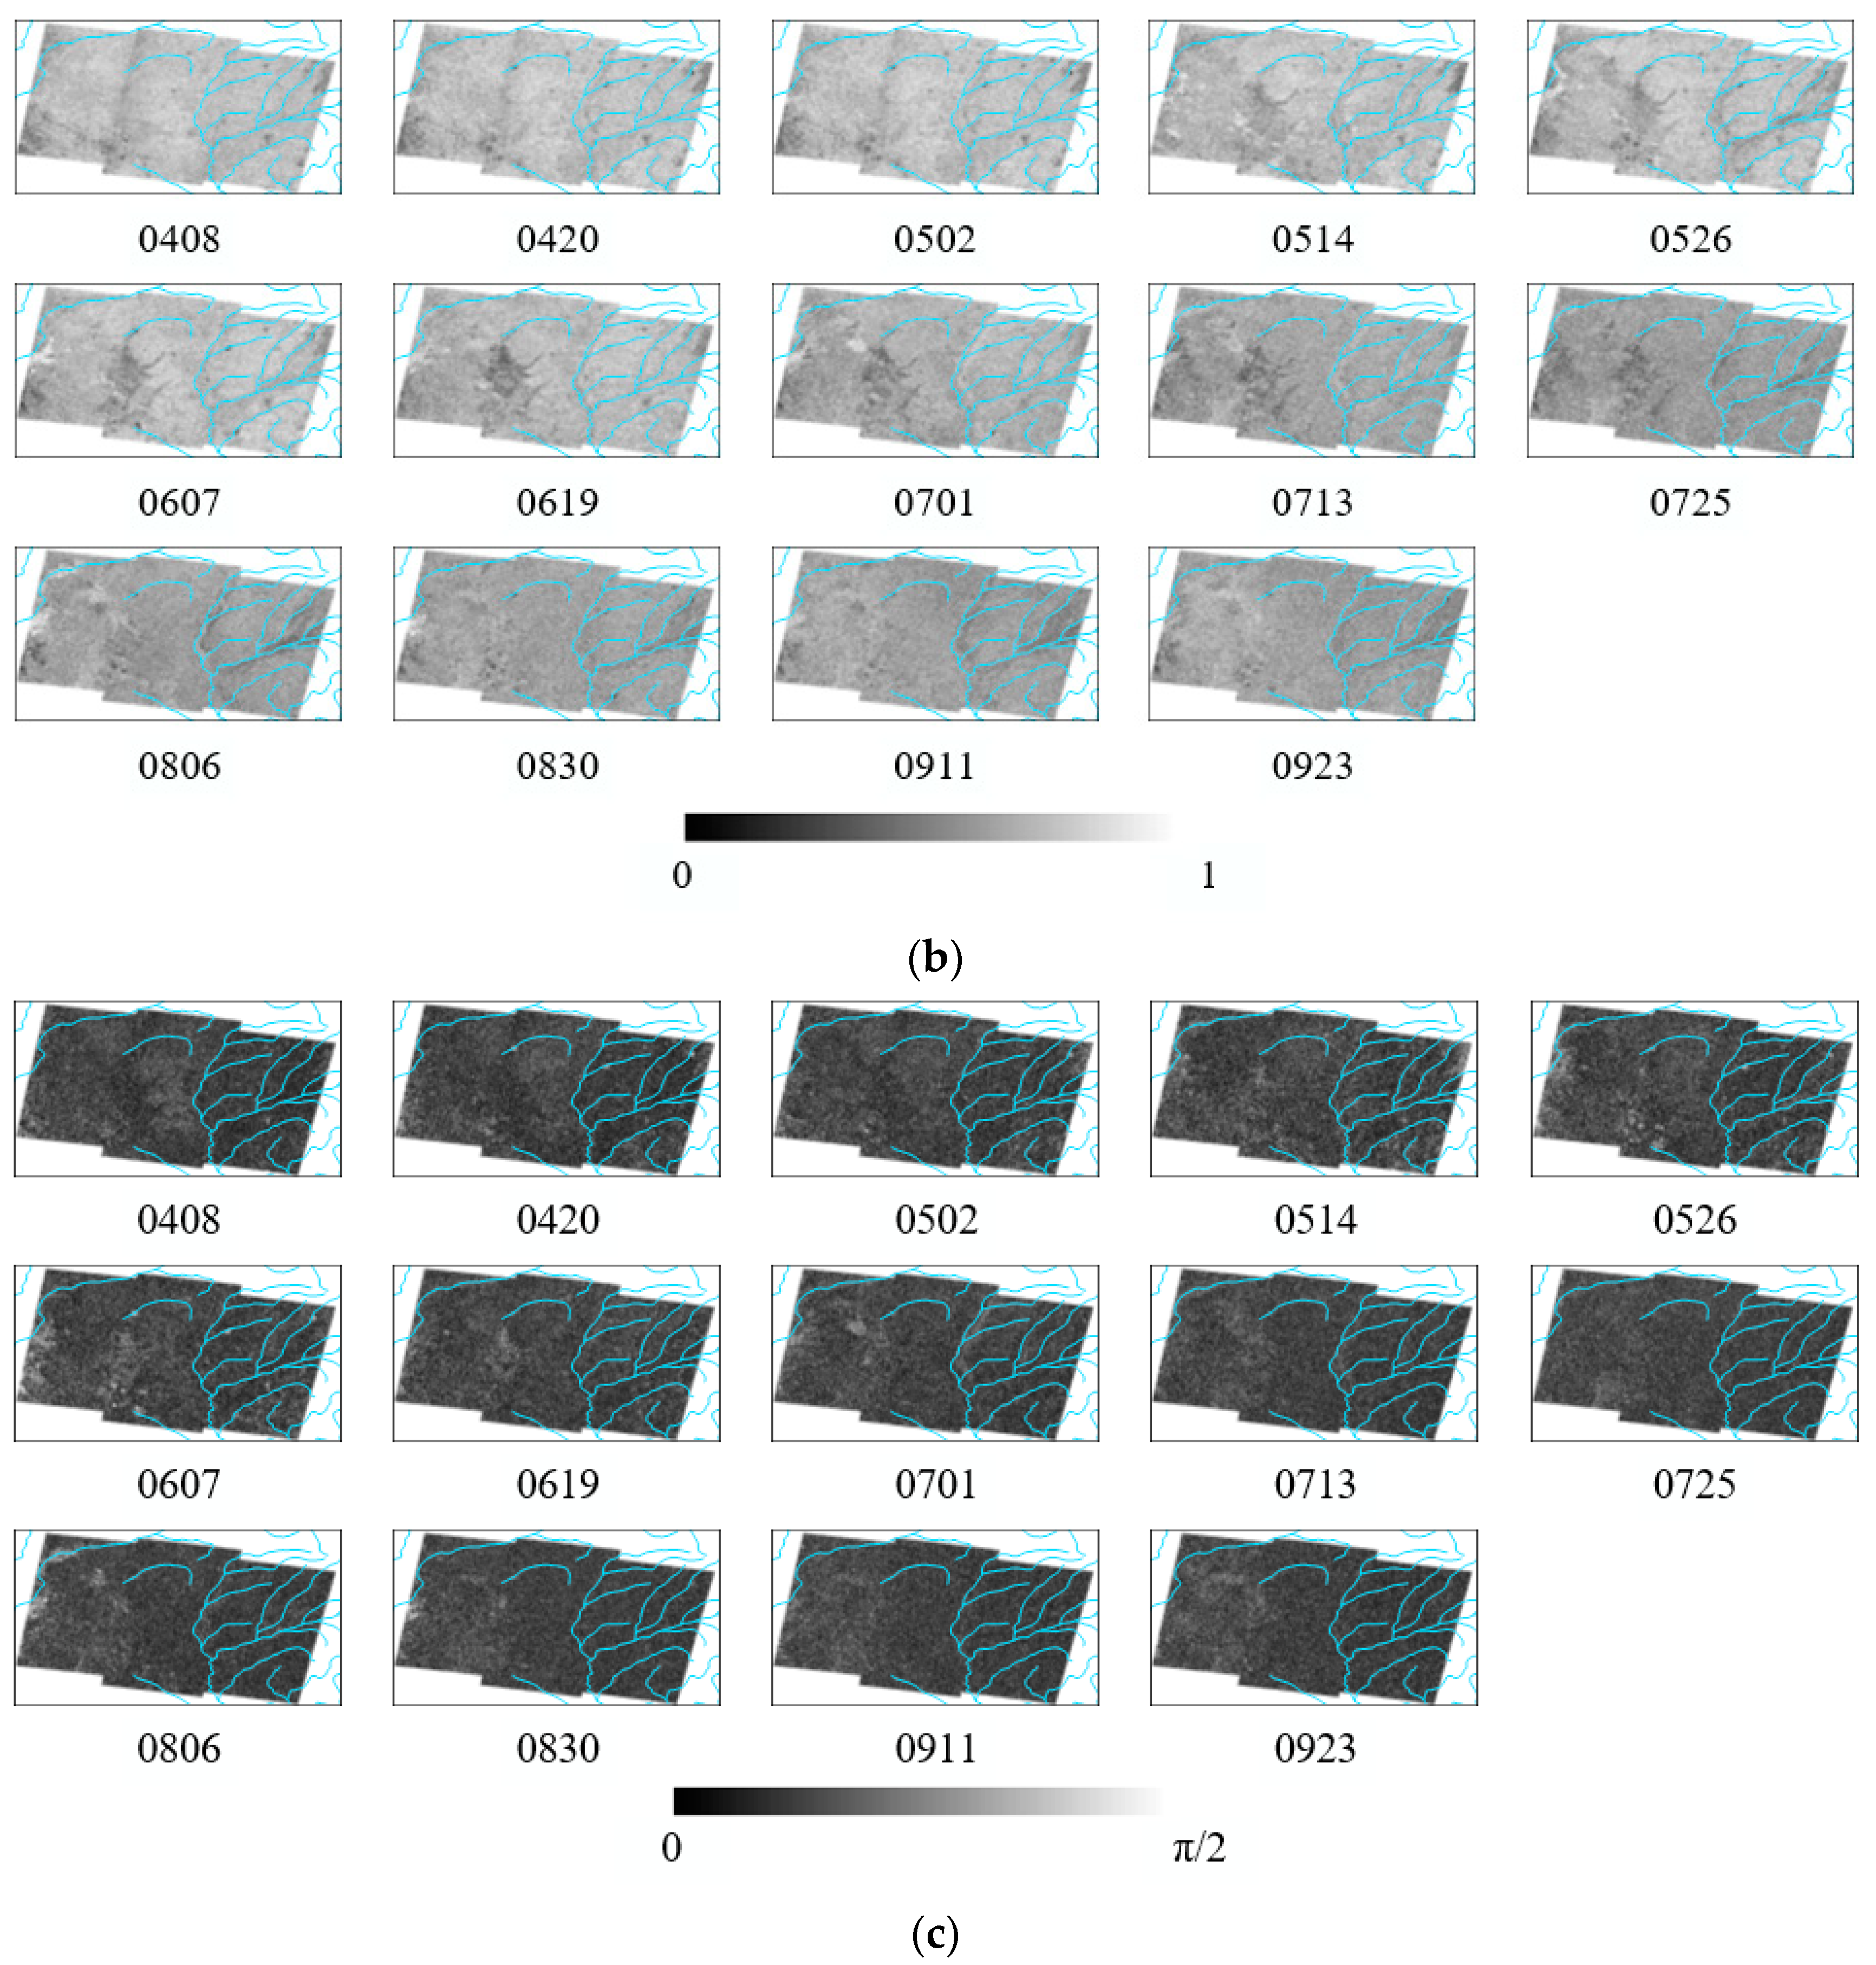
H/α Decomposition
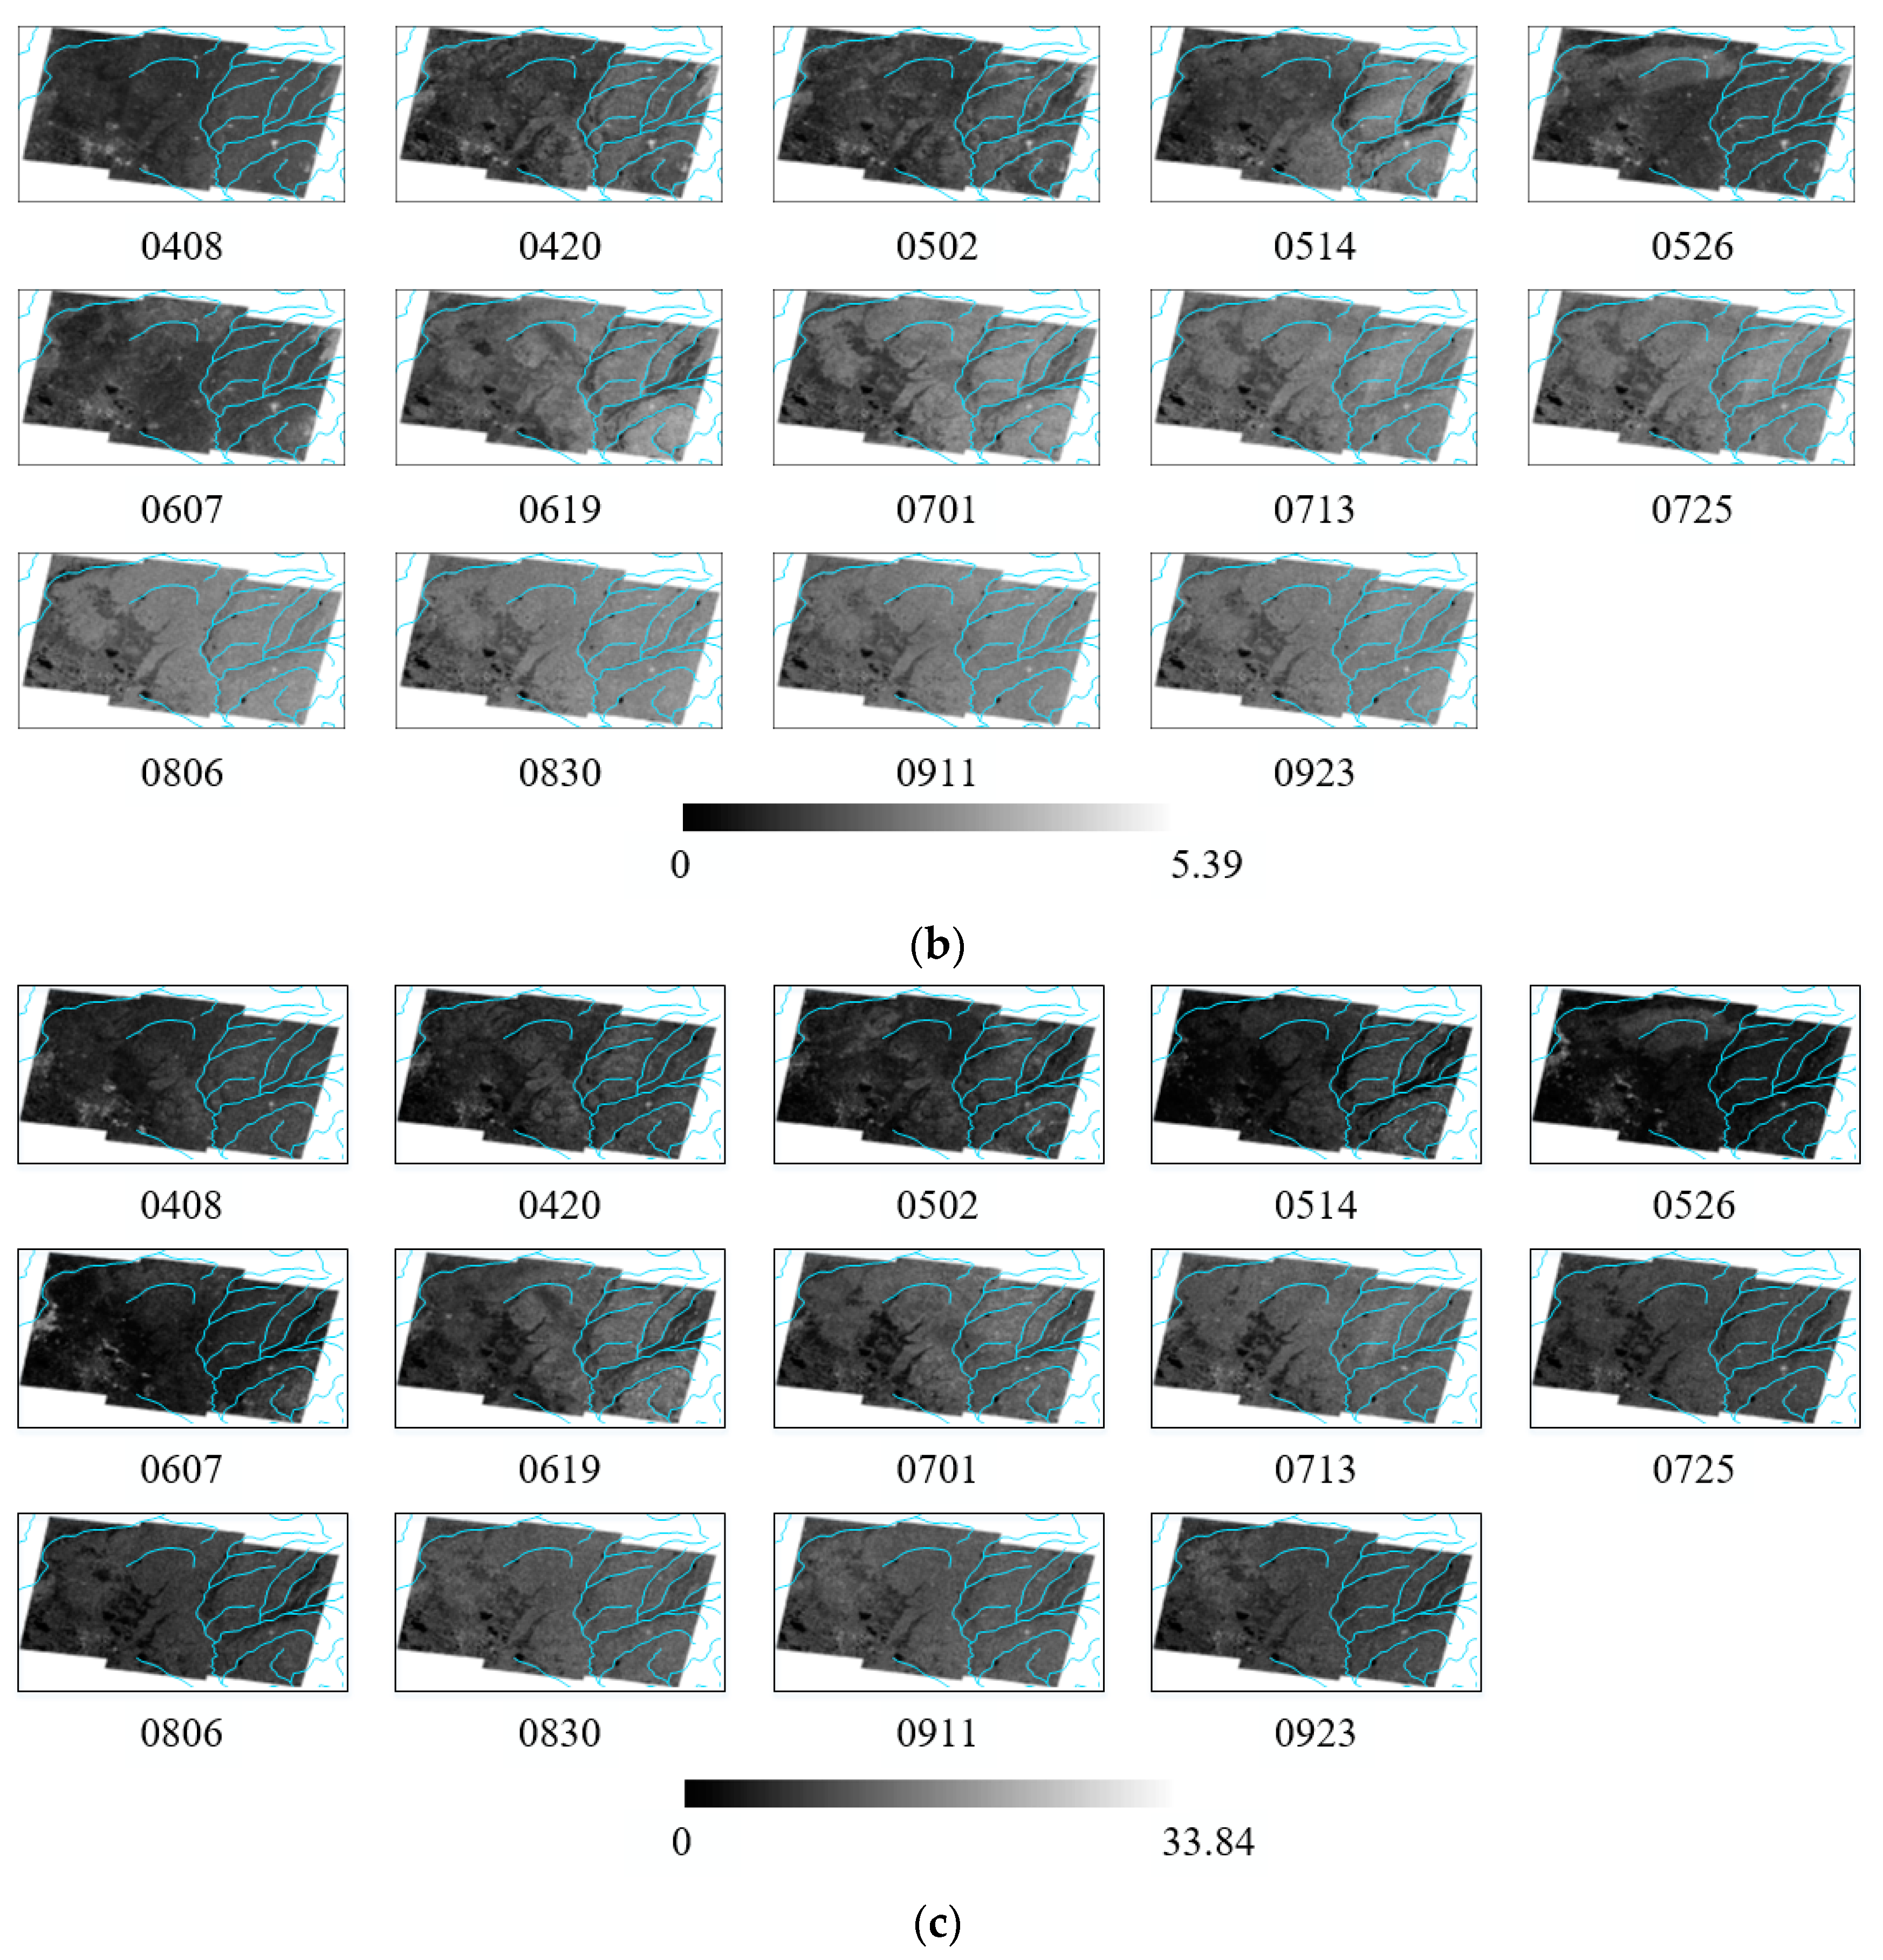
/ Decomposition
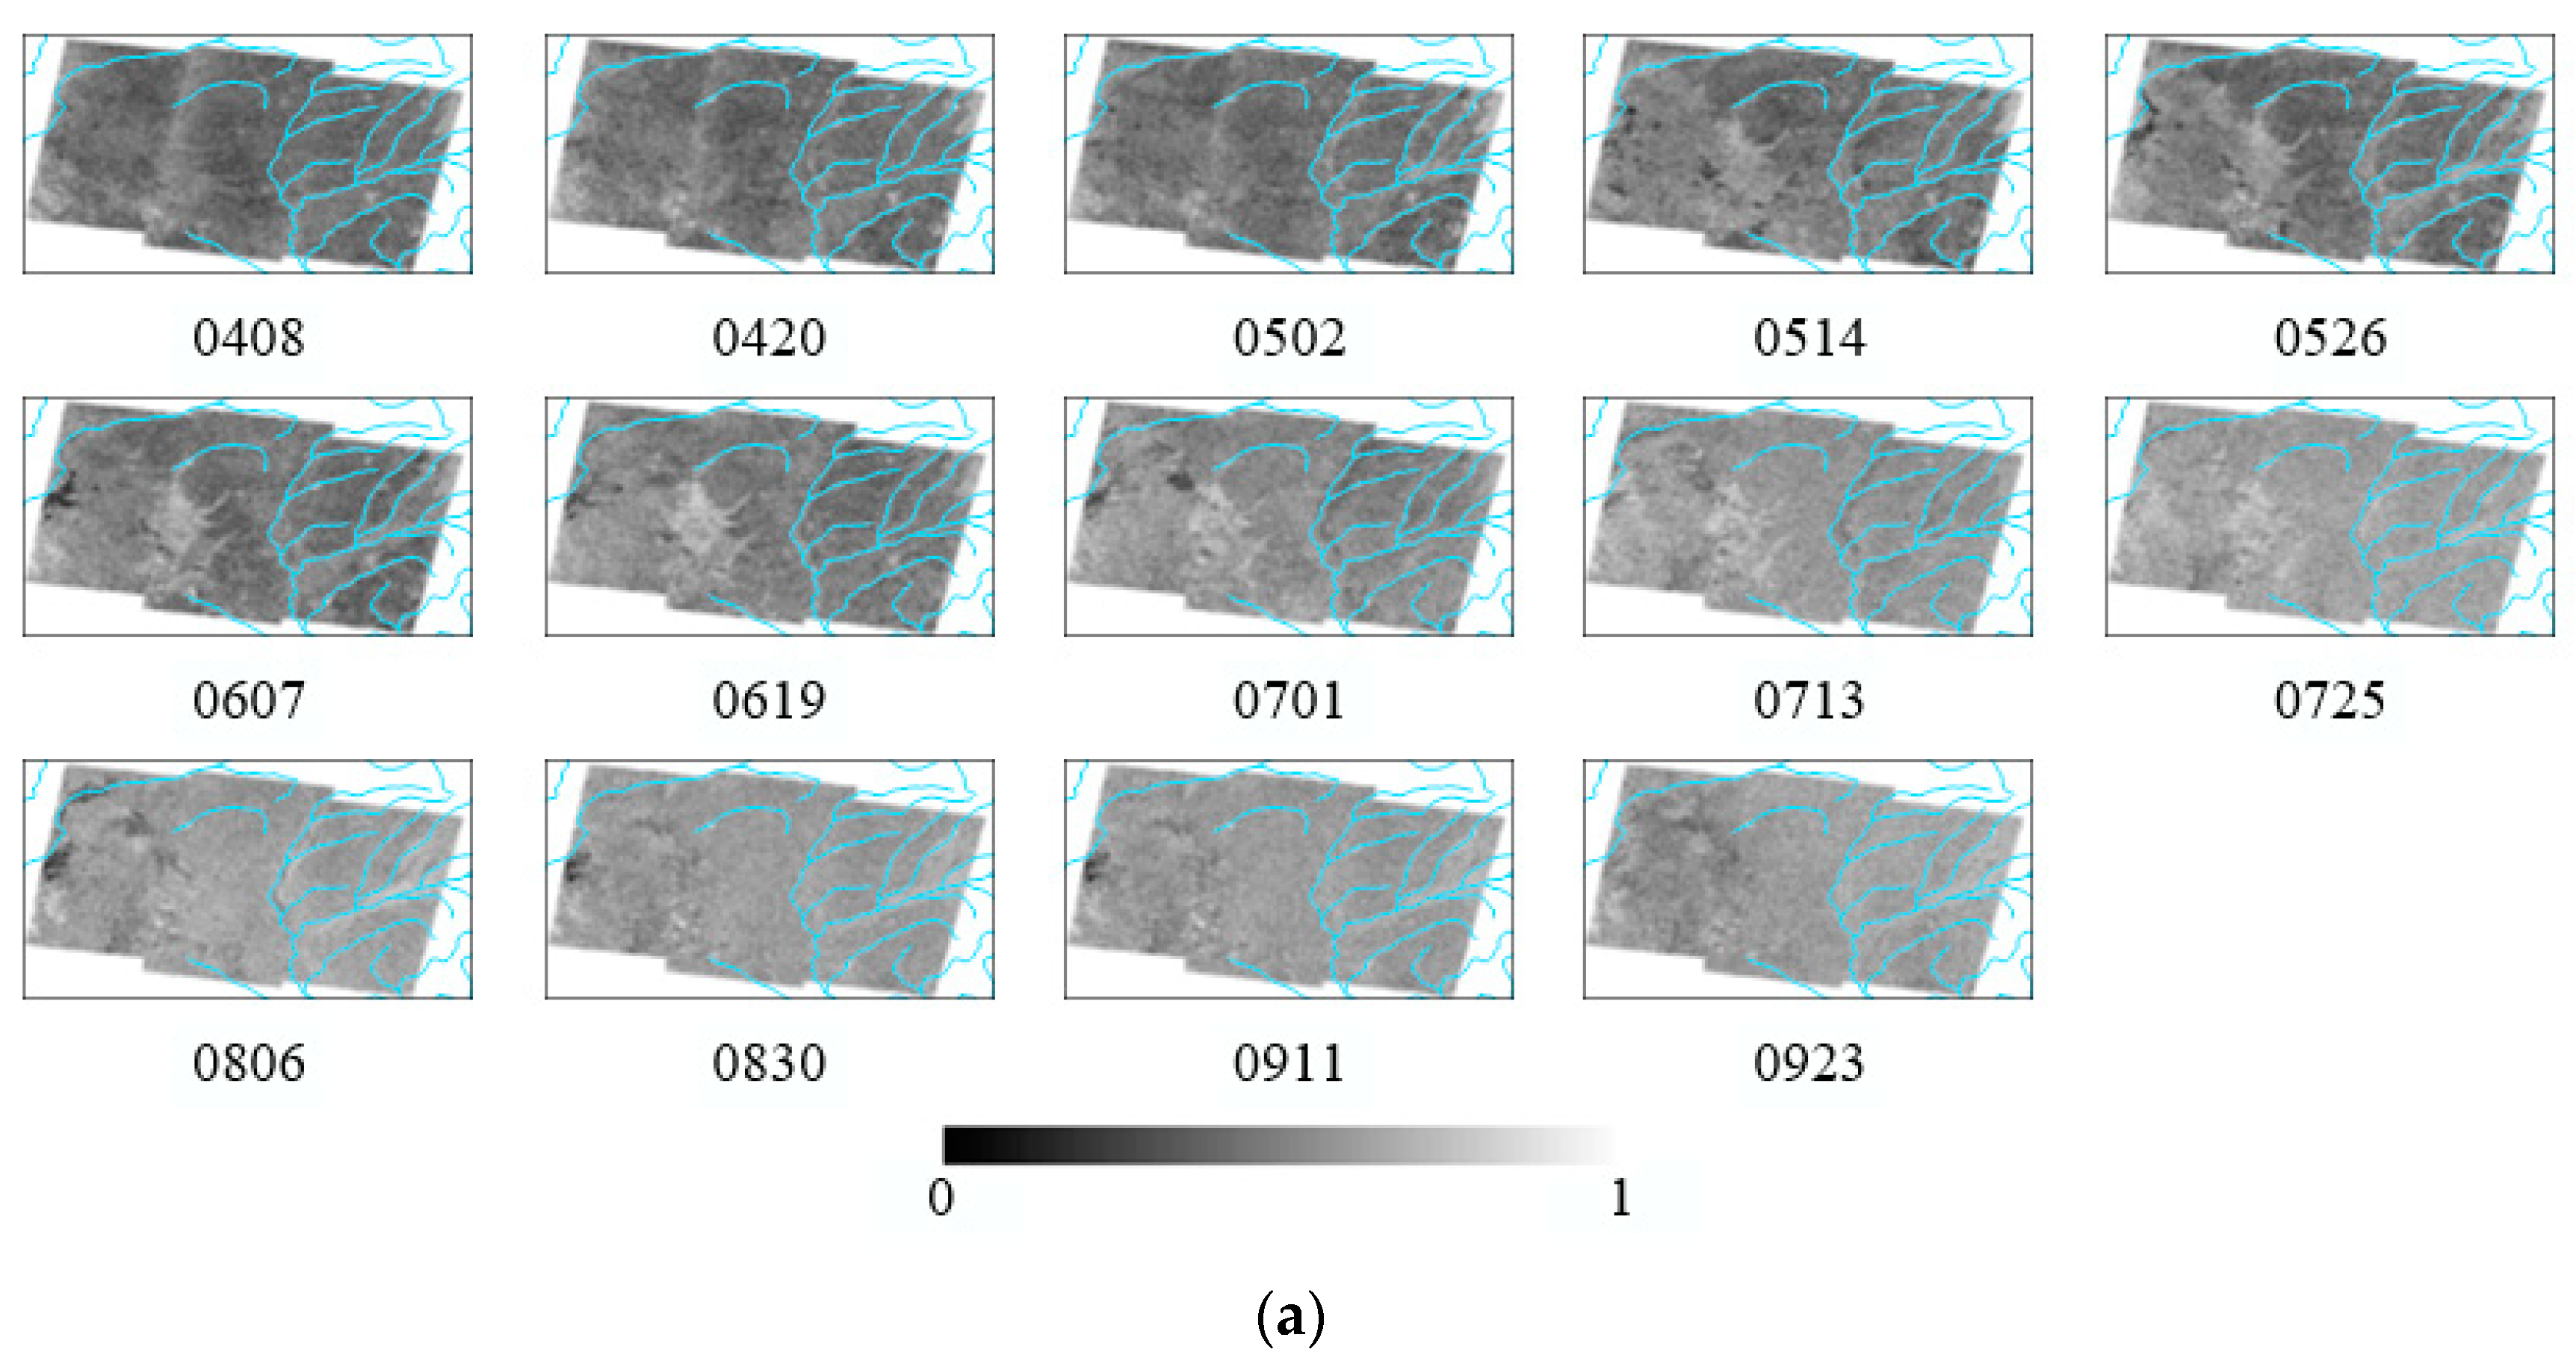
Feature Map
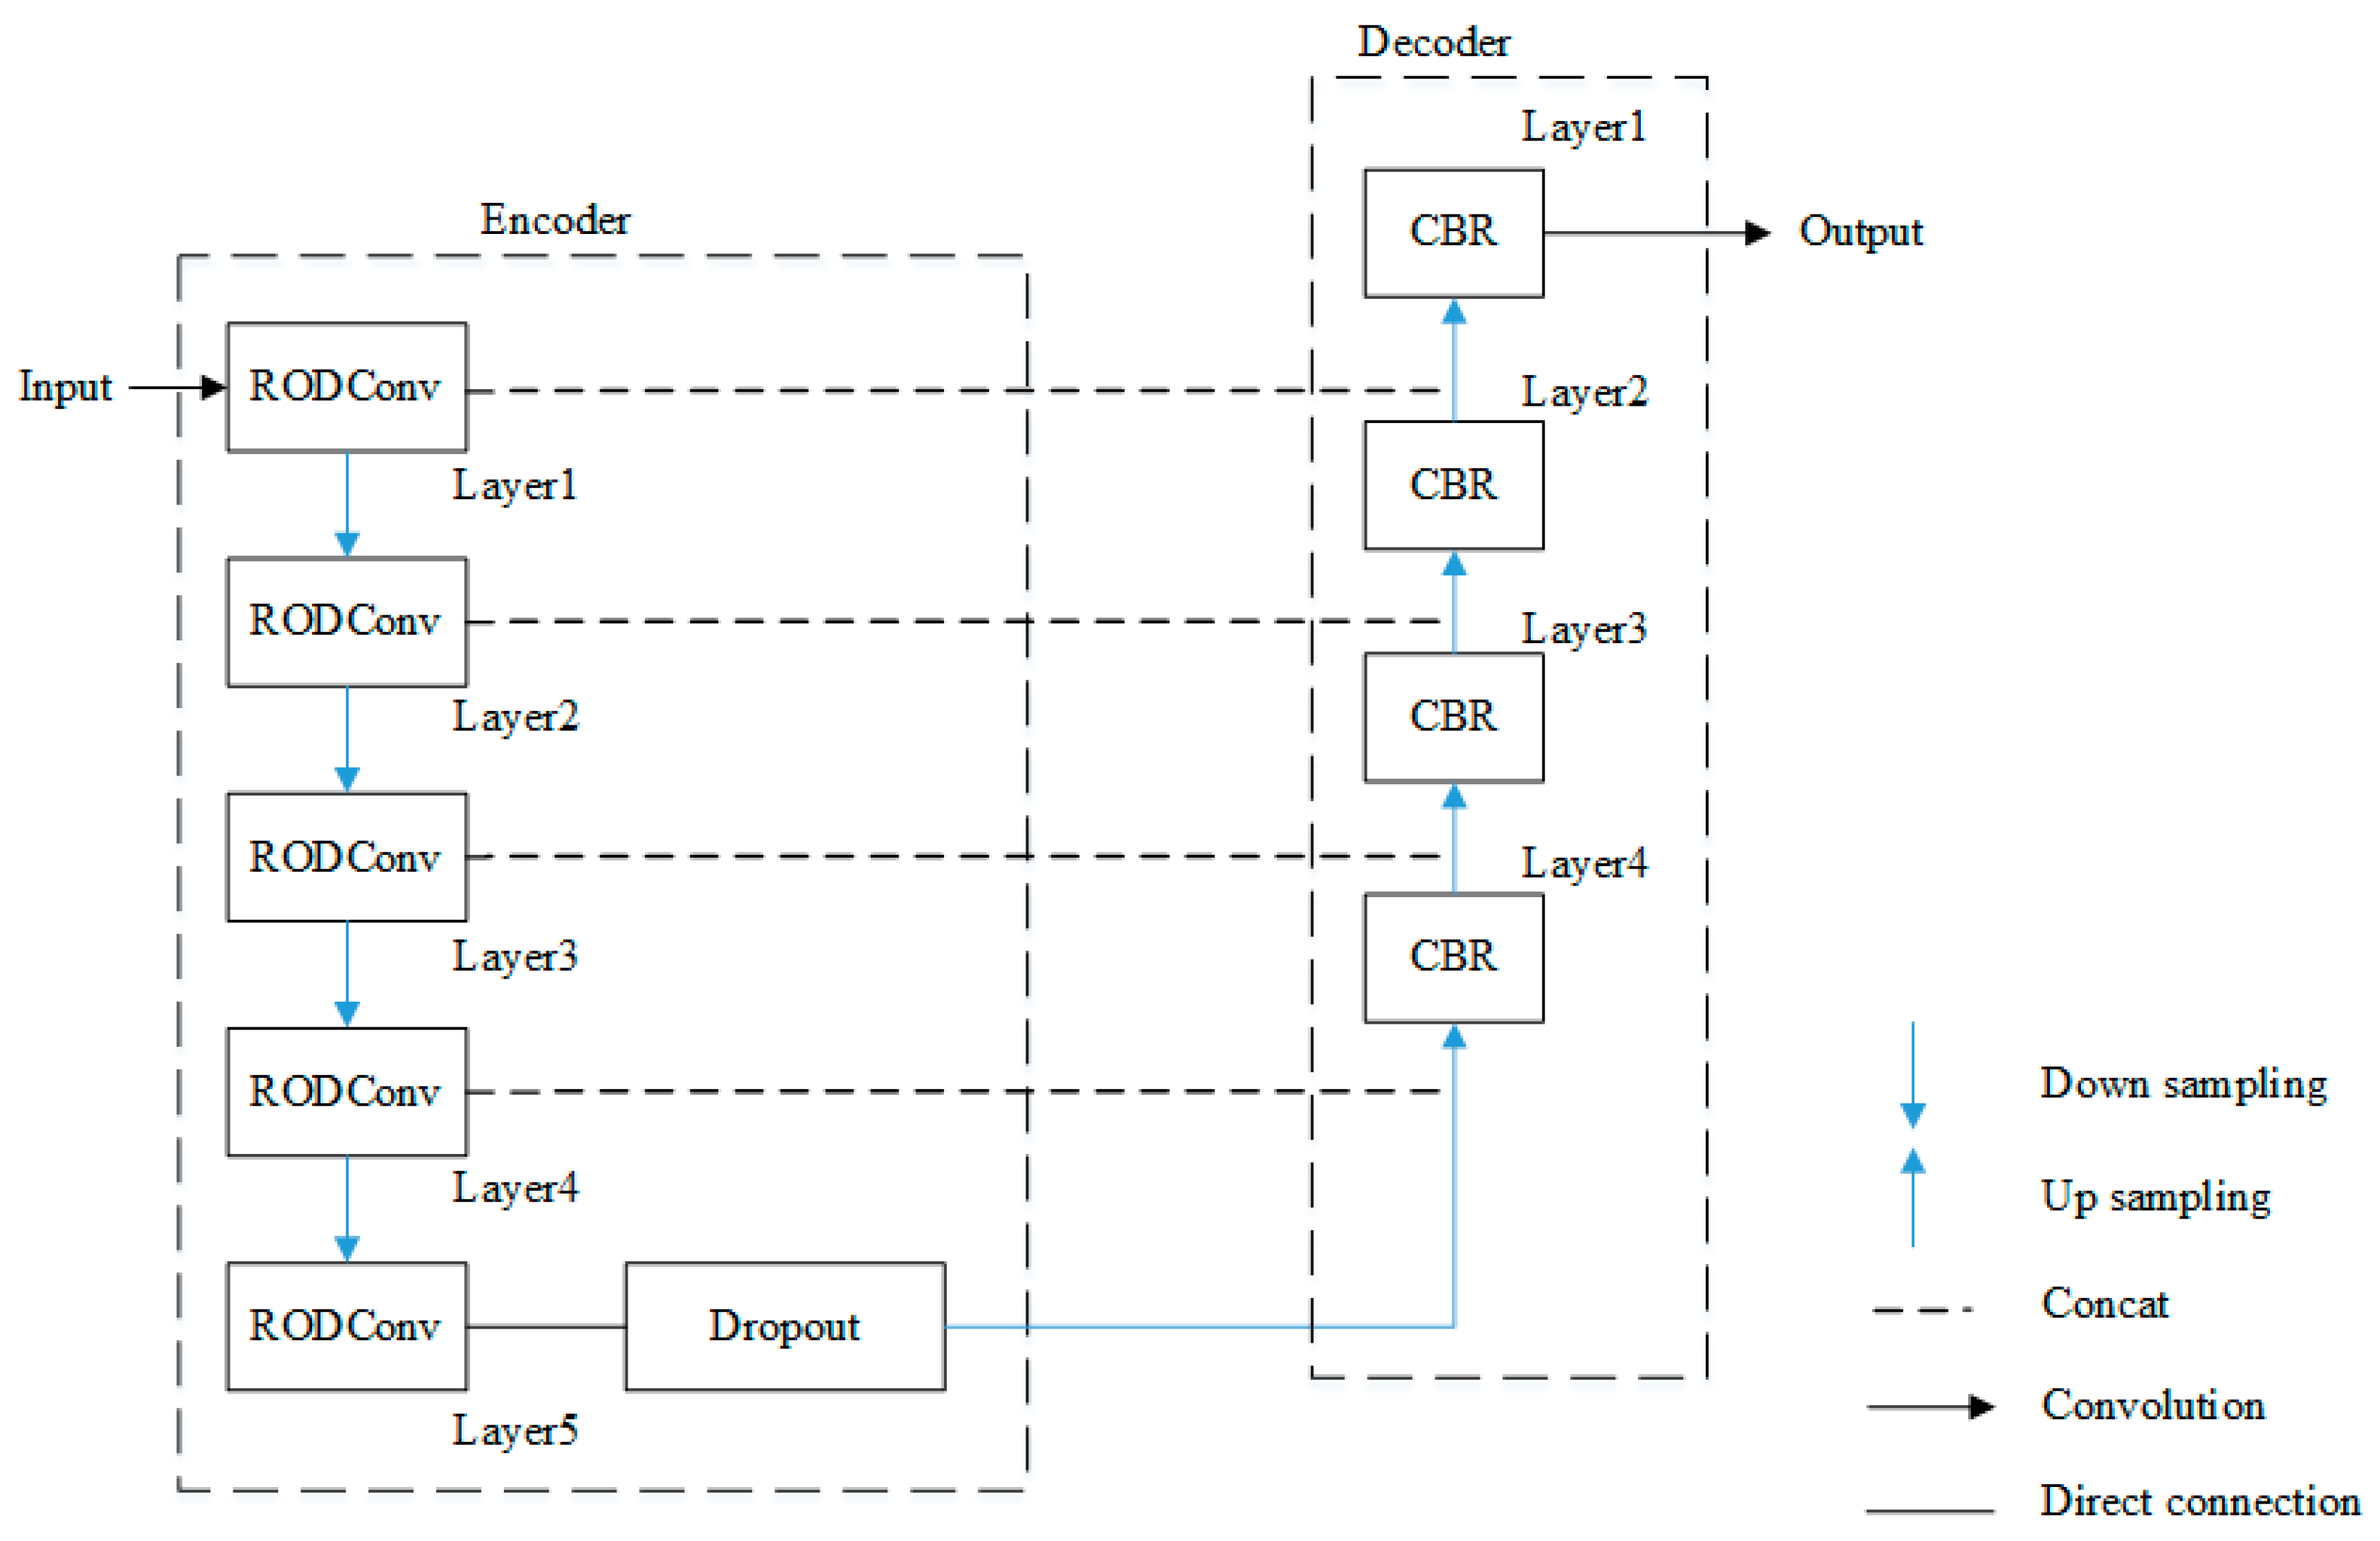
2.3.2. Two-Stage Segmentation
3. Results
3.1. Effectiveness of the Two-Stage Structure
3.2. Comparison of the Model Performance and the Rice Mapping Results
3.3. Testing Accuracy on Field Survey Data
3.4. Feature Validity
3.4.1. Validity in Time
3.4.2. Validity in Space
4. Discussion
5. Conclusions
Author Contributions
Funding
Institutional Review Board Statement
Data Availability Statement
Acknowledgments
Conflicts of Interest
References
- FAO. World Food and Agriculture—Statistical Yearbook; FAO: Roma, Italy, 2021. [Google Scholar] [CrossRef]
- Kuenzer, C.; Knauer, K. Remote sensing of rice crop areas. Int. J. Remote Sens. 2013, 34, 2101–2139. [Google Scholar] [CrossRef]
- General Assembly Resolution 70/1, Transforming Our World: The 2030 Agenda for Sustainable Development, A/RES/70/1. Available online: https://documents-dds-ny.un.org/doc/UNDOC/GEN/N15/291/89/PDF/N1529189.pdf?OpenElement (accessed on 21 October 2015).
- Shen, R.; Pan, B.; Peng, Q.; Dong, J.; Chen, X.; Zhang, X.; Ye, T.; Huang, J.; Yuan, W. High-resolution distribution maps of single-season rice in China from 2017 to 2022. Earth Syst. Sci. Data Discuss. 2023, 1–27. [Google Scholar] [CrossRef]
- Ma, X.; Wang, C.; Yin, Z.; Wu, P. SAR image despeckling by noisy reference-based deep learning method. IEEE Trans. Geosci. Remote Sens. 2020, 58, 8807–8818. [Google Scholar] [CrossRef]
- Singha, M.; Sarmah, S. Incorporating crop phenological trajectory and texture for paddy rice detection with time series MODIS, HJ-1A and ALOS PALSAR imagery. Eur. J. Remote Sens. 2019, 52, 73–87. [Google Scholar] [CrossRef]
- Guo, X.; Yin, J.; Li, K.; Yang, J.; Zou, H.; Yang, F. Fine classification of rice paddy using multitemporal compact polarimetric SAR C band data based on machine learning methods. Front. Earth Sci. 2023, 1–14. [Google Scholar] [CrossRef]
- Nelson, A.; Setiyono, T.; Rala, A.B.; Quicho, E.D.; Raviz, J.V.; Abonete, P.J.; Maunahan, A.A.; Garcia, C.A.; Bhatti, H.Z.M.; Ninh, N.H.; et al. Towards an Operational SAR-Based Rice Monitoring System in Asia: Examples from 13 Demonstration Sites across Asia in the RIICE Project. Remote Sens. 2014, 6, 10773–10812. [Google Scholar] [CrossRef]
- Sun, C.; Zhang, H.; Ge, J.; Wang, C.; Li, L.; Xu, L. Rice mapping in a subtropical hilly region based on sentinel-1 time series feature analysis and the dual branch BiLSTM model. Remote Sens. 2022, 14, 3213. [Google Scholar] [CrossRef]
- Zhu, A.X.; Zhao, F.H.; Pan, H.B.; Liu, J.Z. Mapping rice paddy distribution using remote sensing by coupling deep learning with phenological characteristics. Remote Sens. 2021, 13, 1360. [Google Scholar] [CrossRef]
- Yang, L.; Wang, L.; Abubakar, G.A.; Huang, J. High-resolution rice mapping based on SNIC segmentation and multi-source remote sensing images. Remote Sens. 2021, 13, 1148. [Google Scholar] [CrossRef]
- Jiang, J.; Zhang, H.; Ge, J.; Sun, C.; Xu, L.; Wang, C. Cropland Data Extraction in Mekong Delta Based on Time Series Sentinel-1 Dual-Polarized Data. Remote Sens. 2023, 15, 3050. [Google Scholar] [CrossRef]
- Hu, Y.; Nie, Y.; Liu, Z.; Wu, G.; Fan, W. Improving the Potential of Coniferous Forest Aboveground Biomass Estimation by Integrating C-and L-Band SAR Data with Feature Selection and Non-Parametric Model. Remote Sens. 2023, 15, 4194. [Google Scholar] [CrossRef]
- Bao, X.; Zhang, R.; Lv, J.; Wu, R.; Zhang, H.; Chen, J.; Zhang, B.; Ouyang, X.; Liu, G. Vegetation descriptors from Sentinel-1 SAR data for crop growth monitoring. ISPRS J. Photogramm. Remote Sens. 2023, 203, 86–114. [Google Scholar] [CrossRef]
- He, Z.; Li, S.; Lin, S.; Dai, L. Monitoring rice phenology based on freeman-durden decomposition of multi-temporal Radarsat-2 data. In Proceedings of the IGARSS 2018—IEEE International Geoscience and Remote Sensing Symposium, Valencia, Spain, 22–27 July 2018. [Google Scholar]
- Dey, S.; Bhogapurapu, N.; Bhattacharya, A.; Mandal, D.; Lopez-Sanchez, J.M.; McNairn, H.; Frery, A.C. Rice phenology mapping using novel target characterization parameters from polarimetric SAR data. Int. J. Remote Sens. 2021, 42, 5515–5539. [Google Scholar] [CrossRef]
- Dai, X.; Chen, S.; Jia, K.; Jiang, H.; Sun, Y.; Li, D.; Zheng, Q.; Huang, J. A decision-tree approach to identifying paddy rice lodging with multiple pieces of polarization information derived from Sentinel-1. Remote Sens. 2022, 15, 240. [Google Scholar] [CrossRef]
- Yonezawa, C.; Watanabe, M. Analysis of the applicability of multi-temporal full polarimetric airborne L-band SAR scattering to paddy rice field mapping. Int. J. Remote Sens. 2020, 41, 2500–2516. [Google Scholar] [CrossRef]
- Ma, X.; Huang, Z.; Zhu, S.; Fang, W.; Wu, Y. Rice Planting Area Identification Based on Multi-Temporal Sentinel-1 SAR Images and an Attention U-Net Model. Remote Sens. 2022, 14, 4573. [Google Scholar] [CrossRef]
- Zhong, L.; Hu, L.; Zhou, H. Deep learning based multi-temporal crop classification. Remote Sens. Environ. 2019, 221, 430–443. [Google Scholar] [CrossRef]
- Ronneberger, O.; Fischer, P.; Brox, T. U-net: Convolutional networks for biomedical image segmentation. In Medical Image Computing and Computer-Assisted Intervention, Proceedings of the MICCAI 2015: 18th International Conference, Munich, Germany, 5–9 October 2015; Springer International Publishing: Berlin/Heidelberg, Germany, 2015; Part III 18. [Google Scholar]
- Ge, S.; Zhang, J.; Pan, Y.; Yang, Z.; Zhu, S. Transferable deep learning model based on the phenological matching principle for mapping crop extent. Int. J. Appl. Earth Obs. Geoinf. 2021, 102, 102451. [Google Scholar] [CrossRef]
- Cai, Z.; Wei, H.; Hu, Q.; Zhou, W.; Zhang, X.; Jin, W.; Wang, L.; Yu, S.; Wang, Z.; Shi, Z.; et al. Learning spectral-spatial representations from VHR images for fine-scale crop type mapping: A case study of rice-crayfish field extraction in South China. ISPRS J. Photogramm. Remote Sens. 2023, 199, 28–39. [Google Scholar] [CrossRef]
- Xu, W.; Deng, X.; Guo, S.; Chen, J.; Sun, L.; Zheng, X.; Xiong, Y.; Shen, Y.; Wang, X. High-resolution u-net: Preserving image details for cultivated land extraction. Sensors 2020, 20, 4064. [Google Scholar] [CrossRef]
- Sun, C.; Zhang, H.; Xu, L.; Ge, J.; Jiang, J.; Zuo, L.; Wang, C. 20 m Annual Paddy Rice Map for Mainland Southeast Asia Using Sentinel-1 SAR Data. Earth Syst. Sci. Data Discuss. 2022, 2022, 1–25. [Google Scholar]
- Chen, S.W.; Li, Y.Z.; Wang, X.S.; Xiao, S.P.; Sato, M. Modeling and interpretation of scattering mechanisms in polarimetric synthetic aperture radar: Advances and perspectives. IEEE Signal Process. Mag. 2014, 31, 79–89. [Google Scholar] [CrossRef]
- Raney, R.K.; Cahill, J.T.; Patterson, G.W.; Bussey, D.B.J. The m-chi decomposition of hybrid dual-polarimetric radar data with application to lunar craters. J. Geophys. Res. Planets 2012, 117, E12. [Google Scholar] [CrossRef]
- Cloude, S.R.; Pottier, E. An entropy based classification scheme for land applications of polarimetric SAR. IEEE Trans. Geosci. Remote Sens. 1997, 35, 68–78. [Google Scholar] [CrossRef]


| Orbit-Frame | 105–435 | 105–441 | 105–448 |
|---|---|---|---|
| Year | Date (MM/DD) | ||
| 2022 | 04/08 | ||
| 04/20 | |||
| 05/02 | |||
| 05/14 | 05/14 | 0503 | |
| 05/26 | |||
| 06/07 | |||
| 06/19 | 06/19 | 0608 | |
| 07/01 | 07/01 | 0620 | |
| 07/13 | |||
| 07/25 | |||
| 08/06 | |||
| 08/30 | |||
| 09/11 | |||
| 09/23 | |||
| 2019 | 05/13 | 05/13 | |
| 06/18 | 06/18 | ||
| 06/30 | 06/30 |
| Rice | All Classes (Rice and Non-Rice) | |||||
|---|---|---|---|---|---|---|
| IoU | Recall (PA) | Precision | mIoU | mPA | Accuracy | |
| One-Stage ODCRS | 72.23% | 87.54% | 80.50% | 84.82% | 92.95% | 97.57% |
| Two-Stage ODCRS | 78.67% | 89.83% | 86.36% | 88.39% | 94.36% | 98.24% |
| Rice | All Classes (Rice and Non-Rice) | |||||
|---|---|---|---|---|---|---|
| IoU | Recall (PA) | Precision | mIoU | mPA | Accuracy | |
| UNet | 66.04% | 85.77% | 74.17% | 81.32% | 91.72% | 96.82% |
| Two-Stage ODCRS | 78.67% | 89.83% | 86.36% | 88.39% | 94.36% | 98.24% |
| Field Investigation Data/Pixels | User Accuracy | ||||
|---|---|---|---|---|---|
| Mapping Results /Pixels | Rice | Non-rice | Sum | ||
| Rice | 165,814 | 31,130 | 196,944 | 84.19% | |
| Non-rice | 21,115 | 73,215 | 94,330 | 77.62% | |
| Sum | 186,929 | 104,555 | 291,484 | ||
| Mapping Accuracy | 88.70% | 70.03% | |||
Disclaimer/Publisher’s Note: The statements, opinions and data contained in all publications are solely those of the individual author(s) and contributor(s) and not of MDPI and/or the editor(s). MDPI and/or the editor(s) disclaim responsibility for any injury to people or property resulting from any ideas, methods, instructions or products referred to in the content. |
© 2023 by the authors. Licensee MDPI, Basel, Switzerland. This article is an open access article distributed under the terms and conditions of the Creative Commons Attribution (CC BY) license (https://creativecommons.org/licenses/by/4.0/).
Share and Cite
Jiang, J.; Zhang, H.; Ge, J.; Xu, L.; Song, M.; Sun, C.; Wang, C. Single-Season Rice Area Mapping by Combining Multi-Temporal Polarization Decomposition Components and the Two-Stage Segmentation Method. Agriculture 2024, 14, 2. https://doi.org/10.3390/agriculture14010002
Jiang J, Zhang H, Ge J, Xu L, Song M, Sun C, Wang C. Single-Season Rice Area Mapping by Combining Multi-Temporal Polarization Decomposition Components and the Two-Stage Segmentation Method. Agriculture. 2024; 14(1):2. https://doi.org/10.3390/agriculture14010002
Chicago/Turabian StyleJiang, Jingling, Hong Zhang, Ji Ge, Lu Xu, Mingyang Song, Chunling Sun, and Chao Wang. 2024. "Single-Season Rice Area Mapping by Combining Multi-Temporal Polarization Decomposition Components and the Two-Stage Segmentation Method" Agriculture 14, no. 1: 2. https://doi.org/10.3390/agriculture14010002
APA StyleJiang, J., Zhang, H., Ge, J., Xu, L., Song, M., Sun, C., & Wang, C. (2024). Single-Season Rice Area Mapping by Combining Multi-Temporal Polarization Decomposition Components and the Two-Stage Segmentation Method. Agriculture, 14(1), 2. https://doi.org/10.3390/agriculture14010002