
Selected Characteristics of Multifloral Honeys from North-Eastern Romania


 ,
,
Abstract
:1. Introduction
2. Materials and Methods
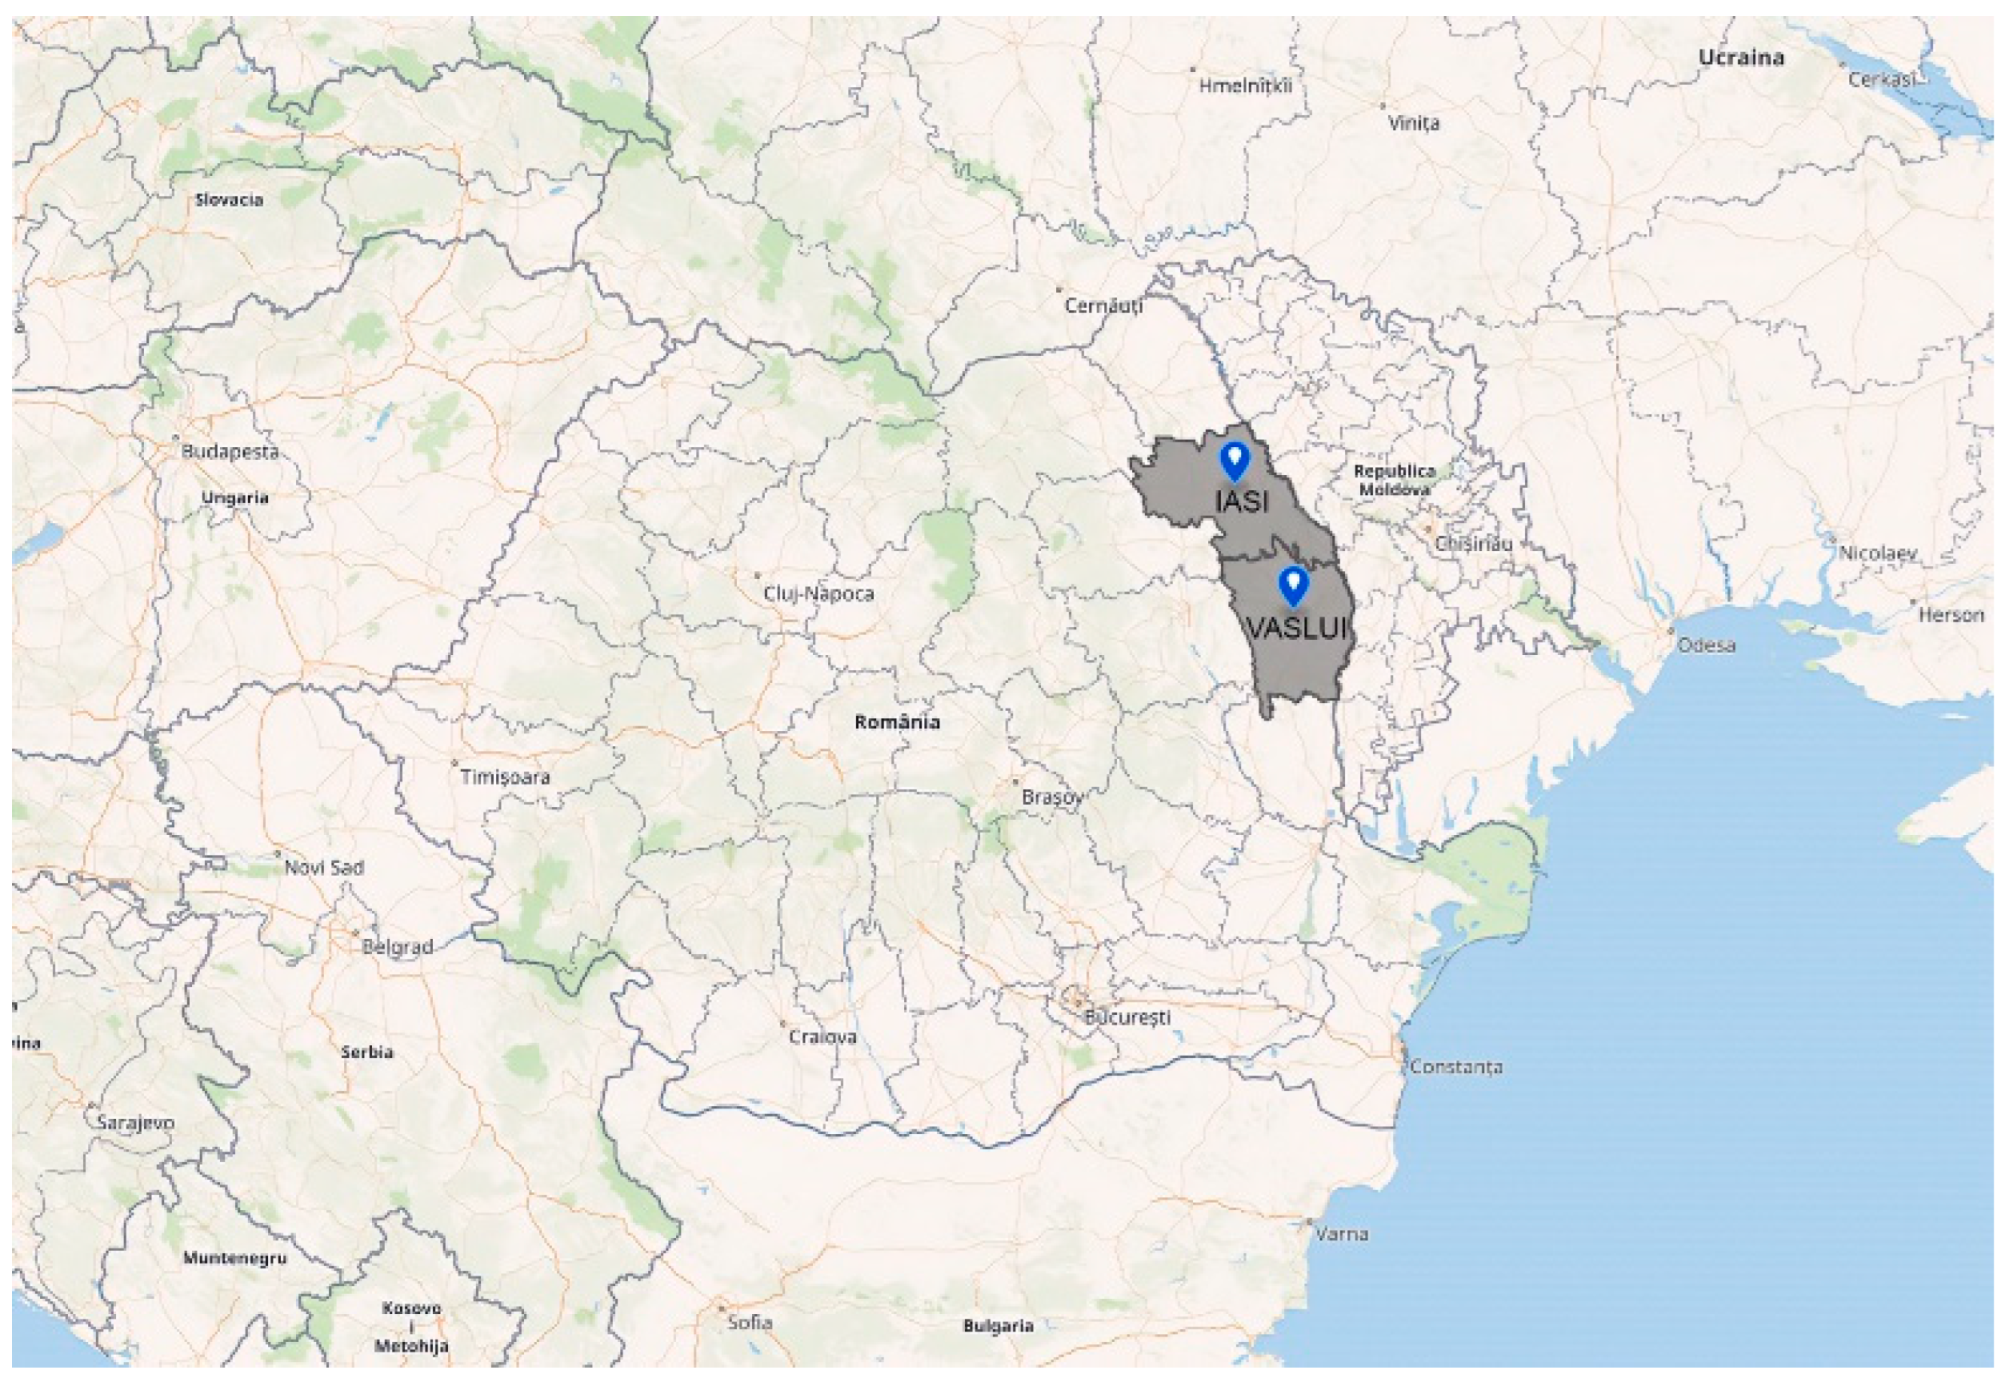
2.1. Honey Samples
2.2. Physicochemical Determinations
2.3. Total Phenol Content and Total Flavonoid Content
2.4. Mineral Elements (K, Ca, Mg, Na, P, Zn, Cu, Mn, Ni, Co, and Pb)
2.5. FTIR Spectra
2.6. Statistical Analyses
3. Results
3.1. Physicochemical Determinations
3.2. Mineral Elements (K, Ca, Mg, Na, P, Zn, Cu, Mn, Ni, Co, and Pb)
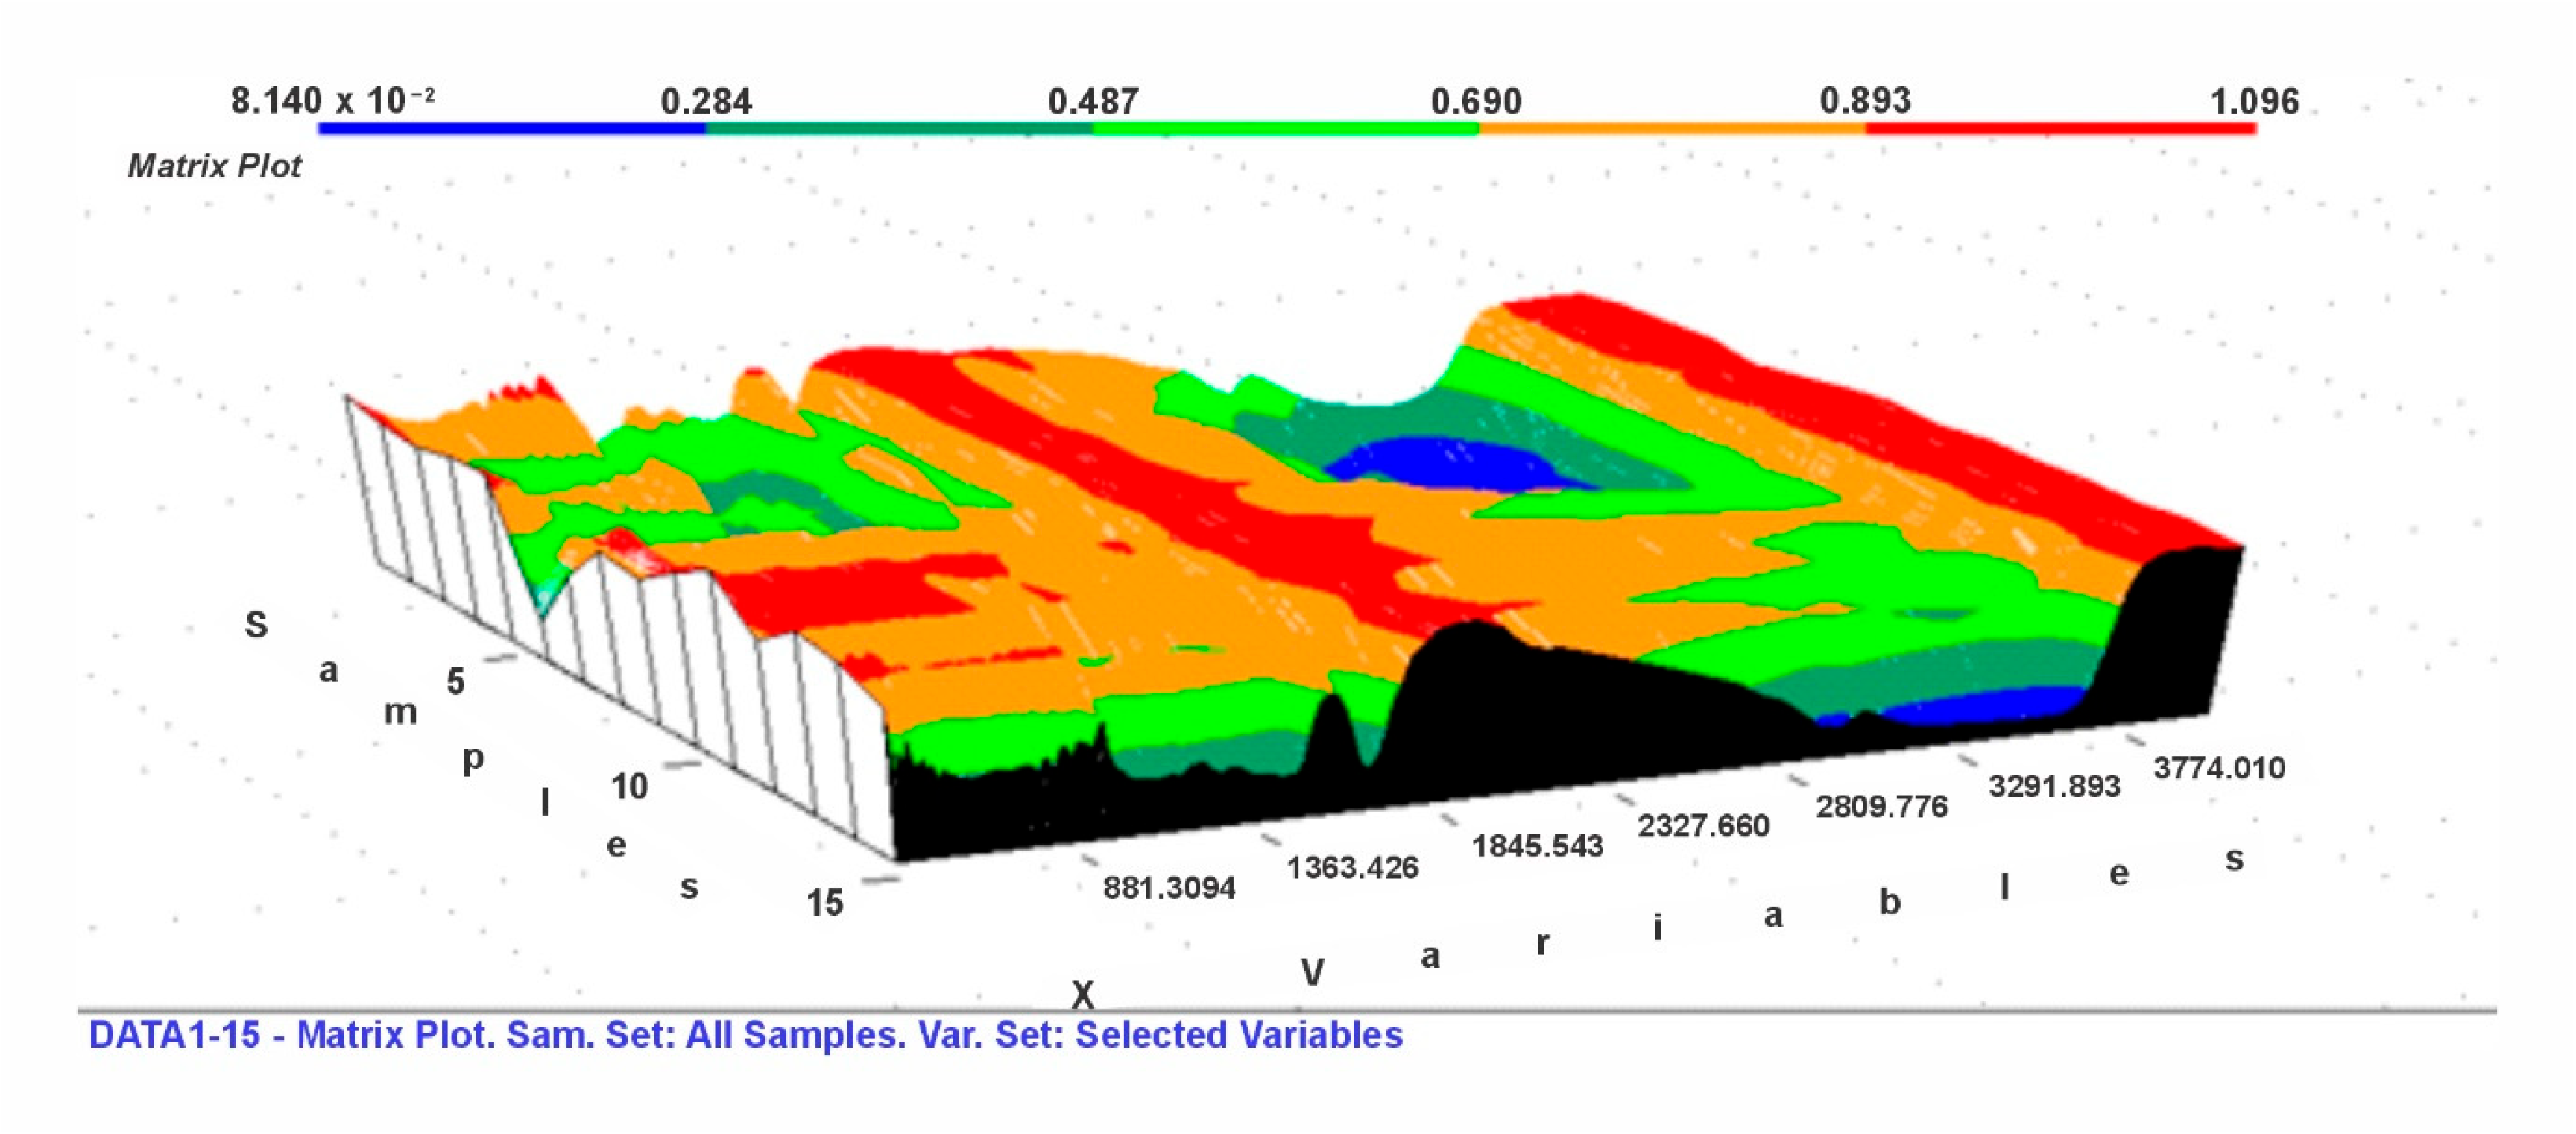
3.3. FTIR Spectra
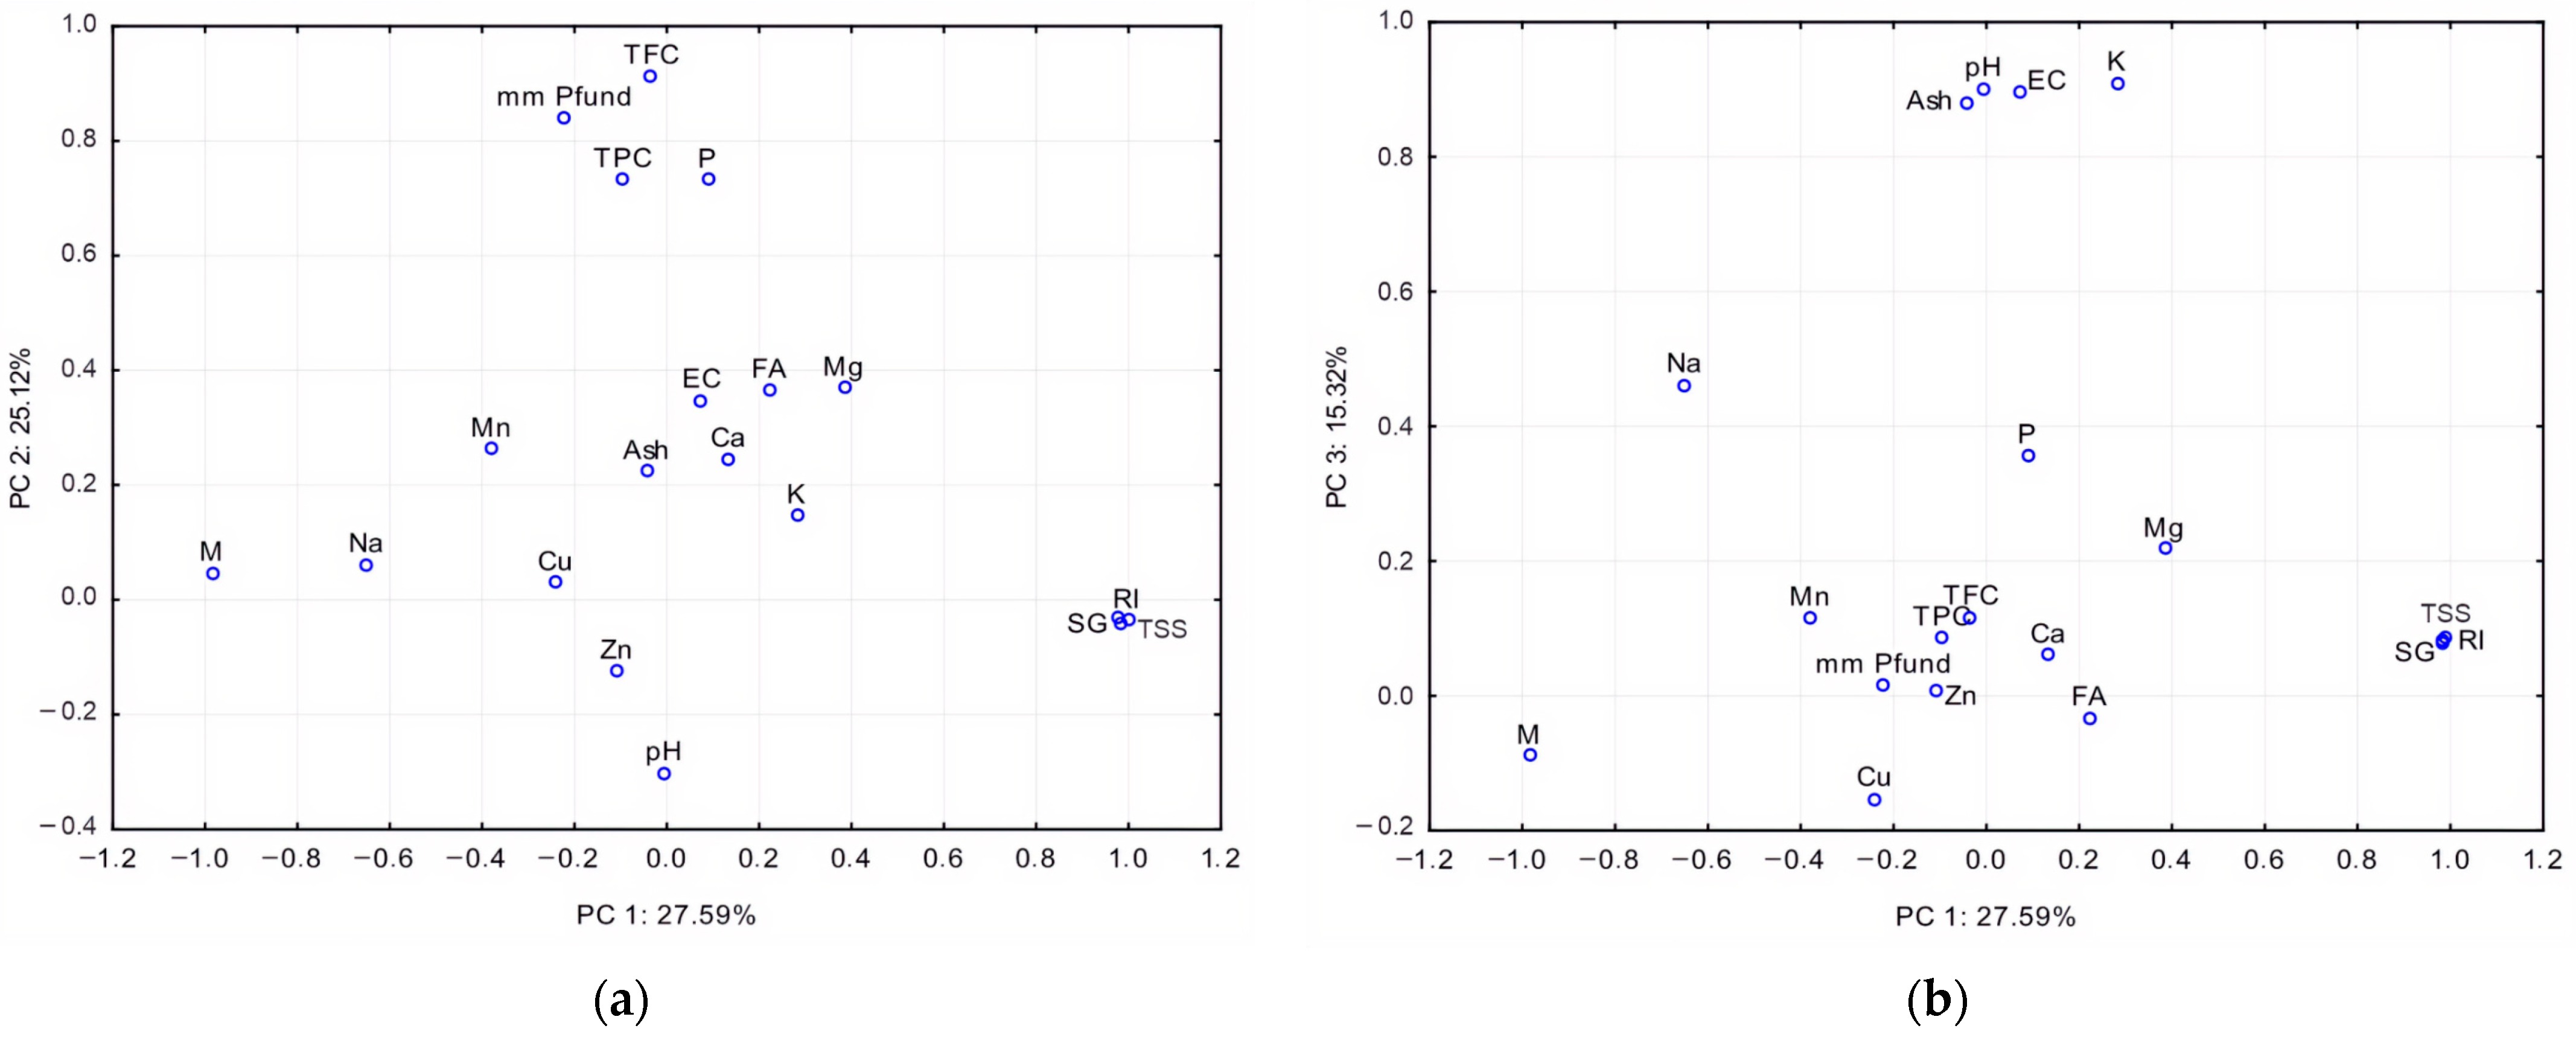
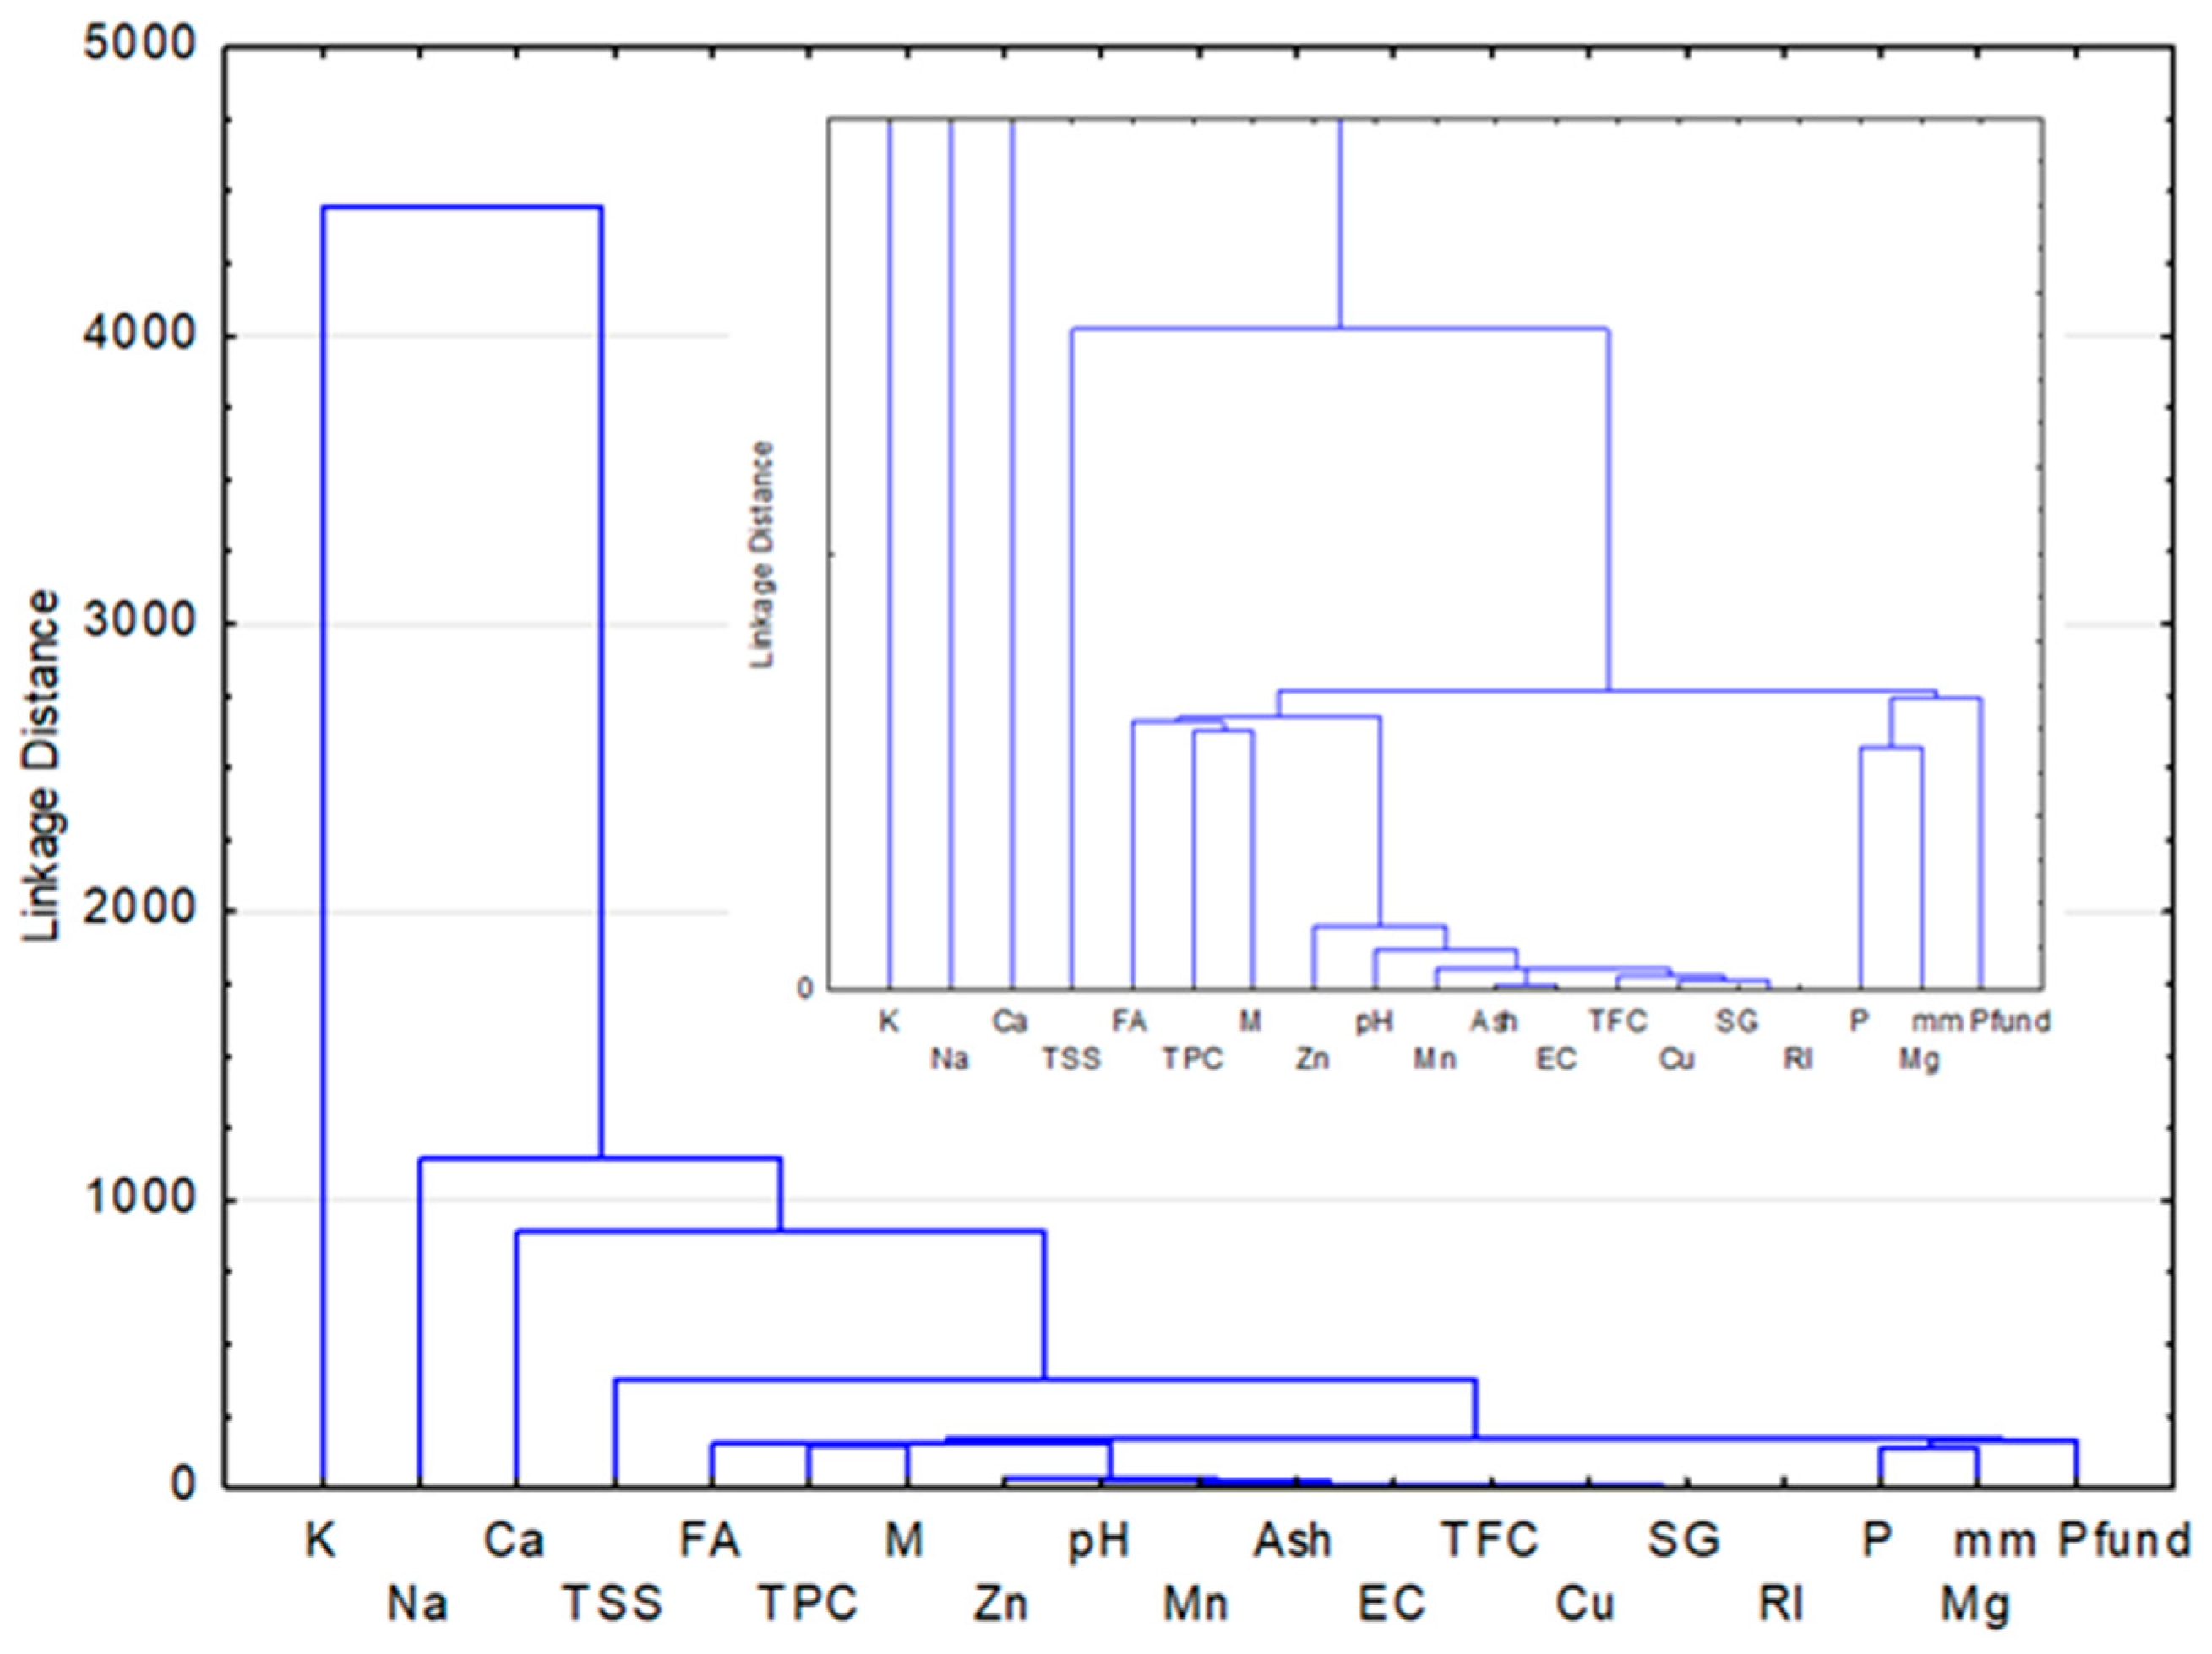
3.4. Correlation and Multivariate Statistical Analysis
4. Discussion
4.1. Physicochemical Determinations
4.2. Mineral Elements (K, Ca, Mg, Na, P, Zn, Cu, Mn, Ni, Co, and Pb)
4.3. FTIR Spectra
4.4. Correlation and Multivariate Statistical Analysis
5. Conclusions
Author Contributions
Funding
Institutional Review Board Statement
Informed Consent Statement
Data Availability Statement
Acknowledgments
Conflicts of Interest
References
- European Parliament. Directive 2014/63/EU of the European Parliament and of the Council amending Council Directive 2001/110/EC relating to honey. Off. J. Eur. Communities 2014, 57, L164-1. [Google Scholar]
- Pătruică, S.; Alexa, E.; Obiștioiu, D.; Cocan, I.; Radulov, I.; Berbecea, A.; Lazăr, R.N.; Simiz, E.; Vicar, N.M.; Hulea, A.; et al. Chemical Composition, Antioxidant and Antimicrobial Activity of Some Types of Honey from Banat Region, Romania. Molecules 2022, 27, 4179. [Google Scholar] [CrossRef] [PubMed]
- Tedesco, R.; Scalabrin, E.; Malagnini, V.; Strojnik, L.; Ogrinc, N.; Capodaglio, G. Character-ization of Botanical Origin of Italian Honey by Carbohydrate Composition and Volatile Organic Compounds (VOCs). Foods 2022, 11, 2441. [Google Scholar] [CrossRef] [PubMed]
- da Silva, P.M.; Gauche, C.; Gonzaga, L.V.; Costa, A.C.O.; Fett, R. Honey: Chemical composition, stability and authenticity. Food Chem. 2016, 196, 309–323. [Google Scholar] [CrossRef] [PubMed]
- Becerril-Sánchez, A.L.; Quintero-Salazar, B.; Dublán-García, O.; Escalona-Buendía, H.B. Phenolic Compounds in Honey and Their Relationship with Antioxidant Activity, Botanical Origin, and Color. Antioxidants 2021, 10, 1700. [Google Scholar] [CrossRef] [PubMed]
- Bodó, A.; Radványi, L.; Kőszegi, T.; Csepregi, R.; Nagy, D.U.; Farkas, Á.; Kocsis, M. Melissopalynology, antioxidant activity and multielement analysis of two types of early spring honeys from Hungary. Food Biosci. 2020, 35, 100587. [Google Scholar] [CrossRef]
- Bobiș, O.; Mărghitaș, L.A.; Dezmirean, D.S.; Bărnuțiu, L.I.; Mărgăoan, R.; Bogdan Gher-man, B.; Bonta, V. The Importance of Melissopalynology in Addition to Physical-chemical Analysis on Botanical Authenticity Testing of Monofloral Honey. Bull. UASVM Anim. Sci. Biotechnol. 2013, 70, 24–30. [Google Scholar]
- Bertoncelj, J.; Doberšek, U.; Jamnik, M.; Golob, T. Evaluation of the phenolic content, antioxidant activity and colour of Slovenian honey. Food Chem. 2007, 105, 822–828. [Google Scholar] [CrossRef]
- Dżugan, M.; Tomczyk, M.; Sowa, P.; Grabek-Lejko, D. Antioxidant Activity as Biomarker of Honey Variety. Molecules 2018, 23, 2069. [Google Scholar] [CrossRef]
- Lobos, I.; Silva, M.; Ulloa, P.; Pavez, P. Mineral and Botanical Composition of Honey Produced in Chile’s Central-Southern Region. Foods 2022, 11, 251. [Google Scholar] [CrossRef]
- Dobre, I.; Alexe, P.; Escuredo, O.; Seijo, C.M. Palynological evaluation of selected honeys from Romania. Grana 2013, 52, 113–121. [Google Scholar] [CrossRef]
- Romanian Standards Association. SR (Romanian Standard)784-2:2009 Honey. Part 2: Quality Requirements at Sale. Available online: https://e-standard.eu/en/standard/174481 (accessed on 16 April 2018).
- Pașca, C.; Mărghitaș, L.A.; Matei, I.A.; Bonta, V.; Mărgăoan, R.; Copaciu, F.; Bobiș, O.; Campos, M.G.; Dezmirean, D.S. Screening of Some Romanian Raw Honeys and Their Probiotic Potential Evaluation. Appl. Sci. 2021, 11, 5816. [Google Scholar] [CrossRef]
- Oroian, M.; Dranca, F.; Ursachi, F. Characterization of Romanian Bee Pollen—An Important Nutritional Source. Foods 2022, 11, 2633. [Google Scholar] [CrossRef] [PubMed]
- Giosanu, D.; Topală, C.; Topală, L.; Rădulescu, A.; Mazilu, I. Application of spectroscopy in analysis of some floral honey samples collected from four south romanian counties in 2021. Curr. Trends Nat. Sci. 2022, 11, 162–171. [Google Scholar] [CrossRef]
- Khalafi, R.; Goli, S.A.H.; Behjatian, M. Characterization and classification of several monofloral Iranian honeys based on physicochemical properties and antioxidant activity. Int. J. Food Prop. 2016, 19, 1065–1079. [Google Scholar] [CrossRef]
- El Sohaimy, S.A.; Masry, S.H.D.; Shehata, M.G. Physicochemical characteristics of honey from different origins. Ann. Agric. Sci. 2015, 60, 279–287. [Google Scholar] [CrossRef]
- Halouzka, R.; Tarkowski, P.; Zeljković, S.C. Characterisation of phenolics and other quality parameters of different types of honey. Czech J. Food Sci. 2016, 34, 244–253. [Google Scholar] [CrossRef]
- Milek, M.; Bocian, A.; Kleczyńska, E.; Sowa, P.; Dżugan, M. The Comparison of Physicochemical Parameters, Antioxidant Activity and Proteins for the Raw Local Polish Honeys and Imported Honey Blends. Molecules 2021, 26, 2423. [Google Scholar] [CrossRef]
- Pauliuc, D.; Dranca, F.; Ropciuc, S.; Oroian, M. Advanced Characterization of Monofloral Honeys from Romania. Agriculture 2022, 12, 526. [Google Scholar] [CrossRef]
- de-Melo, A.A.M.; de Almeida-Muradian, L.B.; Sancho, M.T.; Pascual-Maté, A. Composition and properties of Apis mellifera honey: A review. J. Apic. Res. 2017, 57, 5–37. [Google Scholar] [CrossRef]
- Soares, S.; Amaral, J.S.; Oliveira, M.B.P.; Mafra, I. A comprehensive review on the main honey authentication issues: Production and origin. Compr. Rev. Food Sci. Food Saf. 2017, 16, 1072–1100. [Google Scholar] [CrossRef] [PubMed]
- Svečnjak, L.; Bubalo, D.; Baranović, G.; Novosel, H. Optimization of FTIR-ATR spectroscopy for botanical authentication of unifloral honey types and melissopalynological data prediction. Eur. Food Res. Technol. 2015, 240, 1101–1115. [Google Scholar] [CrossRef]
- Mail, M.H.; Ab Rahim, N.; Amanah, A.; Khawory, M.H.; Shahudin, M.A.; Seeni, A. FTIR and elementary analysis of Trigona honey, Apis honey and adulterated honey mixtures. Biomed. Pharmacol. J. 2019, 12, 2011–2017. [Google Scholar] [CrossRef]
- Louveaux, J.; Maurizio, A.; Vorwohl, G. Methods of Melissopalynology. Bee World 1978, 59, 139–157. [Google Scholar] [CrossRef]
- Von Der Ohe, W.; Persano Oddo, L.; Piana, M.L.; Morlot, M.; Martin, P. Harmonized Methods of Melissopalynology. Apidologie 2004, 35, S18–S25. [Google Scholar] [CrossRef]
- Ratiu, I.A.; Al-Suod, H.; Bukowska, M.; Ligor, M.; Buszewski, B. Correlation study of honey regarding their physicochemical properties and sugars and cyclitols content. Molecules 2020, 25, 34. [Google Scholar] [CrossRef] [PubMed]
- Romanian Standards Association. SR (Romanian Standard) 784-3:2009: Honey. Part 3: Analytical Methods. Available online: https://e-standard.eu/en/standard/174480 (accessed on 16 April 2018).
- USDA. Extracted Honey Grading Manual, United States Department of Agriculture. Standards for Honey Grading; USDA: Washington, DC, USA, 1985. Available online: https://www.ams.usda.gov/sites/default/files/media/Extracted_Honey_Inspection_Instructions%5B1%5D.pdf (accessed on 10 December 2018).
- Bogdanov, S. Harmonized Methods of the International Honey Commission. 2009. Available online: https://www.ihc-platform.net/ihcmethods2009.pdf (accessed on 30 May 2018).
- Bobis, O.; Marghitas, L.; Rindt, I.K.; Niculae, M.; Dezmirean, D. Honeydew honey: Correlations between chemical composition, antioxidant capacity and antibacterial effect. Sci. Pap. Anim. Sci. Biotechnol. 2008, 41, 271–277. [Google Scholar]
- Sereia, M.J.; Março, P.H.; Perdoncini, M.R.G.; Parpinelli, R.S.; de Lima, E.G.; Anjo, F.A. Chapter 9: Techniques for the Evaluationof Physicochemical Quality and Bioactive Compounds in Honey. In Honey Analysis; INTECH: London, UK, 2017; pp. 194–214. [Google Scholar]
- Pontis, J.A.; Costa, L.A.M.A.D.; Silva, S.J.R.D.; Flach, A. Color, phenolic and flavonoid content, and antioxidant activity of honey from Roraima, Brazil. Food Sci. Technol. 2014, 34, 69–73. [Google Scholar] [CrossRef]
- Johnbull, O.A.; Frances, A.; Isaac, A.O.; Cynthia, A.C. Analysis of mineral content and some heavy metals of honey samples produced and marketed in Imo state, Nigeria: A prerequisite to fomulating a pharmaceutical dosage form. World J. Pharm. Pharm. Sci. 2020, 9, 130–138. [Google Scholar]
- Živković, J.; Sunarić, S.; Stanković, N.; Mihajilov-Krstev, T.; Spasić, A. Total phenolic and flavonoid contents, antioxidant and antibacterial activities of selected honeys against human pathogenic bacteria. Acta Pol. Pharm. Drug Res. 2019, 76, 671–681. [Google Scholar] [CrossRef]
- Bodor, Z.; Kovacs, Z.; Benedek, C.; Hitka, G.; Behling, H. Origin Identification of Hungarian Honey Using Melissopalynology, Physicochemical Analysis, and Near Infrared Spectroscopy. Molecules 2021, 26, 7274. [Google Scholar] [CrossRef] [PubMed]
- Pauliuc, D.; Dranca, F.; Oroian, M. Antioxidant Activity, Total Phenolic Content, Individual Phenolics and Physicochemical Parameters Suitability for Romanian Honey Authentication. Foods 2020, 9, 306. [Google Scholar] [CrossRef] [PubMed]
- Pop, I.M.; Simeanu, D.; Cucu-Man, S.-M.; Pui, A.; Albu, A. Quality Profile of Several Monofloral Romanian Honeys. Agriculture 2023, 13, 75. [Google Scholar] [CrossRef]
- Ahmida, N.H.; Elagori, M.; Agha, A.; Elwerfali, S.; Ahmida, M.H. Physicochemical, heavy metals and phenolic compounds analysis of Libyan honey samples collected from Benghazi during 2009–2010. Food Nutr. Sci. 2013, 4, 33–40. [Google Scholar] [CrossRef]
- Smetanska, I.; Alharthi, S.S.; Selim, K.A. Physicochemical, antioxidant capacity and color analysis of six honeys from different origin. J. King Saud Univ. Sci. 2021, 33, 101447. [Google Scholar] [CrossRef]
- European Commission. Council Directive 2001/110/CE concerning honey. Off. J. Eur. Comm. 2002, L10, 47–52. [Google Scholar]
- Kędzierska-Matysek, M.; Teter, A.; Stryjecka, M.; Skałecki, P.; Domaradzki, P.; Rudaś, M.; Florek, M. Relationships Linking the Colour and Elemental Concentrations of Blossom Honeys with Their Antioxidant Activity: A Chemometric Approach. Agriculture 2021, 11, 702. [Google Scholar] [CrossRef]
- Scripcă, L.A.; Norocel, L.; Amariei, S. Comparison of Physicochemical, Microbiological Properties and Bioactive Compounds Content of Grassland Honey and other Floral Origin Honeys. Molecules 2019, 24, 2932. [Google Scholar] [CrossRef]
- Oroian, M.; Todosi Sănduleac, E.; Pădureț, S. Physicochemical and textural properties of honeys from North East part of Romania. Food Environ. Saf. 2016, 15, 234–239. [Google Scholar]
- Tomczyk, M.; Bocian, A.; Sidor, E.; Miłek, M.; Zaguła, G.; Dżugan, M. The Use of HPTLC and SDS-PAGE Methods for Coniferous Honeydew Honey Fingerprinting Compiled with Mineral Content and Antioxidant Activity. Molecules 2022, 27, 720. [Google Scholar] [CrossRef]
- Scripcă, L.A.; Amariei, S. The Influence of Chemical Contaminants on the Physicochemi-cal Properties of Unifloral and Multifloral Honey. Foods 2021, 10, 1039. [Google Scholar] [CrossRef] [PubMed]
- Degirmenci, A.; Can, Z.; Boyraci, G.M.; Yildiz, O.; Asadov, E.; Kolayli, S. Honeys from some different regions of Azerbaijan: Bioactive characteristics based on phenolic profile and antioxidant activity. J. Apic. Res. 2020, 59, 390–397. [Google Scholar] [CrossRef]
- Barbeş, L.; Bărbulescu, A.; Stanciu, G.; Rotariu, R. Mineral analysis of different bee products by Flame Atomic Absorption spectrometry. Rom. J. Phys. 2021, 66, 802. [Google Scholar]
- Lanjwani, M.F.; Channa, F.A. Minerals content in different types of local and branded honey in Sindh, Pakistan. Heliyon 2019, 5, E02042. [Google Scholar] [CrossRef]
- Tudoreanu, L.; Codreanu, M.D.; Crivineanu, V.; Goran, G.V. The Quality of Romanian Honey Varieties-Mineral Content and Textural Properties. Bull. Univ. Agric. Sci. Vet. Med. Cluj Napoca Vet. Med. 2012, 69, 1–2. [Google Scholar] [CrossRef] [PubMed]
- Tesileanu, R.; Fedorca, M. Solurile Afectate de Saruri din România: Concepte de Baza și Stare Actuala. 2016. Available online: https://www.researchgate.net/publication/294855962_Solurile_afectate_de_saruri_din_Romania_concepte_de_bazasi_stare_actuala (accessed on 4 February 2019).
- Oroian, M.; Prisacaru, A.; Hretcanu, E.C.; Stroe, S.-G.; Leahu, A.; Buculei, A. Heavy metals profile in honey as a potential indicator of botanical and geographical origin. Inter. J. Food Proper. 2016, 19, 1825–1836. [Google Scholar] [CrossRef]
- Ciobanu, O.; Rădulescu, H. Monitoring of heavy metals residues in honey. Res. J. Agric. Sci. 2016, 48, 9–13. [Google Scholar]
- Kacaniová, M.; Knazovicka, V.; Melich, M.; Fikselova, M.; Massanyi, P.; Stawarz, R.; Hascik, P.; Pechociak, T.; Kuczkowska, A.; Putała, A. Environmental concentration of selected elements and relation to physicochemical parameters in honey. J. Environ. Sci. Health Part A 2009, 44, 414–422. [Google Scholar] [CrossRef]
- Mititelu, M.; Udeanu, D.I.; Nedelescu, M.; Neacsu, S.M.; Nicoara, A.C.; Oprea, E.; Ghica, M. Quality Control of Different Types of Honey and Propolis Collected from Romanian Accredited Beekeepers and Consumer’s Risk Assessment. Crystals 2022, 12, 87. [Google Scholar] [CrossRef]
- Ligor, M.; Kowalkowski, T.; Buszewski, B. Comparative Study of the Potentially Toxic Elements and Essential Microelements in Honey Depending on the Geographic Origin. Molecules 2022, 27, 5474. [Google Scholar] [CrossRef]
- Bartha, S.; Taut, I.; Goji, G.; Vlad, I.A.; Dinulică, F. Heavy Metal Content in PolyfloralHoney and Potential Health Risk. A Case Study of Copșa Mică, Romania. Int. J. Environ. Res. Public Health 2020, 17, 1507. [Google Scholar] [CrossRef] [PubMed]
- Altunatmazi, S.S.; Tarhan, D.; Aksu, F.; Ozsobaci, N.P.; Mehmet, E.O.; Barutçu, U.B. Levels of Chromium, Copper, Iron, Magnesium, Manganese, Selenium, Zinc, Cadmium, Lead and Aluminium of honey varieties produced in Turkey. Food Sci. Technol. 2019, 39, 392–397. [Google Scholar] [CrossRef]
- Dżugan, M.; Zaguła, G.; Wesołowska, M.; Sowa, P.; Puchalski, C.Z. Levels of toxic and essential metals in varietal honeys from Podkarpacie. J. Elem. 2017, 22, 1039–1048. [Google Scholar] [CrossRef]
- Gok, S.; Severcan, M.; Goormaghtigh, E.; Kandemir, I.; Severcan, F. Differentiation of Anatolian honey samples from different botanical origins by ATR-FTIR spectroscopy using multivariate analysis. Food Chem. 2015, 170, 234–240. [Google Scholar] [CrossRef] [PubMed]
- David, M.; Hategan, A.R.; Magdas, D.A.; Berghian-Grosan, C.; Simionescu, B. Botanical Origin Assessment of Honey Based on ATR-IR Spectroscopy: A Comparison between the Efficiency of Supervised Statistical Methods and Artificial Intelligence. Appl. Sci. 2022, 12, 9645. [Google Scholar] [CrossRef]
- Aykas, D.P. Determination of Possible Adulteration and Quality Assessment in Commercial Honey. Foods 2023, 12, 523. [Google Scholar] [CrossRef]
- Karabagias, I.K.; Badeka, A.; Kontakos, S.; Karabournioti, S.; Kontominas, M.G. Characterisation and classification of Greek pine honeys according to their geographical origin based on volatiles, physicochemical parameters and chemometrics. Food Chem. 2014, 146, 548–557. [Google Scholar] [CrossRef]
- Uçar, M.; Kemal, M.; Kanbur, E.D.; Kara, Y.; Özcelik, A.E.; Kolaylı, S. The botanical, physicochemical, and biochemical characteristics of Northern Cyprus honeys. Eur. Food Res. Technol. 2023, 249, 1531–1541. [Google Scholar] [CrossRef]
- Sant’Ana, L.D.; Ferreira, A.B.; Lorenzon, M.C.A.; Berbara, R.L.L.; Castro, R.N. Correlation of total phenolic and flavonoid contents of Brazilian honeys with color and antioxidant capacity. Int. J. Food Prop. 2014, 17, 65–76. [Google Scholar] [CrossRef]
- Cabrera, M.; Perez, M.; Gallez, L.; Andrada, A.; Balbarrey, G. Colour, Antioxidant Capacity, Phenolic and Flavonoid Content of Honey from the Humid Chaco Region, Argentina. Rev. Int. Bot. Exp. 2017, 86, 124–130. [Google Scholar]
- Rebiai, A.; Lanez, T.; Chouikh, A. Physicochemical and Biochemical Properties of Honey Bee Products in South Algeria. Sci. Study Res. Chem. Chem. Eng. Biotechnol. Food Ind. 2015, 16, 133–142. [Google Scholar]
- Kavanagh, S.; Gunnoo, J.; Marques, P.T.; Stout, J.C.; White, B. Physicochemical Properties and Phenolic Content of Honey from Different Floral Origins and from Rural versus Urban Landscapes. Food Chem. 2019, 272, 66–75. [Google Scholar] [CrossRef] [PubMed]
- Daci-Ajvazi, M.; Mehmeti, A.; Zeneli, L.; Daci, N. Evaluation of Antioxidant Activity, Heavy Metals and Colour Intensity of Honeys from Different Parts of Kosovo. J. Environ. Prot. Ecol. 2017, 18, 737–748. [Google Scholar]
- Anand, S.; Pang, E.; Livanos, G.; Mantri, N. Characterization of Physico-Chemical Properties and Antioxidant Capacities of Bioactive Honey Produced from Australian Grown Agastache rugosa and its Correlation with Colour and Poly-Phenol Content. Molecules 2018, 23, 108. [Google Scholar] [CrossRef]


| Family | Sample | ||||||||||||||
|---|---|---|---|---|---|---|---|---|---|---|---|---|---|---|---|
| Area 1 | Area 2 | ||||||||||||||
| S1 | S2 | S3 | S4 | S5 | S10 | S11 | S13 | S14 | S6 | S7 | S8 | S9 | S12 | S15 | |
| Apiaceae | IMP | MP | IMP | IMP | IMP | IMP | IMP | IMP | IMP | IMP | IMP | IMP | IMP | IMP | IMP |
| Asteraceae | IMP | IMP | SP | SP | SP | IMP | IMP | SP | IMP | SP | SP | IMP | SP | IMP | SP |
| Boraginaceae | - | - | - | - | - | - | - | - | - | - | MP | - | MP | - | IMP |
| Brassicaceae | SP | SP | SP | SP | SP | SP | SP | SP | SP | SP | SP | SP | SP | SP | SP |
| Cyperaceae | - | IMP | IMP | - | - | - | - | - | - | MP | - | MP | - | MP | - |
| Fabaceae | IMP | SP | IMP | SP | SP | IMP | IMP | IMP | IMP | IMP | IMP | IMP | IMP | IMP | SP |
| Fagaceae | - | MP | MP | - | - | - | - | MP | - | - | - | - | - | - | - |
| Lamiaceae | MP | - | MP | MP | - | - | MP | - | - | - | MP | - | MP | MP | - |
| Malvaceae | SP | IMP | IMP | IMP | IMP | MP | IMP | SP | IMP | IMP | IMP | IMP | SP | IMP | IMP |
| Plantagigaceae | MP | MP | - | - | - | - | MP | MP | - | MP | - | - | - | MP | - |
| Poaceae | MP | MP | MP | MP | IMP | IMP | IMP | MP | IMP | MP | IMP | IMP | IMP | IMP | MP |
| Rosaceae | IMP | MP | MP | MP | IMP | SP | SP | - | SP | IMP | - | SP | - | SP | MP |
| Salicaceae | IMP | IMP | IMP | IMP | IMP | IMP | MP | MP | MP | IMP | SP | IMP | IMP | IMP | IMP |
| Parameter | Descriptive Statistics | Sample | ||||||||
|---|---|---|---|---|---|---|---|---|---|---|
| S1 | S2 | S3 | S4 | S5 | S10 | S11 | S13 | S14 | ||
| mm Pfund | Min-Max | 59.0–60.1 | 24.1–25.6 | 55.3–57.1 | 48.2–50.4 | 69.0–70.5 | 40.4–41.9 | 30.4–31.4 | 24.4–25.9 | 44.0–45.6 |
| Mean ± SD | 59.4 ± 0.4 | 24.8 ± 0.5 | 56.2 ± 0.6 | 48.9 ± 0.7 | 69.7 ± 0.5 | 41.2 ± 0.5 | 30.9 ± 0.3 | 25.2 ± 0.5 | 44.9 ± 0.5 | |
| CV | 0.7 | 1.9 | 1.0 | 1.4 | 0.7 | 1.3 | 1.1 | 2.0 | 1.1 | |
| RI | Min-Max | 1.495–1.496 | 1.493–1.494 | 1.491–1.492 | 1.488–1.489 | 1.488–1.489 | 1.488–1.489 | 1.492–1.493 | 1.491–1.490 | 1.493–1.494 |
| Mean ± SD | 1.496 ± 0.00 | 1.493 ± 0.00 | 1.492 ± 0.00 | 1.488 ± 0.00 | 1.490 ± 0.00 | 1.490 ± 0.00 | 1.492 ± 0.00 | 1.491 ± 0.00 | 1.494 ± 0.00 | |
| CV | 0.01 | 0.01 | 0.01 | 0.01 | 0.01 | 0.01 | 0.02 | 0.01 | 0.01 | |
| M % | Min-Max | 16.3–16.5 | 17.4–17.5 | 17.9–18.0 | 19.2–19.4 | 19.1–19.2 | 19.0–19.2 | 17.5–17.8 | 18.0–18.2 | 17.0–17.2 |
| Mean ± SD | 16.4 ± 0.07 | 17.4 ± 0.04 | 18.0 ± 0.04 | 19.3 ± 0.06 | 19.1 ± 0.05 | 19.2 ± 0.06 | 17.6 ± 0.09 | 18.1 ± 0.05 | 17.1 ± 0.05 | |
| CV | 0.43 | 0.21 | 0.22 | 0.29 | 0.28 | 0.33 | 0.51 | 0.28 | 0.29 | |
| TSS °Brix | Min-Max | 82.0–82.2 | 81.0–81.1 | 80.5–80.6 | 79.1–79.3 | 79.4–79.5 | 79.3–79.5 | 80.7–81.0 | 80.2–80.5 | 81.3–81.4 |
| Mean ± SD | 82.1 ± 0.07 | 81.0 ± 0.03 | 80.6 ± 0.04 | 79.2 ± 0.06 | 79.4 ± 0.05 | 79.4 ± 0.06 | 80.9 ± 0.09 | 80.4 ± 0.05 | 81.4 ± 0.06 | |
| CV | 0.08 | 0.04 | 0.05 | 0.07 | 0.07 | 0.08 | 0.11 | 0.06 | 0.07 | |
| SG g/cm3 | Min-Max | 1.440–1.442 | 1.434–1.435 | 1.431–1.432 | 1.421–1.422 | 1.423–1.424 | 1.422–1.424 | 1.432–1.434 | 1.429–1.430 | 1.436–1.437 |
| Mean ± SD | 1.441 ± 0.00 | 1.434 ± 0.00 | 1.431 ± 0.00 | 1.421 ± 0.01 | 1.423 ± 0.00 | 1.423 ± 0.00 | 1.433 ± 0.00 | 1.430 ± 0.00 | 1.436 ± 0.00 | |
| CV | 0.03 | 0.01 | 0.02 | 0.03 | 0.03 | 0.03 | 0.04 | 0.02 | 0.03 | |
| Parameter | Descriptive Statistics | Sample | |||||
|---|---|---|---|---|---|---|---|
| S6 | S7 | S8 | S9 | S12 | S15 | ||
| mm Pfund | Min-Max | 46.3–48.2 | 25.2–26.3 | 63.4–65.3 | 42.3–43.4 | 47.6–48.6 | 13.8–15.0 |
| Mean ± SD | 47.5 ± 0.64 | 25.8 ± 0.42 | 64.5 ± 0.53 | 42.9 ± 0.33 | 48.0 ± 0.34 | 14.5 ± 0.41 | |
| CV | 1.36 | 1.63 | 0.81 | 0.77 | 0.71 | 2.87 | |
| RI | Min-Max | 1.494–1.495 | 1.494–1.495 | 1.491–1.492 | 1.487–1.488 | 1.494–1.495 | 1.493–1.494 |
| Mean ± SD | 1.495 ± 0.00 | 1.495 ± 0.00 | 1.492 ± 0.00 | 1.488 ± 0.00 | 1.495 ± 0.00 | 1.494 ± 0.00 | |
| CV | 0.01 | 0.01 | 0.01 | 0.02 | 0.02 | 0.01 | |
| M % | Min-Max | 16.6–16.8 | 16.8–16.9 | 17.9–18.0 | 19.4–19.6 | 16.6–16.9 | 17.0–17.1 |
| Mean ± SD | 16.7 ± 0.06 | 16.8 ± 0.05 | 18.0 ± 0.06 | 19.5 ± 0.09 | 16.7 ± 0.09 | 17.1 ± 0.03 | |
| CV | 0.38 | 0.29 | 0.33 | 0.46 | 0.56 | 0.20 | |
| TSS °Brix | Min-Max | 81.7–81.9 | 81.6–81.7 | 80.5–80.7 | 79.0–79.2 | 81.6–81.9 | 81.4–81.5 |
| Mean ± SD | 81.8 ± 0.06 | 81.7 ± 0.04 | 80.6 ± 0.06 | 79.0 ± 0.09 | 81.8 ± 0.09 | 81.4 ± 0.03 | |
| CV | 0.07 | 0.05 | 0.07 | 0.11 | 0.11 | 0.04 | |
| SG g/cm3 | Min-Max | 1.438–1.440 | 1.438–1.439 | 1.431–1.432 | 1.420–1.421 | 1.438–1.440 | 1.436–1.437 |
| Mean ± SD | 1.439 ± 0.00 | 1.438 ± 0.00 | 1.431 ± 0.00 | 1.420 ± 0.00 | 1.423 ± 0.00 | 1.436 ± 0.00 | |
| CV | 0.03 | 0.02 | 0.03 | 0.04 | 0.05 | 0.02 | |
| Parameter | Descriptive Statistics | Sample | ||||||||
|---|---|---|---|---|---|---|---|---|---|---|
| S1 | S2 | S3 | S4 | S5 | S10 | S11 | S13 | S14 | ||
| pH | Min-Max | 4.26–4.27 | 5.01–5.02 | 3.73–3.74 | 4.24–4.25 | 3.85–3.86 | 3.78–3.79 | 3.58–3.59 | 4.07–4.08 | 3.75–3.76 |
| Mean ± SD | 4.26 ± 0.0 | 5.02 ± 0.00 | 3.74 ± 0.0 | 4.25 ± 0.0 | 3.86 ± 0.0 | 3.79 ± 0.0 | 3.58 ± 0.0 | 4.08 ± 0.0 | 3.76 ± 0.0 | |
| CV | 0.03 | 0.02 | 0.02 | 0.02 | 0.03 | 0.08 | 0.09 | 0.07 | 0.07 | |
| FA meq kg−1 | Min-Max | 47.9–48.3 | 28.5–28.8 | 39.9–40.5 | 38.5–39.0 | 49.4–50.6 | 34.3–34.9 | 43.2–43.9 | 42.4–42.9 | 23.7–24.4 |
| Mean ± SD | 48.1 ± 0.14 | 28.7 ± 0.10 | 40.3 ± 0.19 | 38.8 ± 0.16 | 49.9 ± 0.40 | 34.7 ± 0.18 | 43.6 ± 0.22 | 42.7 ± 0.17 | 24.1 ± 0.21 | |
| CV | 0.29 | 0.35 | 0.46 | 0.42 | 0.80 | 0.52 | 0.50 | 0.41 | 0.89 | |
| Ash % | Min-Max | 0.211–0.300 | 0.436–0.515 | 0.201–0.281 | 0.125–0.191 | 0.258–0.384 | 0.128–0.144 | 0.092–0.105 | 0.224–0.314 | 0.160–0.185 |
| Mean ± SD | 0.233 ± 0.03 | 0.484 ± 0.03 | 0.241 ± 0.03 | 0.155 ± 0.02 | 0.325 ± 0.05 | 0.133 ± 0.01 | 0.099 ± 0.00 | 0.280 ± 0.03 | 0.176 ± 0.01 | |
| CV | 11.60 | 5.36 | 11.49 | 13.99 | 13.97 | 6.08 | 4.20 | 9.59 | 4.48 | |
| EC mS cm−1 | Min-Max | 0.537–0.539 | 0.735–0.736 | 0.295–0.297 | 0.399–0.401 | 0.503–0.504 | 0.302–0.305 | 0.318–0.319 | 0.498–0.499 | 0.496–0.497 |
| Mean ± SD | 0.538 ± 0.00 | 0.736 ± 0.00 | 0.296 ± 0.00 | 0.400 ± 0.00 | 0.504 ± 0.00 | 0.304 ± 0.00 | 0.318 ± 0.00 | 0.499 ± 0.00 | 0.496 ± 0.00 | |
| CV | 0.16 | 0.10 | 0.24 | 0.21 | 0.10 | 0.29 | 0.17 | 0.11 | 0.11 | |
| TPC mg GAE/100g | Min-Max | 34.43–35.44 | 28.06–29.26 | 30.91–32.56 | 23.66–24.37 | 38.83–40.34 | 30.86–31.67 | 32.58–33.41 | 28.40–29.84 | 32.89–34.87 |
| Mean ± SD | 34.86 ± 0.35 | 28.63 ± 0.38 | 31.73 ± 0.71 | 24.05 ± 0.26 | 39.54 ± 0.47 | 31.23 ± 0.27 | 33.03 ± 0.31 | 29.02 ± 0.47 | 33.93 ± 0.70 | |
| CV | 1.00 | 1.33 | 2.22 | 1.08 | 1.20 | 0.86 | 0.95 | 1.62 | 2.05 | |
| TFC mg QE/100g | Min-Max | 2.38–2.85 | 1.69–2.04 | 2.26–2.74 | 1.99–2.35 | 2.60–3.01 | 1.67–2.17 | 1.75–2.10 | 1.64–1.97 | 2.18–2.78 |
| Mean ± SD | 2.63 ± 0.16 | 1.92 ± 0.11 | 2.51 ± 0.16 | 2.18 ± 0.13 | 2.75 ± 0.13 | 1.97 ± 0.16 | 1.97 ± 0.11 | 1.77 ± 0.10 | 2.41 ± 0.18 | |
| CV | 5.98 | 5.86 | 6.29 | 6.06 | 4.56 | 7.92 | 5.75 | 5.74 | 7.47 | |
| Parameter | Descriptive Statistics | Sample | |||||
|---|---|---|---|---|---|---|---|
| S6 | S7 | S8 | S9 | S12 | S15 | ||
| pH | Min-Max | 3.84–3.85 | 3.94–3.95 | 4.04–4.05 | 3.77–3.78 | 3.88–3.89 | 3.92–3.93 |
| Mean ± SD | 3.84 ± 0.00 | 3.95 ± 0.00 | 4.05 ± 0.00 | 3.78 ± 0.00 | 3.88 ± 0.00 | 3.92 ± 0.00 | |
| CV | 0.03 | 0.02 | 0.02 | 0.07 | 0.09 | 0.03 | |
| FA meq kg−1 | Min-Max | 49.4–50.0 | 47.6–48.0 | 41.5–41.7 | 20.7–21.4 | 46.3–47.1 | 18.9–19.4 |
| Mean ± SD | 49.7 ± 0.21 | 47.8 ± 0.14 | 41.6 ± 0.09 | 21.0 ± 0.22 | 46.8 ± 0.23 | 19.1 ± 0.19 | |
| CV | 0.42 | 0.29 | 0.21 | 1.07 | 0.50 | 0.10 | |
| Ash % | Min-Max | 0.177–0.261 | 0.062–0.089 | 0.190–0.214 | 0.111–0.132 | 0.146–0.158 | 0.061–0.078 |
| Mean ± SD | 0.216 ± 0.03 | 0.079 ± 0.01 | 0.201 ± 0.01 | 0.121 ± 0.01 | 0.152 ± 0.00 | 0.070 ± 0.01 | |
| CV | 12.98 | 11.74 | 4.02 | 5.09 | 2.76 | 7.46 | |
| EC mS cm−1 | Min-Max | 0.485–0.486 | 0.208–0.209 | 0.510–0.511 | 0.300–0.302 | 0.418–0.419 | 0.168–0.170 |
| Mean ± SD | 0.486 ± 0.00 | 0.209 ± 0.00 | 0.511 ± 0.00 | 0.301 ± 0.00 | 0.419 ± 0.00 | 0.169 ± 0.00 | |
| CV | 0.10 | 0.21 | 0.10 | 0.24 | 0.13 | 0.42 | |
| TPC mg GAE/100g | Min-Max | 26.37–27.78 | 25.73–26.73 | 27.96–29.07 | 29.88–31.41 | 26.67–27.84 | 22.78–23.65 |
| Mean ± SD | 26.88 ± 0.0.48 | 26.22 ± 0.34 | 28.65 ± 0.35 | 30.43 ± 0.73 | 27.24 ± 0.42 | 23.18 ± 0.31 | |
| CV | 1.77 | 1.31 | 1.21 | 2.38 | 1.53 | 1.33 | |
| TFC mg QE/100g | Min-Max | 2.27–2.84 | 1.08–1.61 | 1.87–2.11 | 1.94–2.34 | 2.05–2.44 | 1.36–1.85 |
| Mean ± SD | 2.57 ± 0.19 | 1.28 ± 0.15 | 2.00 ± 0.08 | 2.11 ± 0.12 | 2.28 ± 0.13 | 1.60 ± 0.16 | |
| CV | 7.26 | 11.72 | 4.00 | 5.68 | 5.60 | 10.08 | |
| Parameter | Descriptive Statistics | Sample | ||||||||
|---|---|---|---|---|---|---|---|---|---|---|
| S1 | S2 | S3 | S4 | S5 | S10 | S11 | S13 | S14 | ||
| K | Mean ± SD CV | 818.6 ± 4.06 | 1212.6 ± 18.68 | 110.6 ± 1.63 | 112.3 ± 1.76 | 403.9 ± 2.07 | 210.1 ± 2.09 | 354.1 ± 1.50 | 486.9 ± 2.99 | 415.7 ± 2.58 |
| 0.50 | 1.54 | 1.48 | 1.56 | 0.51 | 1.00 | 0.42 | 0.61 | 0.62 | ||
| Ca | Mean ± SD CV | 116.1 ± 2.70 | 88.9 ± 3.52 | 141.2 ± 1.27 | 199.9 ± 1.39 | 46.5 ± 1.93 | 99.4 ± 1.97 | 102.5 ± 1.39 | 164.4 ± 2.14 | 195.3 ± 1.92 |
| 2.33 | 3.96 | 0.90 | 0.70 | 4.15 | 1.98 | 1.36 | 1.30 | 0.99 | ||
| Mg | Mean ± SD CV | 64.1 ± 2.85 | 43.6 ± 1.73 | 40.3 ± 1.83 | 44.9 ± 1.55 | 61.2 ± 1.55 | 40.0 ± 1.54 | 35.8 ± 1.83 | 56.9 ± 1.89 | 58.7 ± 1.31 |
| 4.44 | 3.97 | 4.56 | 3.44 | 2.53 | 3.86 | 5.11 | 3.33 | 2.22 | ||
| Na | Mean ± SD CV | 144.5 ± 3.61 | 279.8 ± 5.39 | 113.2 ± 1.46 | 302.3 ± 1.71 | 139.6 ± 1.73 | 221.7 ± 1.59 | 112.1 ± 1.71 | 75.3 ± 1.78 | 100.7 ± 1.98 |
| 2.50 | 1.93 | 1.29 | 0.57 | 1.24 | 0.72 | 1.53 | 2.36 | 1.97 | ||
| P | Mean ± SD CV | 61.9 ± 1.39 | 54.6 ± 1.28 | 46.9 ± 0.87 | 31.8 ± 1.45 | 85.5 ± 1.83 | 51.3 ± 2.06 | 42.8 ± 1.17 | 44.3 ± 1.94 | 58.3 ± 1.83 |
| 2.25 | 2.34 | 1.86 | 4.55 | 2.14 | 4.02 | 2.72 | 4.39 | 3.13 | ||
| Zn | Mean ± SD CV | 1.33 ± 0.03 | 2.87 ± 0.03 | 4.85 ± 0.03 | 6.19 ± 0.18 | 5.11 ± 0.10 | 1.58 ± 0.08 | 0.76 ± 0.07 | 5.69 ± 0.09 | 4.66 ± 0.07 |
| 2.10 | 1.22 | 0.71 | 2.83 | 2.02 | 5.01 | 9.23 | 1.58 | 1.53 | ||
| Cu | Mean ± SD CV | 1.01 ± 0.01 | 0.96 ± 0.02 | 1.08 ± 0.04 | 1.30 ± 0.09 | 1.12 ± 0.11 | 1.82 ± 0.07 | 1.49 ± 0.08 | 1.99 ± 0.08 | 1.61 ± 0.08 |
| 1.42 | 2.33 | 3.97 | 6.61 | 9.58 | 4.09 | 5.66 | 4.18 | 5.23 | ||
| Mn | Mean ± SD CV | 0.43 ± 0.01 | 0.77 ± 0.02 | 0.27 ± 0.02 | 0.53 ± 0.04 | 4.31 ± 0.15 | 1.17 ± 0.09 | 0.43 ± 0.03 | 1.62 ± 0.0 | 0.51 ± 0.04 |
| 3.17 | 3.16 | 7.52 | 7.48 | 3.51 | 7.67 | 8.09 | 3.39 | 7.83 | ||
| Ni | Mean ± SD | <LOD | <LOD | <LOD | <LOD | <LOD | <LOD | <LOD | <LOD | <LOD |
| CV | ||||||||||
| Co | Mean ± SD CV | <LOD | <LOD | <LOD | <LOD | <LOD | <LOD | <LOD | <LOD | <LOD |
| Pb | Mean ± SD CV | <LOD | <LOD | <LOD | <LOD | <LOD | <LOD | <LOD | <LOD | <LOD |
| Parameter | Descriptive Statistics | Sample | |||||
|---|---|---|---|---|---|---|---|
| S6 | S7 | S8 | S9 | S12 | S15 | ||
| K | Mean ± SD CV | 471.5 ± 1.89 | 150.0 ± 1.76 | 639.8 ± 1.64 | 224.5 ± 2.12 | 424.4 ± 4.74 | 101.4 ± 1.83 |
| 0.40 | 1.17 | 0.26 | 0.95 | 1.12 | 1.81 | ||
| Ca | Mean ± SD CV | 225.5 ± 1.58 | 92.5 ± 0.89 | 230.9 ± 1.93 | 78.7 ± 1.96 | 120.6 ± 2.68 | 41.8 ± 1.37 |
| 0.70 | 0.96 | 0.84 | 2.49 | 2.22 | 3.29 | ||
| Mg | Mean ± SD CV | 65.5 ± 1.91 | 60.5 ± 1.77 | 56.6 ± 1.23 | 37.7 ± 1.43 | 48.4 ± 1.54 | 32.7 ± 1.45 |
| 2.92 | 2.92 | 2.18 | 3.79 | 3.18 | 4.43 | ||
| Na | Mean ± SD CV | 94.8 ± 2.12 | 40.7 ± 1.91 | 165.2 ± 1.44 | 241.1 ± 2.12 | 178.6 ± 1.12 | 84.6 ± 1.86 |
| 2.24 | 4.70 | 0.87 | 0.88 | 0.63 | 2.20 | ||
| P | Mean ± SD CV | 63.9 ± 2.40 | 36.5 ± 1.13 | 67.3 ± 1.66 | 39.4 ± 1.25 | 60.8 ± 1.88 | 28.6 ± 1.62 |
| 3.75 | 3.10 | 2.47 | 3.16 | 3.10 | 5.66 | ||
| Zn | Mean ± SD CV | 7.23 ± 0.16 | 6.18 ± 0.14 | 13.66 ± 0.18 | 4.44 ± 0.10 | 1.54 ± 0.08 | 4.97 ± 0.10 |
| 2.21 | 2.30 | 1.32 | 2.23 | 5.49 | 1.96 | ||
| Cu | Mean ± SD CV | 2.18 ± 0.13 | 0.77 ± 0.07 | 1.99 ± 0.08 | 2.12 ± 0.09 | 0.76 ± 0.07 | 1.49 ± 0.04 |
| 5.99 | 8.95 | 4.05 | 4.38 | 8.80 | 2.93 | ||
| Ni | Mean ± SD CV | <LOD | 0.10 ± 0.01 12.04 | <LOD | <LOD | <LOD | <LOD |
| Co | Mean ± SD CV | <LOD | <LOD | <LOD | <LOD | <LOD | <LOD |
| Pb | Mean ± SD CV | <LOD | 0.05 ± 0.01 | <LOD | 0.01 ± 0.00 | <LOD | <LOD |
| 14.29 | 5.17 | ||||||
| Sample | Spectral domains | ||||
| D1 3500–3100 cm−1 | D2 3000–2800 cm−1 | D3 1700–1600 cm−1 | D4 1540–1175 cm−1 | D5 1175–940 cm−1 | |
| assigned to O–H stretching (carboxylic acids) and NH3 stretching (free amino acids). | assigned to: C–H stretching (carbohydrates). | C=O stretching (mainly from carbohydrates) and N–H bending of amide I (mainly proteins). O–H stretching/bending (water) and N–H bending of amide I (mainly proteins), C=C | assigned to O–H stretching/bending, C–O stretching (carbohydrates), C–H stretching (carbohydrates), and C=O stretching of ketones | assigned to C–O, C–C stretching (carbohydrates), and ring vibrations (mainly from carbohydrates). | |
| 1 | 3414 | 2931; 2882 | 1643 | 1538; 1416; 1384, 1257 | 1055; 919 |
| 2 | 3392 | 2932; 2878 | 1644 | 1538, 1415; 1384, 1257 | 1054; 920 |
| 3 | 3396 | 2932, 2878 | 1644 | 1416; 1257; 1143 | 1056; 918 |
| 4 | 3409 | 2933; 2884 | 1644; | 1418; 1257; 1142 | 1057; 918 |
| 5 | 3413 | 2934; 2865 | 1644 | 1416; 1359, 1256, 1149, | 1057; 918 |
| 6 | 3375 | 2935; 2878 | 1641 | 1413; 1346; 1253; 1140 | 1056; 920 |
| 7 | 3440 | 2939; 2868 | 1645 | 1553; 1452; 1251;1148 | 1011; 918 |
| 8 | 3417 | 2936; 2876 | 1644 | 1451; 1414; 1250, 1149 | 1014; 920 |
| 9 | 3440 | 2921; 2853 | 1645 | 1555; 1453; 1239; 1143 | 1007; 926 |
| 10 | 3444 | 2920; 2870 | 1645 | 1531; 1453; 1227; 1146 | 1012; 925 |
| 11 | 3442 | 2923; 2865 | 1645 | 1554; 1453; 1234; 1165 | 1012; 924 |
| 12 | 3440 | 2925; 2854 | 1645 | 1554; 1452; 1385, 1140 | 1032; 919 |
| 13 | 3417 | 2925; 2859 | 1645 | 1555; 1454; 1241; 1136 | 1031; 978; 916 |
| 14 | 3415 | 2930; 2872 | 1645 | 1538; 1453, 1245, 1146 | 1051; 922 |
| 15 | 3504 | 2934; 2878 | 1647 | 1415; 1259; 1146 | 1083; 919 |
| mm Pfund | RI | M | TSS | EC | SG | pH | FA | Ash | TPC | TFC | K | Ca | Mg | Na | P | Zn | Cu | Mn | |
|---|---|---|---|---|---|---|---|---|---|---|---|---|---|---|---|---|---|---|---|
| mm Pfund | 1.00 | ||||||||||||||||||
| RI | −0.21 * | 1.00 | |||||||||||||||||
| M | 0.23 ** | −1.00 *** | 1.00 | ||||||||||||||||
| TSS | −0.21 * | 1.00 *** | −1.00 *** | 1.00 | |||||||||||||||
| EC | 0.30 *** | 0.11 | −0.12 | 0.12 | 1.00 | ||||||||||||||
| SG | −0.21 * | 1.00 *** | −1.00 *** | 1.00 *** | 0.13 | 1.00 | |||||||||||||
| pH | −0.17 * | 0.11 | −0.12 | 0.11 | 0.67 | 0.11 | 1.00 | ||||||||||||
| FA | 0.45 *** | 0.23 ** | −0.22 * | 0.23 ** | 0.18 * | 0.23 ** | −0.09 | 1.00 | |||||||||||
| Ash | 0.20 * | −0.00 | −0.01 | 0.01 | 0.85 *** | 0.02 | 0.70 *** | 0.14 | 1.00 | ||||||||||
| TPC | 0.55 *** | −0.18 * | 0.17 * | −0.17 * | 0.30 *** | −0.17 | −0.22 ** | 0.23 ** | 0.34 *** | 1.00 | |||||||||
| TFC | 0.75 *** | −0.05 | 0.05 | −0.05 | 0.40 *** | −0.04 | −0.13 | 0.27 *** | 0.35 *** | 0.57 *** | 1.00 | ||||||||
| K | 0.07 | 0.33 *** | −0.34 *** | 0.34 *** | 0.89 *** | 0.34 *** | 0.74 *** | 0.10 | 0.78 *** | 0.22 ** | 0.17 | 1.00 | |||||||
| Ca | 0.33 *** | 0.12 | −0.12 | 0.12 | 0.33 *** | 0.13 | −0.01 | 0.23 ** | 0.03 | −0.21 * | 0.22 * | 0.09 | 1.0000 | ||||||
| Mg | 0.43 *** | 0.37 *** | −0.36 *** | 0.36 *** | 0.46 *** | 0.36 *** | 0.09 | 0.60 *** | 0.29 *** | 0.28 *** | 0.33 *** | 0.32 *** | 0.42 *** | 1.00 | |||||
| Na | 0.18 * | −0.55 *** | 0.55 *** | −0.55 *** | 0.33 *** | −0.56 *** | 0.50 *** | −0.28 *** | 0.28 *** | −0.09 | 0.14 | 0.25 ** | 0.00 | −0.36 *** | 1.00 | ||||
| P | 0.71 *** | 0.08 | −0.07 | 0.08 | 0.61 *** | 0.09 | 0.02 | 0.46 *** | 0.51 *** | 0.65 *** | 0.64 *** | 0.48 *** | 0.14 * | 0.61 *** | −0.03 | 1.00 | |||
| Zn | 0.27 ** | −0.10 | 0.11 | −0.10 | 0.07 | −0.09 | 0.02 | 0.06 | −0.01 | −0.28 | −0.10 | −0.05 | 0.56 *** | 0.34 *** | −0.13 | 0.14 | 1.00 | ||
| Cu | −0.01 | −0.33 *** | 0.33 *** | −0.33 *** | −0.03 | −0.33 *** | −0.31 *** | −0.27 *** | −0.18 * | −0.07 | 0.01 | −0.12 | 0.41 *** | −0.01 | −0.02 | −0.02 | 0.40 *** | 1.00 | |
| Mn | 0.33 *** | −0.40 *** | 0.41 *** | −0.40 *** | 0.21 * | −0.41 *** | −0.08 | 0.28 *** | 0.34 *** | 0.51 *** | 0.30 *** | 0.02 | −0.30 *** | 0.35 *** | −0.07 | 0.55 *** | 0.12 | 0.10 | 1.00 |
| Variable | PC 1 | PC 2 | PC 3 | PC 4 | PC 5 | PC 6 |
|---|---|---|---|---|---|---|
| mm Pfund | −0.22 | 0.84 | 0.02 | 0.29 | 0.03 | 0.27 |
| RI | 0.99 | −0.04 | 0.08 | 0.00 | −0.06 | 0.10 |
| M | −0.99 | 0.05 | −0.09 | 0.01 | 0.07 | −0.09 |
| TSS | 0.99 | −0.04 | 0.08 | 0.00 | −0.07 | 0.09 |
| EC | 0.08 | 0.35 | 0.89 | 0.17 | 0.06 | −0.04 |
| SG | 0.99 | −0.04 | 0.09 | 0.00 | −0.06 | 0.09 |
| pH | −0.01 | −0.30 | 0.90 | 0.00 | −0.16 | 0.19 |
| FA | 0.22 | 0.37 | −0.03 | 0.25 | 0.29 | 0.68 |
| Ash | −0.04 | 0.22 | 0.88 | −0.05 | 0.20 | 0.05 |
| TPC | −0.10 | 0.73 | 0.09 | −0.34 | 0.43 | −0.08 |
| TFC | −0.03 | 0.91 | 0.12 | 0.00 | −0.05 | 0.01 |
| K | 0.28 | 0.15 | 0.91 | −0.02 | 0.03 | −0.07 |
| Ca | 0.13 | 0.25 | 0.06 | 0.85 | −0.31 | −0.08 |
| Mg | 0.38 | 0.37 | 0.22 | 0.49 | 0.44 | 0.26 |
| Na | −0.65 | 0.06 | 0.46 | −0.09 | −0.52 | 0.05 |
| P | 0.09 | 0.73 | 0.36 | 0.13 | 0.44 | 0.09 |
| Zn | −0.11 | −0.12 | 0.01 | 0.87 | 0.18 | −0.01 |
| Cu | −0.24 | 0.03 | −0.15 | 0.50 | 0.11 | −0.74 |
| Mn | −0.38 | 0.26 | 0.12 | −0.03 | 0.83 | 0.09 |
| Eigenvalue | 5.24 | 4.77 | 2.91 | 2.17 | 1.22 | 1.01 |
| % Total variance | 27.59 | 25.12 | 15.32 | 11.40 | 6.41 | 5.30 |
| Cumulative % | 27.59 | 52.71 | 68.03 | 79.43 | 85.84 | 91.14 |
Disclaimer/Publisher’s Note: The statements, opinions and data contained in all publications are solely those of the individual author(s) and contributor(s) and not of MDPI and/or the editor(s). MDPI and/or the editor(s) disclaim responsibility for any injury to people or property resulting from any ideas, methods, instructions or products referred to in the content. |
© 2023 by the authors. Licensee MDPI, Basel, Switzerland. This article is an open access article distributed under the terms and conditions of the Creative Commons Attribution (CC BY) license (https://creativecommons.org/licenses/by/4.0/).
Share and Cite
Albu, A.; Simeanu, C.; Pop, I.M.; Pui, A.; Tarcău, D.; Cucu-Man, S.-M. Selected Characteristics of Multifloral Honeys from North-Eastern Romania. Agriculture 2024, 14, 26. https://doi.org/10.3390/agriculture14010026
Albu A, Simeanu C, Pop IM, Pui A, Tarcău D, Cucu-Man S-M. Selected Characteristics of Multifloral Honeys from North-Eastern Romania. Agriculture. 2024; 14(1):26. https://doi.org/10.3390/agriculture14010026
Chicago/Turabian StyleAlbu, Aida, Cristina Simeanu, Ioan Mircea Pop, Aurel Pui, Doina Tarcău, and Simona-Maria Cucu-Man. 2024. "Selected Characteristics of Multifloral Honeys from North-Eastern Romania" Agriculture 14, no. 1: 26. https://doi.org/10.3390/agriculture14010026
APA StyleAlbu, A., Simeanu, C., Pop, I. M., Pui, A., Tarcău, D., & Cucu-Man, S.-M. (2024). Selected Characteristics of Multifloral Honeys from North-Eastern Romania. Agriculture, 14(1), 26. https://doi.org/10.3390/agriculture14010026