Article

Impact of Biochar Dose and Origin on Winter Wheat Grain Quality and Quantity

by
Marta Wyzińska
*,
Adam Kleofas Berbeć
and
Jerzy Grabiński
Institute of Soil Science and Plant Cultivation-State Research Institute, 24-100 Pulawy, Poland
*
Author to whom correspondence should be addressed.
Agriculture 2024, 14(1), 39; https://doi.org/10.3390/agriculture14010039
Submission received: 14 November 2023 / Revised: 12 December 2023 / Accepted: 22 December 2023 / Published: 24 December 2023

Abstract

:
The agricultural application of biocarbons (biochar) derived from different biomass sources in the process of pyrolysis is a promising solution for crop productivity and quality, soil health improvement, and carbon sequestration. In a three-year study, the effects of low doses of biochar (1 t∙ha−1 and 3 t∙ha−1) of different origins on winter wheat grain quantity and quality were tested. Six different biochar types were used: biochar derived from wheat husk (WHB), (2) extracted medical plant biomass biochar (MPB), (3) wood chip biochar (WCB), (4) wood sawdust biochar (SB), (5) biochar made from straw of rye (RSB), and (6) meat and bone biochar (MBMB). Higher doses of biocarbon had a positive effect only on wet gluten content. The use of different types of biochar showed a significant impact on grain parameters; however, the results were different in different years of this study. Among the tested biochars, SB (Saw Dust biochar) showed rather good results for most of the parameters tested (the highest grain yield in 2018, the highest weight of 1000 g in 2019, the lowest wet gluten content and gluten index in 2020, the lowest falling number in 2019, and the highest Zellenys index in 2019). MBMB biochar was one of the highest yielders in 2018, had the highest wet gluten content in 2018, and the highest gluten index in 2019 and 2020; the lowest Zelleny’s sedimentation index in 2019; and one of the lowest in 2020. Those made SB and MBMB the most promising biochars tested in this study.

1. Introduction

The recent increase in the world’s population means that the demand for food is also increasing. This demand, depending on the scenario, will have to increase by 35% to 56% between 2010 and 2050 [1]. Some estimates indicate that food production between 2005 and 2050 will have to increase even more, even up to 70% by 2050 [2]. The total earth’s population is expected to reach 9.7 billion people in 2050 [3]. These projections are becoming realistic through the breeding of more productive and higher-yielding varieties, but also through agrotechnical advances and more efficient use of nutrients [4,5]. Another way to meet those growing demands is the introduction of products and substances that improve soil fertility and its properties, and thus soil productivity. One of the key aspects is defining soil properties: biological, physical, chemical, and microbiological. Thanks to such determinations, we can observe how agricultural activities affect the soil environment and ecosystem services provided by soil [6,7]. The impact of crop cultivation under intensive agriculture principles is rarely positive. Recently, one of the main issues and challenges of global agriculture has been coping with negative environmental impacts, such as the loss of soil organic matter (SOM) [8,9]. SOM is of unique importance for many biochemical processes, including climate change mitigation potential and agricultural water management. This is prompting a search for alternative sources of organic matter that can contribute to soil organic matter and humus concentration and thus improve soil fertility [10]. Significant changes in the quality and quantity of humus compounds can be caused by the addition of an external source of organic matter [11]. The challenge of increased sequestration of carbon in soil is also a challenge for the European Union’s (EU) policymakers, as reflected in recent programs and strategies, of which the European Green Deal [12] is of the greatest importance. In the European Union (EU), current legislation allows the legal use of biocarbon as a soil improver for agricultural purposes, including organic farming, according to specific criteria for contaminant content, including heavy metals and Polycyclic aromatic hydrocarbons (PAHs) [13].
One of the external sources of organic matter for soil is biochar (also known as biocarbon), which has been one of the leading research topics in Europe in recent years. Industries such as biocarbon generation, its modifications, and the manufacture of biocarbon-based products are developing rapidly. The International Biochar Initiative defines biocarbon as a fine-grained carbonate with a high organic carbon content and low degradability, obtained by pyrolysis of biomass and biodegradable wastes [14].
Biocarbon is primarily used as a measure in environmental protection and agriculture. It is a solid renewable fuel extracted from various types of biomass by pyrolysis [15]. The material from which biocarbon is produced can be diverse, and almost any biomass can be the substrate for biocarbon generation (energy crops, forestry waste, rapeseed straw, sunflowers, maize cobs, but also sewage sludge, organic waste, or manure) [16,17,18,19,20]. Biochar can enhance soil fertility by providing a habitat for microorganisms and beneficial bacteria. It acts as a porous structure, offering a refuge for soil microbes and promoting their activities. This microbial activity helps in nutrient cycling and improves the availability of essential nutrients to plants. Biochar has a high cation exchange capacity (CEC), meaning it can retain and exchange essential nutrients such as nitrogen, phosphorus, and potassium. This can lead to better nutrient availability for plant uptake and reduce nutrient leaching, promoting more efficient fertilizer use [21]. Moreover, biochar’s porous structure also improves water retention in soils. It can hold onto water during wet periods and release it during dry periods, helping to maintain more consistent moisture levels. Additionally, it improves drainage in clayey soils, preventing waterlogging and enhancing aeration. The water-holding potential of biochar is especially visible on coarse-textured soils [22]. Biochar can also help regulate and stabilize soil pH. It has a neutral to slightly alkaline pH, and when added to acidic soils, it can contribute to raising the pH, making the soil more suitable for a broader range of crops, and, again, contributing to nutrient availability for plants [23]. Some studies suggest that biochar can bind with heavy metals in the soil, reducing their availability for uptake by plants. This may be beneficial for grain quality by minimizing the accumulation of heavy metals in grains [24,25,26].
The above-mentioned properties of biocarbon indicate the great potential for the use of this material in cereal crop production. Among cereals in the European Union, wheat accounts for nearly 46% of grain production. It is also an important crop in Poland, as it takes first place in terms of its share in the sowing structure (28%). In the case of wheat, it is not only the volume of grain yield obtained that is important, but also its quality, which is determined by the requirements of the milling and baking industry [27].
The impact of biochar (biocarbon) on wheat yield can depend on various factors mentioned above, including the type of biochar used (determining the size of carbon particles and its chemical composition) and its application rate as main factors. The aim of this study was to determine the effect of the type (biochar origin) and dose of biocarbon on winter wheat yields and selected characteristics of the technological value of grain and flour.

2. Materials and Methods

In the three growing seasons of 2017/2018, 2018/2019, and 2019/2020, a two-factor pot experiment was conducted in six replicates at the Vegetation Experiment Hall of IUNG-PIB in Puławy, Poland. The first factor of the first order was the type of biochar (source material that was used during the pyrolysis process): (0) control object (no biochar added), (1) wheat husk biochar (WHB), (2) biochar made from extracted medical plant biomass (MPB), (3) wood chip biochar (WCB), (4) wood sawdust biochar (SB), (5) biochar made from rye straw (RSB), and (6) meat and bone biochar (MBMB). WHB and MPB biocarbons were market products with the appropriate certificates (certifying their quality and composition) purchased in Germany. WCB biocarbon was a market product purchased in Poland (it was available on the market at the time but is now discontinued). The other three biocarbons (SB, RSB, and MBMB) were produced for the purposes of this experiment by an external entity. Pyrolysis temperature and time, as well as the chemical composition of the tested bicarbons, are given in Table 1. Subjectively, according to this study authors, MBMB biocarbon was the most fine (smallest particle size). In contrast, the RSB biocarbon was characterized by the largest particles (fragments of charred stalks—straws were visible). Other biocarbons tested had medium particle sizes. Charred seed husks were visible in WHA biocarbon, while pieces of charred plants have been visible in MPB biocarbon. Accurate particle size measurements were not made under this study. The second factor of the experiment was the rate (dose) of biochar: (1) 1 t∙ha−1, (2) 3 t∙ha−1. The experiment was conducted in a completely randomized design, in Micherlich pots filled with 7 kg of soil. Soil was taken from a field where the crop rotation was 100% cereals. The soil for this study was taken from the top layer (0–30 cm) of Haplic Luvisol, made of clay. The content of selected elements in the soil was: total carbon—0.90%; organic carbon—0.78%; total N—0.10%; P2O5—27.7 mg∙100 g−1; K2O—28.2 mg∙100 g−1; pH—6.08. The soil for the experiments was taken after 3 years of research and stored frozen. The soil was replaced in each year of this study, and fertilizers and biocarbons were added in the same way in each year of this study. Thus, each year, the seeds were sown in new soil with the same physical and chemical parameters. Because of this design, it was impossible to track the addition of carbon over time, and the results of each year must be evaluated independently. The experimental plant was winter wheat, variety Hondia (10 plants per vase). Before filling the vases with soil, the appropriate type of biocarbon was added to the substrate along with the relevant fertilizers and then mixed with the soil. Nitrogen in the form of NH4NO3 was applied at a dose of 3.6 g N∙vase−1: ½ at the beginning of vegetation (spring) and ½ dose at the BBCH 30–32 (ger. Biologische Bundesanstalt, Bundessortenamt und Chemische Industrie)—a stem shooting stage of wheat. Fertilization of the remaining components per pot was as follows: P2O5—2.52 g in the form of KH2PO4; K2O—2.04 g in the form of K2SO4; Mg—0.5 g in the form of MgSO4. In addition, iron (50 mg per pot), boron (5 mg per pot), manganese (3 mg per pot), and copper (3 mg per pot) were also added to the substrate in the forms of Fe(NH4)2, C3H6N6·xBH3O3, C10H12MnN2O8·2Na, and Cu(NH4)2, respectively. The moisture content of the substrate was maintained at 60% water capacity throughout the growing season. The characteristics of the biocarbon types are shown in Table 1.
When wheat reached the full maturity-growing stage, tested plants were harvested. After the harvest, the following were determined: grain yield per pot and selected characteristics of the technological value of grain and flour: weight of 1000 grains (PN-68/R-74017 [28]), falling number (PN-EN ISO 3093 [29]), wet gluten content (PN-A-74042 [30]), gluten index, and Zelleny sedimentation index (PN-EN ISO 5529 [31]).
The falling number was determined using the Hagberg-Perten method [29]. The grain sample was ground on a laboratory mill (grinder). An automatic equipment Falling Number 1500 was used for the determination. A total of 7 g of flour with a moisture content of 15% was weighed for analysis in order to ensure a constant level of dry matter content. A sample of middlings in a viscometric tube, together with a stirrer, was placed in a boiling water bath. The use of equipment automatically measured the stirrer’s rate of descent in the starch glue. The determination was performed in duplicate. The amount of wet gluten in wheat grain and its index were determined.
The amount of wet gluten in wheat grain and its index were determined according to PN-A-74042 [30]. Grain samples were ground on a laboratory mill (grinder). A Gluten Index System was used to determine the amount of wet gluten and its quality. The method involves kneading the dough (with 10 g of flour sample and 4.8 cm3 of 2% NaCl) and washing out the starch with a 2% NaCl solution. The process was carried out automatically in a single sequence for 5 min. Centrifugation of the formed gluten was carried out on sieve cassettes at 6000 +/−5 rpm.
The Zeleny sedimentation index was determined according to PN-EN ISO 5529 [31] for wheat. The determination of sedimentation index and Zeleny Test was carried out on an apparatus consisting of a measuring panel and a SWD—89 Sadkiewicz type shaker (Sadkiewicz Instruments, Bydgoszcz, Poland).
Average monthly temperatures during subsequent years of this study are given in Table 2.
The results were statistically analyzed with the Tukey test at p ≤ 0.05.

3. Results and Discussion

3.1. Winter Wheat Yields

Winter wheat grain yield did not depend on the biocarbon dose (Figure 1). However, in the first year of this study, the type of biocarbon had a significant effect on winter wheat grain yield. Both biocarbons from forestry waste (WCB and SB) had a positive effect on yields (Figure 2). It should also be noted that in the other years of this study, the differences were not statistically significant, but the introduction of biocarbon into the soil resulted in a trend towards higher grain yields in winter wheat (Figure 2), regardless of the type of biocarbon. On the other hand, recent studies showed that different types (origins) of biochar can have a significant effect on yields. For example, Lilli et al. [32] have proven that tomato yields can increase even up to 175% when treated with biochar of specific origin and with appropriate fertilization. A study by Gebremedhin et al. [33] indicates a beneficial effect of biocarbons on wheat yield and yield structure traits. The application of biocarbon at 4 t·ha−1 resulted in an increase in grain and straw yield compared to the control. Różyło et al. [24] found that amendment of sewage sludge with 5% biochar can significantly improve yield quantity, but also some grain quality traits. In a study by Khan et al. [34], an increase in wheat grain yield was also observed, but after the application of biocarbon at much higher doses than in the present study (20 t·ha−1 and urea at 150 kg N·ha−1. A positive effect of biochar amendments on cereal yields, especially when combined with nitrogen fertilization, has been reported in multiple studies [35,36,37,38]. Zhu et al. [39] also found that biochar amendment to soil could also stimulate the growth of crop root systems, which can also be a factor that, over time, improves the utilization rate of nutrients available in soil.
No statistical differences between tested biochar (and control) were found in the third year of this study, and all tested objects reached high yields (of about 45–50 g per pot). The yields for almost all objects (also for control) showed a trend to be the highest, and at a similar level, in the third year of this study. This may indicate that in the third year of this study, factors other than biochar amendment were mainly responsible for wheat yields. As the soil used in the experiment was removed after each year of the experiment, the increasing saturation of the soil sorption complex with nutrients in the following years could not be a factor. The possible answer is that biochar impact on plant yields was strongly affected by natural conditions, which were, naturally, slightly different in each year of this study.

3.2. Grain Characteristics

The grain of wheat utilized for consumption must be distinguished by its quality, which is determined by grain and flour quality parameters. In general, a distinction is made between the physical parameters of the grain (e.g., 1000 grain weight) and the qualitative parameters (e.g., falling number, Zelleny sedimentation index value, gluten content, gluten index). In our study, the assessment concerned selected physical and qualitative properties of the grain.

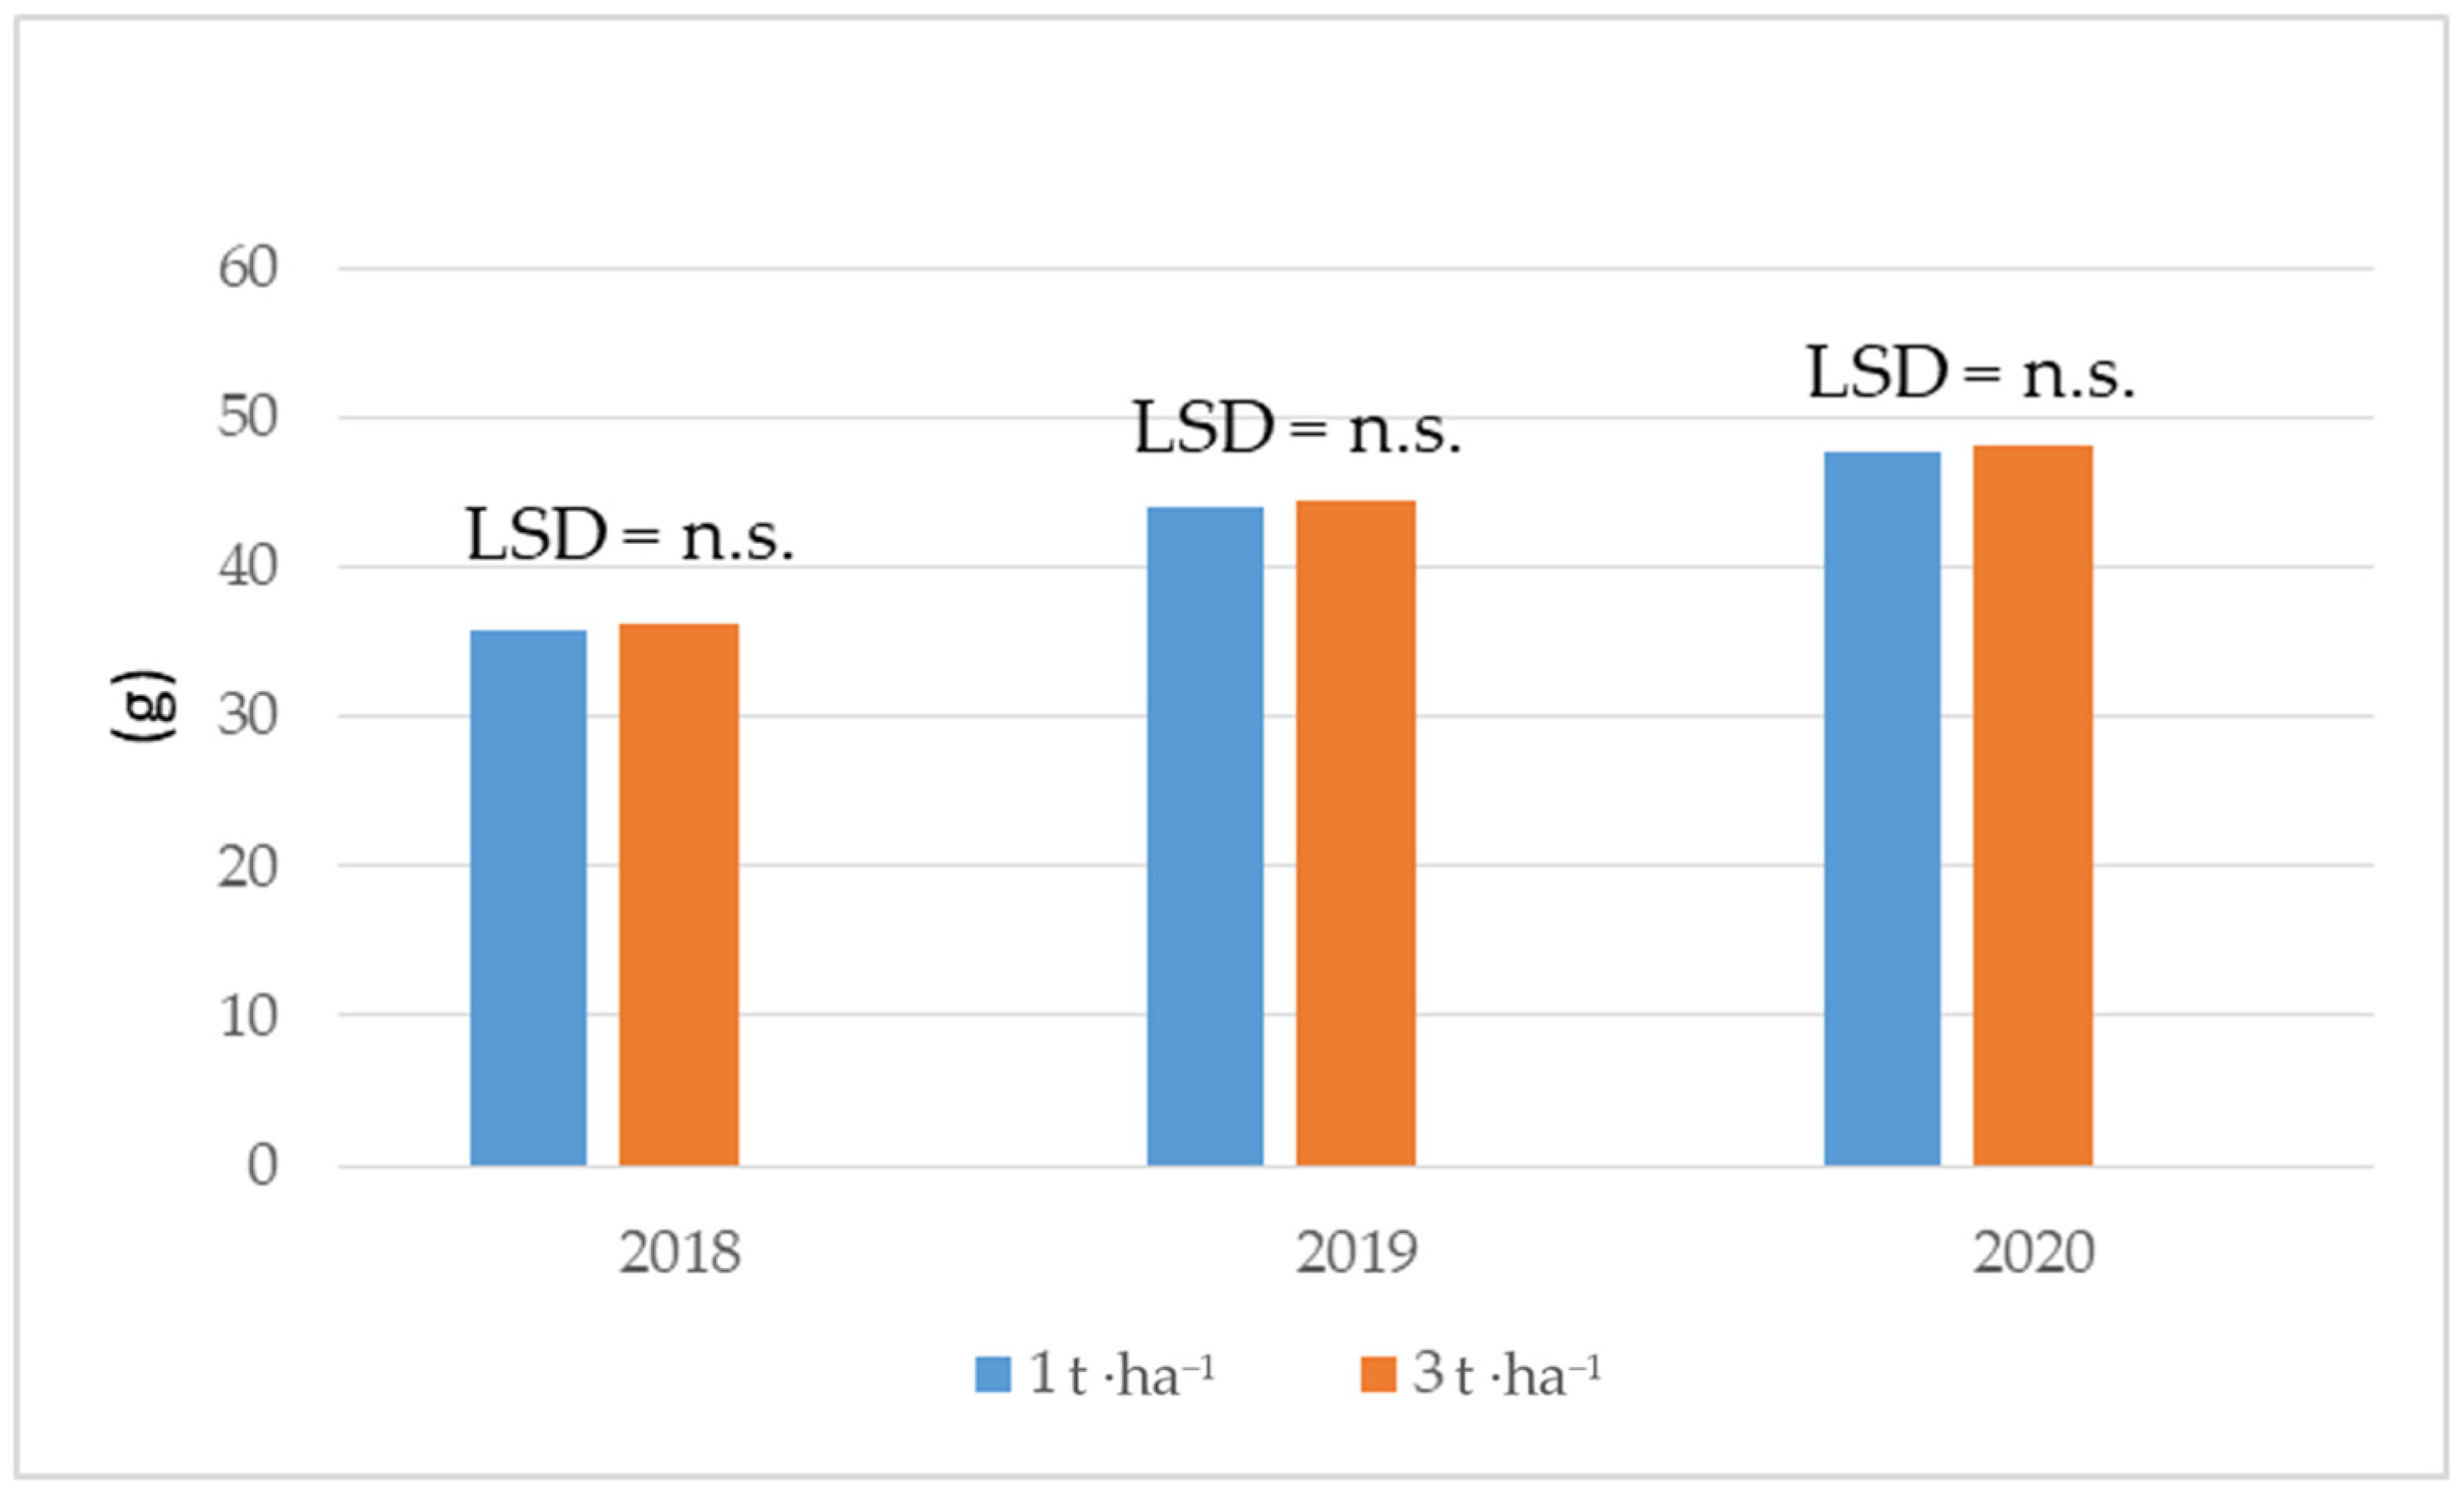
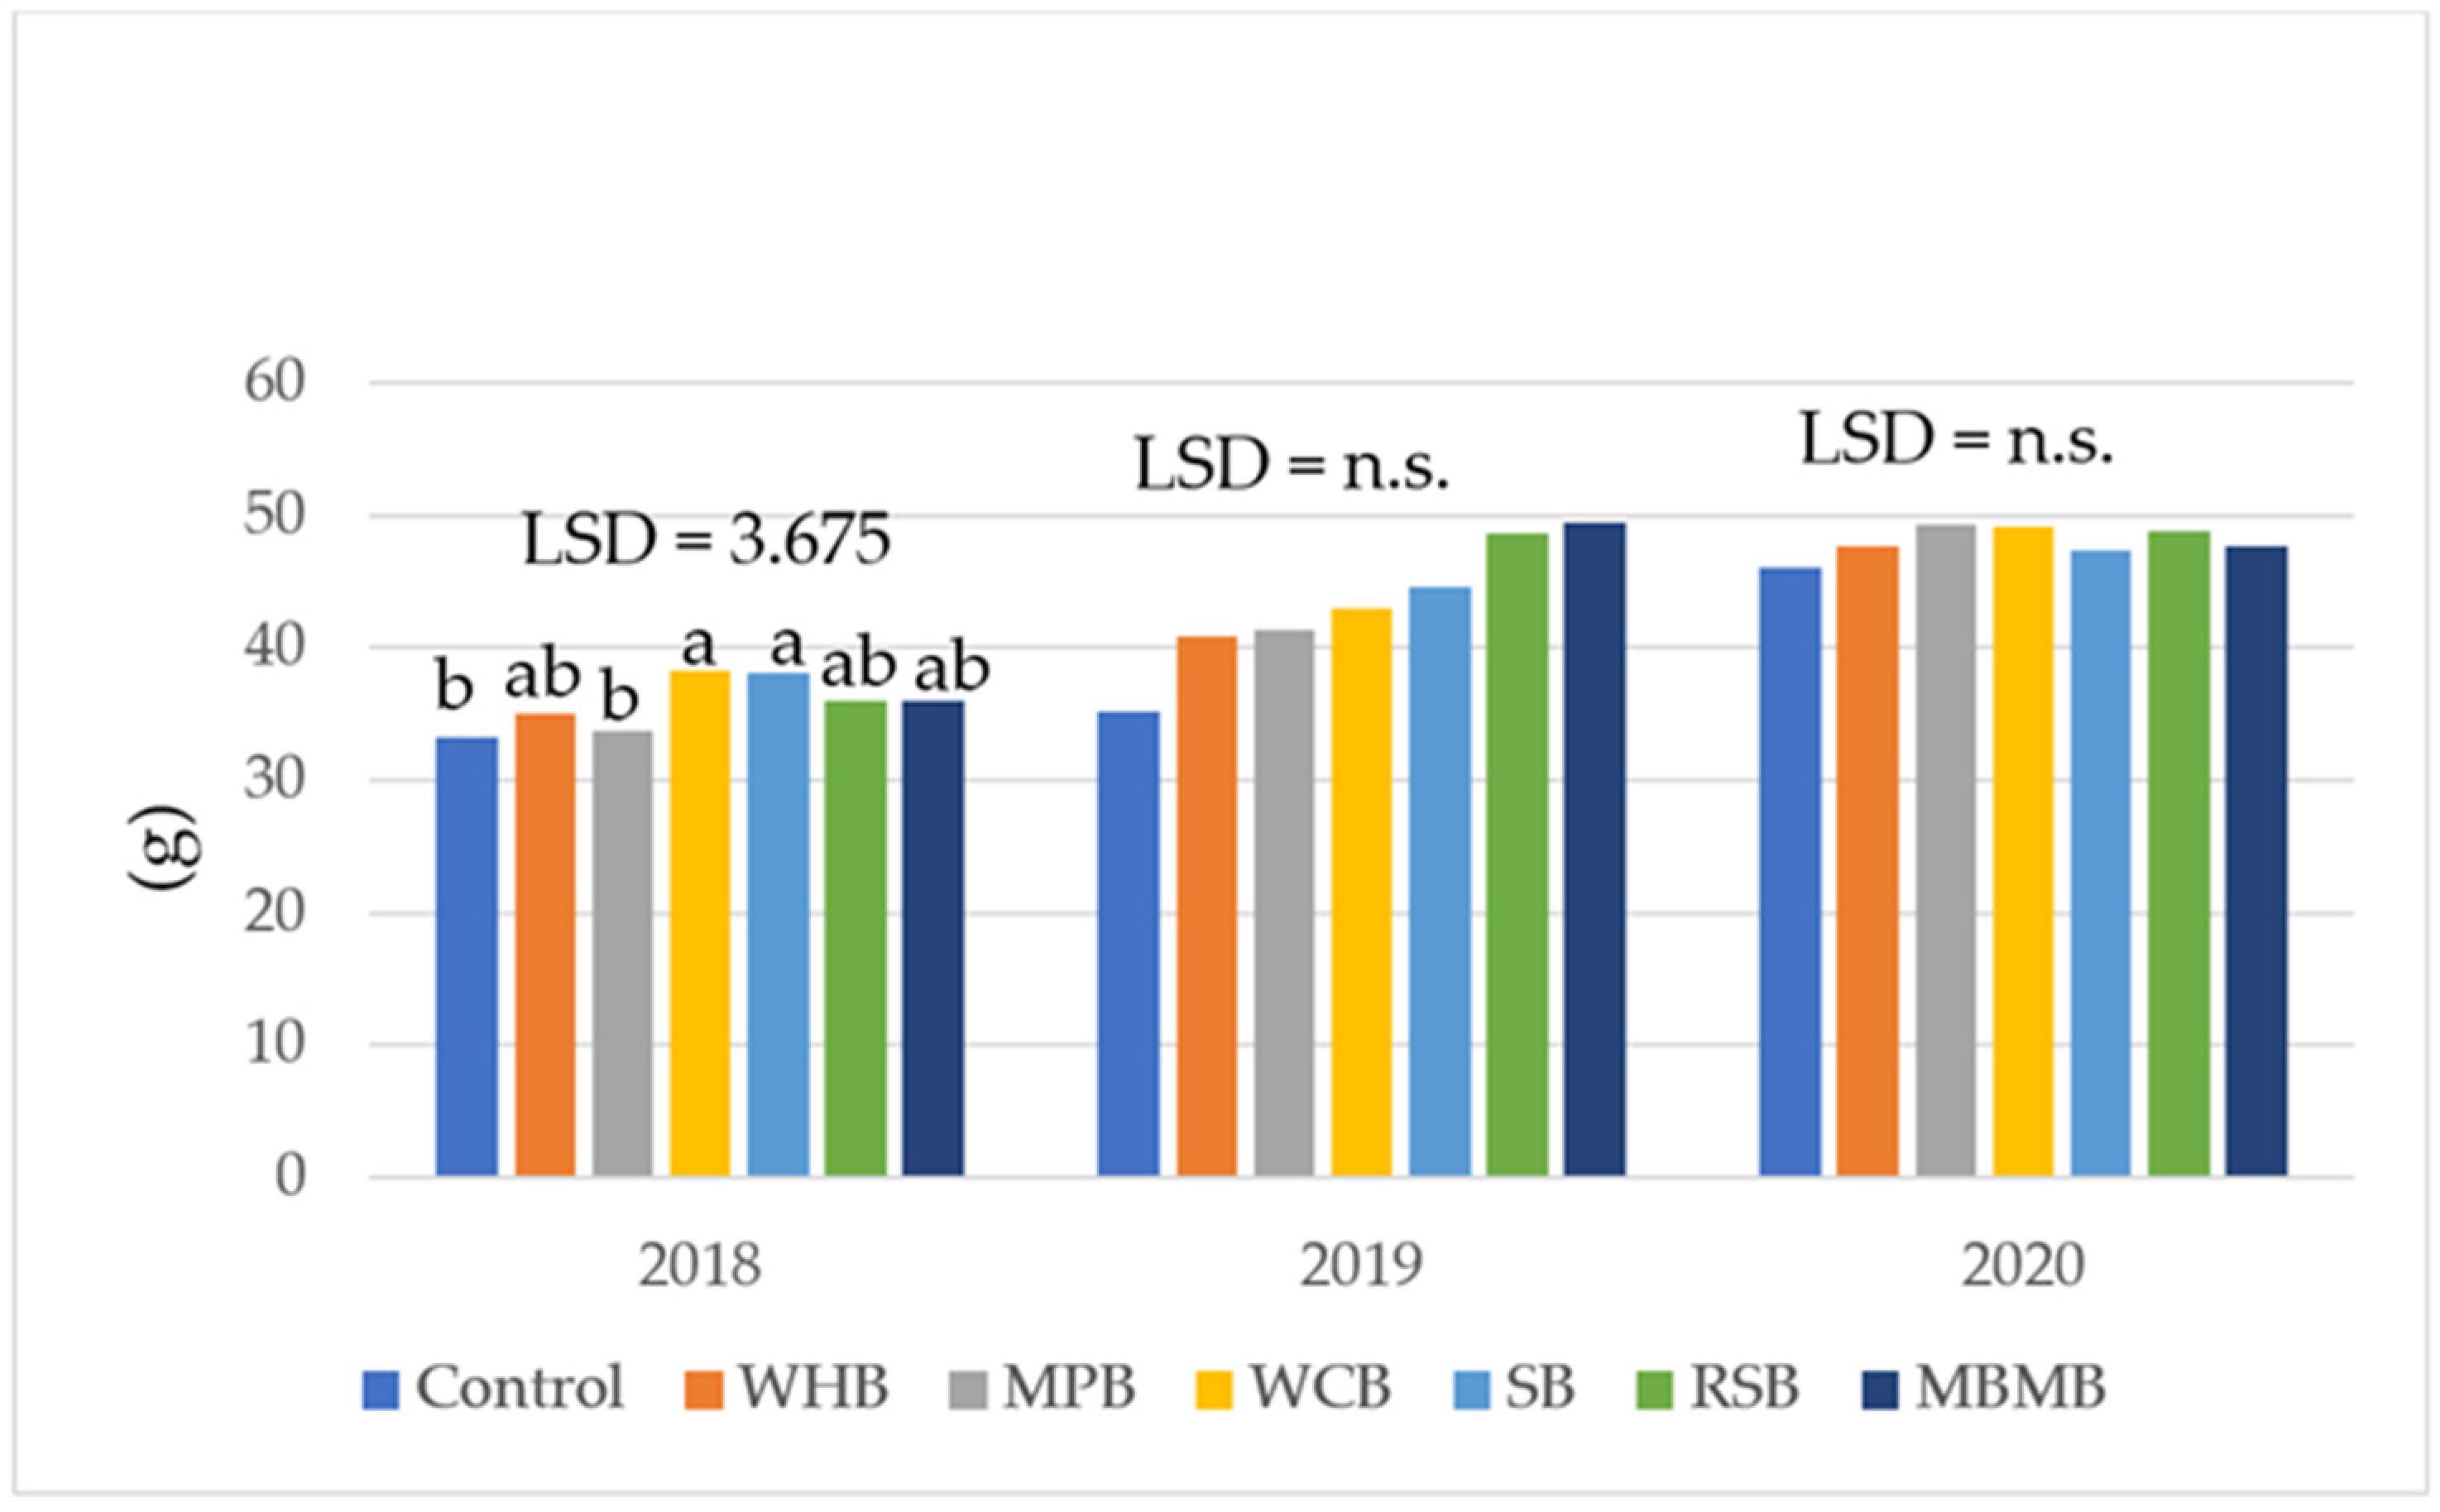
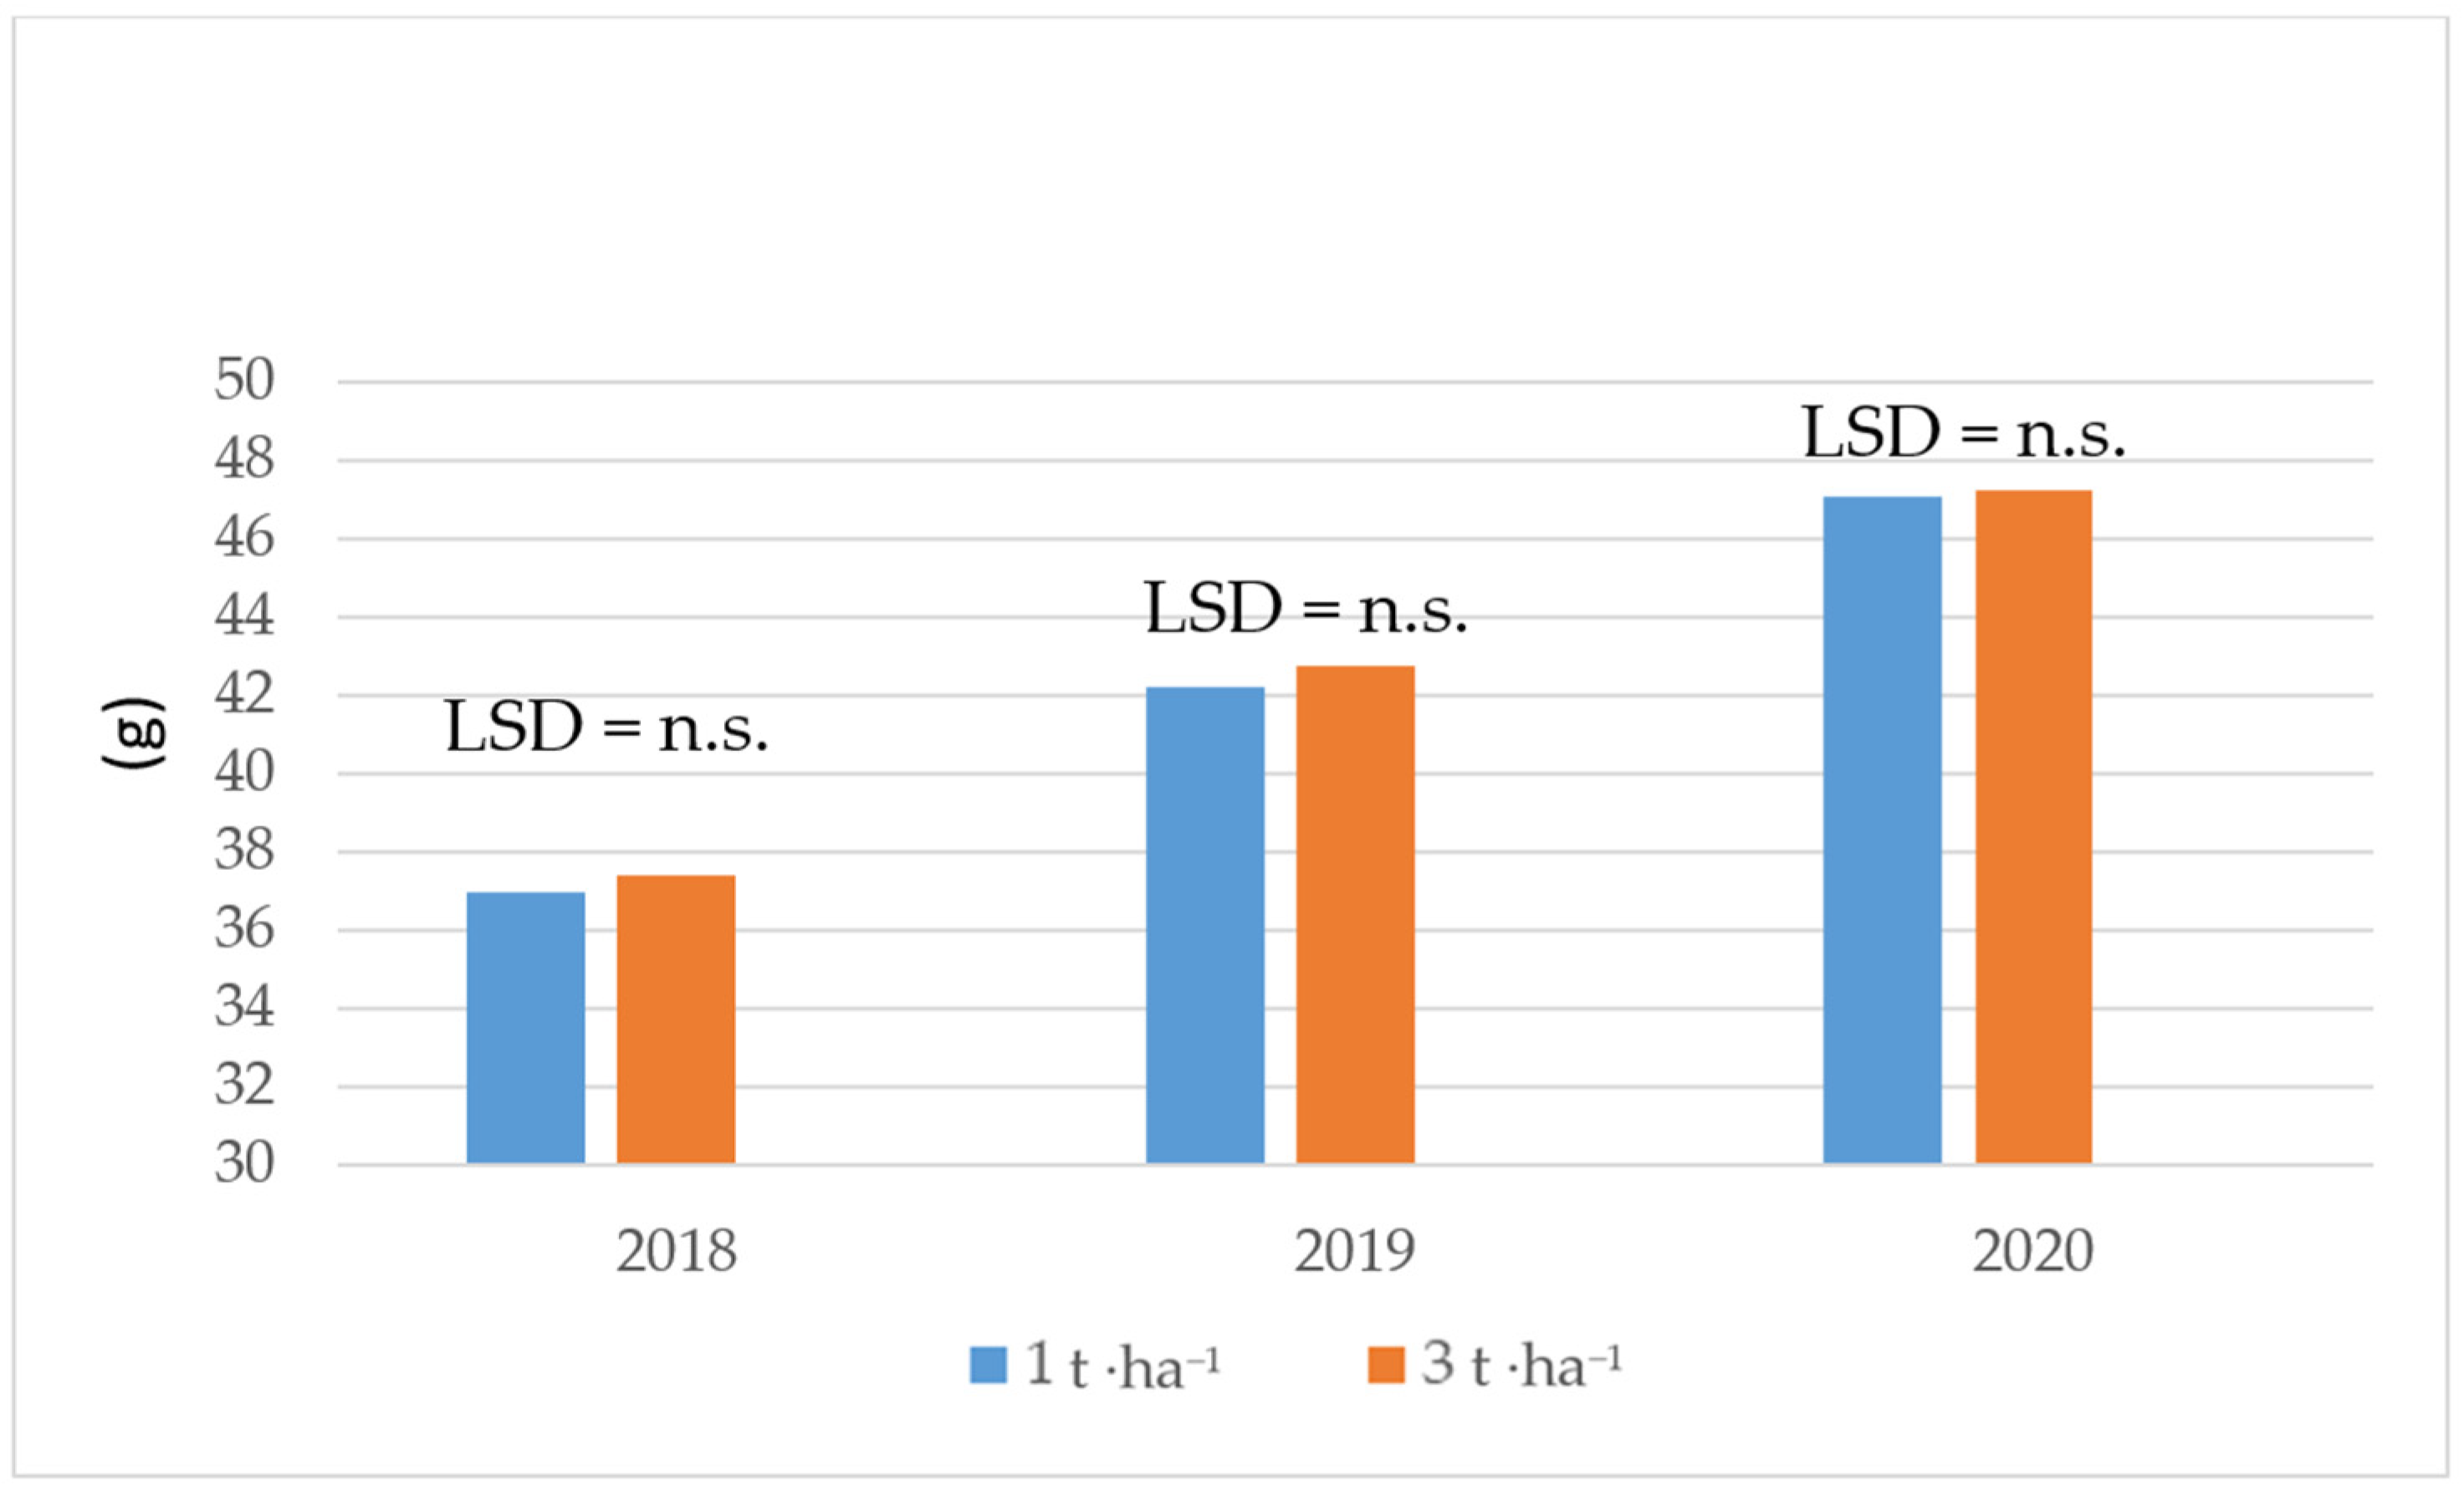
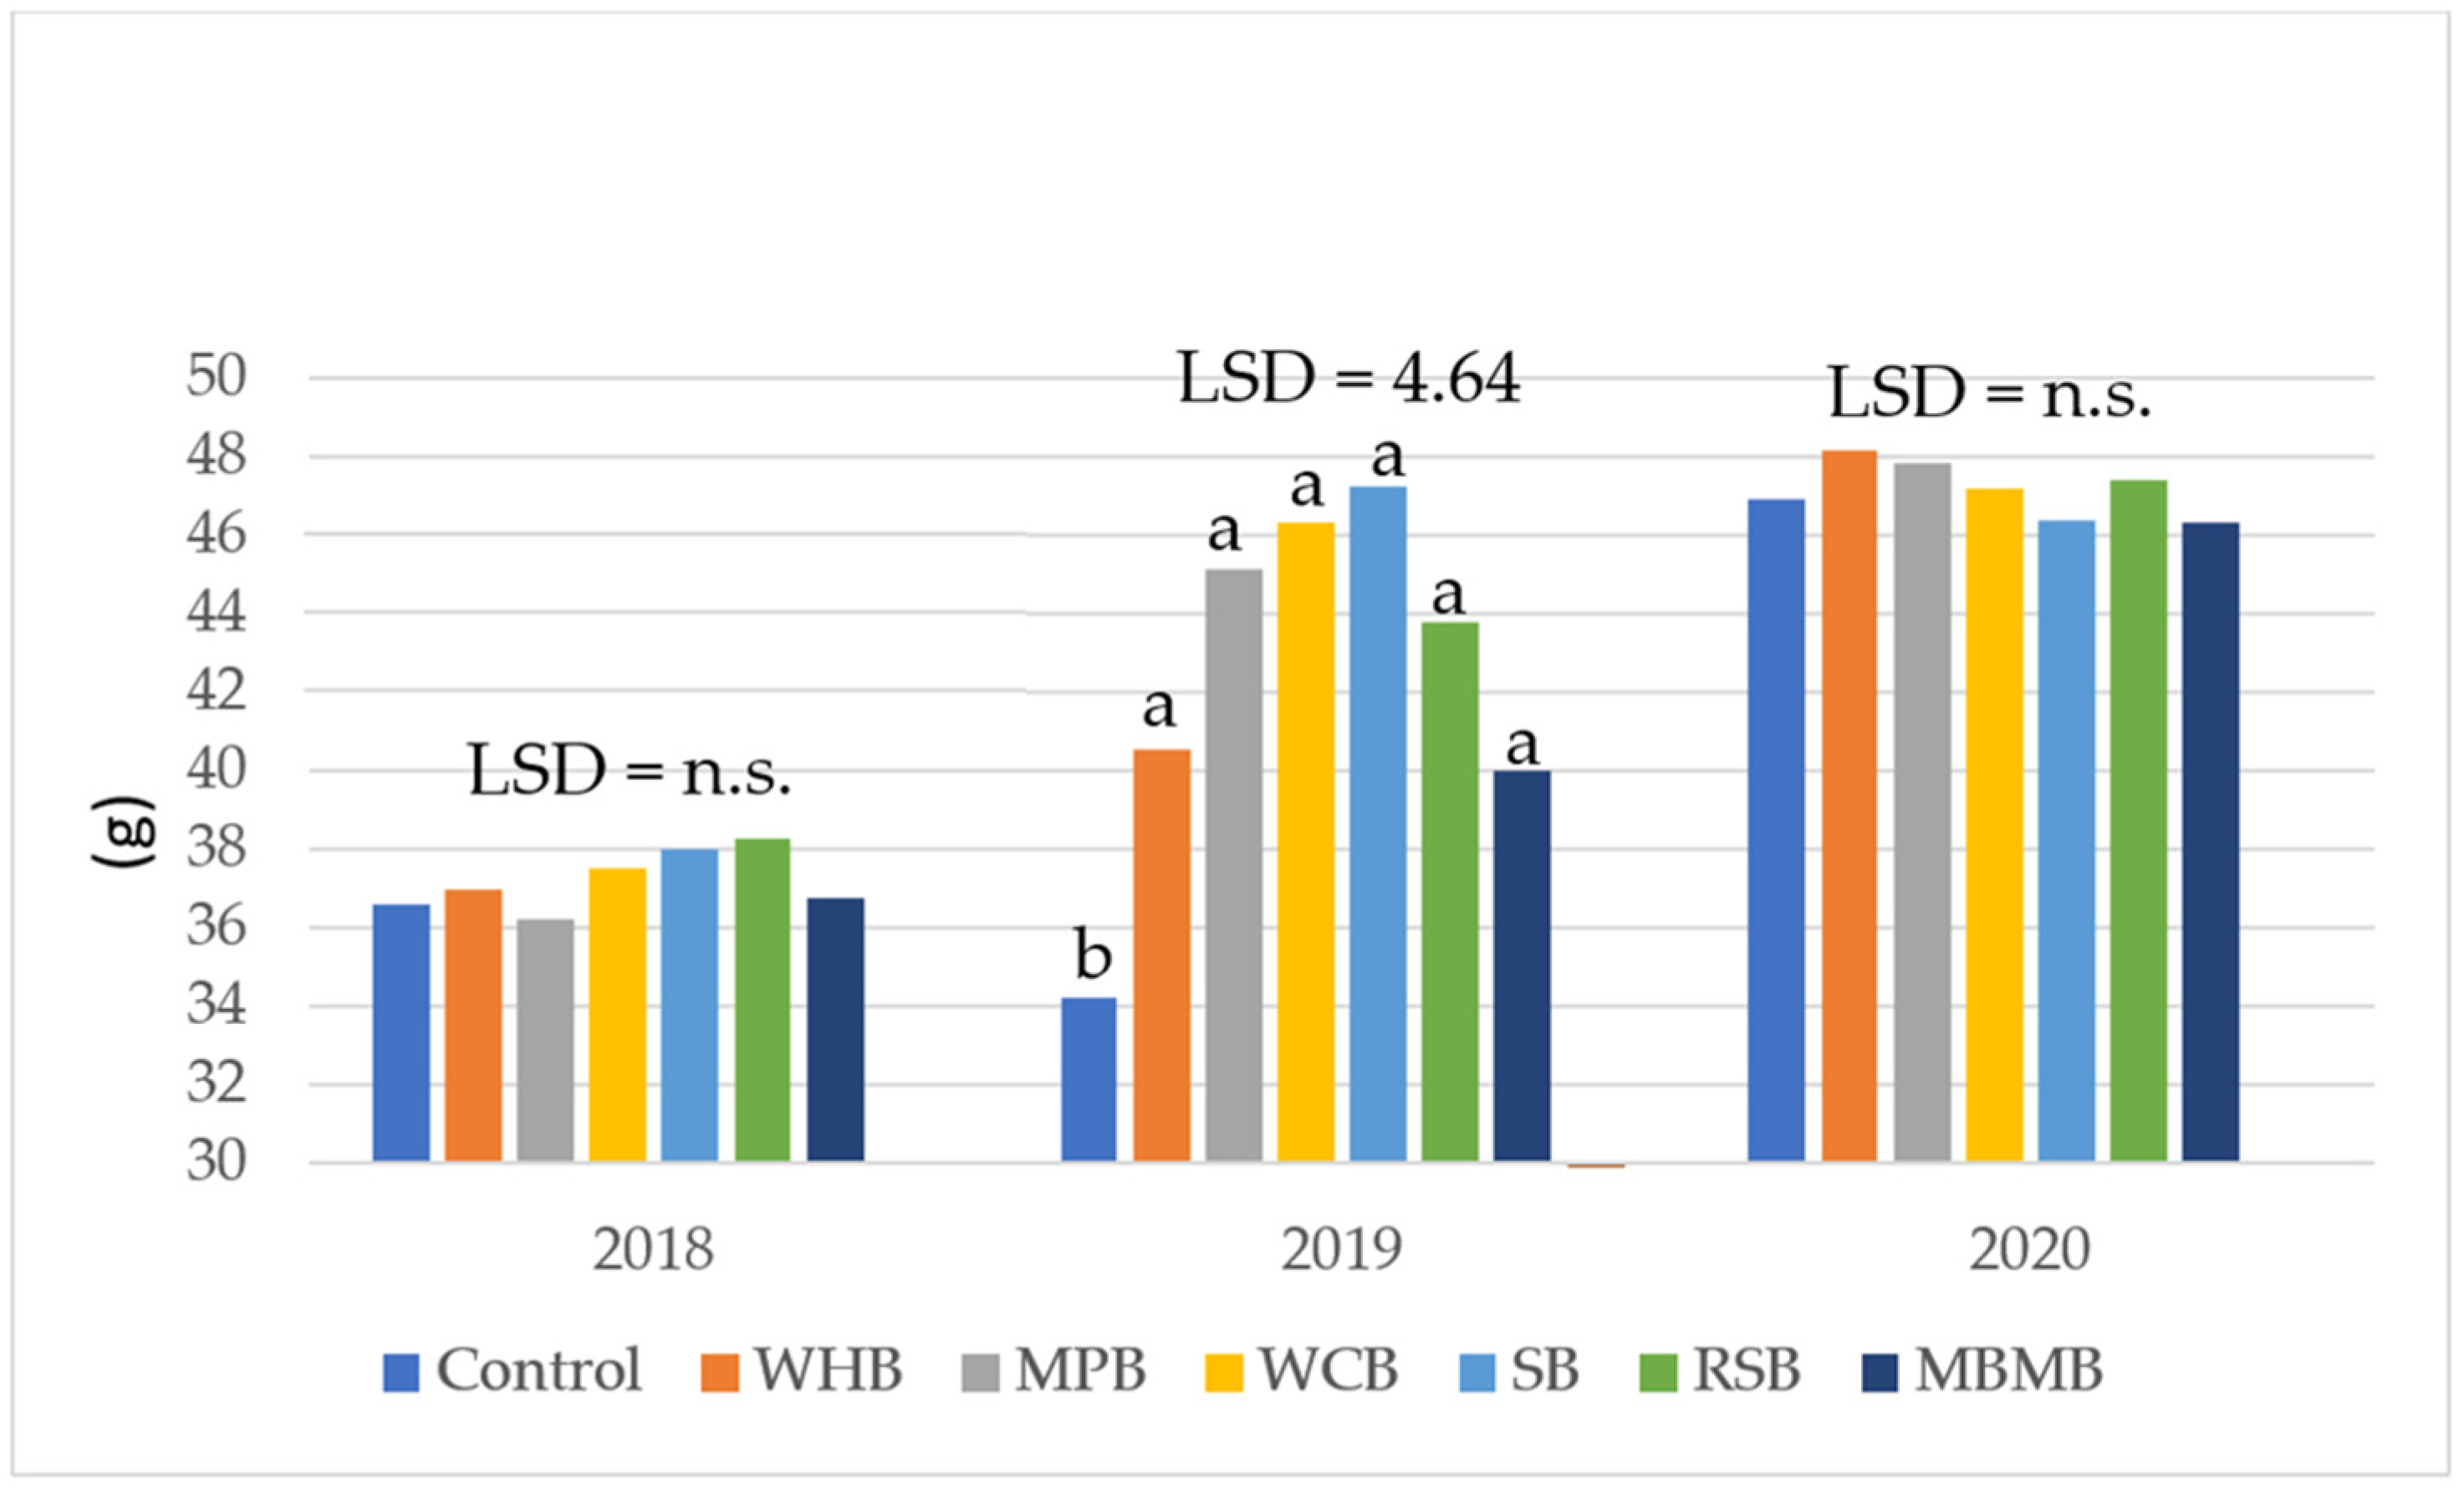
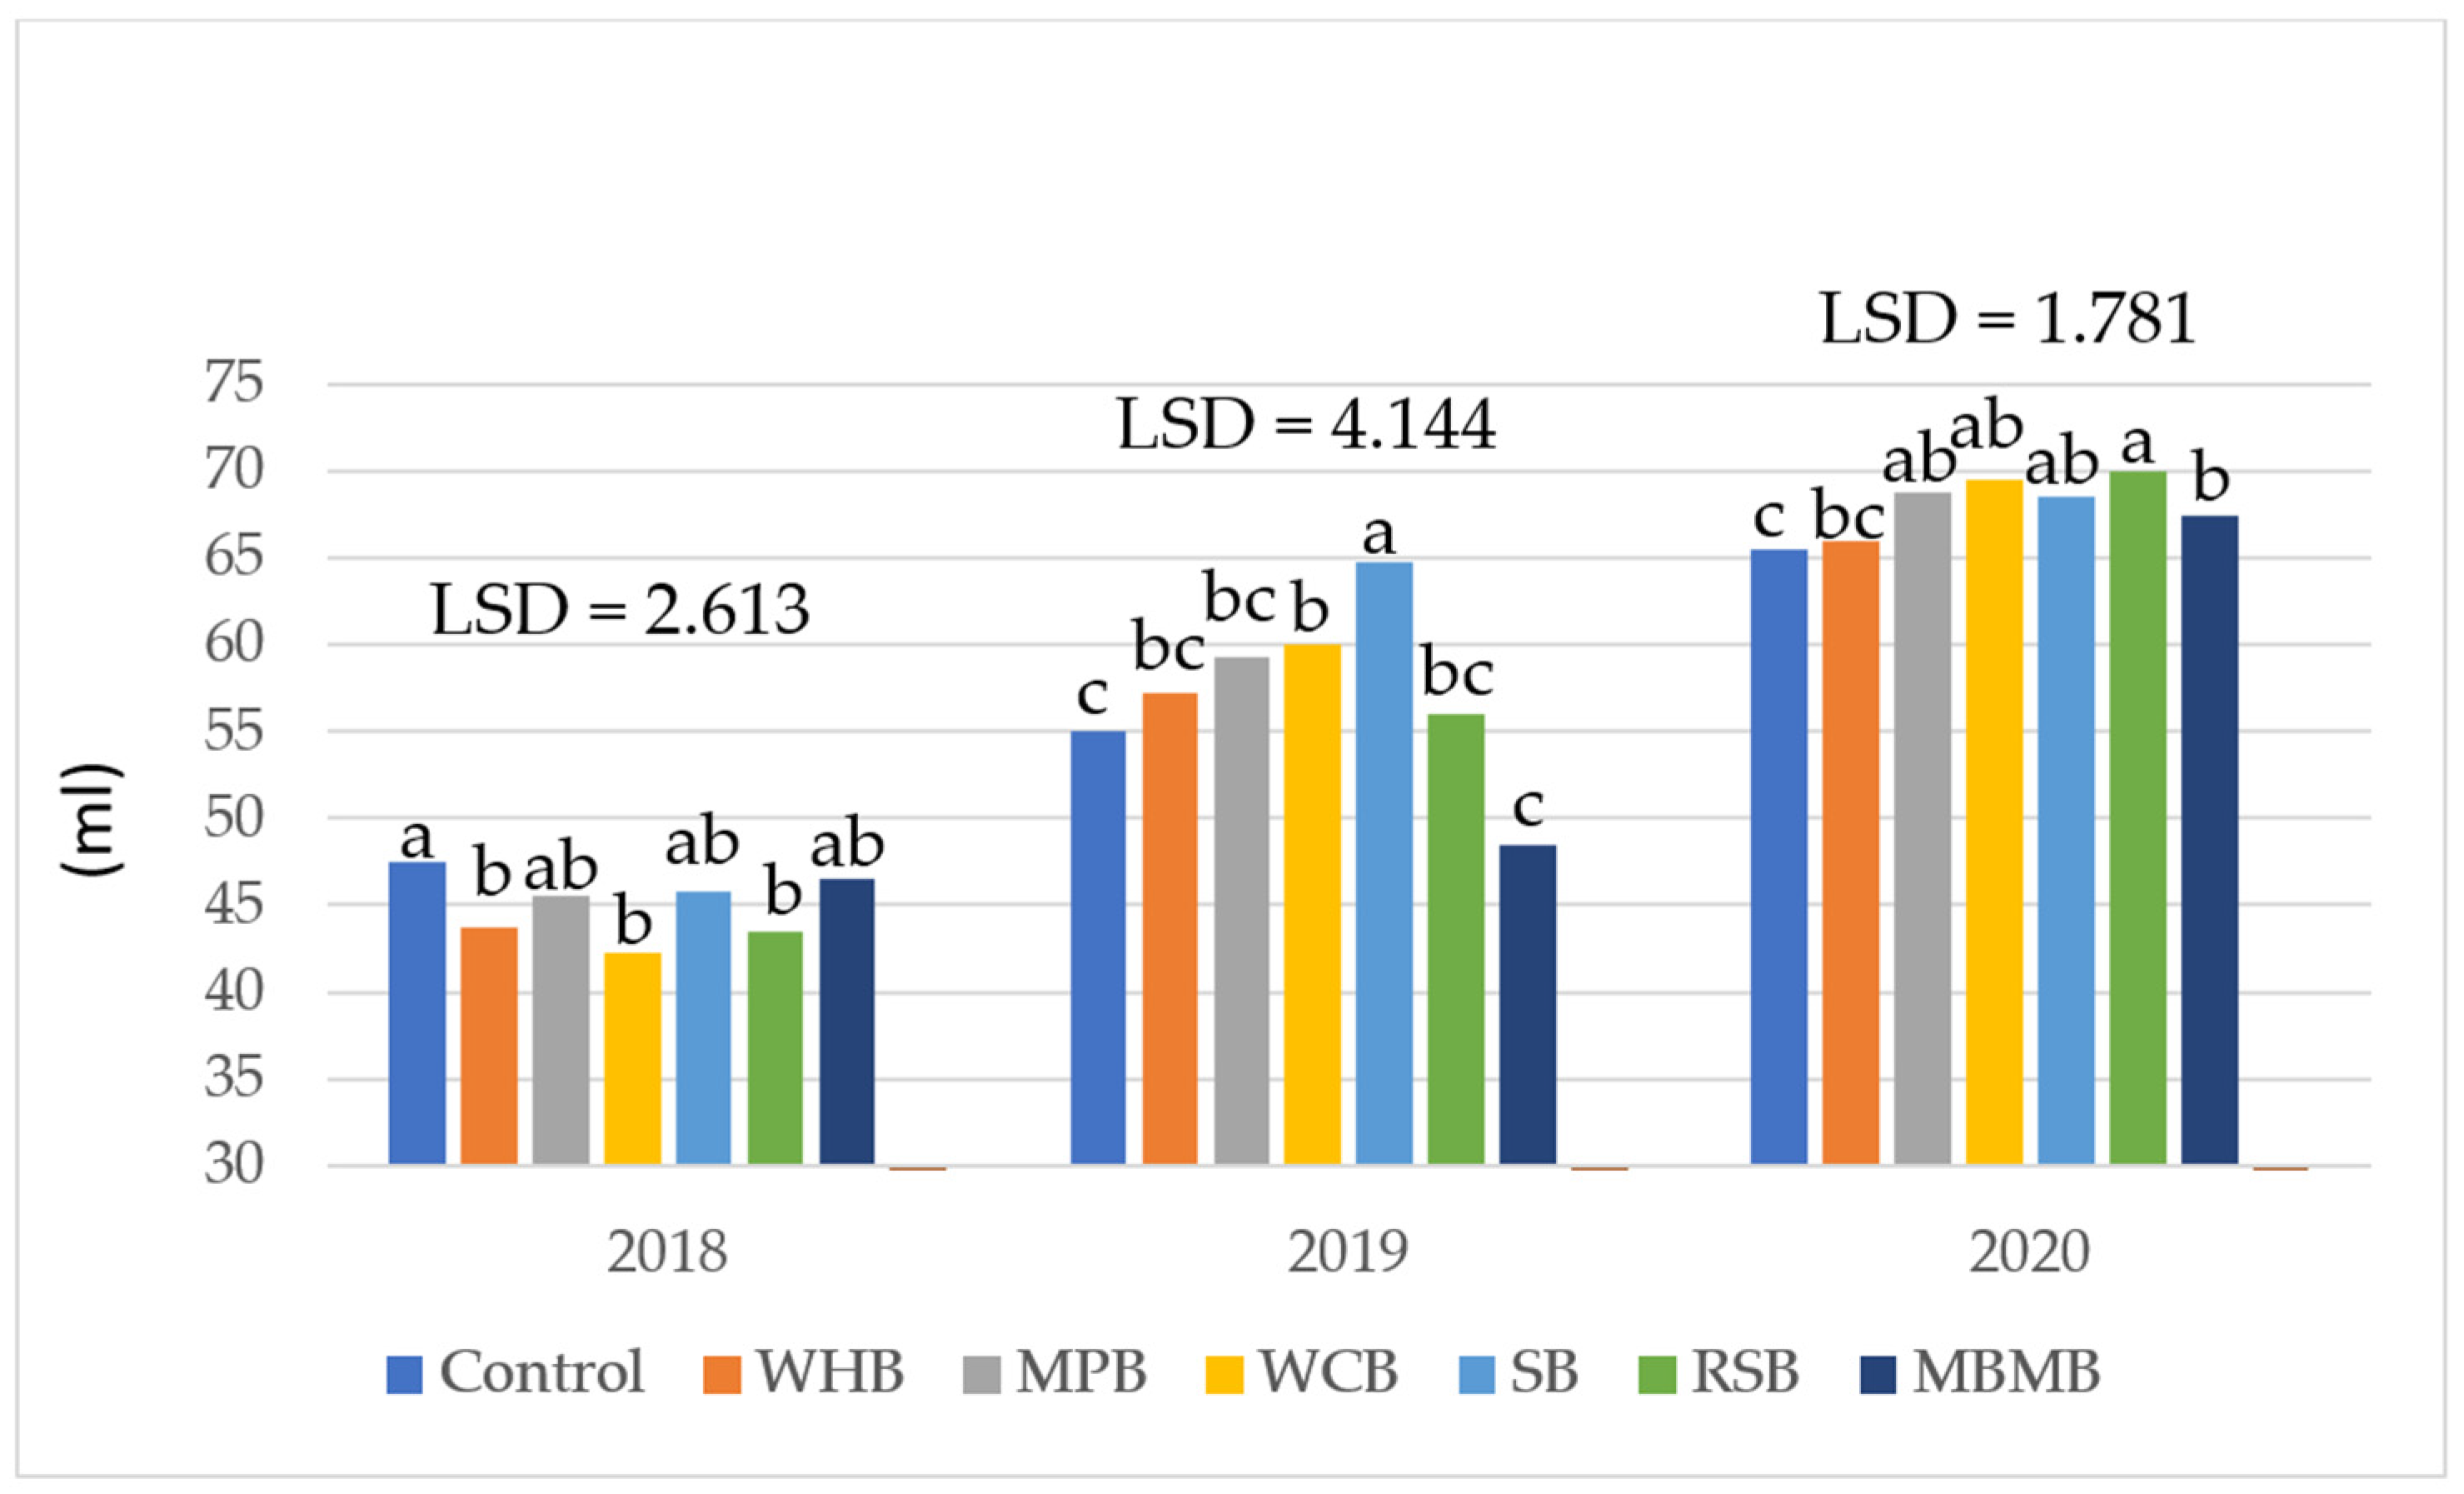
3.2.1. Mass of Thousand Grains

The mass of a thousand grains is a measure used in agriculture to assess the weight of a specific number of grains. It is an important parameter as it provides information about the size and weight of individual grains. It can be influenced by crop genotype, growing conditions, and agricultural practices. Farmers and researchers use this information to evaluate crop yield and seed quality and to make decisions about seed selection and planting practices.
In all years of this study, only a trend towards higher 1000 grain weight was found with the application of biocarbon at 3 t·ha−1. However, the differences were not statistically proven (Figure 3). Billah et al. [40] found that an amendment of biochar can significantly improve the mass of a thousand grains. However, the strength of the effect is supported by the size of the biochar particles—the smaller the particles; the more visible the positive effect.
Analysis of the effect of the type of biocarbon on the weight of 1000 grains showed that only in the second year of this study, amendments of biocarbon significantly increased the mass of thousand grains compared to the control object (no added biocarbon). However, none of the tested biochar types showed statistically better results than others in this matter. Amendment of biocarbon obtained from woody biomass (WCB and SB) again showed a trend to have the best potential of 1000 grain mass (similarly as for yield potential) (Figure 4).

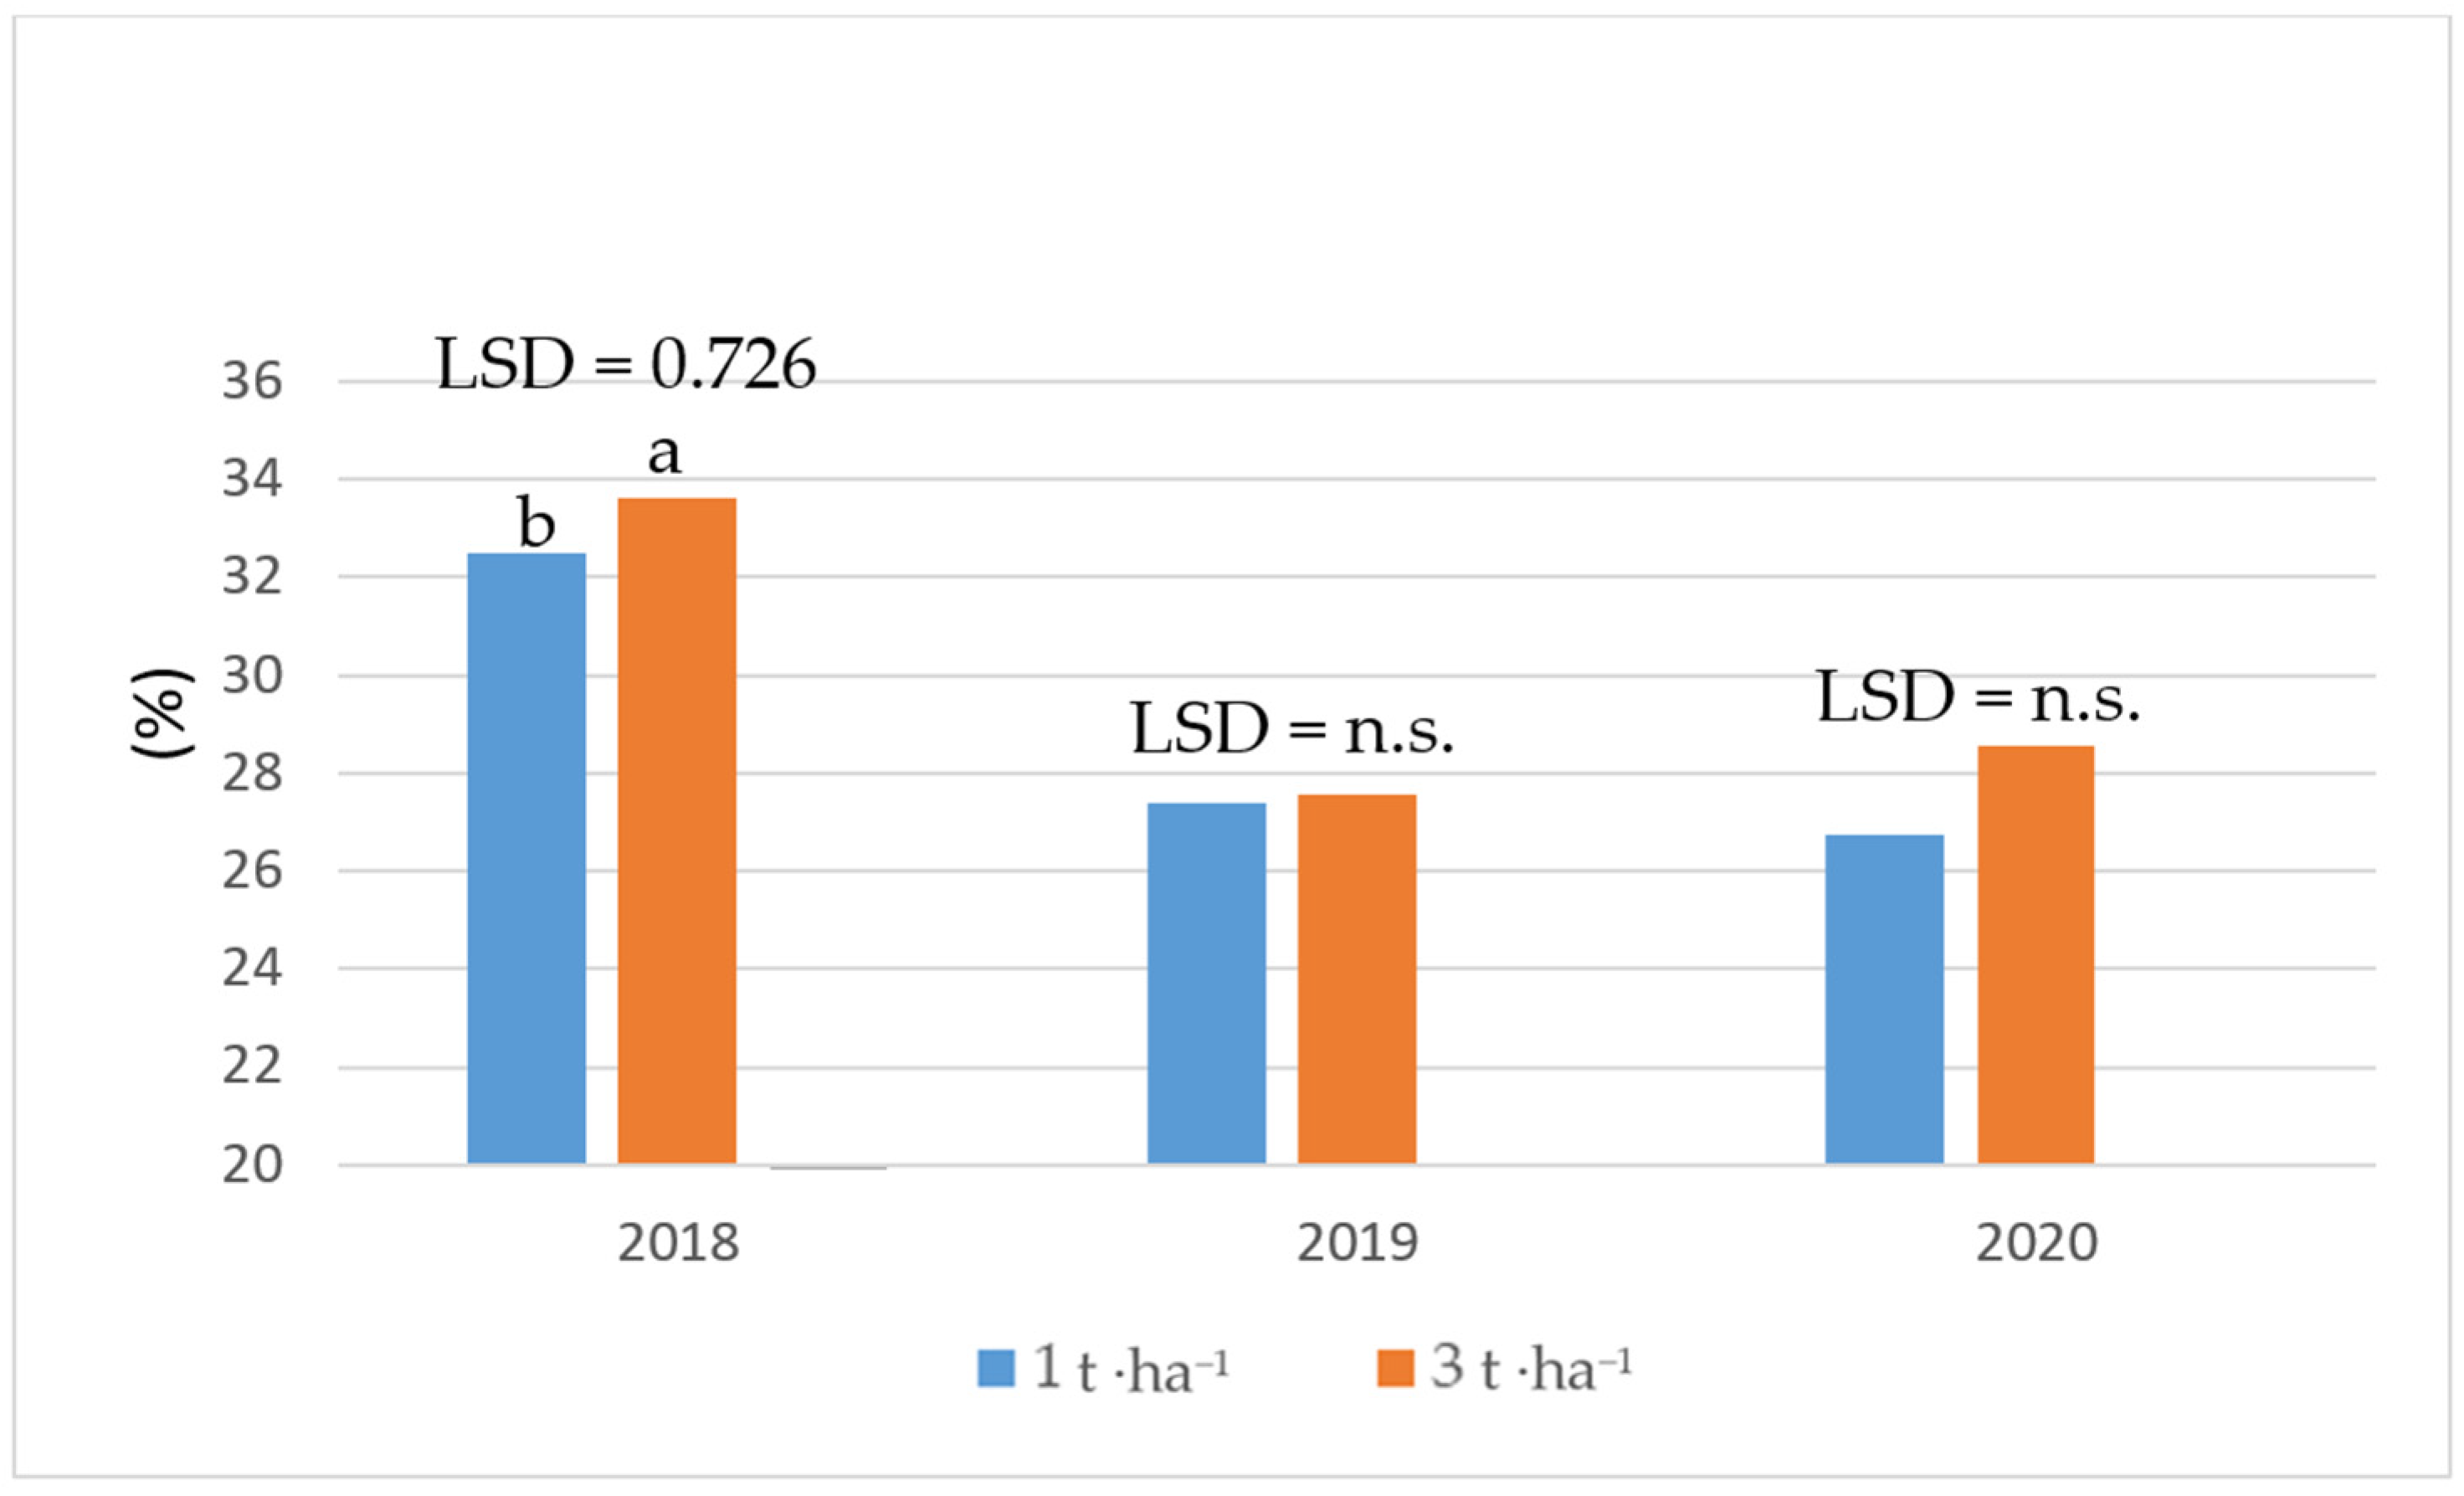
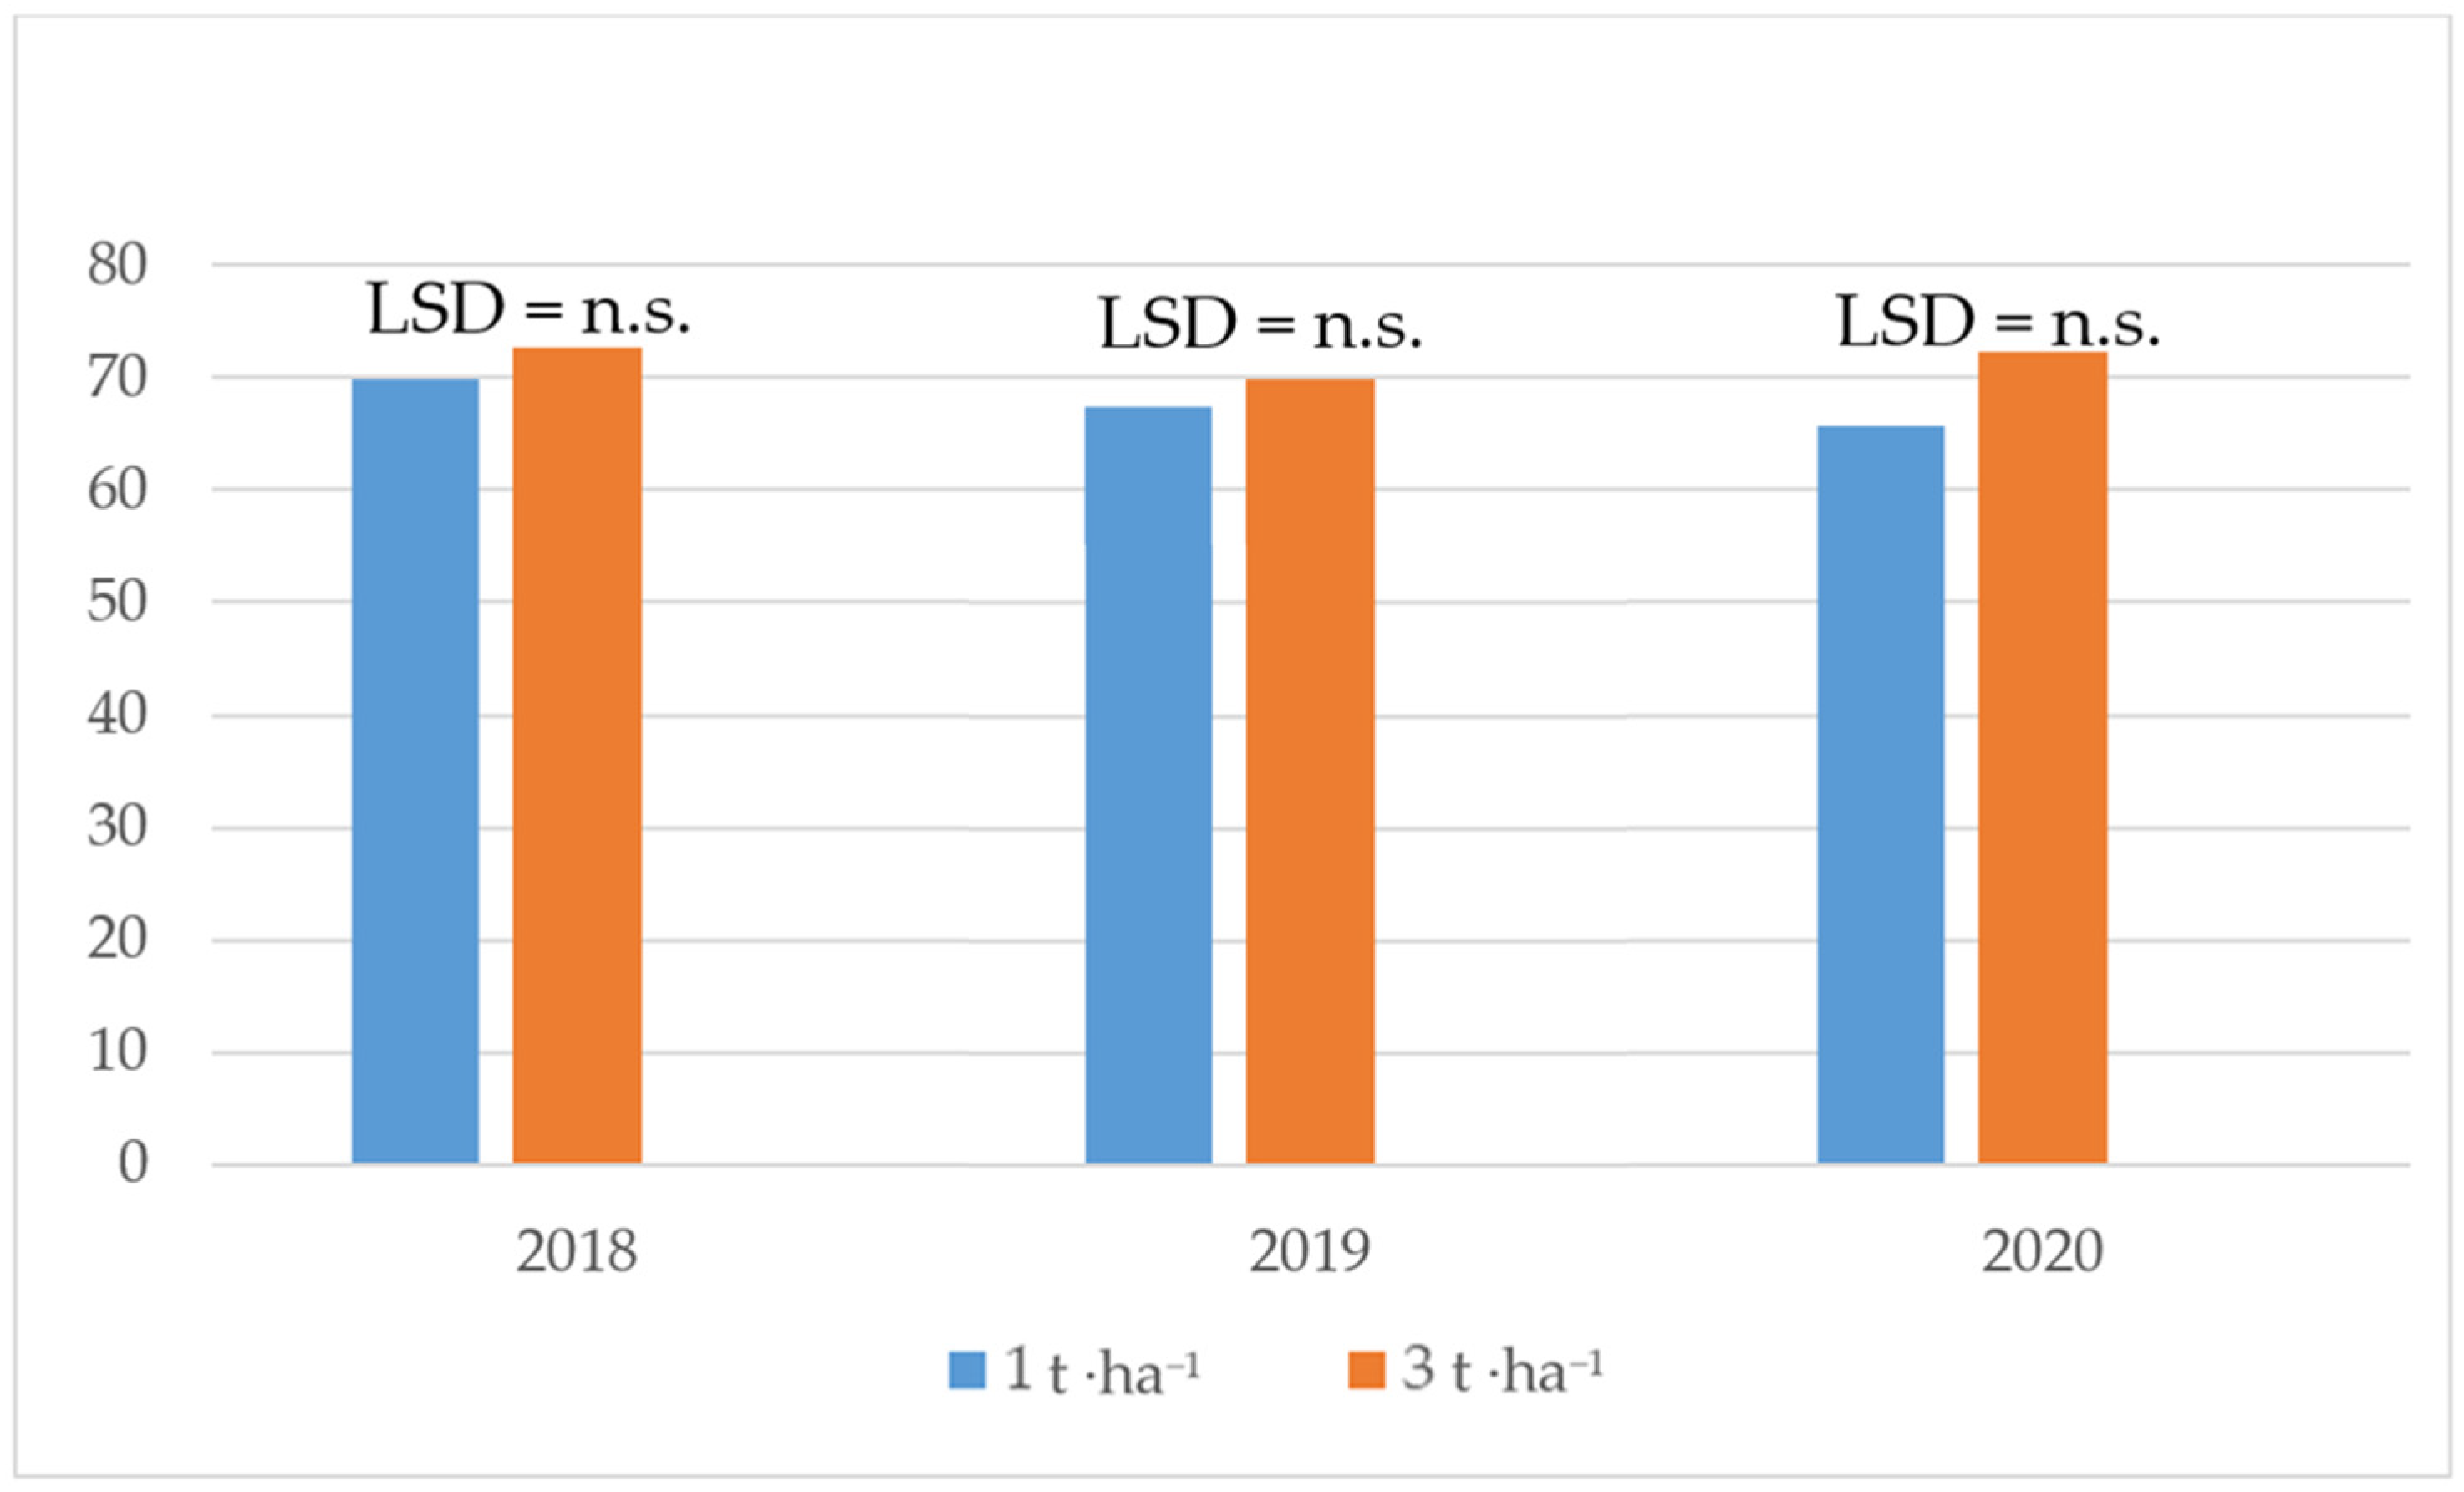
3.2.2. Wet Gluten Content and Gluten Index

Gluten is a complex mixture of proteins found in wheat and related grains like barley and rye. It plays a crucial role in the baking industry due to its unique properties that contribute to the texture, structure, and overall quality of baked goods. Since nitrogen fertilization is one of the key aspects influencing gluten content [41], the amendment of biocarbons, which can hold and release nitrogen, might have a significant impact on gluten content. In the presented study, the total dose of biocarbon significantly differentiated the amount of wet gluten only in the first year of this study (Figure 5). The application of biocarbon at 3 t·ha−1 resulted in a higher value for this parameter. In the following years of this study, only a trend towards increased wet gluten amounts with increased biocarbon doses was observed. According to Khan et al. [34], the application of biocarbon at much higher rates than in the presented study (20 t·ha−1) resulted in an increase in the protein content of wheat grain and straw. This was also confirmed by Selivanovskaya [42] for biochar used at 30 t ha−1. Also, Shahzad et al. [43] found an increase (by 6.8 g·kg−1) in the protein content of wheat grain cultivated with biochar amendment. Kraska et al. [44] found that 20 t ·ha−1 of biochar amendment resulted in a higher protein content of rye grain than biochar applied at 30 t ·ha−1. In the presented study, the type of biocarbon significantly shaped the amount of wet gluten in winter wheat grain in 2018 and 2020 (Figure 6). In 2018, the best value for this indicator was found on the site where meat and bone meal biocarbon was used. In 2020, MPB biochar had the highest content of wet gluten. WCB biochar showed one of the highest wet gluten contents in both 2018 and 2020.
The gluten index is a measure of the gluten strength in wheat flour. It provides information about the quality of gluten and its ability to form a stable and elastic network in dough. The gluten index is an important parameter in the baking industry, particularly in the production of bread and other baked goods. There was no significant effect of the biocarbon dose on the gluten index (Figure 7). There was only a trend toward better gluten quality with a higher biocarbon dose, but the differences were not statistically proven. In all years of this study, the type of biocarbon had an effect on the gluten index. However, the effect was not the same in all years. In 2018, the highest value of this parameter was found for the biocarbon amendment made from forestry waste (WCB). In 2019 and 2020, a significantly higher value of this index was found in the objects where biocarbon derived from meat and bone meal was used (MBMB) (Figure 8).

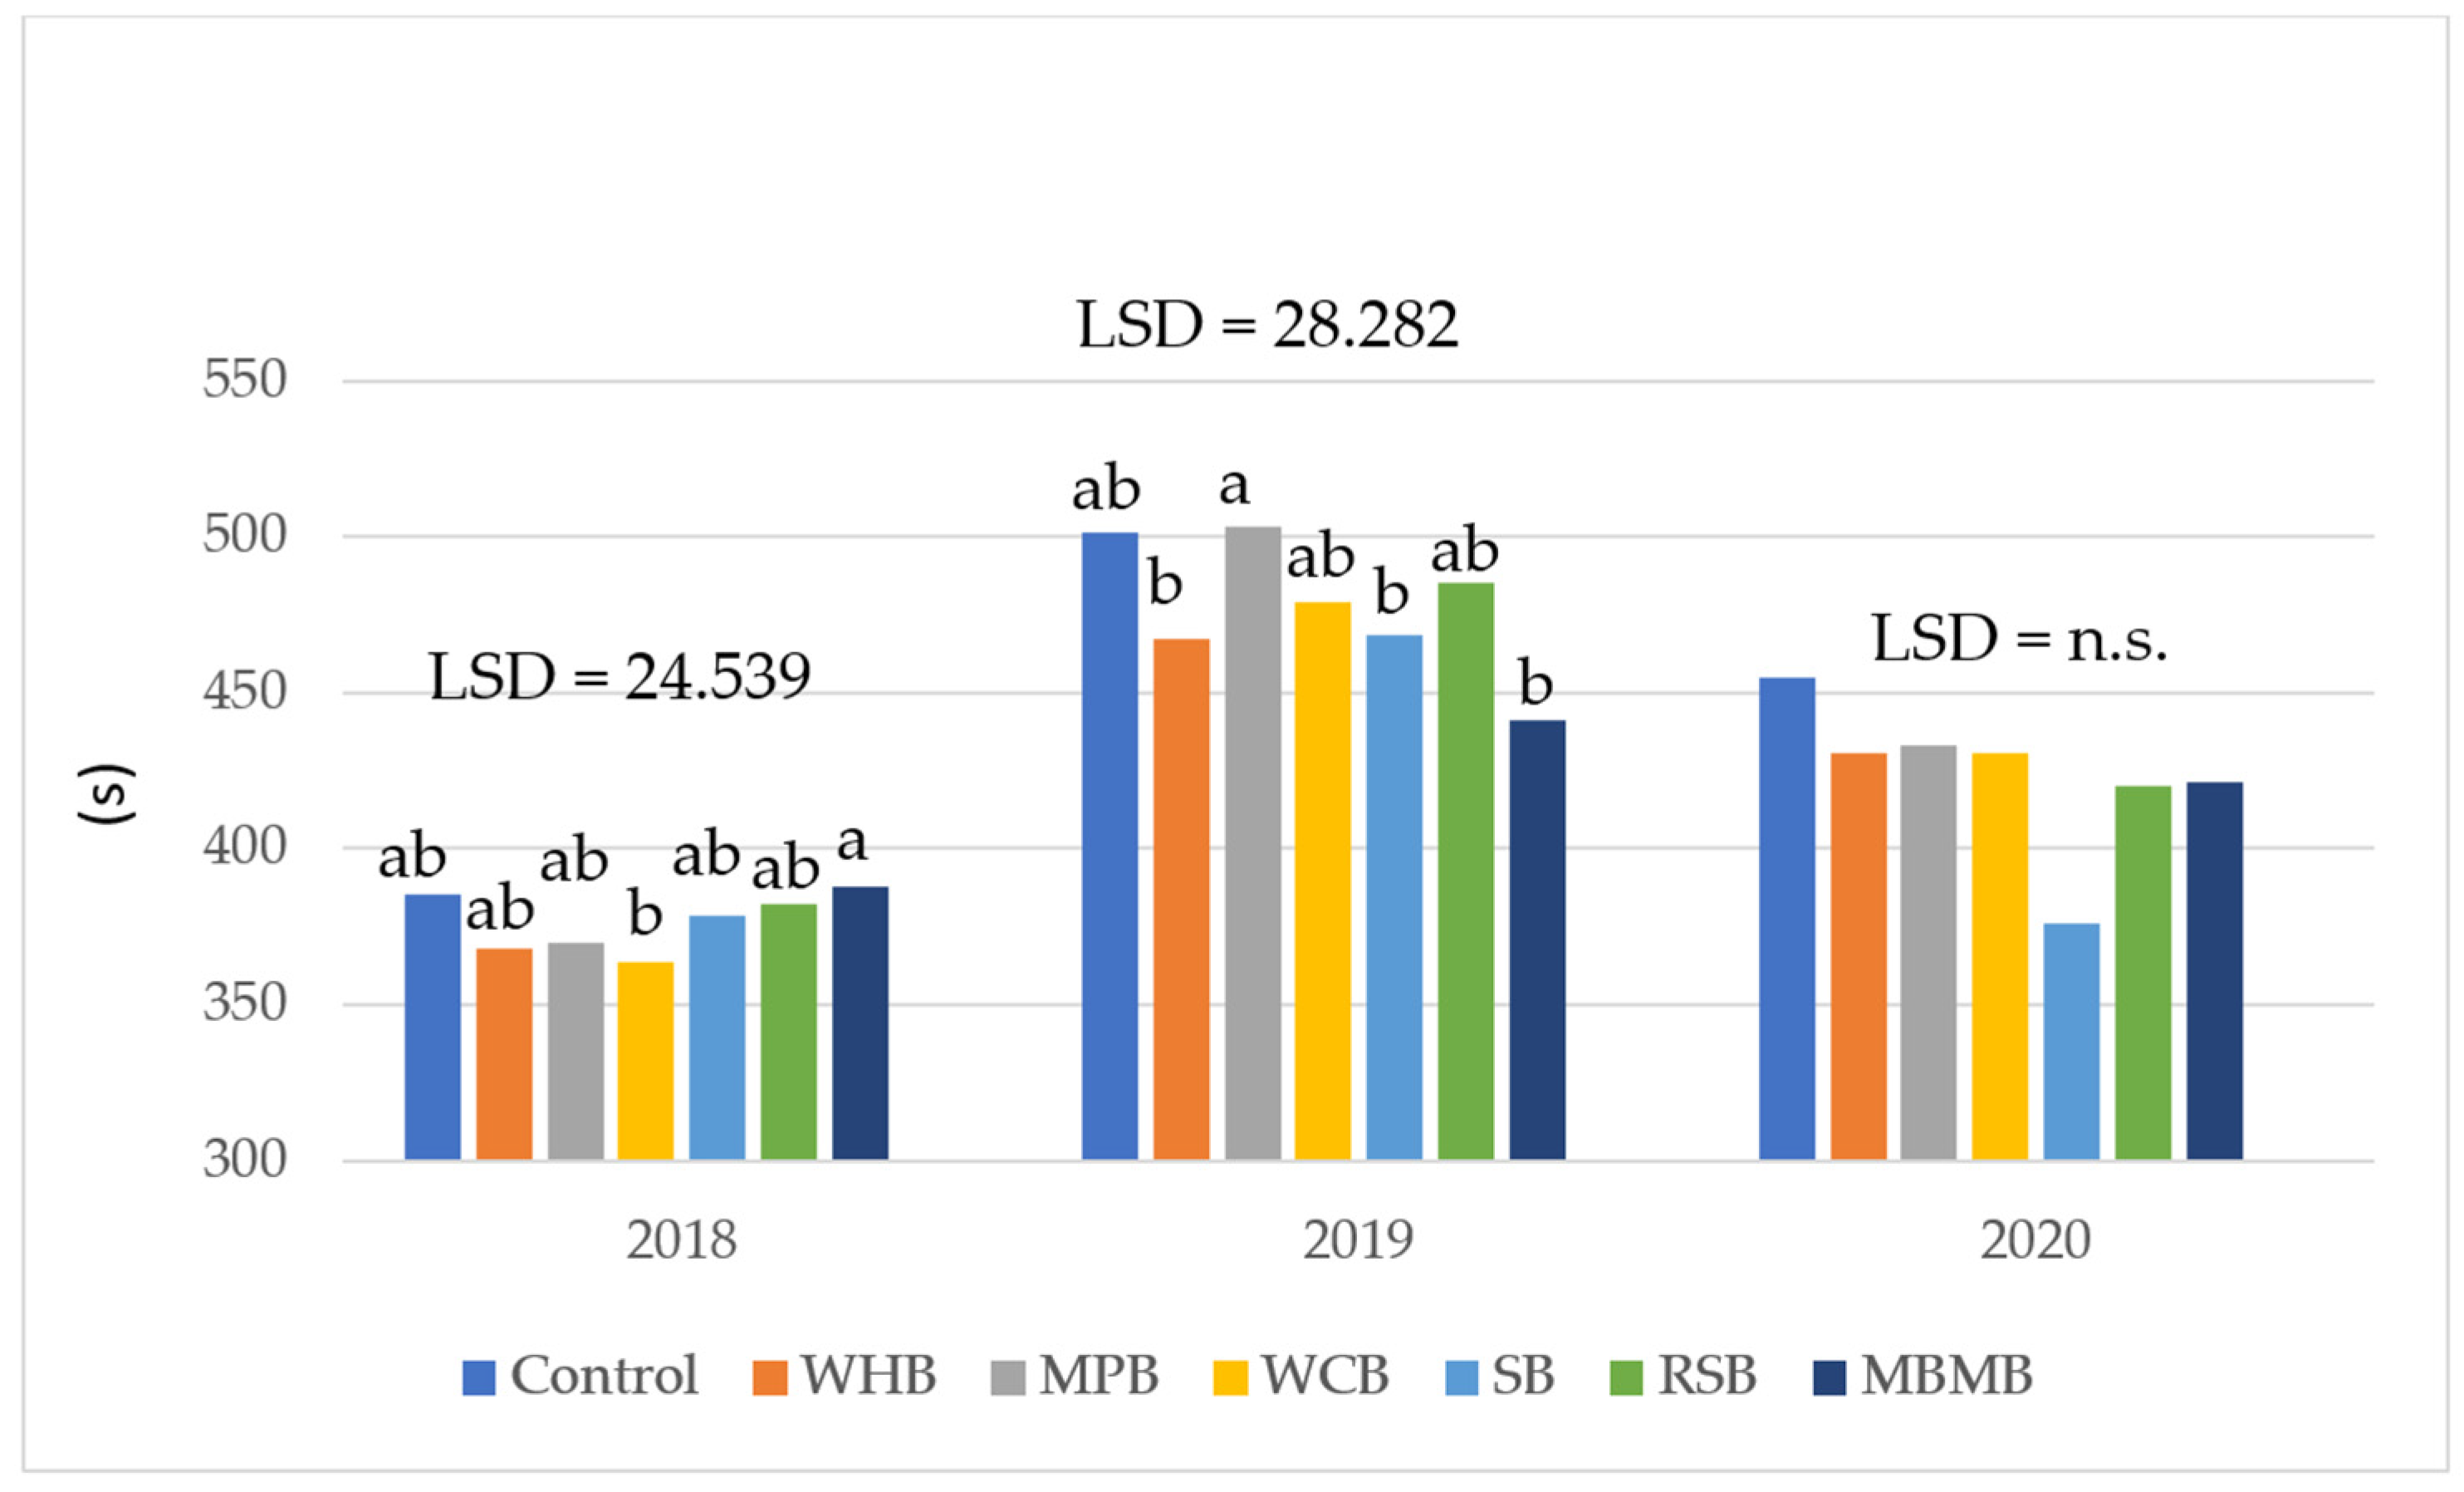
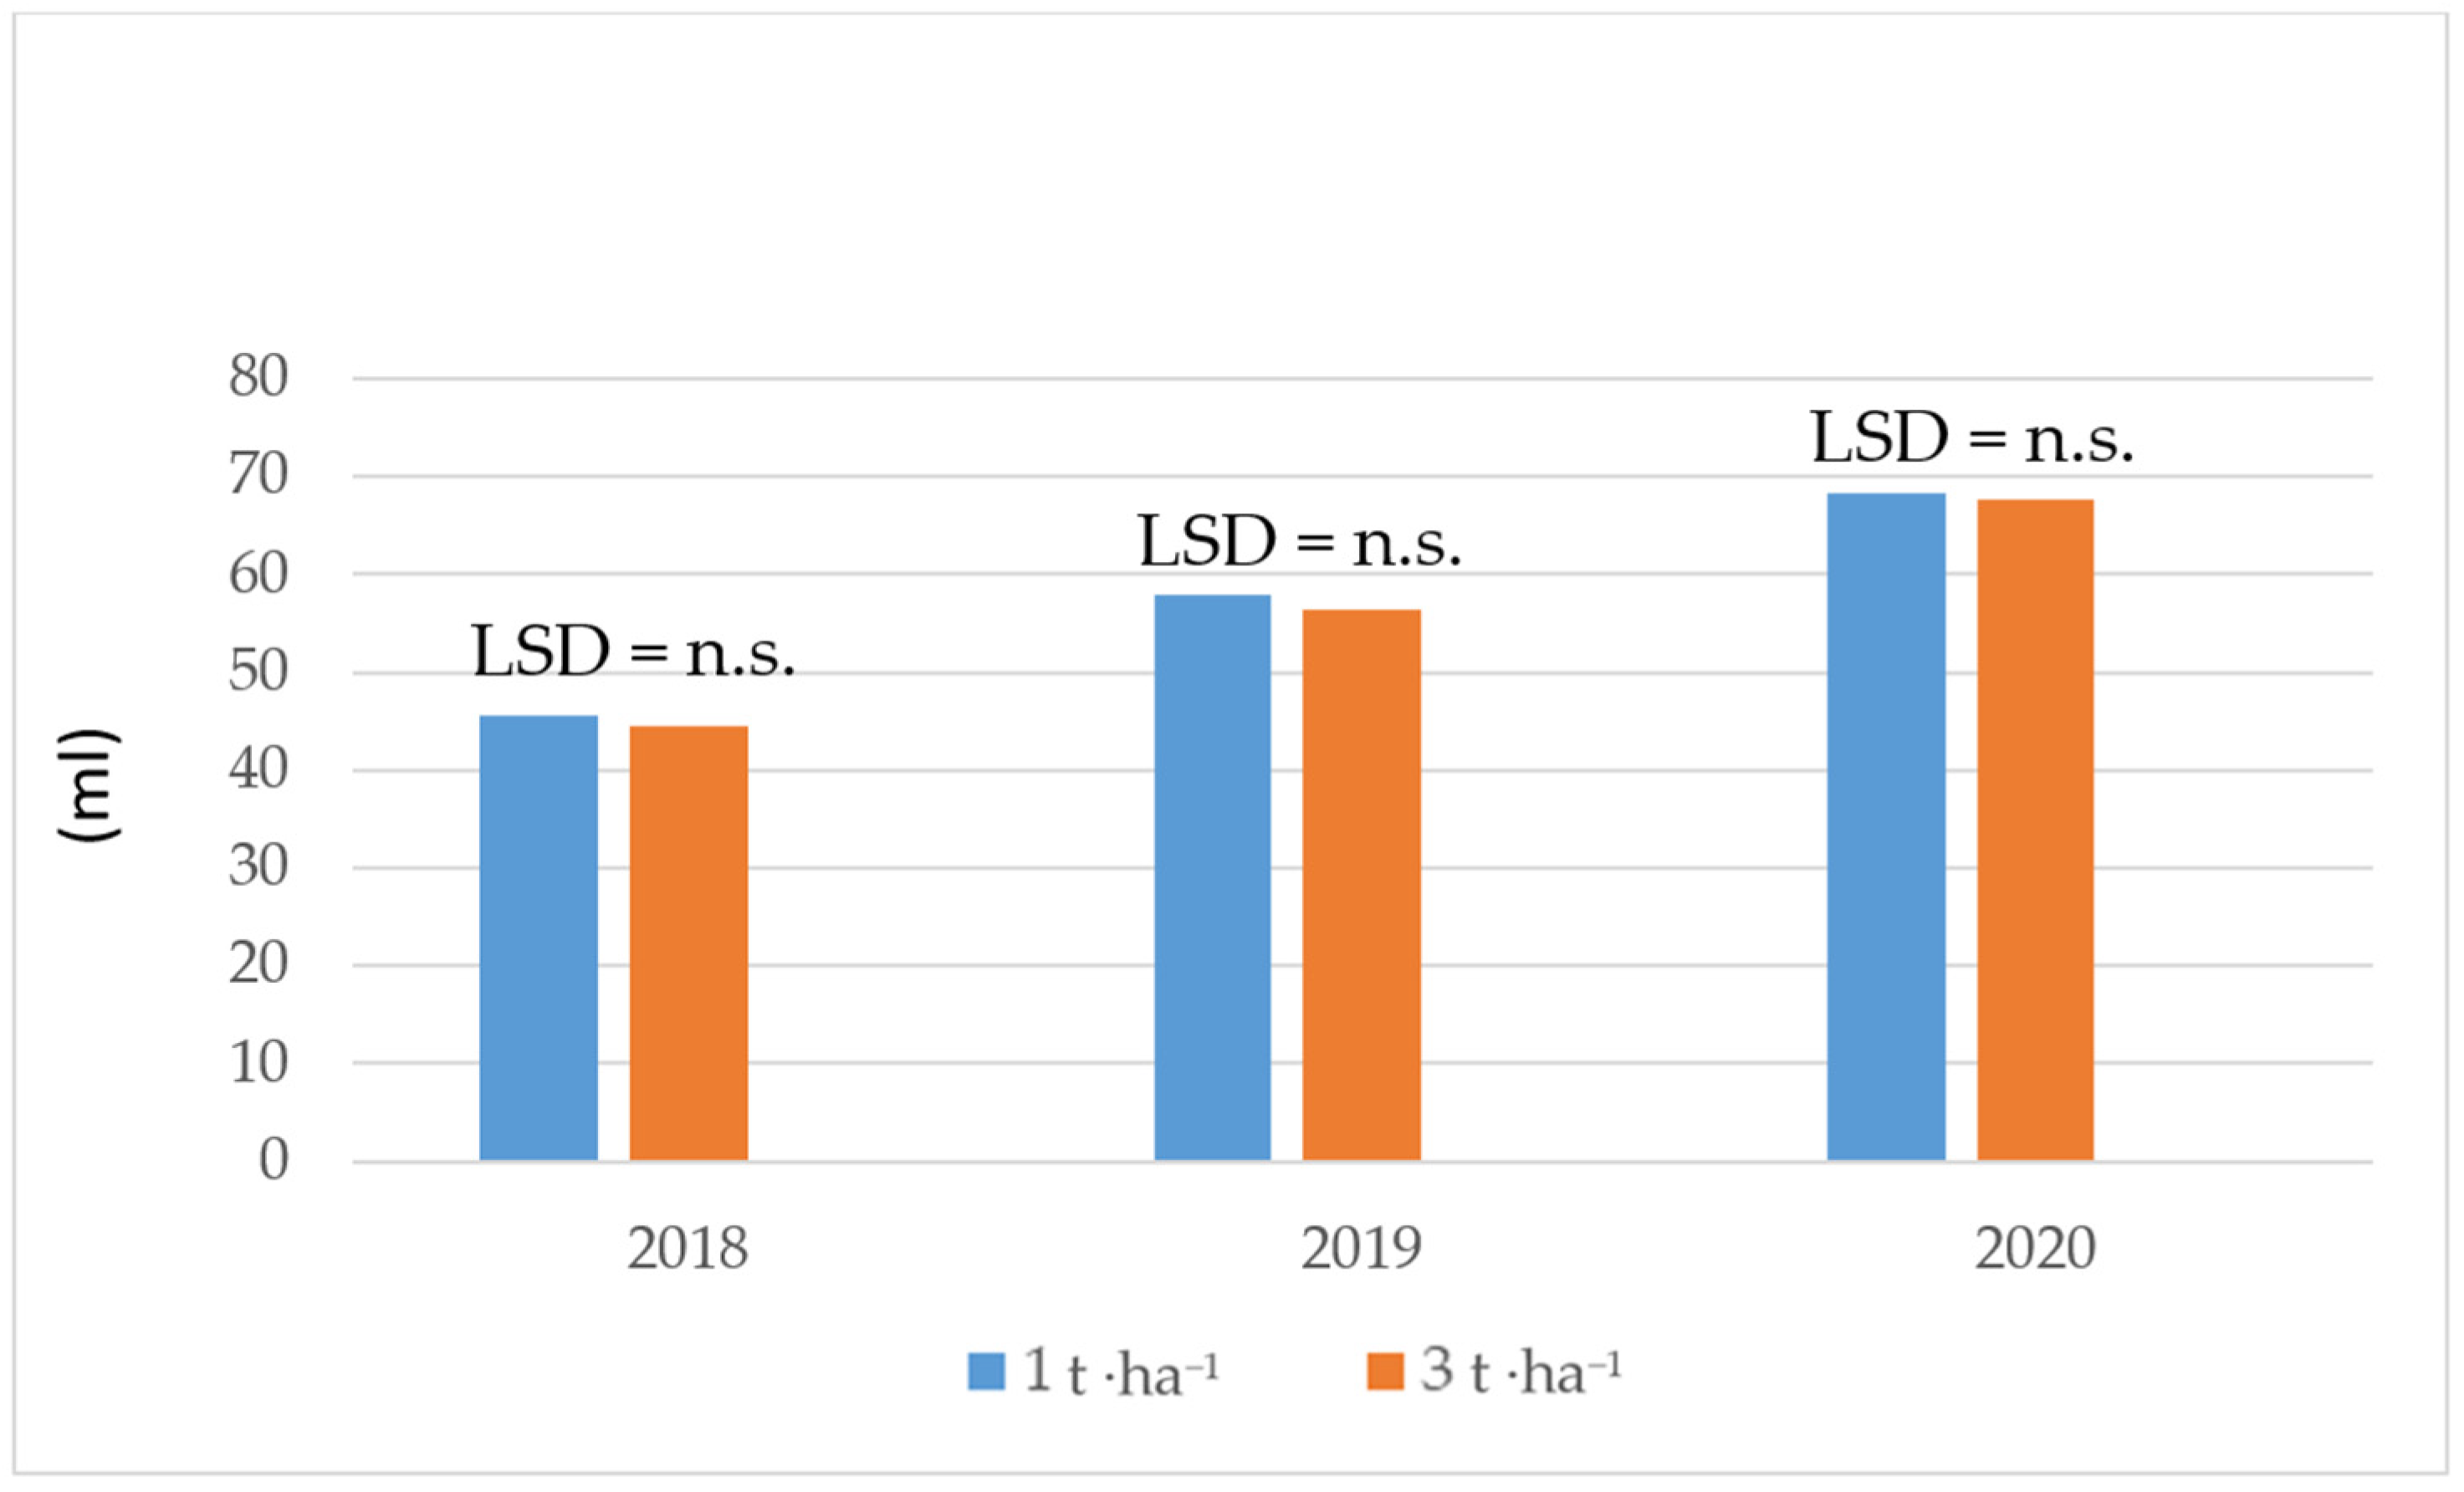
3.2.3. Grain Falling Number and Sedimentation Index

The falling number (FN) is a measure of alpha-amylase activity in grain and serves as an international standard of grain quality. It is determined through a test known as the Falling Number Test or Amylograph Test. This test is widely used in the flour milling and baking industries to assess the enzymatic activity that affects the quality of wheat and flour. High nitrogen fertilizer application can decrease the falling number due to increased alpha-amylase activity caused by the higher moisture of plant tissues. However, nitrogen application can also delay maturity, which may maintain a high falling number. The relationship between nitrogen application and alpha-amylase activity is complex and context-dependent [45]. Excessive nitrogen, especially if applied late in the growing season, can increase the risk of pre-harvest sprouting and affect enzyme activity [46]. Moreover, grain falling can be affected by weather conditions. Barnard and Smith [47] found a negative impact of rainfall during the late stages of grain development on FN for some of the tested cultivars. The falling number, according to Hruskova et al. [48], can be strongly affected by weather conditions, especially higher temperatures, which can be positively correlated with FN. In the present study, FN showed a tendency to reach higher values in 2019, with temperatures in June being the highest of the three years. However, at the same time, the average temperature in April and May 2019 was lower than in 2018 and 2020 (Table 2). This might show that temperatures, especially at the last development stages, can be crucial for the development of quality parameters.
The Zelleny sedimentation index relates to both the quality and quantity of protein in the grain and therefore has an impact on the quality of the bread obtained and, in particular, its structure. Its higher values are desirable, which can be promoted by, for example, nitrogen fertilization [49]. A high sedimentation rate should be combined with a high content of glutein proteins, especially glutein itself, which is particularly important for the baking industry [50]. In the present study, there was no effect of biocarbon dose on the value of the falling number (Figure 9), however falling number was significantly influenced by biocarbon type in 2018 and 2019 (Figure 10). The value of the Zelleny sedimentation index was not influenced by biocarbon dose (Figure 11). However, the type of biocarbon used significantly differentiated the Zelleny sedimentation index values between tested objects (Figure 12). Differences in falling numbers between different biochar types were found for 2018 and 2019. In 2018, MBMB had the highest value of falling numbers, whereas in 2019, MBMB biochar had the lowest value of falling numbers. This indicates that this parameter was strongly affected by other factors than biochar amendment type, most likely weather conditions. The biochar type used had a significant impact on the Zelleny sedimentation index in all three years of this study. In 2018, all tested objects showed low values of the index; however, the highest values were observed for the control object and MBMB biochar. In 2019, SB biochar had the highest value of the Zelleny index (biochar with one of the highest concentrations of nitrogen). In 2019, the MBMB biochar showed the lowest value of this parameter. In 2020, RSB biochar had the highest Zellenys sedimentation index (biochar with the lowest nitrogen content), while SB biochar had one of the highest values of this parameter. The results showed one more time that the impact of biochar type on grain quality parameters is visible but highly variable and dependent on external parameters. Zelleny’s sedimentation index, as a grain-falling number, can be strongly influenced by weather conditions [51]. Stepien and Wojtkowiak [52] found that higher N fertilization rates positively impact Zelleny’s sedimentation index. However, as in our study, biochars with the highest concentration of nitrogen (SB and RSB) had different results in Zelleny’s sedimentation index in different years, indicating weather as the most important driving factor for Zelleny’s sedimentation index values. As wheater conditions (minmal, maximal temperatures, rainfall, and humidity) have a strong impact on both falling number and sedimentation index, we assume that those parameters of wheat’s grain were strongly influenced by both weather conditions in the following years of this study, as well as nitrogen availability (modified by the type of biocarbon used), hence the large variations in this factor between years and between the types of biocarbon used.

4. Conclusions

The dose of biocarbon had little effect on the quantity or quality of winter wheat grain. Of the parameters tested, only the gluten content showed a positive response to a higher dose of biocarbon. The lack of a significant response from the other factors tested may be indirectly due to the deliberate selection of low doses of biocarbon treatments. In the literature, tested biochar doses are often 20 tons or even 30 tons per hectare. These are doses at which the effect of biocarbon is pronounced, but the unit cost of applying this treatment makes this treatment not feasible for everyone (the cost of 1 tonne of biochar was estimated by Nematian et al. [53] at USD $450, even up to USD $1850). Lower doses seem to be more realistic and thus worth testing. The type of biocarbon used, which was inversely related to the dose, had a significant effect on many of the parameters tested. This could have been influenced by the characteristics of the raw material, its physical properties (particularly the size of biochar particles) or chemical properties (carbon content, macro- and micronutrient content), and pH. SB biocarbon (Saw Dust biochar) showed rather good results for most of the parameters tested. Also, MBMB biochar showed interesting results, especially in terms of gluten content. It also showed a tendency to promote high grain yields. Those two types of biocarbons had different properties, especially in terms of carbon content. In addition, the MBMB was the biocarbon that were physically the finest (had the smallest size of particles), according to the authors’ data (no confirmation of this is in the table). In the present study, those two types of biochar can be recommended for further testing. Especially the low carbon content and high Nitrogen and Phosphorus content are the two parameters that could make SB biochar valuable for agricultural production. Tomczyk et al. [20] found that C content is higher in biochars produced at higher pyrolysis temperatures. Lower C content promotes higher ash and volatile solid contents. Moreover, sawdust is a waste that could possibly be obtained easily, in high amounts, and with a high rate of uniformity.

Author Contributions

M.W. was responsible for this study design and statistical analysis. A.K.B. and M.W. analyzed the data and wrote this paper. J.G. confirmed the methodology and coordinated this research. All authors participated in reviewing the manuscript and discussing the results. All authors have read and agreed to the published version of the manuscript.

Funding

This research received no external funding.

Institutional Review Board Statement

Not applicable.

Informed Consent Statement

Not applicable.

Data Availability Statement

The data presented in this study are available on request from the corresponding author. The data are not publicly available due to the internal rules of IUNG-PIB (the data owner).

Acknowledgments

This research was carried out as part of the independent, in-house scientific activity of IUNG-PIB.

Conflicts of Interest

The authors declare no conflicts of interest.

References

  1. Van Dijk, M.; Morley, T.; Rau, M.L.; Saghai, Y. A meta-analysis of projected global food demand and population at risk of hunger for the period 2010–2050. Nat. Food 2021, 2, 494–501. [Google Scholar] [CrossRef] [PubMed]
  2. Noel, S. Economics of Land Degradation Initiative: Report for Policy and Decision Makers_Reaping Economic and Environmental Benefits from Sustainable Land Management; ELD Initiative and Deutsche Gesellschaft für Internationale Zusammenarbeit (GIZ) GmbH: Bonn, Germany, 2015; ISBN 978-92-808-6063-4. [Google Scholar]
  3. Dorling, D. World population prospects at the UN: Our numbers are not our problem? In The Struggle for Social Sustainability; Policy Press: Bristol, UK, 2021; pp. 129–154. [Google Scholar] [CrossRef]
  4. Ladha, J.; Pathak, H.; Krupnik, T.; Six, J.; van Kessel, C. Efficiency of fertilizer nitrogen in cereal production: Retrospects and prospects. Adv. Agron. 2005, 87, 85–156. [Google Scholar] [CrossRef]
  5. Anioł, A. Wpływ biotechnologii i procesów globalizacji w gospodarce na hodowlę roślin i wspierające ten sektor badania naukowe. Biul. IHAR 2010, 256, 3–13. [Google Scholar] [CrossRef]
  6. Maron, P.A.; Lemanceau, P. Soil as a support of biodiversity and functions. In Soil Carbon: Science, Management and Policy for Multiple Benefits; CABI: Wallingford, UK, 2015; pp. 141–153. [Google Scholar] [CrossRef]
  7. Adhikari, K.; Hartemink, A.E. Linking soils to ecosystem services—A global review. Geoderma 2016, 262, 101–111. [Google Scholar] [CrossRef]
  8. Alhameid, A.; Tobin, C.; Maiga, A.; Kumar, S.; Osborne, S.; Schumacher, T. Intensified agroecosystems and changes in soil carbon dynamics. In Soil Health and Intensification of Agroecosytems; Academic Press: Cambridge, MA, USA, 2017; pp. 195–214. [Google Scholar] [CrossRef]
  9. Garratt, M.P.; Bommarco, R.; Kleijn, D.; Martin, E.; Mortimer, S.R.; Redlich, S.; Senapathi, D.; Steffan-Dewenter, I.; Świtek, S.; Takács, V.; et al. Enhancing soil organic matter as a route to the ecological intensification of European arable systems. Ecosystems 2018, 21, 1404–1415. [Google Scholar] [CrossRef]
  10. Bahuguna, A.; Sharma, S.; Yadav, J. Effect of different organic sources on physical, chemical and biological properties of soil in inceptisols of Varanasi. Int. J. Plant Soil Sc. 2021, 33, 41–52. [Google Scholar] [CrossRef]
  11. Wyzinska, M.; Smreczak, B. The influence of type and rate of biochar on productivity of winter wheat. In Proceedings of the 2019 International Conference “Engineering for Rural Development”, Jelgava, Latvia, 22–24 May 2019; pp. 594–599. [Google Scholar] [CrossRef]
  12. European Green Deal. Communication from the Commission to the European Parliament, the European Council, the Council, the European Economic and Social Committee and the Committee of the Regions the European Green Deal. Publications Office of the European Union; COM/2019/640 Final. Available online: https://eur-lex.europa.eu/legal-content/EN/TXT/?uri=COM:2019:640:FIN (accessed on 20 November 2023).
  13. EBC. European Biochar Certificate—Guidelines for a Sustainable Production of Biochar; European Biochar Foundation (EBC): Arbaz, Switzerland, 2012–2022; Available online: http://european-biochar.org (accessed on 20 November 2023).
  14. Malińska, K. Prawne i jakościowe aspekty dotyczące wymagań dla biowęgla. Inżynieria Ochr. Sr. 2015, 18, 359–371. [Google Scholar]
  15. Bis, Z. Biowęgiel–powrót do przeszłości, szansa dla przyszłości. Czysta Energia 2012, 6, 28–31. [Google Scholar]
  16. Sanchez, M.E.; Lindao, E.; Margaleff, D.; Martinez, O.; Moran, A. Pyrolysis of agricultural residues from rape and sunflower: Production and characterization of bio-fuels and biochar soil management. J. Anal. Appl. Pyrolysis 2009, 85, 142–144. [Google Scholar] [CrossRef]
  17. Kwapinski, W.; Byrne, C.M.P.; Kryachko, E.; Wolfram, P.; Adley, C.; Leahy, J.J.; Novotny, E.H.; Hayes, M.H.B. Biochar from Biomass and Waste. Waste Biomass Valorization 2010, 1, 177–189. [Google Scholar] [CrossRef]
  18. Ibarrola, R.; Shackely, S.; Hammond, J. Pyrolysis biochar systems for recovering biodegradable materials: A life cycle carbon assessment. Waste Manag. 2012, 32, 859–868. [Google Scholar] [CrossRef] [PubMed]
  19. Song, W.; Guo, M. Quality variations of poultry litter biochar generated at different pyrolysis temperatures. J. Anal. Appl. Pyrolysis 2012, 94, 138–145. [Google Scholar] [CrossRef]
  20. Tomczyk, A.; Sokołowska, Z.; Boguta, P. Biochar physicochemical properties: Pyrolysis temperature and feedstock kind effects. Rev. Environ. Sci. Biotechnol. 2020, 19, 191–215. [Google Scholar] [CrossRef]
  21. Dai, Z.; Xiong, X.; Zhu, H.; Xu, H.; Leng, P.; Li, J.; Tang, C.; Xu, J. Association of biochar properties with changes in soil bacterial, fungal and fauna communities and nutrient cycling processes. Biochar 2021, 3, 239–254. [Google Scholar] [CrossRef]
  22. Razzaghi, F.; Obour, P.B.; Arthur, E. Does biochar improve soil water retention? A systematic review and meta-analysis. Geoderma 2020, 361, 114055. [Google Scholar] [CrossRef]
  23. Hossain, M.Z.; Bahar, M.M.; Sarkar, B.; Donne, S.W.; Ok, Y.S.; Palansooriya, K.N.; Kirkham, M.B.; Chowdhury, S.; Bolan, N. Biochar and its importance on nutrient dynamics in soil and plant. Biochar 2020, 2, 379–420. [Google Scholar] [CrossRef]
  24. Różyło, K.; Świeca, M.; Gawlik-Dziki, U.; Stefaniuk, M.; Oleszczuk, P. The potential of biochar for reducing the negative effects of soil contamination on the phytochemical properties and heavy metal accumulation in wheat grain. Agric. Food Sci. 2017, 26, 34–46. [Google Scholar] [CrossRef]
  25. Medyńska-Juraszek, A.; Rivier, P.A.; Rasse, D.; Joner, E.J. Biochar affects heavy metal uptake in plants through interactions in the rhizosphere. Appl. Sci. 2020, 10, 5105. [Google Scholar] [CrossRef]
  26. Nkoh, J.N.; Ajibade, F.O.; Atakpa, E.O.; Abdulaha-Al Baquy, M.; Mia, S.; Odii, E.C.; Xu, R. Reduction of heavy metal uptake from polluted soils and associated health risks through biochar amendment: A critical synthesis. J. Hazard. Mater. Adv. 2022, 6, 100086. [Google Scholar] [CrossRef]
  27. Różewicz, M.; Grabiński, J.; Wyzińska, M. Wpływ metody strip-till na plonowanie i jakośc ziarna pszenicy ozimej w zależności od odmiany i zakresu uprawy pożniwnej Część II. Jakość ziarna. Agron. Sci. 2023, 78, 19–28. [Google Scholar] [CrossRef]
  28. PN-68/R-74017; Cereals and Pulses—Determinationa of the Mass Od 1000 Grains. Polish Committee for Standardization: Warsaw, Poland, 1968.
  29. PN-EN ISO 3093:2010; Wheat, Rye and Flours Derived from Them—Durum Wheat and Semolina. Determination of Falling Number by the Hagberg-Perten Method. Polish Committee for Standardization: Warsaw, Poland, 2010.
  30. PN-A-74042-03:1993/Az1:1996; Cereal Grains and Cereal Products—Determination of Wet Gluten by Mechanical Equipment. Wheat Flour. Polish Committee for Standardization: Warsaw, Poland, 1996.
  31. PN-EN ISO 5529:2010; Wheat—Determination of Sedimentation Rate. Zeleny Test. Polish Committee for Standardization: Warsaw, Poland, 2010.
  32. Lilli, M.A.; Paranychianakis, N.V.; Lionoudakis, K.; Saru, M.L.; Voutsadaki, S.; Kritikaki, A.; Komnitsas, K.; Nikolaidis, N.P. Characterization and Risk Assessment of Different-Origin Biochars Applied in Agricultural Experiments. Sustainability 2023, 15, 9036. [Google Scholar] [CrossRef]
  33. Gebremedhin, G.H.; Halieselassie, B.; Berhe, D.; Belay, T. Effect of biochar on yield and yield components of wheat and post-harvest soil properties in Tigray, Ethiopia. J. Fertil. Pestic. 2015, 6, 2. [Google Scholar] [CrossRef]
  34. Khan, M.A.; Basir, A.; Fahad, S.; Adnan, M.; Saleem, M.H.; Iqbal, A.; Al-Huqail, A.A.; Alosaimi, A.A.; Saud, S.; Liu, K.; et al. Biochar optimizes wheat quality, yield, and nitrogen acquisition in low fertile calcareous soil treated with organic and mineral nitrogen fertilizers. Front. Plant Sci. 2022, 13, 879788. [Google Scholar] [CrossRef] [PubMed]
  35. Akhtar, S.S.; Andersen, M.N.; Liu, F. Residual effects of biochar on improving growth, physiology and yield of wheat under salt stress. Agric. Water Manag. 2015, 158, 61–68. [Google Scholar] [CrossRef]
  36. Ali, K.; Wang, X.; Riaz, M.; Islam, B.; Khan, Z.H.; Shah, F.; Munsif, F.; Haq, S.I.U. Biochar: An eco-friendly approach to improve wheat yield and associated soil properties on sustainable basis. Pak. J. Bot. 2019, 51, 1255–1261. [Google Scholar] [CrossRef]
  37. Dawar, K.; Fahad, S.; Alam, S.S.; Khan, S.A.; Dawar, A.; Younis, U.; Danish, S.; Datta, R.; Dick, R.P. Influence of variable biochar concentration on yield-scaled nitrous oxide emissions, Wheat yield and nitrogen use efficiency. Sci. Rep. 2021, 11, 16774. [Google Scholar] [CrossRef] [PubMed]
  38. Khan, Z.; Rahman, M.H.U.; Haider, G.; Amir, R.; Ikram, R.M.; Ahmad, S.; Schofield, H.K.; Riaz, B.; Iqbal, R.; Fahad, S.; et al. Chemical and biological enhancement effects of biochar on wheat growth and yield under arid field conditions. Sustainability 2021, 13, 5890. [Google Scholar] [CrossRef]
  39. Zhu, X.; Chen, L.; Kong, X.; Bao, S.; Wu, S.; Fang, L.; Shen, Y. Biochar alters the morphology of plant roots to enable optimized and reduced nitrogen fertilizer applications. Plant Soil 2023, 492, 655–673. [Google Scholar] [CrossRef]
  40. Billah, M.M.; Ahmad, W.; Ali, M.; Khan, F. Effect of biochar particle size and biofertilizers on lentil (Lense culinarous M.) yield and available fractions of soil nutrients. Soil Environ. 2018, 37, 143–151. [Google Scholar]
  41. Litke, L.; Gaile, Z.; Ruža, A. Effect of nitrogen fertilization on winter wheat yield and yield quality. Agron. Res. 2018, 16, 500–509. [Google Scholar] [CrossRef]
  42. Selivanovskaya, S.; Galitskaya, P.; Mukharamova, S.; Gordeev, A.; Kanunnikov, K. Biochar From Chicken Manure Enriched With Iodine. In Proceedings of the 19th International Multidisciplinary Scientific GeoConference SGEM, Albena, Bulgaria, 28 June–6 July 2019; pp. 59–66. [Google Scholar] [CrossRef]
  43. Shahzad, K.; Abid, M.; Sintim, H.Y.; Hussain, S.; Nasim, W. Tillage and biochar effects on wheat productivity under arid conditions. Crop Sci. 2019, 59, 1191–1199. [Google Scholar] [CrossRef]
  44. Kraska, P.; Andruszczak, S.; Oleszczuk, P.; Świeca, M.; Kwiecińska-Poppe, E.; Gierasimiuk, P.; Różyło, K.; Pałys, E. The content of elements and quality parameters of winter rye grain as influenced by biochar-amended soil. Zemdirbyste-Agric. 2018, 105, 11–20. [Google Scholar] [CrossRef]
  45. Gooding, M.J.; Kettlewell, P.S.; Davies, W.P.; Hocking, T.J. Effects of spring nitrogen fertilizer on the Hagberg falling number of grain from breadmaking varieties of winter wheat. J. Agric. Sci. 1986, 107, 475–477. [Google Scholar] [CrossRef]
  46. Silva, R.R.; Zucareli, C.; Fonseca IC, D.B.; Riede, C.R.; Gazola, D. Nitrogen management, cultivars and growing environments on wheat grain quality. Rev. Bras. Eng. Agrícola Ambient. 2019, 23, 826–832. [Google Scholar] [CrossRef]
  47. Barnard, A.; Smith, M.F. Determination of the influence of climate on falling number of winter wheat in the dryland production areas of the Free State Province of South Africa. Euphytica 2012, 188, 15–24. [Google Scholar] [CrossRef]
  48. Hrušková, M.; Škodová, V.; Blažek, J. Wheat sedimentation values and falling number. Czech J. Food Sci. 2004, 22, 51. [Google Scholar] [CrossRef]
  49. Knapowski, T.; Ralcewicz, M.; Spychaj-Fabisiak, E.; Ložek, O. Ocena jakości ziarna pszenicy ozimej uprawianej w warunkach zróżnicowanego nawożenia azotem. Fragm. Agron. 2010, 27, 73–80. [Google Scholar]
  50. Murawska, B.; Spychaj-Fabisiak, E.; Keutgen, A.; Wszelaczyńske, E.; Pobereży, J. Cechy technologiczne badanych odmian ziarna pszenicy ozimej uprawianych w warunkach Polski i Wielkiej Brytanii. Inżynieria Apar. Chem. 2014, 2, 96–98. [Google Scholar]
  51. Liana, A.; Alda, S.; Fora, C.; Diana, M.; Gogoasa, I.; Bordean, D.; Cârciu, G.; Cristea, T. Climatic conditions influence on the variation of quality indicators of some Romanian and foreign winter wheat cultivars. J. Hortic. For. Biotechnol. 2012, 16, 68–72. [Google Scholar]
  52. Stepien, A.; Wojtkowiak, K. Evaluation of the effect of different levels of nitrogen and manganese fertiliser on the yield, macronutrient content and technological properties of winter wheat. J. Elementol. 2019, 24, 661–675. [Google Scholar] [CrossRef]
  53. Nematian, M.; Keske, C.; Ng’ombe, J.N. A techno-economic analysis of biochar production and the bioeconomy for orchard biomass. Waste Manag. 2021, 135, 467–477. [Google Scholar] [CrossRef]
Figure 1. Winter wheat grain yield (g per pot) depends on the biochar rate (g per pot).
Agriculture 14 00039 g001
Figure 2. Winter wheat grain yield (g per pot) in the following years of the experiment, depending on the biochar type. Different lowercase letters indicate statistically significant differences between biochar types.
Agriculture 14 00039 g002
Figure 3. Winter wheat weight of 1000 grains (g) in the following years of the experiment, depending on the biochar dose.
Agriculture 14 00039 g003
Figure 4. Winter wheat weight of 1000 grains (g) in the following years of the experiment, depending on the biochar type. Different lowercase letters indicate statistically significant differences between biochar types.
Agriculture 14 00039 g004
Figure 5. Winter wheat wet gluten content (%) in the following years of the experiment, depending on the biochar dose. Different lowercase letters indicate statistically significant differences between biochar doses.
Agriculture 14 00039 g005
Figure 6. Winter wheat wet gluten content (%) in the following years of the experiment, depending on the biochar type. Different lowercase letters indicate statistically significant differences between biochar types.
Agriculture 14 00039 g006
Figure 7. Winter wheat gluten index in the following years of the experiment, depending on the biochar dose.
Agriculture 14 00039 g007
Figure 8. Winter wheat gluten index in the following years of the experiment, depending on the biochar type. Different lowercase letters indicate statistically significant differences between biochar types.
Agriculture 14 00039 g008
Figure 9. Winter wheat falling number (s) in the following years of the experiment, depending on the biochar dose.
Agriculture 14 00039 g009
Figure 10. Winter wheat falling number (s) in the following years of the experiment, depending on the biochar type. Different lowercase letters indicate statistically significant differences between biochar types.
Agriculture 14 00039 g010
Figure 11. Winter wheat Zelleny sedimentation value (ml) in the following years of the experiment, depending on the biochar doses.
Agriculture 14 00039 g011
Figure 12. Winter wheat gluten value (ml) in the following years of the experiment, depending on the biochar type. Different lowercase letters indicate statistically significant differences between biochar types.
Agriculture 14 00039 g012
Table 1. Chemical composition of the tested biochar.
Type of BiocharTotal Carbon (%)N (%)S (%)P (%)pHPyrolysis Temperature (°C)Time of Pyrolysis (min)
WHB70.83.90.0740.3208.50550nd 1
MPB63.51.80.8900.09510.00600nd
WCB67.62.4<0.1000.3306.795004–7
SB42.63.60.2244.4206.78550240
RSB70.51.20.1460.2609.65550180
MBMB75.61.90.1360.1208.32550240
1 nd—no data (the producer did not provide it in the certificate).
Table 2. Monthly temperatures during the subsequent year of the experiment and multi-year annual (1981–2010) (°C).
Month2017/20182018/20192019/20201981–2010
IX14.115.514.413.3
X9.510.010.88.0
XI4.54.26.42.7
XII2.40.93.1−1.4
I0.6−2.41.7−3.3
II−3.52.93.4−2.3
III0.35.74.71.6
IV13.910.08.98.7
V17.713.911.914.5
VI19.622.719.117.2
VII21.019.419.319.5
VIII21.120.420.317.8
Disclaimer/Publisher’s Note: The statements, opinions and data contained in all publications are solely those of the individual author(s) and contributor(s) and not of MDPI and/or the editor(s). MDPI and/or the editor(s) disclaim responsibility for any injury to people or property resulting from any ideas, methods, instructions or products referred to in the content.

