Abstract
For years, efforts have been devoted to establishing an effective bull breeding soundness evaluation procedure; usual research on this subject is based on bull breeding soundness examination (BBSE) methodologies, which have significant limitations in terms of their evaluation procedure, such as their high cost, time consumption, and administrative difficulty, as well as a lack of diagnostic laboratories equipped to handle the more difficult cases. This research focused on the creation of a prediction model to supplement and/or improve the BBSE approach through the study of two algorithms, namely, clustering and artificial neural networks (ANNs), to find the optimum machine learning (ML) approach for our application, with an emphasis on data categorization accuracy. This tool was designed to assist veterinary medicine and farmers in identifying key factors and increasing certainty in their decision-making during the selection of bulls for breeding purposes, providing data from a limited number of factors generated from a deep pairing study of bulls. Zebu, European, and crossbred bulls were the general groupings. The data utilized in the model’s creation (N = 359) considered five variables that influence improvement decisions. This approach enhanced decision-making by 12% compared to traditional breeding bull management. ANN obtained an accuracy of 90%, with precision rates of 97% for satisfactory, 92% for unsatisfactory, and 85% for bad. These results indicate that the proposed method can be considered an effective alternative for innovative decision-making in traditional BBSE.
1. Introduction
Bulls have a significant impact on herd reproductive efficiency, independent of the reproductive strategy used, namely, natural, controlled mating, or artificial insemination. As a result, an absence of or decrease in bull fertility reduces productive parameters, which may reduce farm profitability, particularly in extensive livestock production systems. In certain cases, fertility refers not only to the semen characteristics but also to the bull’s capability to deliver enough pregnancies even under difficult environmental conditions, including natural mounts. Breeding programs for beef and dual-purpose cattle are prevalent in tropical countries to increase calf numbers and sell weight [1]. Livestock production in Veracruz began in the early stages of Spanish colonization in the 15th century with the introduction of animals from southern Spain (Bos taurus), which originated the Creole cattle population [2]. Since the 1950s, Bos indicus cattle (Indo-Brazil and Brahman) and Bos taurus cattle (Brown Swiss, Holstein, Charolais, and Simmental) from Brazil have been introduced to improve production performance through progressive adaptation to environmental conditions [3,4]. To maintain agricultural profitability, bulls must be extremely fertile in all respects within the region’s extensive farming system. Highly fertile bulls can achieve a pregnancy rate of more than 60% in females with acceptable reproductive activity; a bull breeding soundness examination (BBSE) is required to achieve this [5,6]. BBSE is a procedure that decreases risk while improving strategic bull use and herd fertility [7]. BBSE comprises biometric data, namely, scrotal circumference (SC) and semen analysis (sperm concentration, motility, and morphology), but it fails to include behavior (libido), even though this parameter may be used to predict prospective bull fertility [8]. The need for tools that promote a more objective and quantifiable assessment and measurement of behavior is not new [9]. Recognizing technology’s potential will not only empower the human observer in terms of the accuracy and volume of processed data but also lead to the discovery of behavioral characteristics that are inaccessible through simple human observation. A predictive model’s objective is to make accurate predictions from previously unseen data; thus, data mining and its application in animal husbandry have been studied [10], whereby authors have emphasized the complexity of the structure of animal husbandry management systems, with multiple problems due to the large volume of information. Machine learning (ML) can assist in the creation of prediction models by analyzing substantial amounts of data and providing a decision-making baseline. Sensors, cloud computing, artificial intelligence (AI), and, specifically, ML are already revolutionizing various sectors and bringing advantages. AI- and cognitive-based technologies are the most disruptive and significant advanced analytic tools for supply chain decision-making [11,12]. Intelligent systems integrate many technologies [13], and ML, which is a branch of AI algorithms, is used to identify patterns in data. ML is frequently used as a decision-making tool in the sustainable agriculture supply chain [14]. Digitalization sets up a massive volume of data in supply chains, which is meaningless unless relevant information is categorized, interpreted, and gathered using appropriate data analysis tools [15,16,17,18]. In recent years, ML algorithms have been employed in the field of agriculture, attempting to solve problems such as cattle concerns [19] and forecasting different temperatures in piglets [20]. Additionally, ML has been employed to examine the complexity of livestock reproduction dynamics, which is often influenced by genetic factors, as demonstrated in previous works [21], wherein K-means algorithms played a pivotal role in the analyses and findings.
ML is divided into several subcategories, depending on its approach, two of which are supervised learning and unsupervised learning algorithms. To learn to distinguish classes, supervised learning algorithms require the data to be labeled by an expert. The dataset is split into two (or three) parts: training data, validation data, and test data. The model is trained using data from the first set, and its performance is assessed with test and/or validation data. Once trained and evaluated, the model may be used to generate predictions based on test data. Unsupervised learning algorithms, also known as clustering algorithms, set up values into a defined number of classes based on the similarity distance between variables in the presented data, and one of the best-known algorithms is K-means. This algorithm establishes k seeds on n-dimensional features obtained from data and then generates clusters that are proximal to each other. Artificial neural networks (ANNs), however, are supervised algorithms that use labeled data; this labeling is made (mostly) by human experts and serves as a guide for adjusting its parameters until it fits the training data. It is important to compare both approaches to make a more informed decision about which technique is more suitable for the problems, data, and objectives. This paper utilized both ML algorithms to compare the behavioral and productive trait determinants of bull survival in Mexico’s tropical altitudes. With this insight, it is feasible to design appropriate animal breeding and management approaches to reduce bull mortality rates. To the best of the authors’ knowledge, there is no ML application dedicated to bull breeding classification. The main contribution of this work is the machine learning automation of bull breeding classification for reproductive efficiency based on morphological, behavioral, and semen quality data.
2. Materials and Methods
2.1. Animals
The Animal Biology Reproduction Laboratory and the Cell Biology Laboratory of Veracruz University utilized a bull breeding soundness examination (N = 359). Oliveira et al. [22] recommended assigning the genetic groupings to be evaluated. Zebu bulls (n = 73), “Bos indicus” bulls (Gyr and Brahman), European bulls (n = 136), “Bos taurus” bulls (Brown Swiss, Holstein, Charolais, and Simmental), and crossbreed bulls (n = 150) (Holstein × Zebu, Brown Swiss × Zebu, synthetic breed bulls × Ze; Beef Master, Brahman × Hereford × Shorthorn). All bulls aged 1–8 years were fed under an extensive grazing system that grazed Cynodon nlemfuensis and Brachiaria humidicola grasses [23,24], with no evident health impairment at the time of evaluation. During the 2018–2019 period, animal and semen samples were collected and evaluated on farms.
It is important to note that each herd consisted of 25–30 cows on average, and it had its own bull. A measure of the successful service of each bull can be determined by the pregnancy rate [25]. The pregnancy rate was determined by dividing the total number of pregnant cows evaluated per bull (see Table 1). The calving interval was calculated as the number of days between the birth of one calf and the birth of the next one, both from the same cow. This information was derived from herd productive and reproductive records, considering the time each bull remained in the herd [25,26].

Table 1.
BBSE descriptive analysis in each local genetic group, showing the average and standard mean error.
2.2. Morphological and Behavioral Evaluation
The Society for Theriogenology’s Manual for Breeding Soundness Examination (BBSE) in Bulls was followed [27]. Body condition scores (1–5 scale) were evaluated in each bull using the approach published by [28]. Scrotal circumference was measured in each bull using the technique provided by [29]. The technique established by [7,30] was used to rate libido (0–10 scale); a score of 0 represents no interest of the cows in the bull, while 10 represents four services from the bull to the cow. Identifying a proper set of variables correlating bull breading reproductive efficiency based on morphological, behavioral, and semen quality evaluation is a challenging task. The most relevant variables are depicted in Table 2 [27].
Table 2.
Variables for BBSE.
2.3. Semen Quality Evaluation
The semen samples were collected from January 2018 to December 2019, and each one was assessed in the field within five minutes of being collected. Semen was obtained in a test tube with a graduation of 1–15 mL, and volume, color, and density were evaluated macroscopically [7,30]. A three-electrode probe (Minitube, Verona, WI, USA; Ø: 2″/5.08 cm; length: 33 cm) was used to try electro-ejaculation to obtain a semen sample from each bull. No more than one electro-ejaculation attempt was undertaken on each bull during each examination session [34]. The sperm motility of the semen sample was promptly examined, and the materials in contact with the sperm were of the same temperature as the sperm (to minimize temperature shock), clean, dry, and non-toxic. Individual motility was measured in a sample that had been diluted with a warmed saline solution. At 37 °C, a drop of diluted sperm was deposited on a thermoplatin slide, covered with a coverslip, and examined at 40X. The fraction of sperm traveling progressively across the field of vision was calculated by locating multiple groups of ~10 sperm and estimating how many were progressive against how many were not [32]. Sperm concentration (×106/mL) was determined using a spectrophotometric technique. Once the sample was obtained, a drop of undiluted semen was taken and placed in the micro-cuvette for SDM-1 (Minitube®) with a capacity of 2 µL, then inserted into an SDM-1 photometer (Minitube®) calibrated for bovine, and, finally, the reading provided by the screening equipment was obtained [31]. Semen density was categorized as very good (creamy, 4), of grainy consistency with 750–1000 × 106/mL, good (milk-like, 3) with 450–750 × 106/mL, fair (skim milk-like, 2) with 250–450 × 106/mL, and poor (translucent, 1) with <250 × 106/mL [33]. A study of the complete set of characteristics specified in Table 1 was required to determine a higher classification accuracy and to identify the satisfactory, unsatisfactory, and bad elements from the genetic group, analyzing their correlations and effects on a clear classification. It is important to highlight that gross motility, color, and density were not selected for the analysis, given the high subjectivity of such tests.
2.4. Machine Learning Analysis
Traditionally, farmers and bull breeding experts perform subjective bull breeding classifications based on the above data provided by veterinarians. This approach has been effective but can be greatly improved using modern machine learning, data analysis tools, and pattern recognition techniques. Nonetheless, in real-world applications, such data might not be ideal, rendering challenges incomplete or resulting in unbalanced data. In Mexico, this difficulty arises from the fact that the local bull sperm market is not relevant; therefore, data availability is hard to determine.
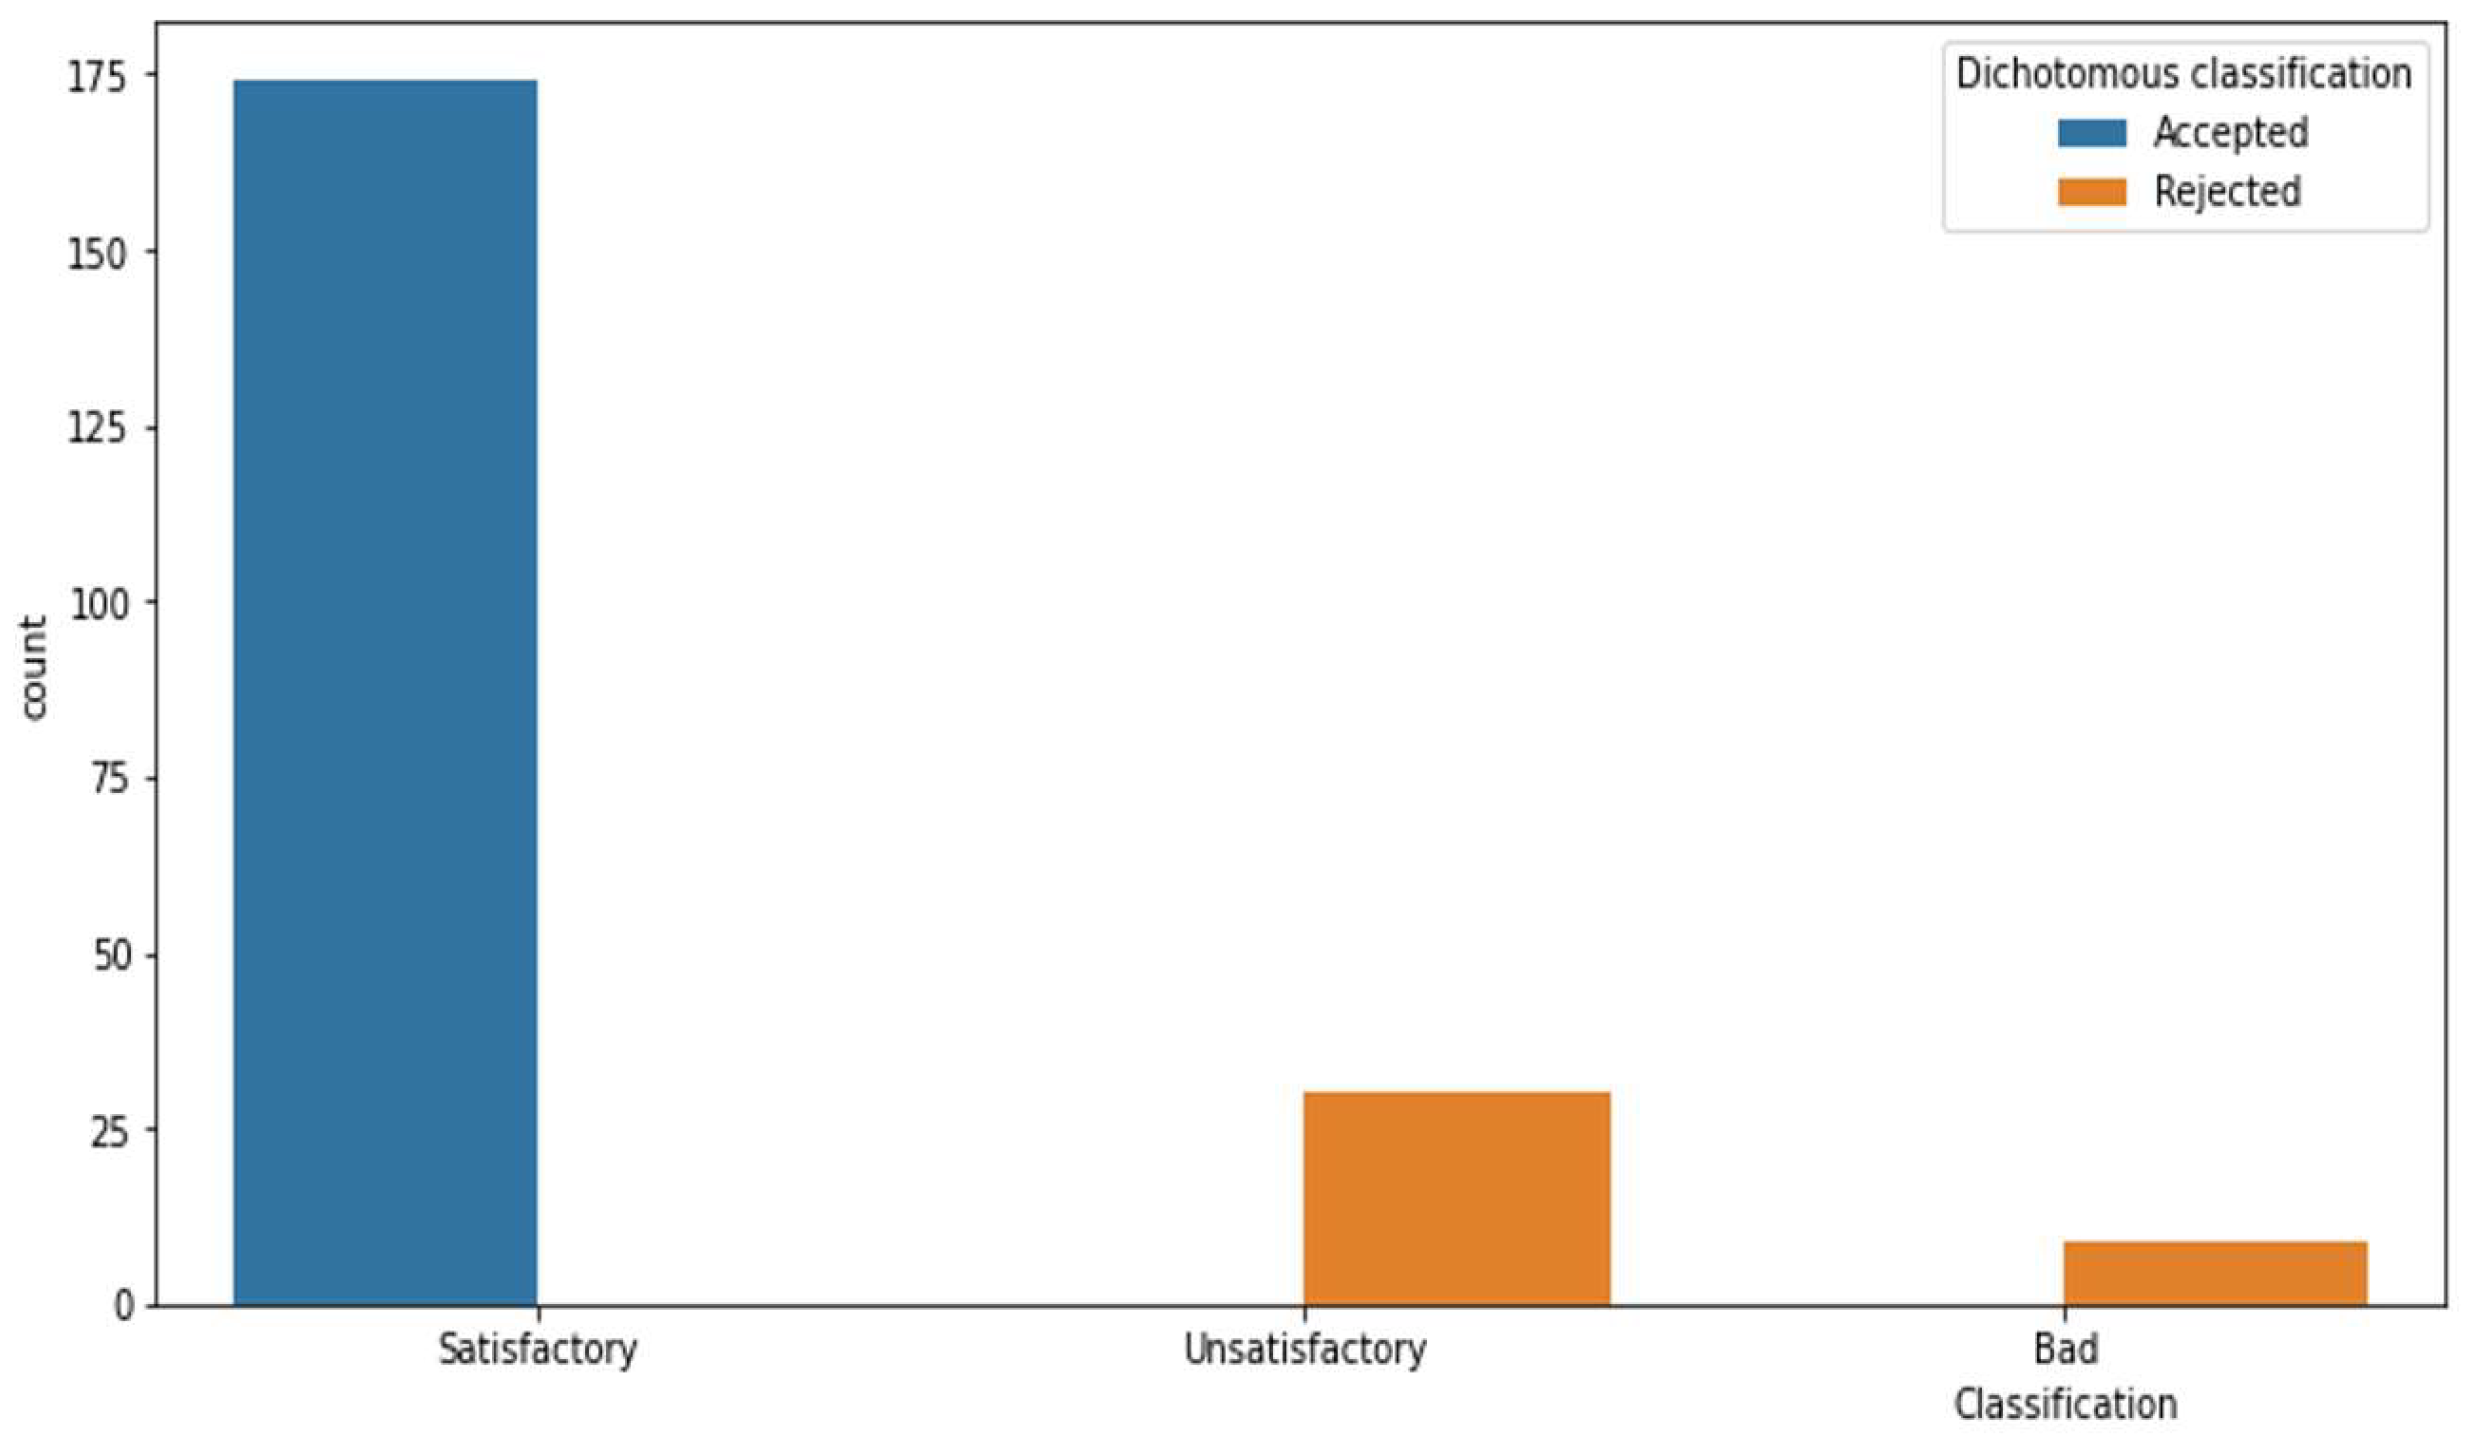
The bull breeding data from Section 2.1, Section 2.2 and Section 2.3 are condensed in Table 1. The dataset provides information on 359 bulls; however, information about all of the variables is present for only 213 bulls, as shown in the filtered dataset in Figure 1. The first identified concern is that the dataset is unbalanced, as practically all of the bulls fit into one of the following categories performed by experts:

Figure 1.
Bull data distribution. The data obtained are unbalanced due to the traditional BBSE methodology.
- Satisfactory (A class): Bulls have a high pregnancy rate in a short time.
- Unsatisfactory (B class): Bulls have a low pregnancy rate.
- Bad (C class): Bulls rarely have cow pregnancies.
where most of the data fall into class A, as depicted in Figure 1, making it difficult to identify the second and third classes. This distribution occurs because when bulls are purchased, they are already pre-selected for breeding based on their qualifications and an 81% accuracy rate (174/213 satisfactory bulls), which is considered a high estimation rate.
Dealing with unbalanced data to perform a multiclass classification problem when one class considerably dominates the others is one of the biggest challenges in ML. In this work, this was approached using the class augmentation paradigm. Furthermore, to identify an acceptable ML model for this challenge, a variable pairing phase was conducted, involving a comprehensive analysis of the dataset’s categorization, as outlined in Table 2. In it, data collected in the field were used to run an ML algorithm that classifies the animals according to the same BBSE standards, anticipating the validation of the benefits of technological tools for dealing with the abundance of information used in the design of automated processes to identify those individuals who exhibit the best breeding conditions.
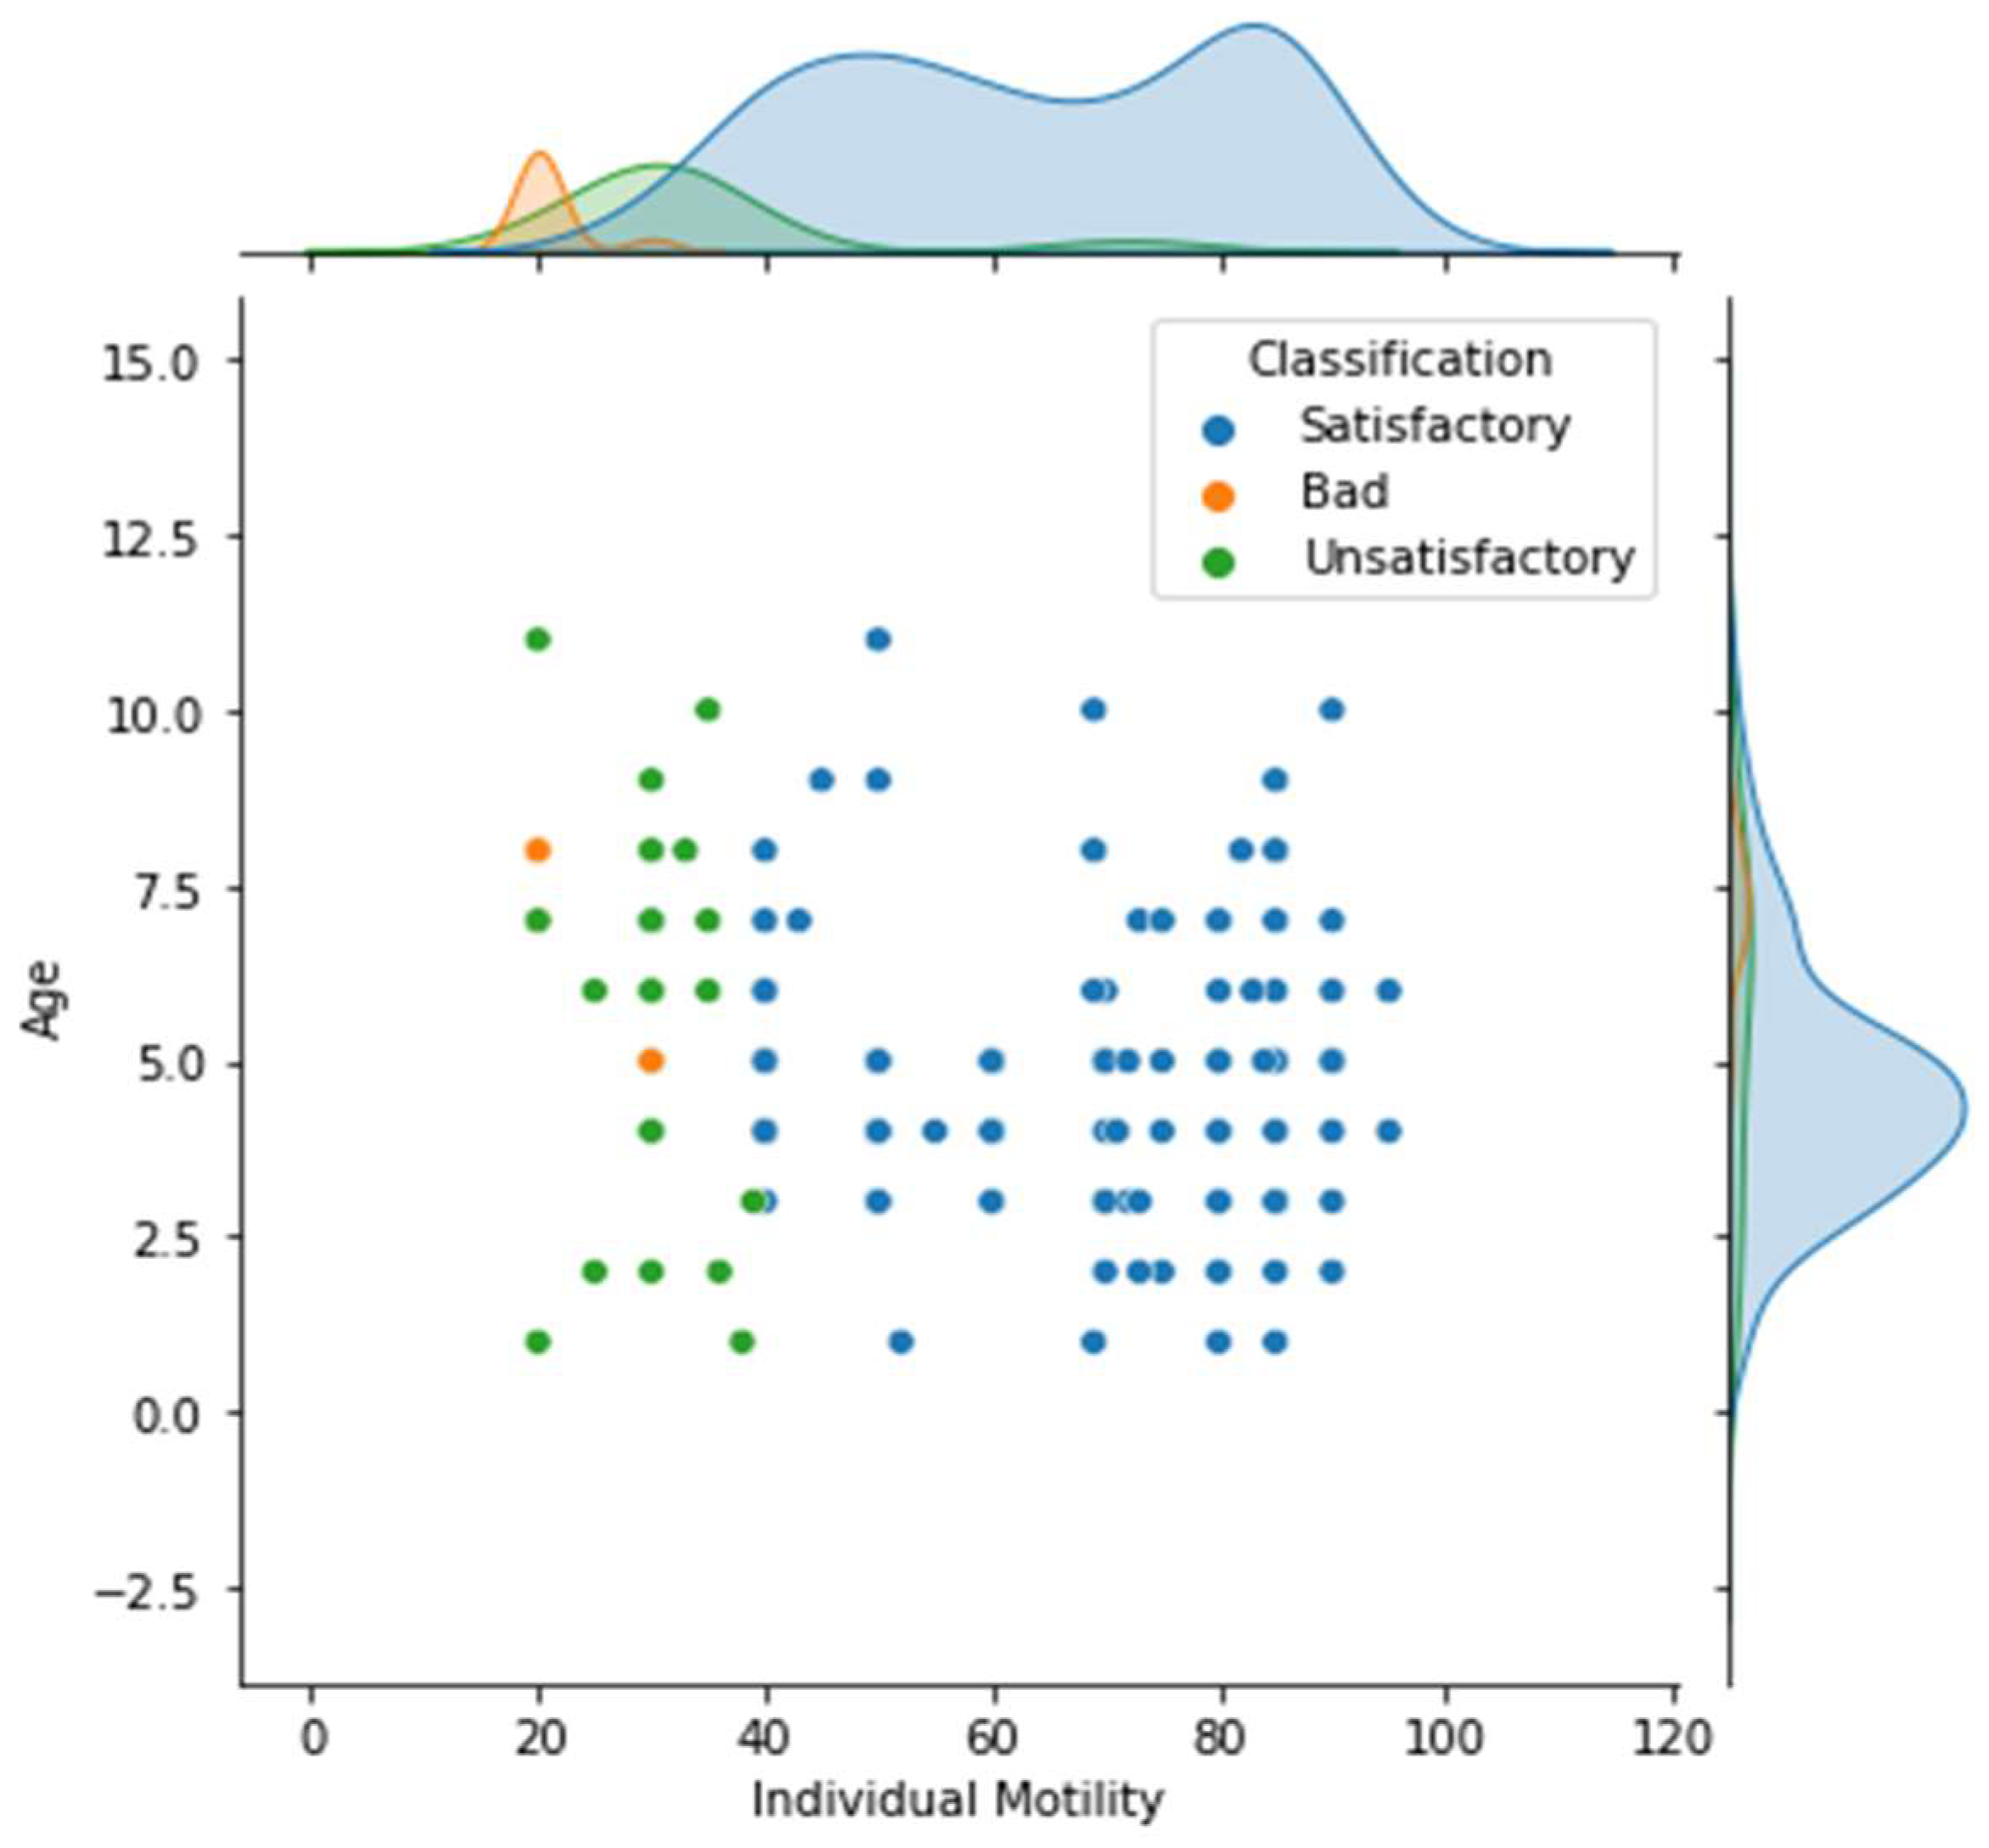
Therefore, we decided to perform ML data treatment as depicted at the end of Section 3. The first correlation analysis aimed to compare age versus motility percentage. The results indicated, as depicted in Figure 2, that age is not correlated with motility performance, since there was no increasing tendency in age toward motility performance or vice versa. In addition, there was a significant tendency for satisfactory elements concerning the individual motility of semen; this was higher than 40%, making it a suitable element for classification. Nonetheless, there was considerable overlap between 20% and 30%, with a few unsatisfactory elements clustering around 80% motility. Because of the skewed data, this becomes considerably more relevant.
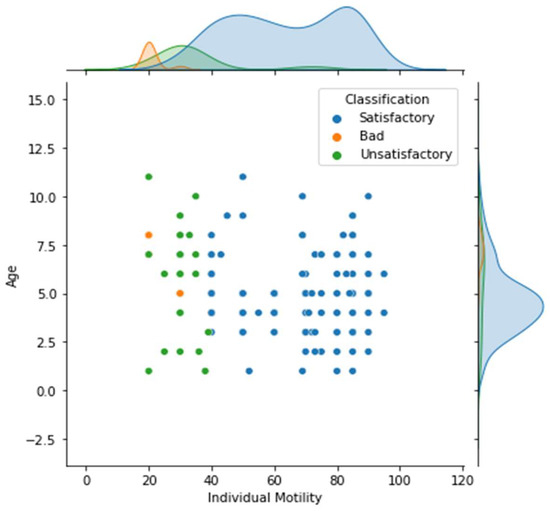
Figure 2.
Comparison between two variables, age and individual motility (%).
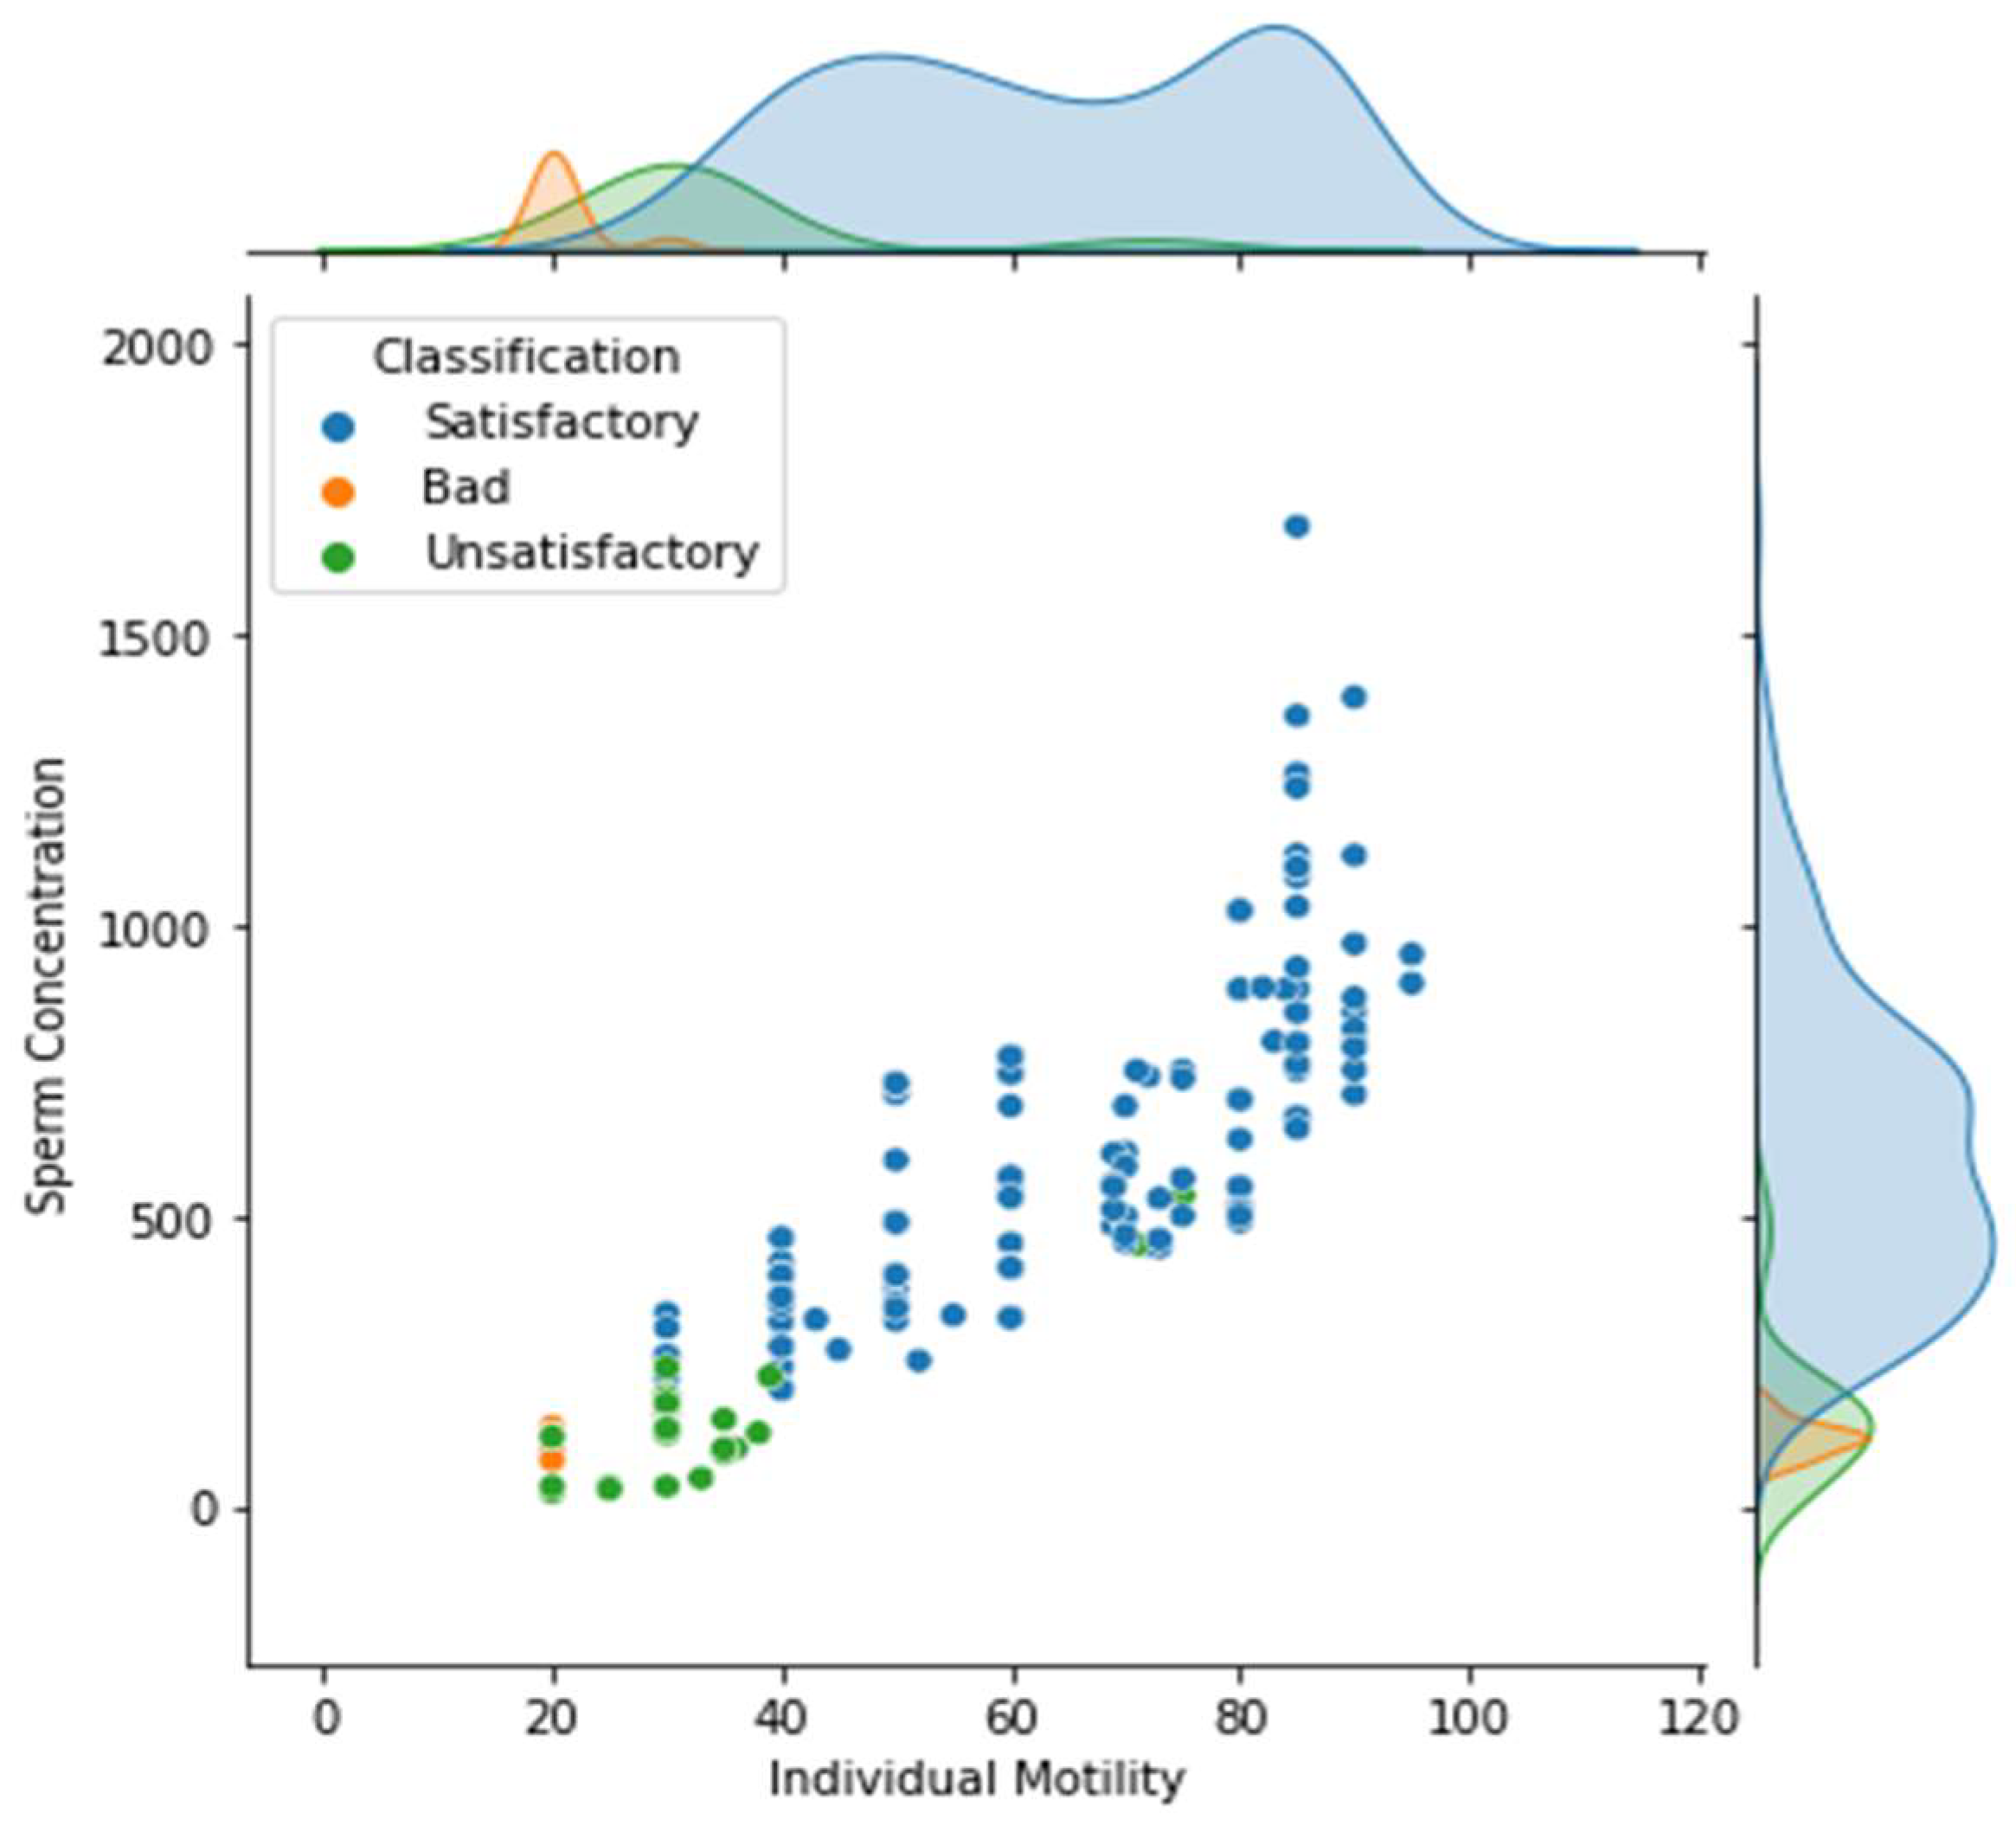
Another finding from the semen analysis is a definite preference for satisfactory elements over 490 × 106/mL of sperm concentration, as depicted in Figure 3. However, even when the motility percentage was considered, there was still insufficient information to distinguish between classes A and B (satisfactory and unsatisfactory). Nonetheless, based on the dichotomous classification presented in Figure 1, it is feasible to consider class C as a subset of class B, which might lead to both being misclassified.
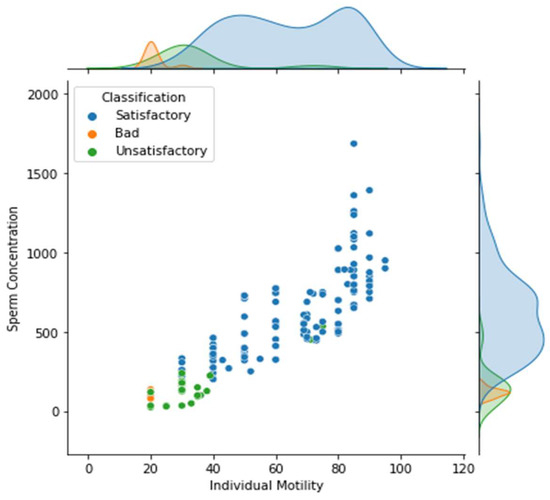
Figure 3.
Comparison between sperm concentration and individual motility (%).
Although libido was expected to be a significant feature in bull classification, as shown in Figure 4, it is not an important factor because there was no clear distinction between the classes, and all were mixed. Furthermore, Figure 4 demonstrates that classes B and C are difficult to differentiate due to their proximity, but that it is ineffective to discern between classes A and C. This implies that classes B and C are difficult to differentiate since they are so similar. Although sperm motility is subjective, it is the most useful characteristic for discriminating between the three classes.
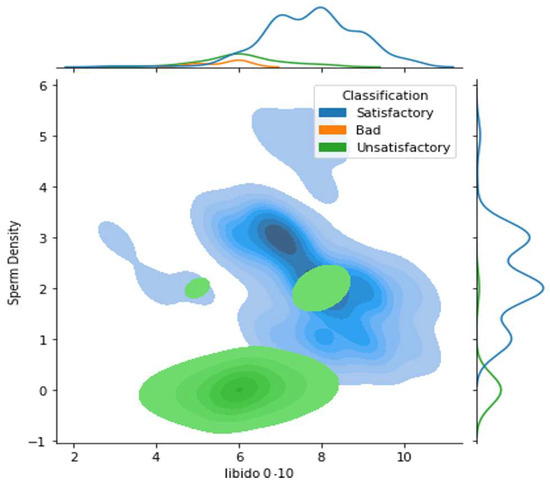
Figure 4.
Scaled comparison between sperm density and libido (0–10). The upper histogram shows how bad elements are concentrated inside the unsatisfactory region.
The variable pairing phase demonstrated no significant differences in this study. Nonetheless, some elements could be obtained. For instance, combining multiple variable subsets may result in more separation than other approaches; on the contrary, a subset of variables may be categorical, based on human judgment and/or instrument quality, as detailed by [35]. Our approach, instead, was to assess whether an individual may be classified as a satisfactory element based on two sorts of variables (A&P and performance), as can be seen in Table 3. Thus, the objective here was to determine the absolute minimum of the variables necessary to distinguish each class. To determine the most representative set of variables, it was essential to reduce them by eliminating categorical features, which are variables whose categorization has been determined based on observations that may lead to human error in classification. Finally, a principal component analysis (PCA) was performed, aiming to reduce dimensionality. It is important to highlight that the A&P variables represent raw and objective data from each bull. In contrast, the performance variables are provided by the supplier or can be obtained long after the bull has been purchased. These variables are not entirely reliant on the bull, meaning that they are influenced by other aspects as well, such as the number of cows and the climate, which might affect their performance. Therefore, five A&P variables were selected as the input variables for the ML analysis of Section 3.1.
Table 3.
Selected variables to be used in the ML models.
It is worth mentioning that there are several ML methods and architectures available in the literature; the selection of each is highly dependent on the data and application. Considering this, we proposed to explore two paradigms of unsupervised (K-means) and supervised (fully connected artificial neural network) ML.
In the proposed ML-based prediction model, selecting a bull with an uncertain classification is reduced by assigning a score to the bull and forecasting its performance in advance. There is a particular type of ML algorithm that is devoted to multiclass classification, such as a required categorization of bulls, and the current approach examined two subgroups to evaluate its efficiency: unsupervised (clustering analysis) and supervised (neural networks) learning algorithms.
3. Results
3.1. Unsupervised Algorithm
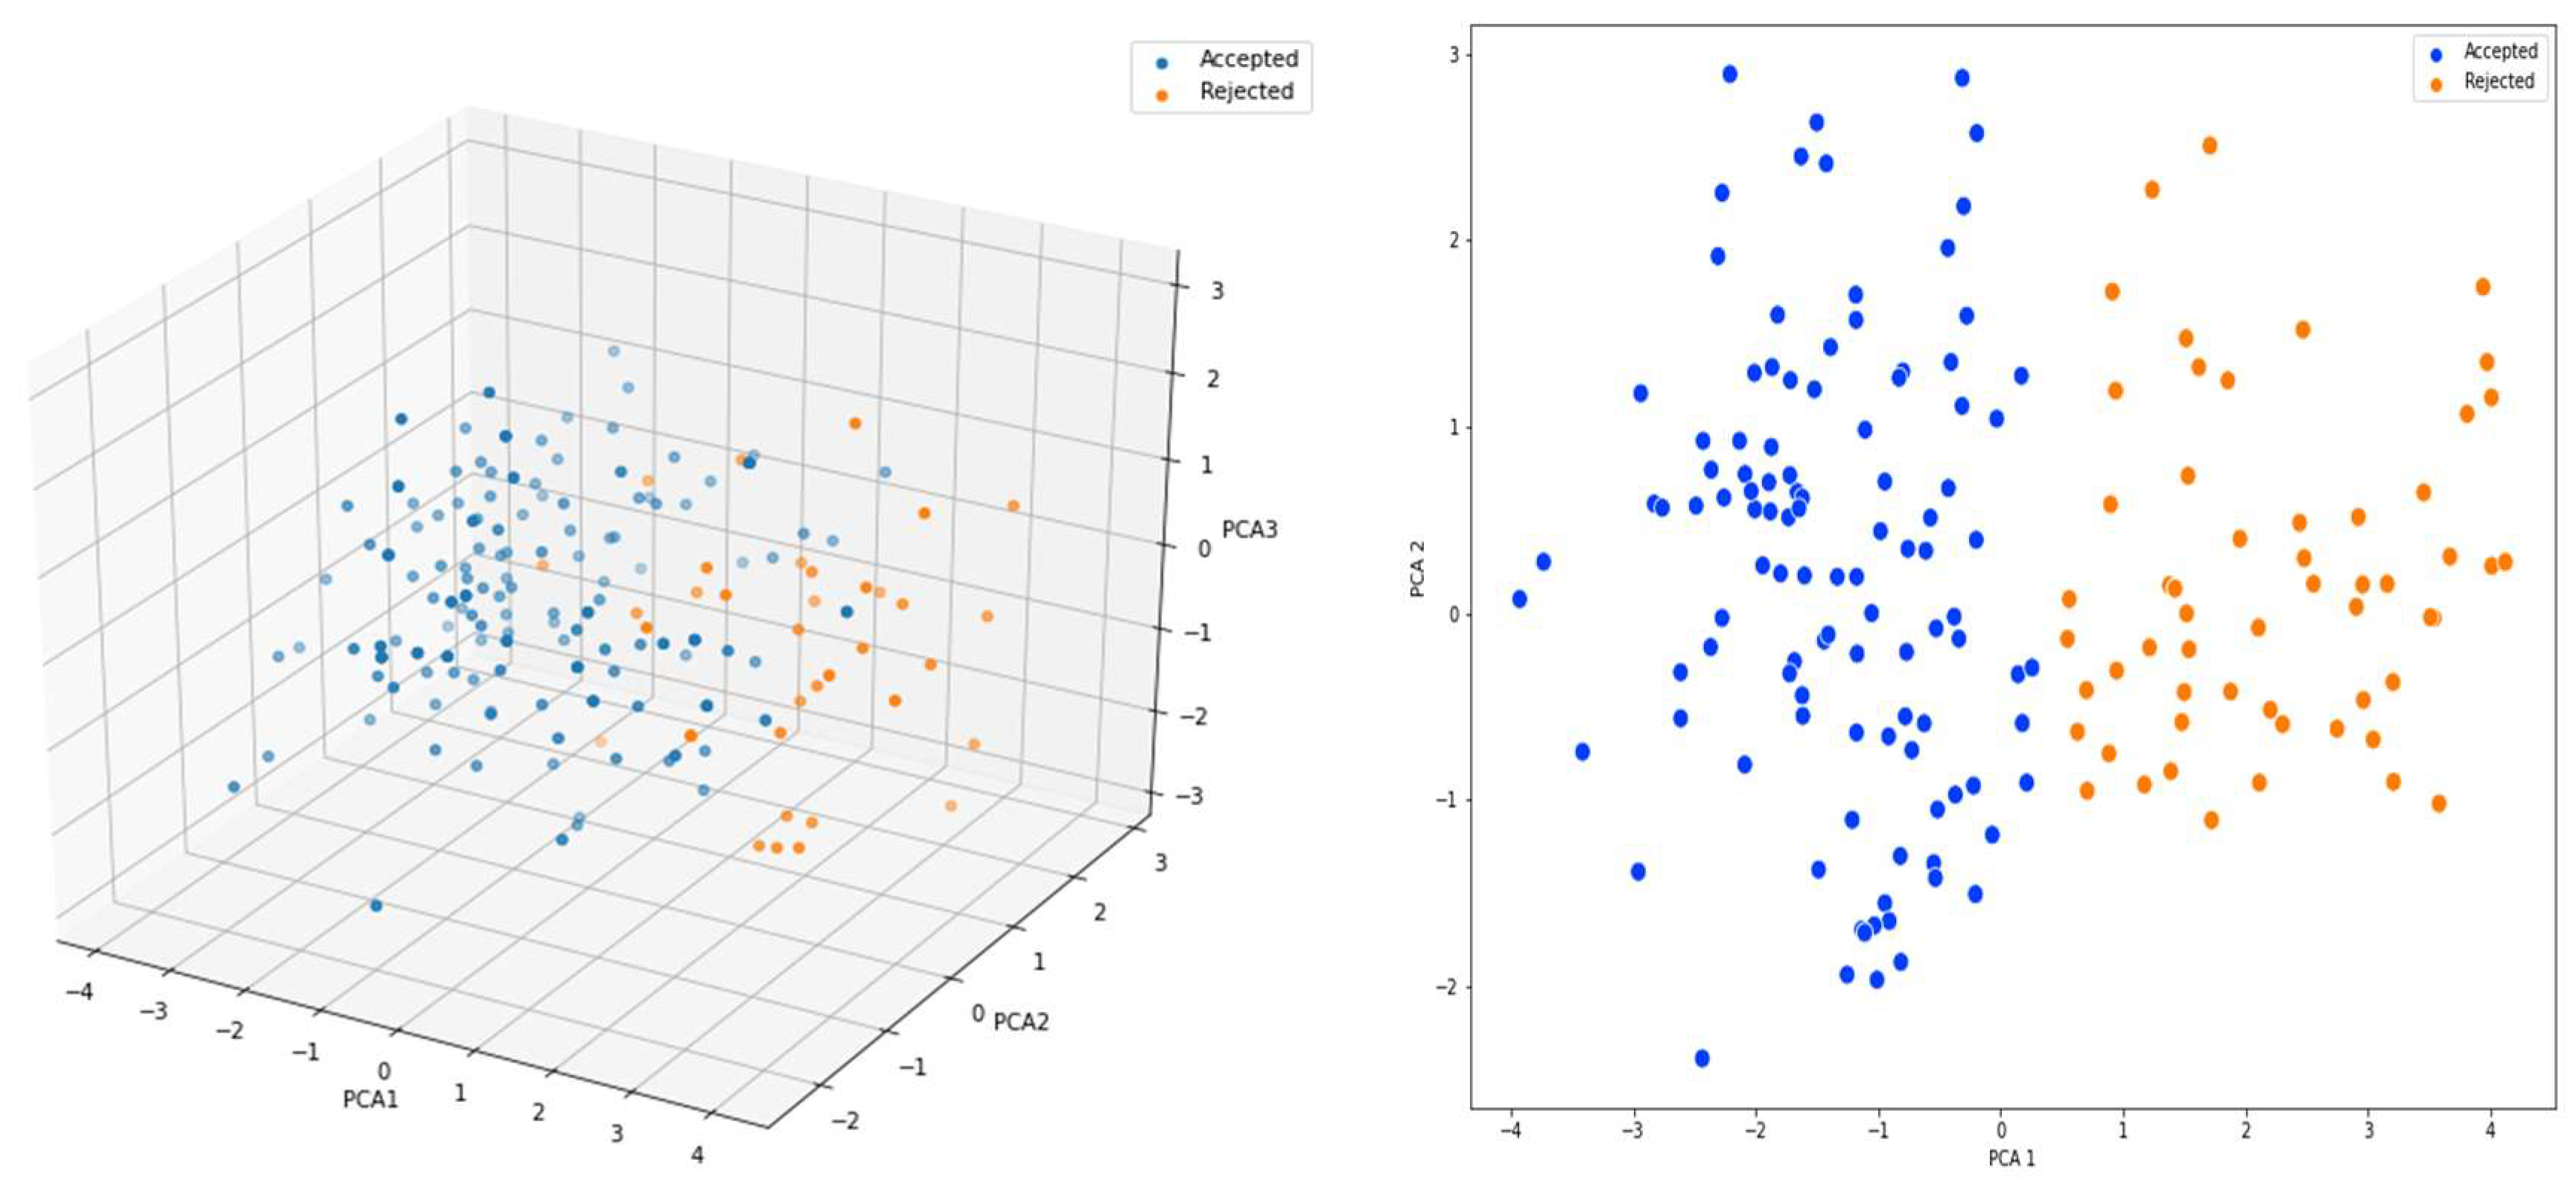
The first approach examined whether an uninformed ML algorithm recognizes differences between groups of individuals separated in a multiclass classification. The principal components (PCAs) were extracted from the dataset to provide information to the algorithm, and the K-means algorithm was used [36]. Figure 5 shows a comparison of the first three components (PCA1, PCA2, and PCA analysis) from the eight-dimensional PCA feature vector. The orange elements indicate categories B and C (unsatisfactory and bad elements), while the blue items indicate category A (satisfactory). When using this approach to construct the third class, the separation of the C class remained unclear; hence, the problem was reduced to a binary classification comparing class A to classes B and C.
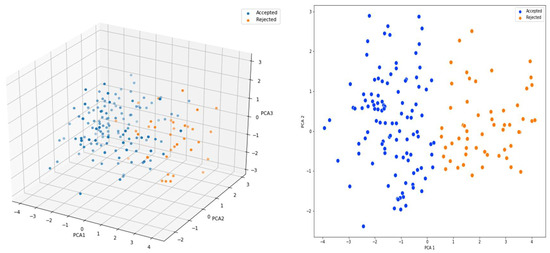
Figure 5.
Left: First, second, and third components, Right: First and second components. Both for a dichotomous (binary) classification: Accepted for class A, and rejected for classes B and C.
The results were compared to the true category of the individuals in the Table 2 dataset, yielding the confusion matrix in Table 4 with an accuracy of 78%.
Table 4.
Confusion matrix for the clustering analysis using the K-means algorithm.
3.2. Supervised Algorithm
Although the K-means clustering approach yielded acceptable accuracy (around BBSE) for determining whether a bull is suitable for breeding, the classification findings require improvement. The deep learning techniques used in ANN achieve excellent results for a wide range of classification applications. These techniques, however, are supervised, which means they must learn from a collection of elements in the dataset.
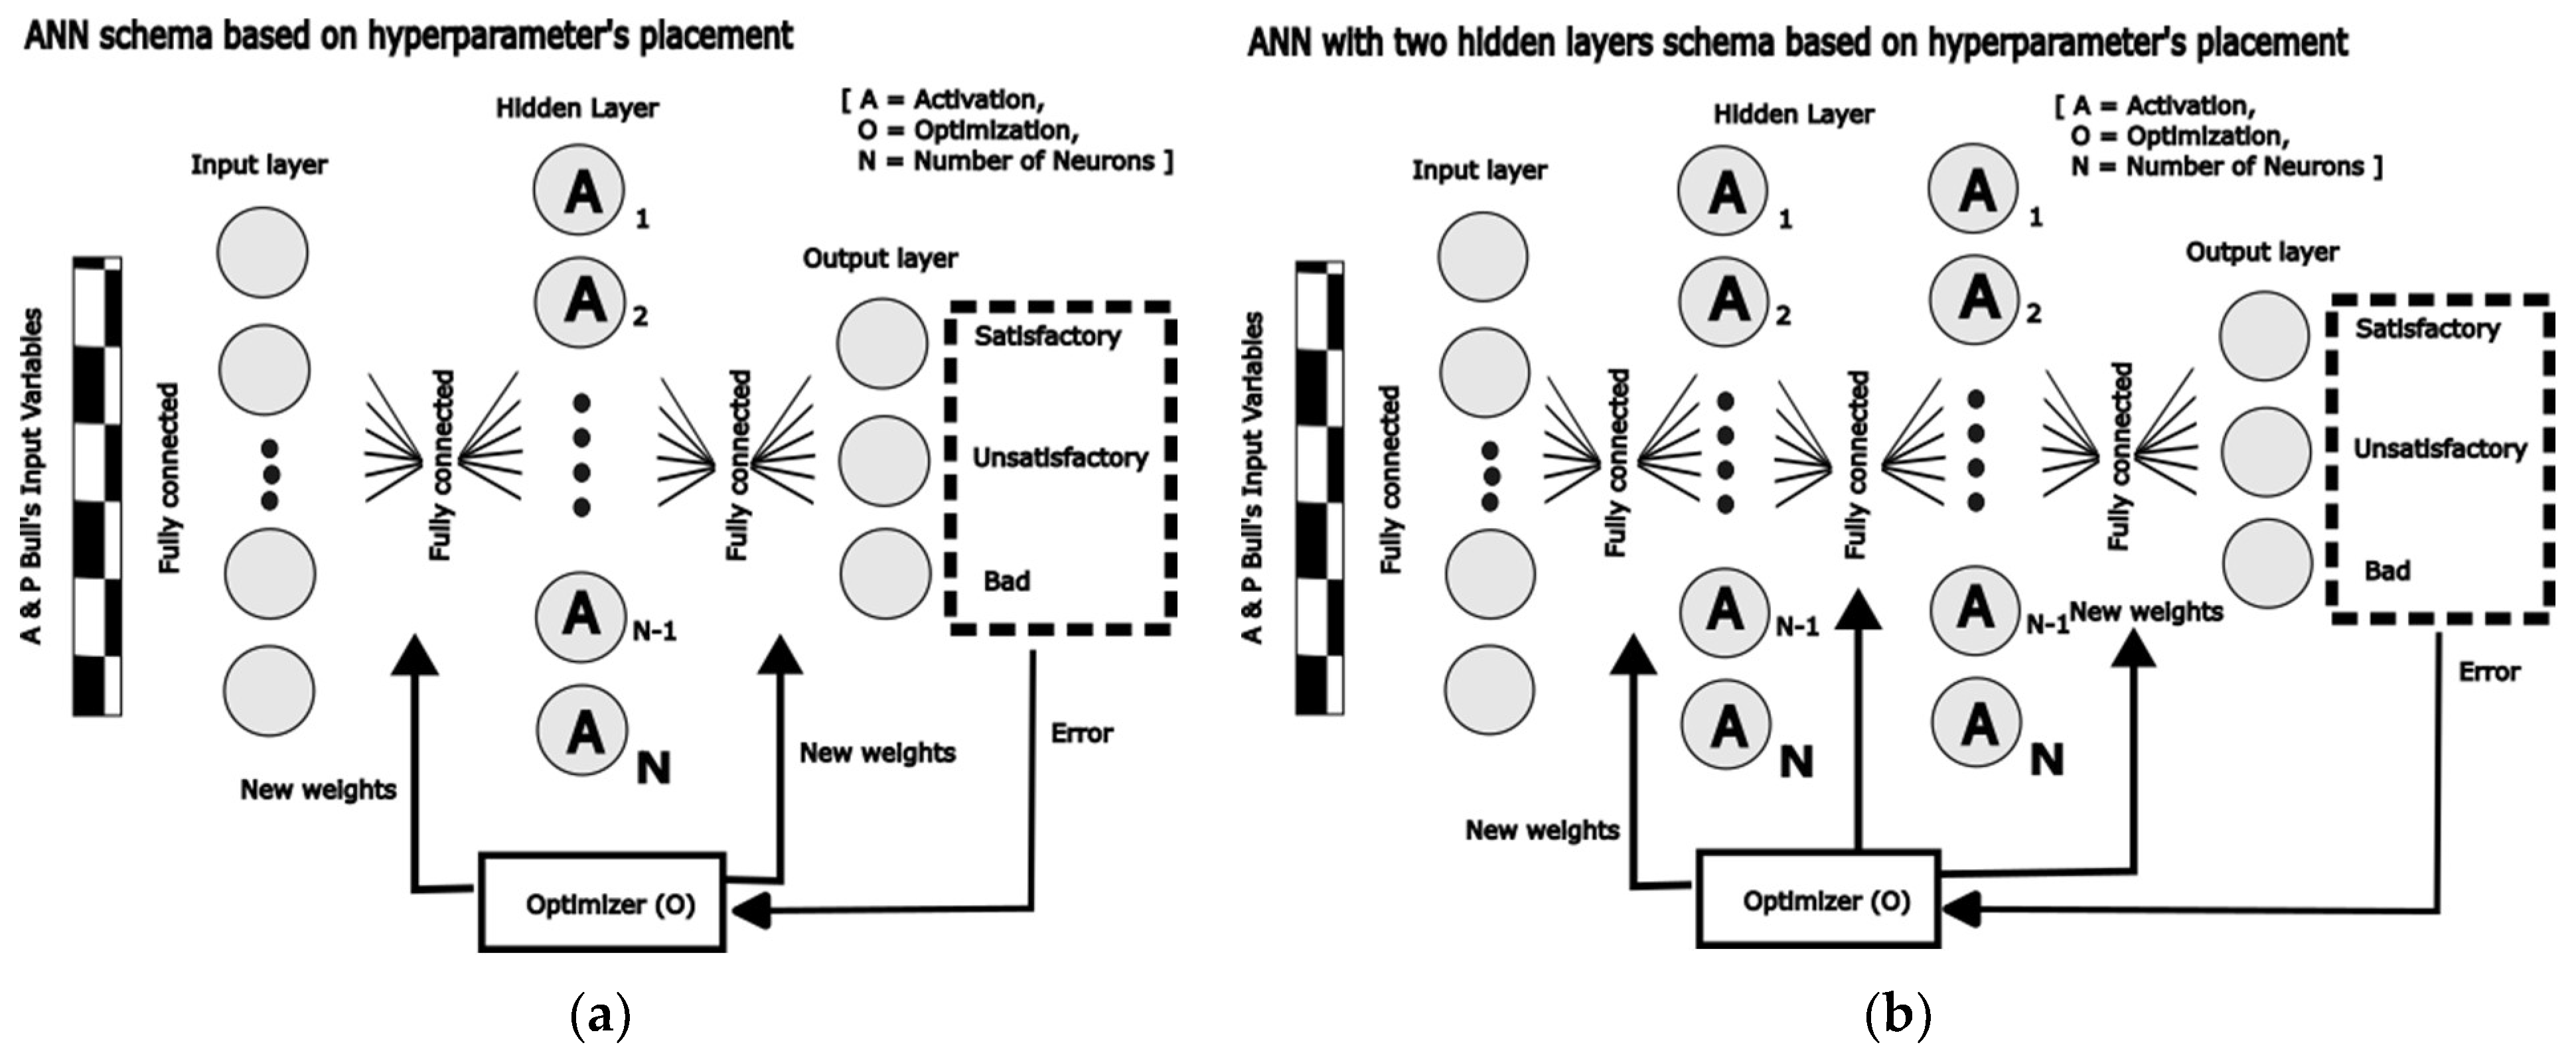
Different network morphologies and hyperparameters were used to evaluate which fully connected ANN (dense) model provided the best results for our purposes. Each model is represented as a tuple (A, O, N) described as follows and illustrated in Figure 6:
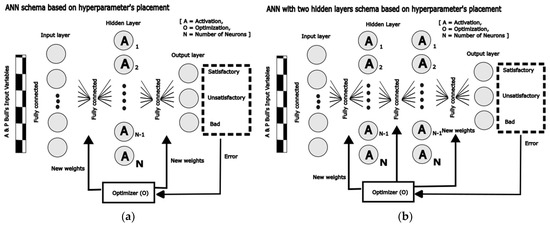
Figure 6.
Schema of two artificial neural network architectures using five input variables (A&P) and three different hyperparameters (A, O, N) that had been evaluated. (a) ANN with one hidden layer; (b) ANN with two hidden layers.
- A = Activation function: Sigmoid (S) and Relu (R)
- O = Optimizer method: ADAM (A) and SGD
- N = Number of neurons: 8, 16, 32, 64, 128, 256, and 512
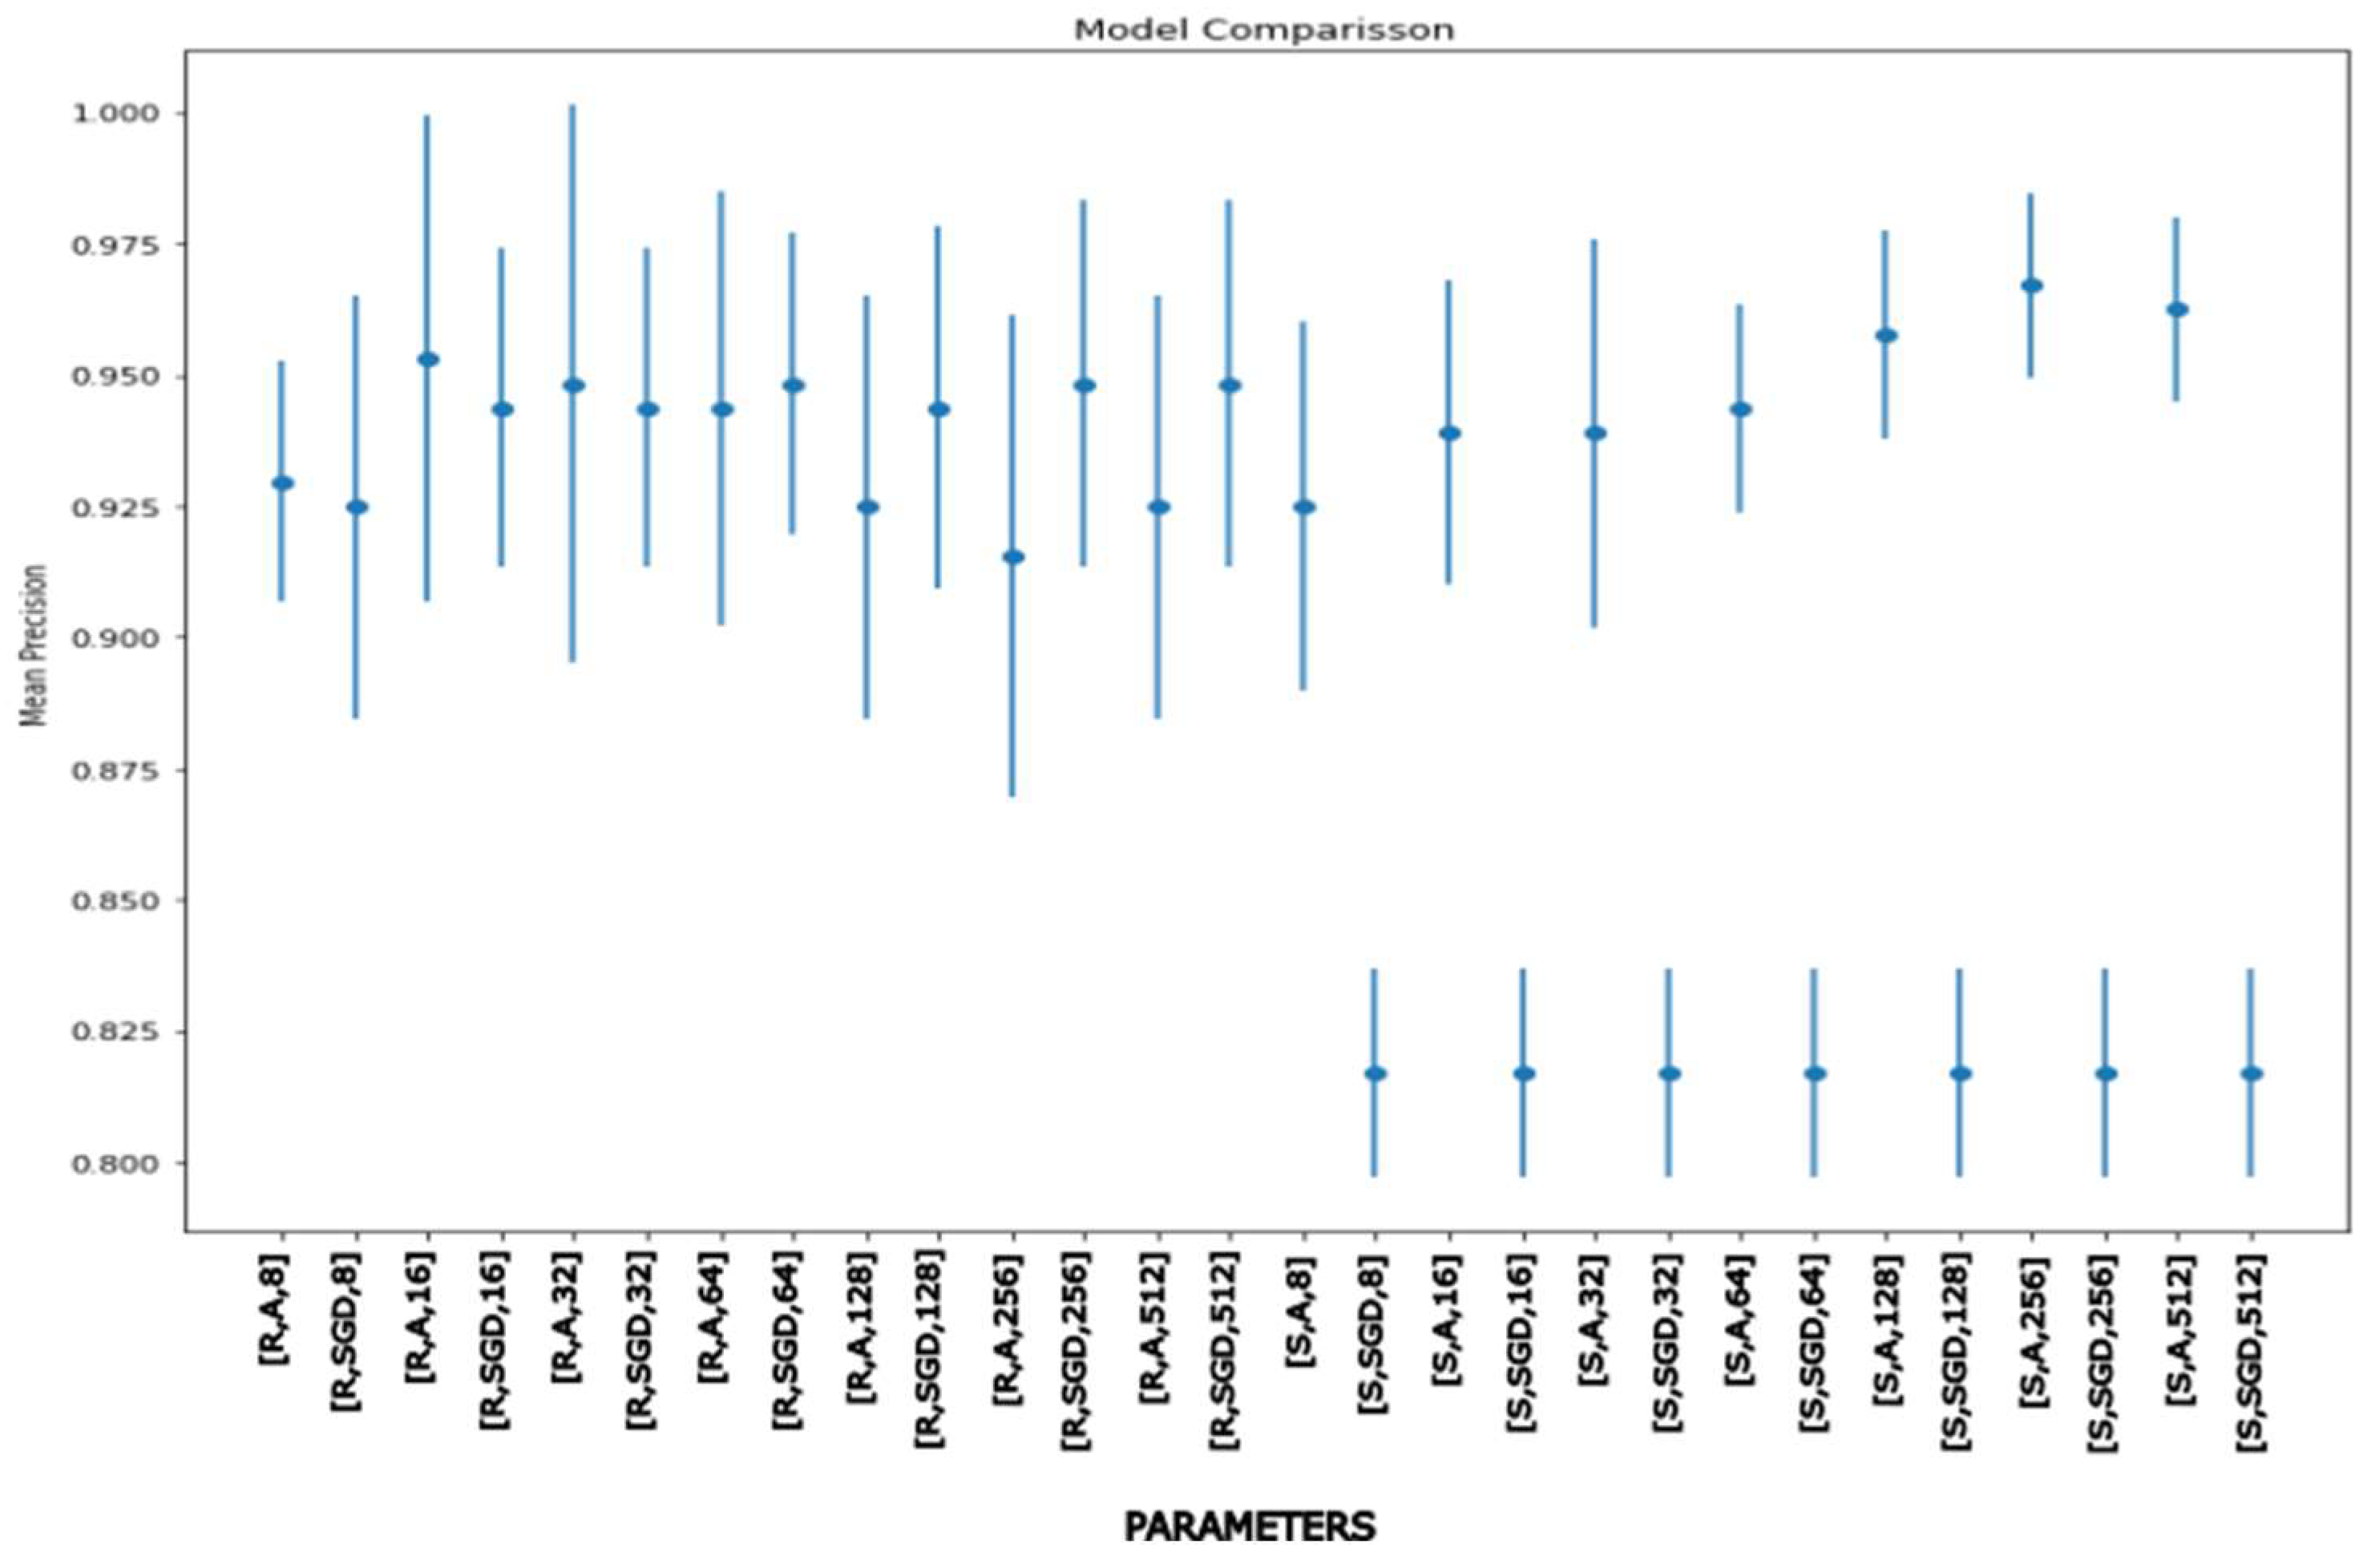
Combining these three hyperparameters (neurons, optimizer, and activation function), the number of neurons determining the input, and one or two hidden layers of neurons resulted in the model comparisons in Figure 7, Figure 8 and Figure 9. Different elements from the dataset that were randomly assigned between 70% and 30% for the training and validation procedures (cross-fold validation) were also tested. Notice that to render a validation of the proposal, many different training and test sets were randomly considered to obtain the maximum mean precision with the minimum uncertainty (see Figure 7, Figure 8 and Figure 9).
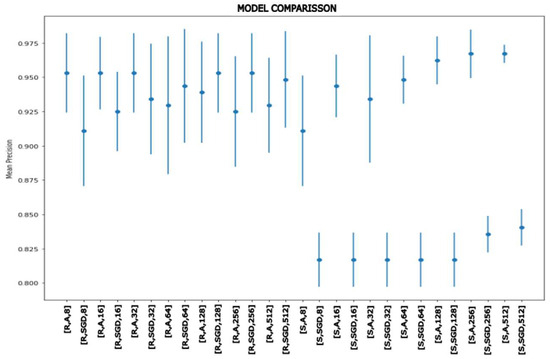
Figure 7.
Tests run for ANN with one hidden layer and three hyperparameters (neurons, optimizer, and activation function).
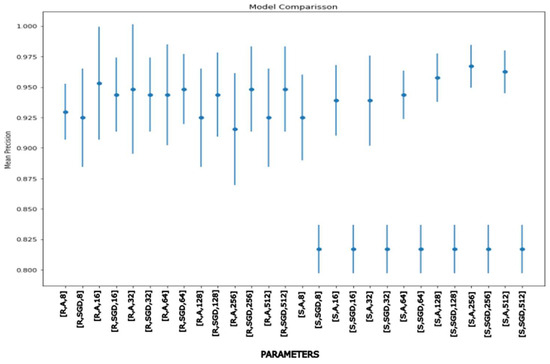
Figure 8.
Test for ANN with two hidden layers and different hyperparameters.
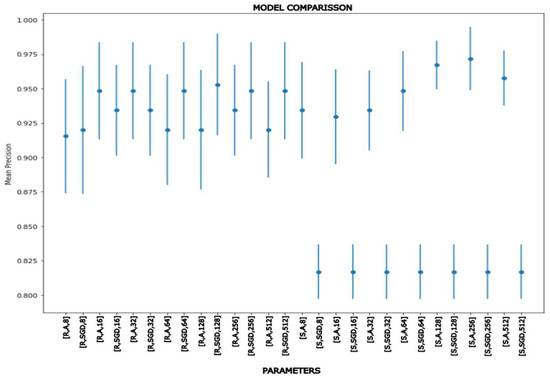
Figure 9.
Test for ANNs with two hidden layers and different hyperparameters trained with only five input variables.
For one hidden layer ANN, two models generated the best results. On the one hand, there was a 512-512-3 model for the input and hidden layers with an ADAM optimizer and a sigmoid activation function. This model has a 96.71% average accuracy and a standard deviation (STD) of 0.0066. On the other hand, the 256-256-3 model obtained 96.71% and an STD of 0.0175. Both models were accurate, but the one with 512 neurons had less variability.
For models 256-256-256-3 and 512-512-512-3, the two best ANNs with two hidden layers reached 96.71% and 96.24%, respectively, with an STD of 0.0175. We did not observe any enhanced results with extra layers based on this study, but it did indicate the requirement for more hardware resources. Nevertheless, as discussed in Section 3, the input variables are divided into two groups. A&P variables may be collected in situ; the other variables are gathered over time based on their performance. To evaluate the bull straight away, only the A&P bull variables were examined, which were then put through multiple neural network topologies in the same manner as before to discover the best fit for this case, as shown in Figure 9. The best fit was reached by the 256-256-256-3 model with the ADAM optimizer and sigmoid activation function, with 96.71% accuracy and an STD of 0.0175, which was identical to the one attained with eight variables.
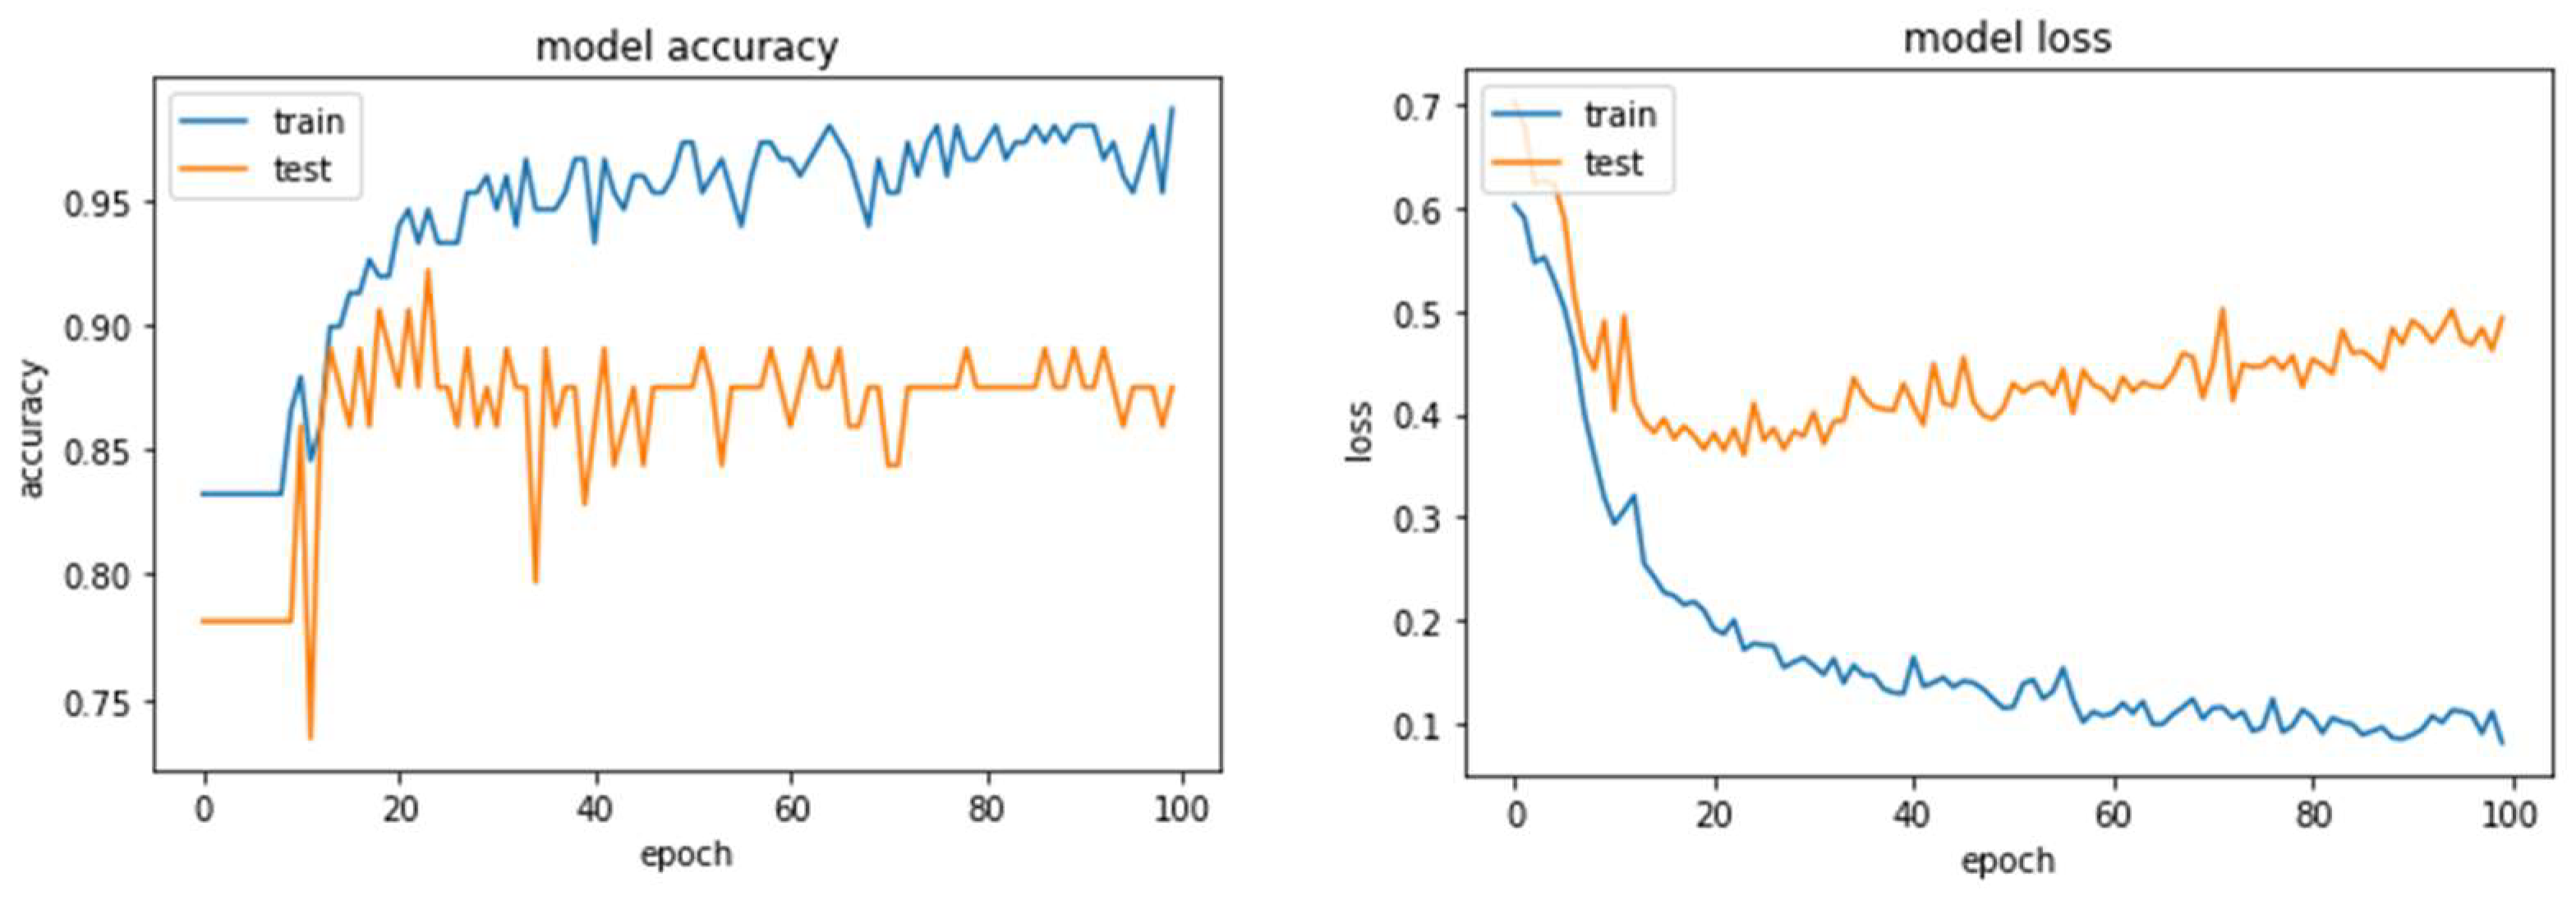
Nevertheless, unlike models with eight input variables, it was simple to detect overfitting by comparing its loss and learning plots versus epochs (one pass or iteration of the algorithm through all training examples is called an epoch; see Figure 10).
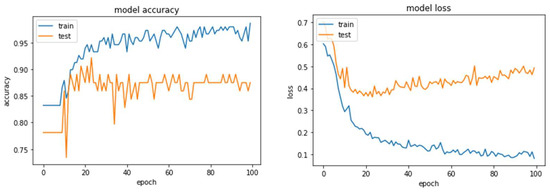
Figure 10.
Accuracy and loss plots for the ANN 256-256-256-3 model with five variables; overfitting may be recognized as early as 20 epochs.
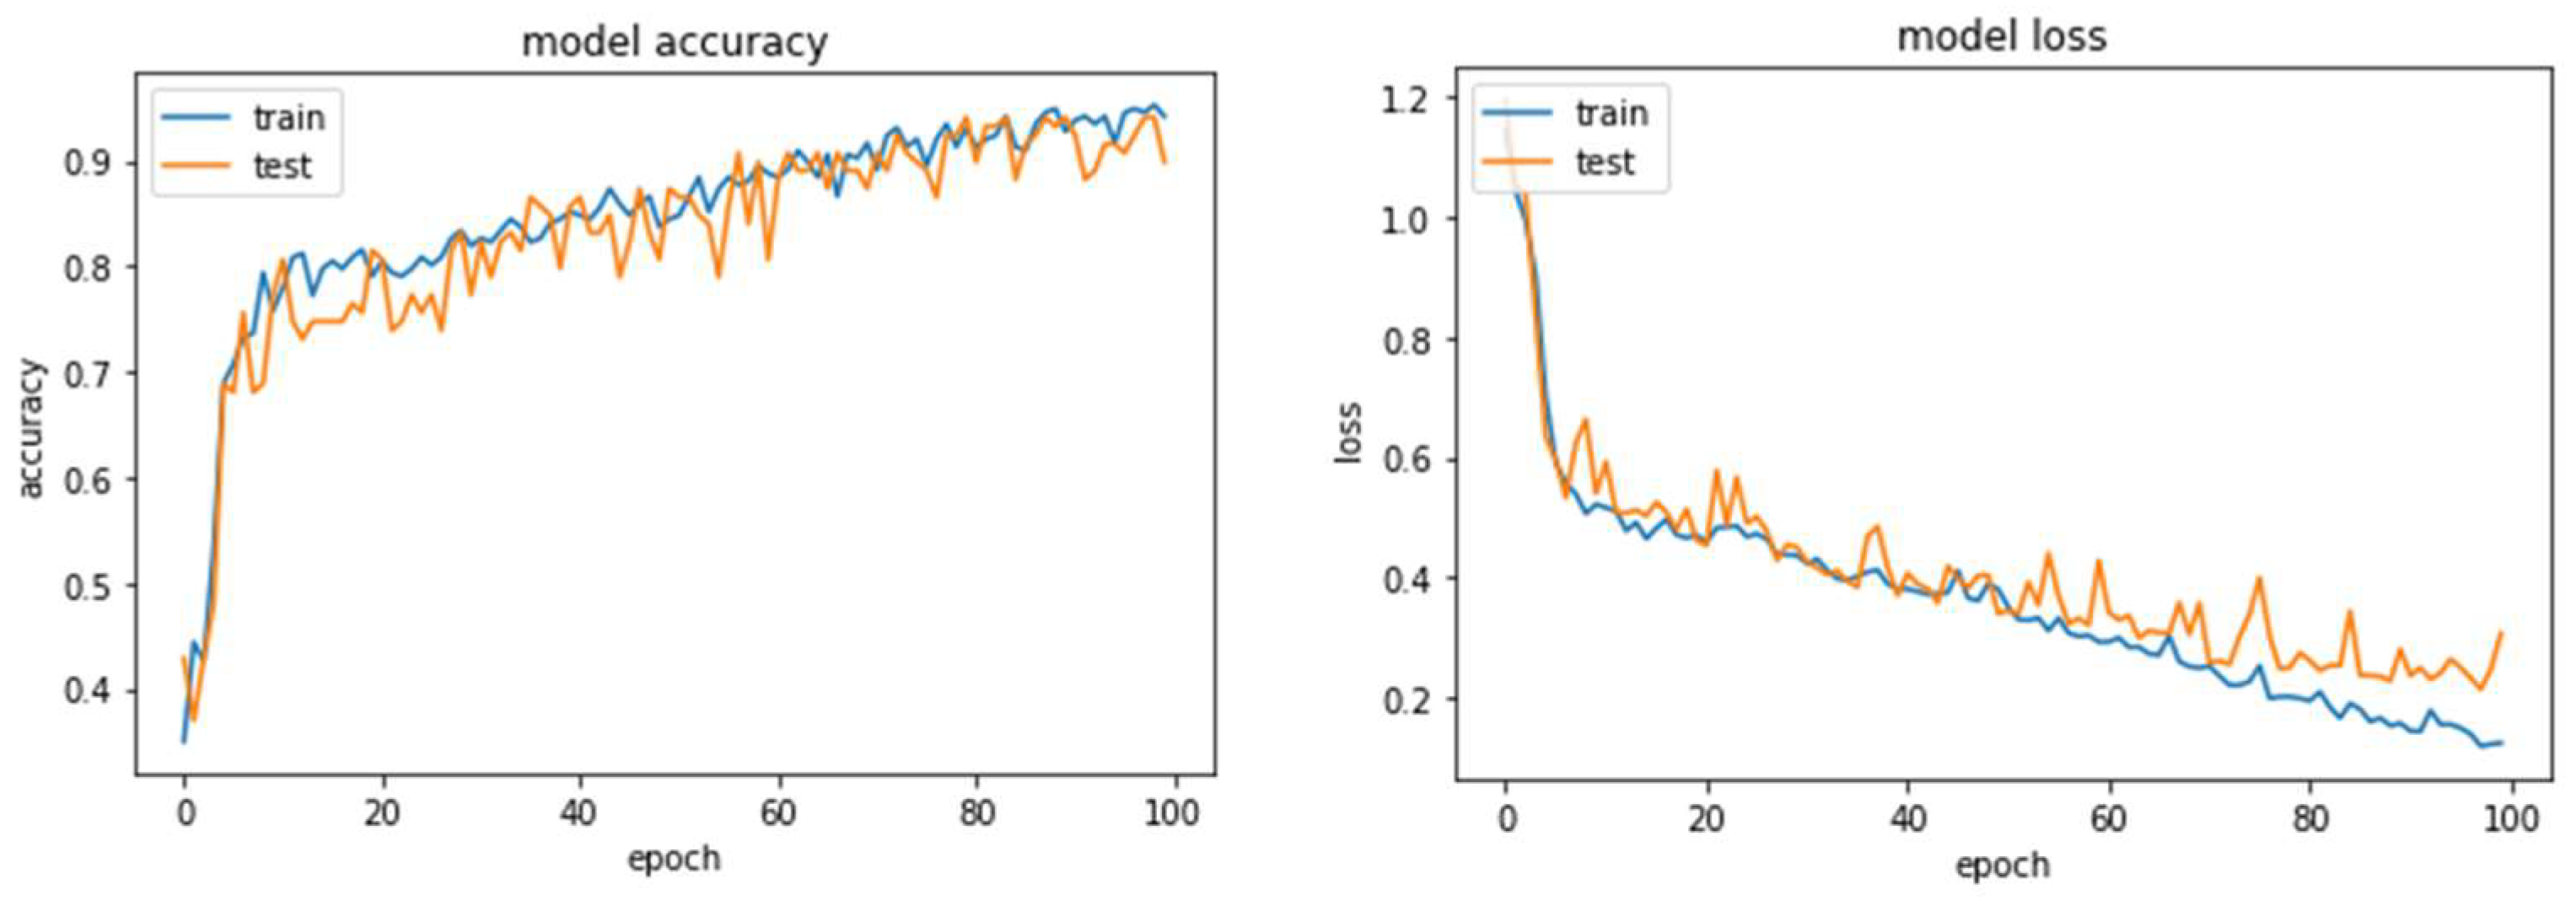
To solve the overfitting problem, synthetic data for each class was required using conventional data augmentation techniques based on normal distributions. As seen in Figure 11, this procedure allowed us to achieve a more balanced dataset and run our model without overfitting. The following categorization results were obtained (Table 5).
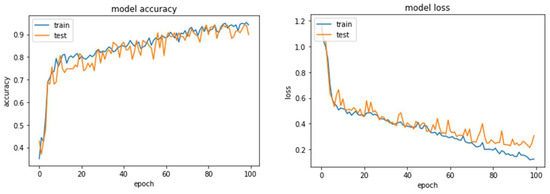
Figure 11.
Accuracy and loss plots after the data augmentation process.
Table 5.
Categorization results based on the proposed model.
As depicted in Figure 11, the ANN had an accuracy of 90%. Precision was 97% for class A (satisfactory), 92% for class B (unsatisfactory), and 85% for class C (bad) (considering the ratio of true positives and true negatives with the rest). In practice, all class C members who were not labeled as C were classified as class B, which is a rejected bull. The TensorFlow and SCI-Kit libraries, as well as the Python programming language, were used in the testing [37].
4. Discussion
The bull breeding soundness evaluation (BBSE) has grown into a low-cost veterinary treatment that offers benefits such as risk reduction and increases in strategic bull deployment, herd fertility, and economics [38]. The presence of many interactions or correlations between predictors significantly restricts the capability of traditional statistical approaches based on univariate hypotheses and independent explanatory variables. Although numerous statistical parametric algorithms [39] have been developed to increase prediction in huge datasets with few observations, these methods are computationally intensive. Because meaningful data are abundant, ML algorithms may be used to extract information from massive and complex datasets and learn patterns from sample observations to generalize them for whole populations [40]. Two algorithms, clustering and ANNs, were studied to determine the optimum ML approach for our application, with an emphasis on data categorization accuracy. The proposed ML-based predictive model for bull classification is a two-step approach that combines clustering analysis followed by an ANN model to classify bulls into three categories: satisfactory, unsatisfactory, or bad. The ANN model outperformed the clustering analysis approach with 90% accuracy. One of the key advantages of the proposed model is that it may be used to predict the performance of a bull even if it has not yet been tested. As a result, the model is a significant tool for breeders who need to make informed decisions regarding which bulls to use for breeding. Another feature of the proposed model is its ease of implementation using a range of ML libraries. However, it is important to be aware of the limitations of the model, such as the necessity for representative training data and the risk of overfitting. The bull parameters were obtained from the Universidad Veracruzana’s Faculty of Veterinary and Animal Sciences over several years. Regardless of whether the classification was meant to distinguish three classes, the primary purpose was to distinguish the “satisfactory” class from the others. For this classification, the ML model obtained a 90% accuracy rate with only five input variables, compared to 81% for traditional BBSE conducted by local farmers using only the physiological and morphological features of the animal. This is a significant result, indicating that a model is a reliable tool for bull classification. In addition, because the computational evaluation implies one task in no more than 3–5 min for offline training, depending on the volume of data, and less than a second for each classification result, it is not even comparable to the manual process, which may take several days to decide on the best group of bulls. Though the algorithms work well with small-scale cattle data, a larger sample with a more balanced dataset is expected to produce a more accurate classification closer to real data (without synthetic data). It is also envisaged that the actual use of this tool on farms will enhance livestock management; hence, data collection will be a necessary duty. This is the first study to use ANNs for automated classification in the context of bull breeding. Animal farming techniques in the Mexican tropics require upgrading to compete with modern systems, as is taking place in other regions of Mexico. The use of artificial intelligence (AI) technologies in specific prediction models based on neural networks will help livestock farmers better evaluate such systems.
5. Conclusions
This paper performed this ML algorithm comparison of the behavioral and productive trait determinants of bull survival in Mexico’s tropical altitudes. With this insight, it is feasible to design appropriate animal breeding and management approaches to improve herd profitability. To the best of the authors’ knowledge, there is no ML application dedicated to bull breeding classification. Furthermore, using only five variables in our classification model, we were able to determine bull viability with 90% accuracy, which is higher than traditional BBSE, and it could even be achieved using only the physiological and morphological features of the animal.
Author Contributions
Conceptualization, A.H.-B. and P.C.-A.; methodology, M.B.-M.; software, L.F.M.-U.; validation, B.D.-M.; formal analysis, B.D.-M. and M.B.-M.; investigation, R.d.J.P.-V. and P.J.G.-R.; resources, J.A.V.-S.; data curation, B.D.-M. and M.B.-M.; writing—original draft preparation, P.J.G.-R.; writing—review and editing, P.J.G.-R.; visualization, A.H.-B. and P.C.-A.; supervision, J.A.V.-S.; project administration, L.F.M.-U.; funding acquisition, R.d.J.P.-V. All authors have read and agreed to the published version of the manuscript.
Funding
This research received no external funding.
Institutional Review Board Statement
The Bioethical Committee (School of Veterinary and Animal Sciences of Veracruz University) evaluated and approved (registration number COBIBA010/2017) all the handling, immobilization, and semen collection procedures performed on the bulls on farms by official veterinary services. The welfare of the animal is essential, and stimulation was ceased if it was causing undue stress or if physical harm to the bull was imminent.
Data Availability Statement
The datasets generated and analyzed during the current study are available in the repository (https://www.uv.mx/veracruz/uvca415-sistemas-dinamicos-autonomos/bull-breading-soundness-evaluation/)(accessed on 26th December 2023) and show the least squared means values and mean standard errors for each BBSE variable analyzed, as well as differences (p < 0.05) of post-hoc comparisons through Tukey’s method for each genetic group. All other data generated or analyzed during this study were included in this published article or are available from the corresponding author upon reasonable request.
Acknowledgments
The authors thank Herminio Hernández-Flores for helpful advice and suggestions during proposal development. They also thank EmbryoEspermTM for their guidance in the evaluation of cattle sample collection.
Conflicts of Interest
The authors declare no conflict of interest.
References
- Martínez, J.C.; Castillo, S.P.; Villalobos, A.; Hernández, J. Sistemas de producción con rumiantes en México. RCA 2017, 26, 132–152. [Google Scholar]
- Cañón, J.; García, D.; Delgado, J.; Dunner, S.; Da Gama, L.T.; Landi, V.; Martín-Burriel, I.; Martínez, A.; Penedo, C.; Rodellar, C. Relative breed contributions to neutral genetic diversity of a comprehensive representation of Iberian native cattle. J. Animal. 2011, 5, 1323–1334. [Google Scholar] [CrossRef] [PubMed]
- Domínguez, B.; Hernández, A.; Rodríguez, A.; Cervantes, P.; Barrientos, M.; Pinos, J.M. Changes in Livestock Weather Security Index (Temperature Humidity Index, THI) During the Period 1917–2016 in Veracruz, Mexico. J. Anim. Res. 2017, 7, 983–991. [Google Scholar] [CrossRef]
- Ginja, C.; Gama, L.T.; Cortés, O.; Burriel, I.M.; Vega, J.L.; Penedo, C.; Sponenberg, P.; Cañón, J.; Sanz, A.; do Egito, A.A.; et al. The genetic ancestry of American Creole cattle inferred from uniparental and autosomal genetic markers. Sci. Rep. 2019, 9, 11486. [Google Scholar] [CrossRef] [PubMed]
- Nichi, M.; Bols, P.; Züge, R.M.; Barnabe, V.H.; Goovaerts, I.; Barnabe, R.C.; Cortada, C.N.M. Seasonal variation in semen quality in Bos indicus and Bos taurus bulls raised under tropical conditions. Theriogenology 2006, 66, 822–888. [Google Scholar] [CrossRef] [PubMed]
- Páez, E.M.; Corredor, E.S. Evaluación de la aptitud reproductiva del toro. Cienc. Y Agric. 2014, 11, 49–59. [Google Scholar] [CrossRef]
- Chenoweth, P. Bull Libido/Serving Capacity. Vet. Clin. N. Am. Food Ani. Pract. 1997, 13, 331–344. [Google Scholar] [CrossRef]
- Lessard, C.; Siqueira, L.G.; D’Amours, O.; Sullivan, R.; Leclerc, P.; Palmer, C. Infertility in a beef bull due to a failure in the capacitation process. Theriogenology 2011, 76, 891–899. [Google Scholar] [CrossRef]
- Overall, K. The ethogram project. J. Vet. Behav. 2013, 1, 1–5. [Google Scholar] [CrossRef]
- Wang, H.; Li, X.G.; Liu, T.Y.; Wu, Q. Data mining and its application in animal husbandry management systems. Adv. Mat. Res. 2014, 926–930, 2525–2528. [Google Scholar] [CrossRef]
- Liakos, K.G.; Busato, P.; Moshou, D.; Pearson, S.; Bochtis, D. Machine Learning in Agriculture: A Review. Sensors 2018, 18, 2674. [Google Scholar] [CrossRef] [PubMed]
- Islam, A.; Al-Badi, A. Emerging Data Sources in Decision Making and AI. Procedia Comput. Sci. 2020, 177, 318–323. [Google Scholar] [CrossRef]
- Vinod, U. Integrating intuition and artificial intelligence in organizational decision-making. Bus. Horiz. 2021, 64, 425–438. [Google Scholar] [CrossRef]
- Sharma, R.; Kamble, S.S.; Gunasekaran, A.; Kumar, V.; Kumar, A. A systematic literature review on machine learning applications for sustainable agriculture supply chain performance. Comput. Oper. Res. 2020, 119, 104926. [Google Scholar] [CrossRef]
- Plenio, J.L.; Bartel, A.; Madureira, A.M.L.; Cerri, R.L.A.; Heuwieser, W.; Borchardt, S. Application note: Validation of BovHEAT—An open-source analysis tool to process data from automated activity monitoring systems in dairy cattle for estrus detection. Comput. Electron. Agric. 2021, 188, 106323. [Google Scholar] [CrossRef]
- Neethirajan, S. The role of sensors, big data, and machine learning in modern animal farming. Sens. Bio-Sens. Res. 2020, 29, 100367. [Google Scholar] [CrossRef]
- Bishop, J.C.; Falzon, G.; Trotter, M.; Kwan, P.; Meek, P.D. Livestock vocalization classification in farm soundscapes. Comput. Electron. Agric. 2019, 162, 531–542. [Google Scholar] [CrossRef]
- Qiao, Y.; Kong, H.; Clark, C.; Lomax, S.; Su, D.; Eiffert, S.; Sukkarieh, S. Intelligent perception for cattle monitoring: A review for cattle identification, body condition score evaluation, and weight estimation. Comput. Electron. Agric. 2021, 185, 106143. [Google Scholar] [CrossRef]
- Bao, J.; Xie, Q. Artificial intelligence in animal farming: A systematic literature review. J. Clean. Prod. 2022, 331, 129956. [Google Scholar] [CrossRef]
- Gorczyca, M.; Maia, H.F.; Campos, A.S.; Gebremedhin, K. Machine learning algorithms to predict core, skin, and hair-coat temperatures of piglets. Comput. Electron. Agric. 2018, 151, 286–294. [Google Scholar] [CrossRef]
- Torres, V.F.; Barrientos, M.; Hernández, H.; Rodríguez, A.; Cervantes, P.; Landi, V.; Hernández, A.; Domínguez, B. Breeding soundness examination and herd proficiency of local genetic groups of bulls in tropical environment conditions in Veracruz. Mexico. Ital. J. Anim. Sci. 2020, 19, 840–855. [Google Scholar] [CrossRef]
- Oliveira, S.R.; Jardim, J.O.; Peripolli, V.; Antunes, E.; Gonçalves, J.B. Reproductive success or failure in four breed groups of beef bulls. R Bras. Zootec. 2015, 44, 240–247. [Google Scholar] [CrossRef]
- Sollenberger, L. Sustainable production systems for Cynodon species in the subtropics and tropics. R Bras. Zootec. 2008, 37, 85–100. [Google Scholar] [CrossRef]
- Cruz, A.; Hernández, A.; Chay, A.J.; Mendoza, S.I.; Ramírez, S.; Rojas, A.R.; Ventura, J. Componentes del rendimiento y valor nutritivo de Brachiaria humidicola cv Chetumal a diferentes estrategias de pastoreo. Rev. Mex. De Cienc. Agrícolas 2017, 8, 599–610. [Google Scholar] [CrossRef]
- Perea, F.; Soto, E.; González, C.; Soto, G.; Hernández, H. Factors affecting fertility according to the postpartum period in crossbred dual-purpose suckling cows in the tropics. Trop. Anim. Health Prod. 2005, 37, 559–572. [Google Scholar] [CrossRef]
- Galina, C.S.; Horn, M.M.; Molina, R. Reproductive behavior in bulls raised under tropical and subtropical conditions. Horm. Behav. 2007, 52, 26–31. [Google Scholar] [CrossRef]
- Koziol, J.H.; Chance, L.A. Society for Theriogenology Manual for Breeding Soundness Examination of Bulls, 2nd ed.; Society for Theriogenology: Pike Road, AL, USA, 2018. [Google Scholar]
- Kunkle, W.E.; Sand, R.S.; Rae, D.O. Effect of Body Condition on Productivity in Beef Cattle. Department of Animal Science, Florida, Cooperative Extension Service, Institute of Food and Agricultural Sciences, University of Florida. 1994, SP-144. Available online: https://original-ufdc.uflib.ufl.edu/IR00004528/00001 (accessed on 30 November 2023).
- Beggs, D.; Bertram, J.; Chenoweth, P.; Entwistle, K.; Fordyce, G.; Johnston, H.; Johnston, P.; McGowan, M.; Niethe, G. Guidelines for using the bull breeding soundness evaluation form. In Veterinary Bull Breeding Soundness Evaluation, 1st ed.; Norman, S., Ed.; The University of Queensland: Brisbane, Australia; Australian Veterinary Association: Sydney, Australia, 2013; pp. 75–88. [Google Scholar]
- Chenoweth, P.; Hopkins, F.M.; Spitzer, J.C.; Larsen, R.E. Guidelines for using the bull breeding soundness evaluation form. Clin. Theriogenol. 2010, 2, 43–50. [Google Scholar]
- Furman, J.W.; Ball, L.; Seidel, G.E., Jr. Electroejaculation of bulls using pulse waves of variable frequency and length. J. Anim. Sci. 1975, 40, 665–670. [Google Scholar] [CrossRef]
- Moskovtsev, S.I.; Librach, C.L. Methods of sperm vitality assessment. Methods Mol. Biol. 2013, 927, 13–19. [Google Scholar] [CrossRef]
- Atiq, N.; Ullah, N.; Andrabi, S.; Akhter, S. Comparison of photometer with improved Neubauer hemocytometer and Makler counting chamber for sperm concentration measurement in cattle. Pak. Vet. J. 2011, 31, 83–84. [Google Scholar]
- Barth, A. Bull Breeding Soundness Evaluation, 2nd ed.; The Western Canadian Association of Bovine Practitioners: Saskatoon, Canada, 2000; ISBN 0901016101. [Google Scholar]
- Barth, A. Review: The use of bull breeding soundness evaluation to identify subfertile and infertile bulls. J. Anim. 2018, 12, s158–s164. [Google Scholar] [CrossRef] [PubMed]
- Pedregosa, F.; Varoquaux, G.; Gramfort, A.; Michel, V.; Thirion, B.; Grisel, O.; Blondel, M.; Pretenhofer, P.; Weiss, R.; Dubourg, V.; et al. Scikit-learn: Machine Learning in Python. JMLR 2011, 12, 2825–2830. Available online: https://www.semanticscholar.org/reader/168f28ac3c8c7ea63bf7ed25f2288e8b67e2fe74 (accessed on 30 November 2023).
- Abadi, M.; Barham, P.; Chen, J.; Chen, Z.; Davis, A.; Den, J.; Devin, M.; Ghemawat, S.; Irving, G.; Isard, M.; et al. Tensorflow: A system for large-scale machine learning. In Proceedings of the 12th “USENIX” Symposium on Operating Systems Design and Implementation, Savannah, GA, USA, 2–4 November 2016. [Google Scholar]
- Engelken, T.J. The development of beef breeding bulls. Theriogenology 2008, 70, 573–575. [Google Scholar] [CrossRef] [PubMed]
- Fan, J.; Li, R. Variable selection via nonconcave penalized likelihood and its oracle properties. J. Am. Stat. Assoc. 2001, 96, 1348–1360. [Google Scholar] [CrossRef]
- Shirfadizar, A.; Miar, Y.; Plastow, G.; Basarab, J.A.J.; Li, C.; Fitzsimmons, C.; Riazi, C.; Manafiazar, G. A machine learning approach to predict the most and the least feed-efficient groups in beef cattle. Smart Agric. Technol. 2023, 5, 100314. [Google Scholar] [CrossRef]


Disclaimer/Publisher’s Note: The statements, opinions and data contained in all publications are solely those of the individual author(s) and contributor(s) and not of MDPI and/or the editor(s). MDPI and/or the editor(s) disclaim responsibility for any injury to people or property resulting from any ideas, methods, instructions or products referred to in the content. |
© 2023 by the authors. Licensee MDPI, Basel, Switzerland. This article is an open access article distributed under the terms and conditions of the Creative Commons Attribution (CC BY) license (https://creativecommons.org/licenses/by/4.0/).