Article

Parametric Design and Genetic Algorithm Optimization of a Natural Light Stereoscopic Cultivation Frame

1
College of Mechanical & Energy Engineering, Beijing University of Technology, Beijing 100124, China
2
Research Center of Intelligent Equipment, Beijing Academy of Agriculture and Forestry Sciences, Beijing 100097, China
*
Author to whom correspondence should be addressed.
Agriculture 2024, 14(1), 84; https://doi.org/10.3390/agriculture14010084
Submission received: 22 November 2023 / Revised: 28 December 2023 / Accepted: 30 December 2023 / Published: 30 December 2023

Abstract

:
Vertical farming (VF) is an emerging cultivation frame that maximizes total plant production. However, the high energy-consuming artificial light sources for plants growing in the lower and middle layers significantly affect the sustainability of the current VF systems. To address the challenges of supplementary lighting energy consumption, this study explored and optimized the structural design of cultivation frames in VF using parametric modeling, a light simulation platform, and a genetic algorithm. The optimal structure was stereoscopic, including four groups of cultivation trough units in the lower layer, two groups in the middle layer, and one group in the upper layer, with a layer height of 685 mm and a spacing of 350 mm between the cultivation trough units. A field experiment demonstrated lettuce in the middle and lower layers yielded 82.9% to 92.6% in the upper layer. The proposed natural light stereoscopic cultivation frame (NLSCF) for VF was demonstrated to be feasible through simulations and on-site lettuce cultivation experiments without supplementary lighting. These findings confirmed that the NLSCF could effectively reduce the energy consumption of supplemental lighting with the ensure of lettuce’s regular growth. Moreover, the designing processes of the cultivation frame may elucidate further research on the enhancement of the sustainability and efficiency of VF systems.

1. Introduction

Vertical farming (VF) has garnered global attention as a modern cultivation system that optimizes land utilization rates and ensures high product quality [1,2,3,4]. VF, often implemented in plant factories or urban skyscraper farms, relies on controlled environmental conditions for plant growth [5]. Light is one of the most critical factors in VF, which is closely related to the growth process of plants. Additionally, researchers have conducted various studies regarding crucial factors of VF, such as artificial lighting sources [6,7,8], environmental control [9,10], energy efficiency [11,12], nutrient solutions [13], and planting modes [14]. However, the overreliance on supplemental lighting in VF, accounting for 40% to 80% of the total electricity consumption [15,16,17], poses a substantial barrier to widespread implementation and commercial usage in skyscraper farms and plant factories [18,19].
In response to the challenges posed by artificial supplemental light, researchers have investigated alternative structures of stereoscopic cultivation frames and their interlayer shading influences. For example, Wang et al. compared three widely used vertical cultivation frames (also known as H-shape frames) for the stereo-cultivation of strawberries, showing that both of the three-layer arrangements were worse than the two-layer arrangement regarding light conditions, growth, and yield per plant [20]. Liao et al. found that a stereoscopic vertical cultivation frame could resolve the continuous cropping obstacle in growing Panax notoginseng, but the light intensity of the lower layer was only 1/10 of the upper layer even at noon [21]. Recent evidence showed that the staggered arrangement of cultivation frames (also known as the A-shape or trapezoidal frames) offers superior light conditions for crops compared to traditional vertical frames [22,23,24]. In addition, Wang et al. even added a rotating mechanism to an A-shape cultivation frame, aligning with the sun’s direction to significantly increase natural light utilization and the overall strawberry yield. However, the complex structure and high maintenance costs limit its practical applicability [25].
Taken together, these studies highlight that optimizing cultivation frame structures presents a cost-effective strategy for increasing crop yields while mitigating energy consumption. Nevertheless, existing studies have often employed predesigned cultivation frame structures, leaving the complex influence of structural parameters, such as arrangement directions, layer height, and the number of cultivation trough units (CTUs), in light distribution inadequately explored. Notably, challenges related to shading in the lower and middle layers of cultivation frames remain unresolved.
Recent academic discussions have emphasized the advantages of parametric design, which intelligently links essential parameters to performance optimization during the early stages of design. By simultaneously integrating and coordinating design components with environmental factors, specific software, plug-ins, and intelligent algorithms of the parametric design could be helpful in modifying and improving a design effectively. For example, light simulation software, such as Rhino 7/Grasshopper, were used to optimize the external shading facilities in building design [26,27]. Light simulation has been used in agricultural research in recent years, such as the radiance, to design the light absorption of individual plants [28] and the light distribution at the canopy of mango trees [29]. These studies offered promising ways of exploring the patterns of light distribution in the cultivation frame. Additionally, genetic algorithms have found widespread application in optimizing greenhouse climate factors and estimating the multivariate nature of the greenhouse system [30].
In light of these considerations, we make the assumption that the innate structure of the cultivation frame in VF relates directly to the shading issues of its lower layers. By investigating the effect of the growing frame structure on the light conditions of the crop, it is possible to use a low cost to achieve higher yields. Light simulation and a genetic algorithm become a feasible way to solve the shortage of light in the lower layer of the stereoscopic cultivation frame and to reduce the high energy consumption of the VF.
This study is driven by the overarching objective of optimizing the structural design of VF cultivation frames to address the challenges of supplementary lighting energy consumption. Specifically, the research aim is to introduce a natural light stereoscopic cultivation frame (NLSCF) that not only reduces energy consumption but also enhances light distribution for optimal crop growth. Parametric models and a light simulation platform were built for the NLSCF using Grasshopper and Ladybird plug-ins. Then, we analyzed and optimized other structural parameters of the NLSCF by the multi-objective genetic algorithm. Finally, we applied a field cultivation experiment to explore if the NLSCF could meet the lighting needs of lettuce. Therefore, the results are anticipated to provide valuable insights into resolving shading issues in the lower layers of the stereoscopic cultivation frame, reducing its energy consumption of supplemental light and improving the sustainability of VF. This research and the NLSCF are poised to benefit agricultural scientists, agricultural technology developers, and practitioners in vertical farming, offering practical guidance for optimizing crop growth environments and enhancing agricultural productivity.

2. Materials and Methods

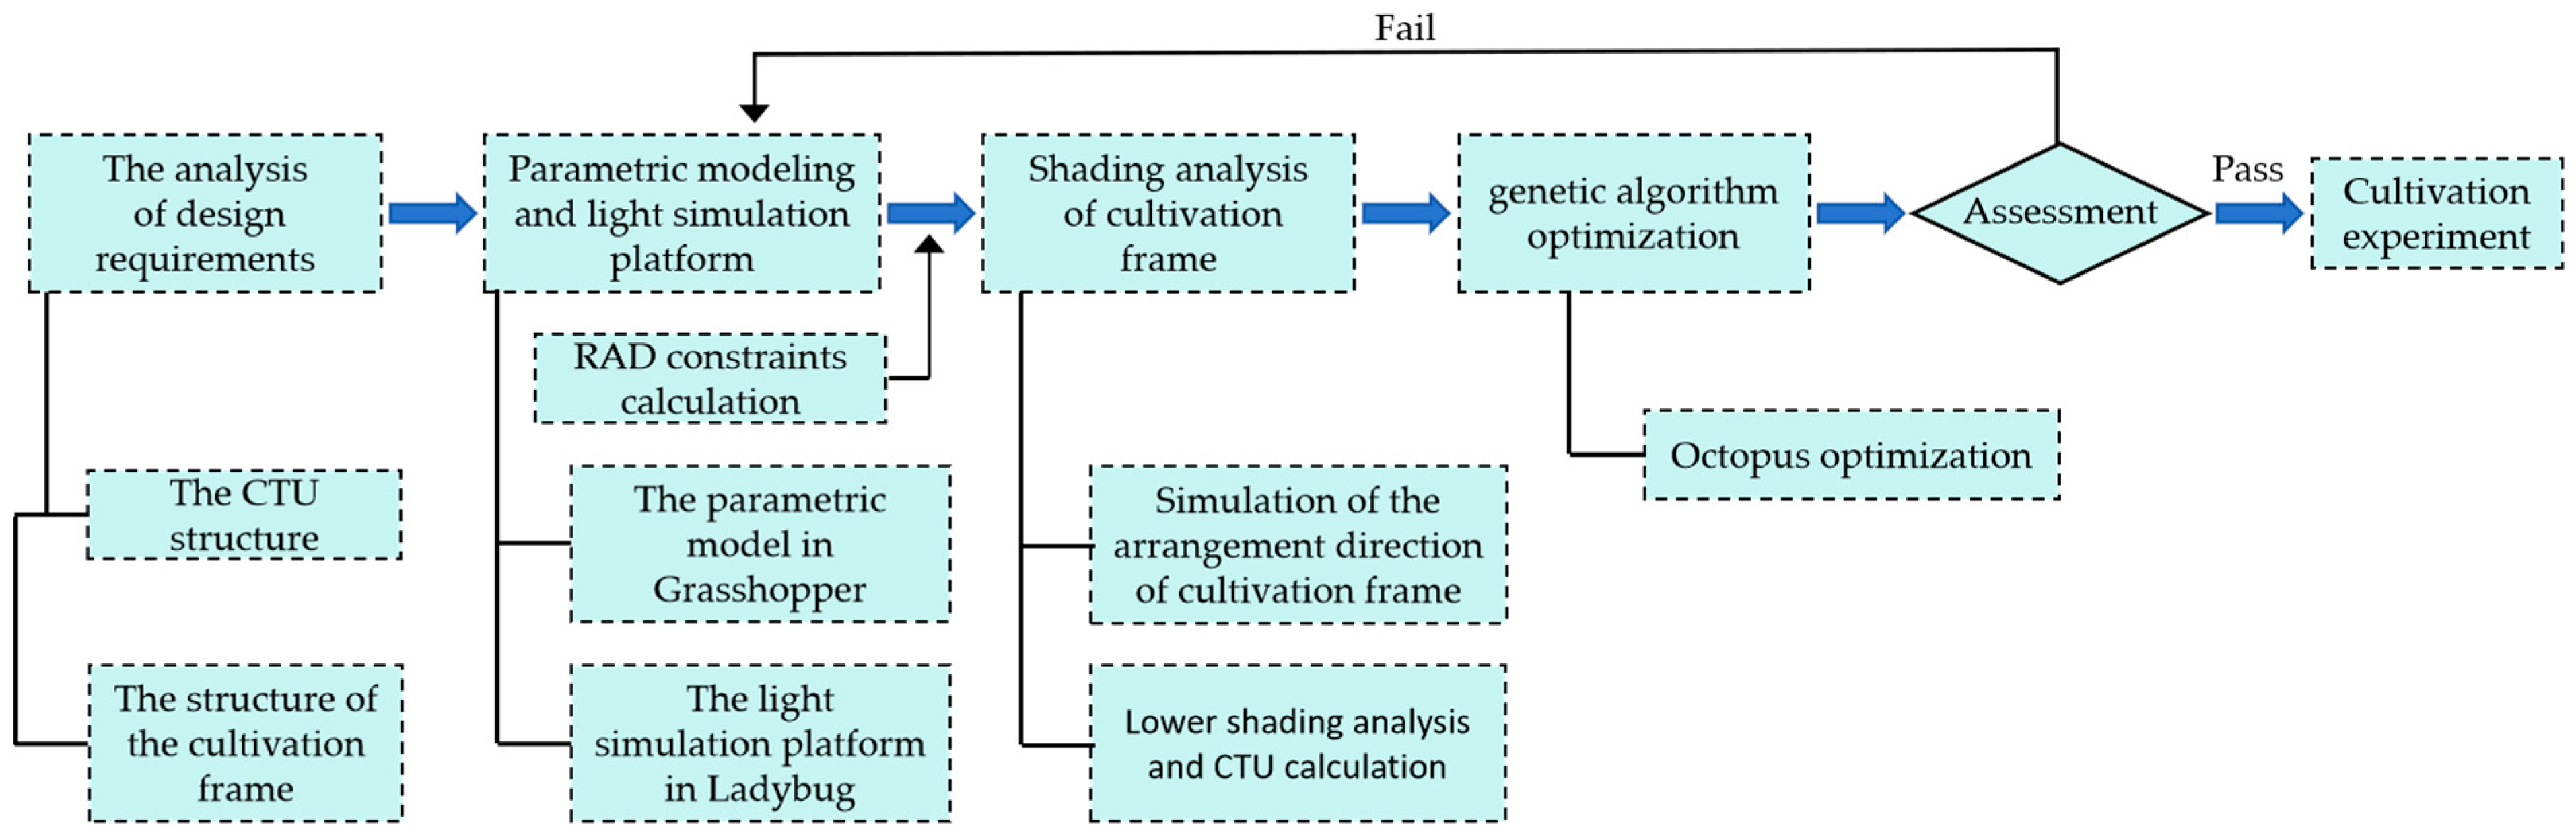
2.1. Research Processes

To provide the lower layer crops with sufficient light to meet their growth requirements, this study combined the cultivation frame structure design demands, the minimum daily light integral for crop growth, parametric modeling, light simulation, and a genetic algorithm to design and optimize the structure of the stereoscopic cultivation frame. We combined cultivation verification experiments so as to ensure the completeness of this research path.
The research outline is shown in Figure 1. In the first stage, we analyzed the design requirements of the cultivation frame, including the structure of the CTU and the structure of the cultivation frame. In the second stage of conducting light simulation of the cultivation frame, we established the parameter model and light simulation platform for each layer of cultivation frames in Grasshopper and Ladybug. In the third stage, we designed the structure of the cultivation frames. We used Ladybug 1.5 to simulate and analyze the lighting of the cultivation frame, including the simulation analysis of the direction of the cultivation frame arrangement, the influence of the structure of the cultivation frame on the solar radiation of the middle and lower layers, and the calculation of the number of CTUs in each layer. The fourth stage was to optimize the structural parameters of the cultivation frame using a genetic algorithm. The fifth stage was to verify the feasibility of the design, and a lettuce cultivation experiment was used for verification. Through the above series of research processes, the design and optimization of the structural parameters were finally completed to meet the design requirements of the NLSCF.

2.2. The Software and Design Requirement Analysis

2.2.1. Software

The software Grasshopper used in this study is a parametric modeling plug-in in the 3D modeling software Rhino 7. It uses program algorithms to generate parametric models and render 3D models in Rh. Designers can model, simulate, and analyze in a single software, saving time in iterative modeling. We used the Ladybug 1.5 plug-in for light simulation analysis in Grasshopper, as it can simulate the sunshine duration and solar radiation to which an object is exposed, as well as work with parametric design software. Grasshopper also has a multi-objective genetic algorithm solver, which can optimize multiple target values [31].

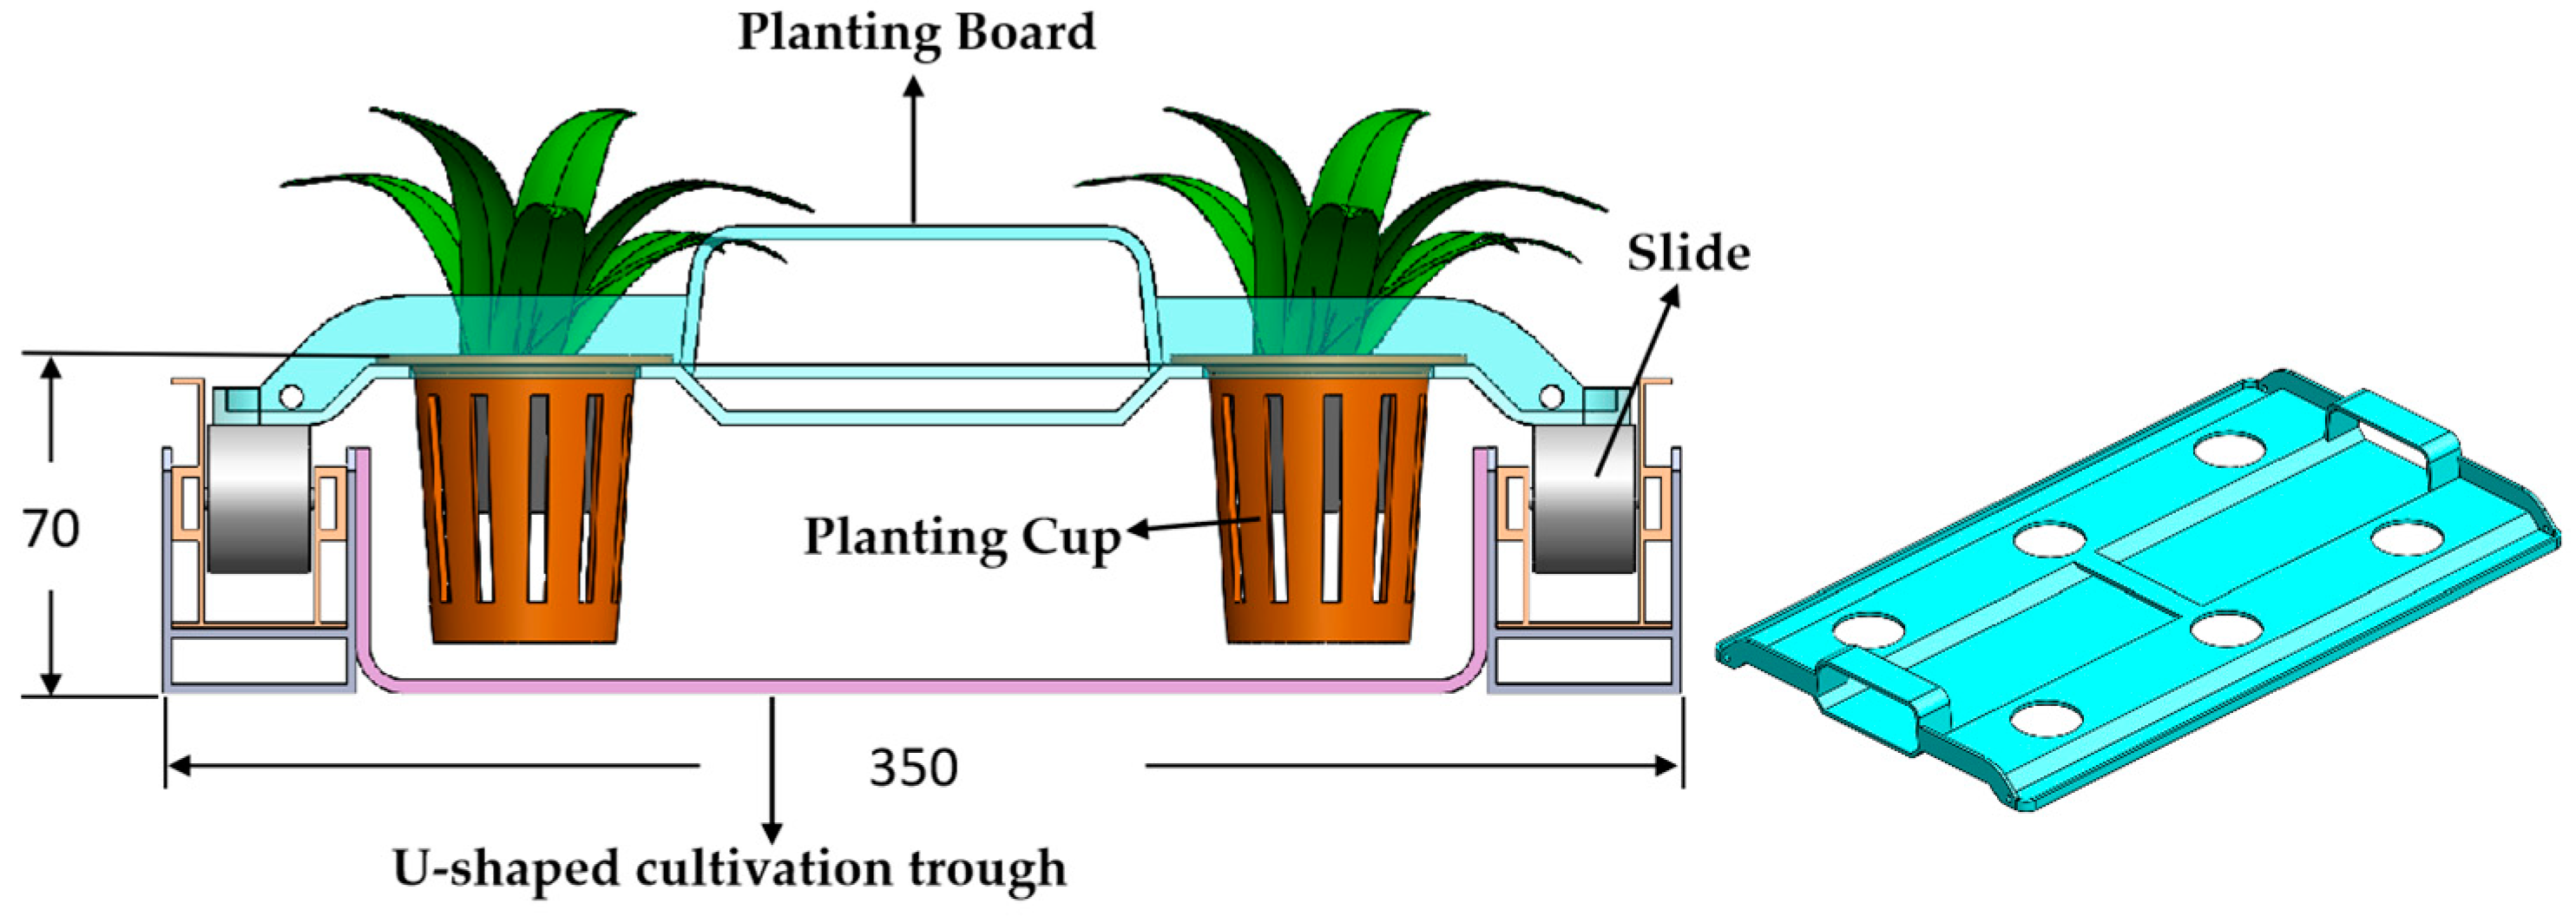
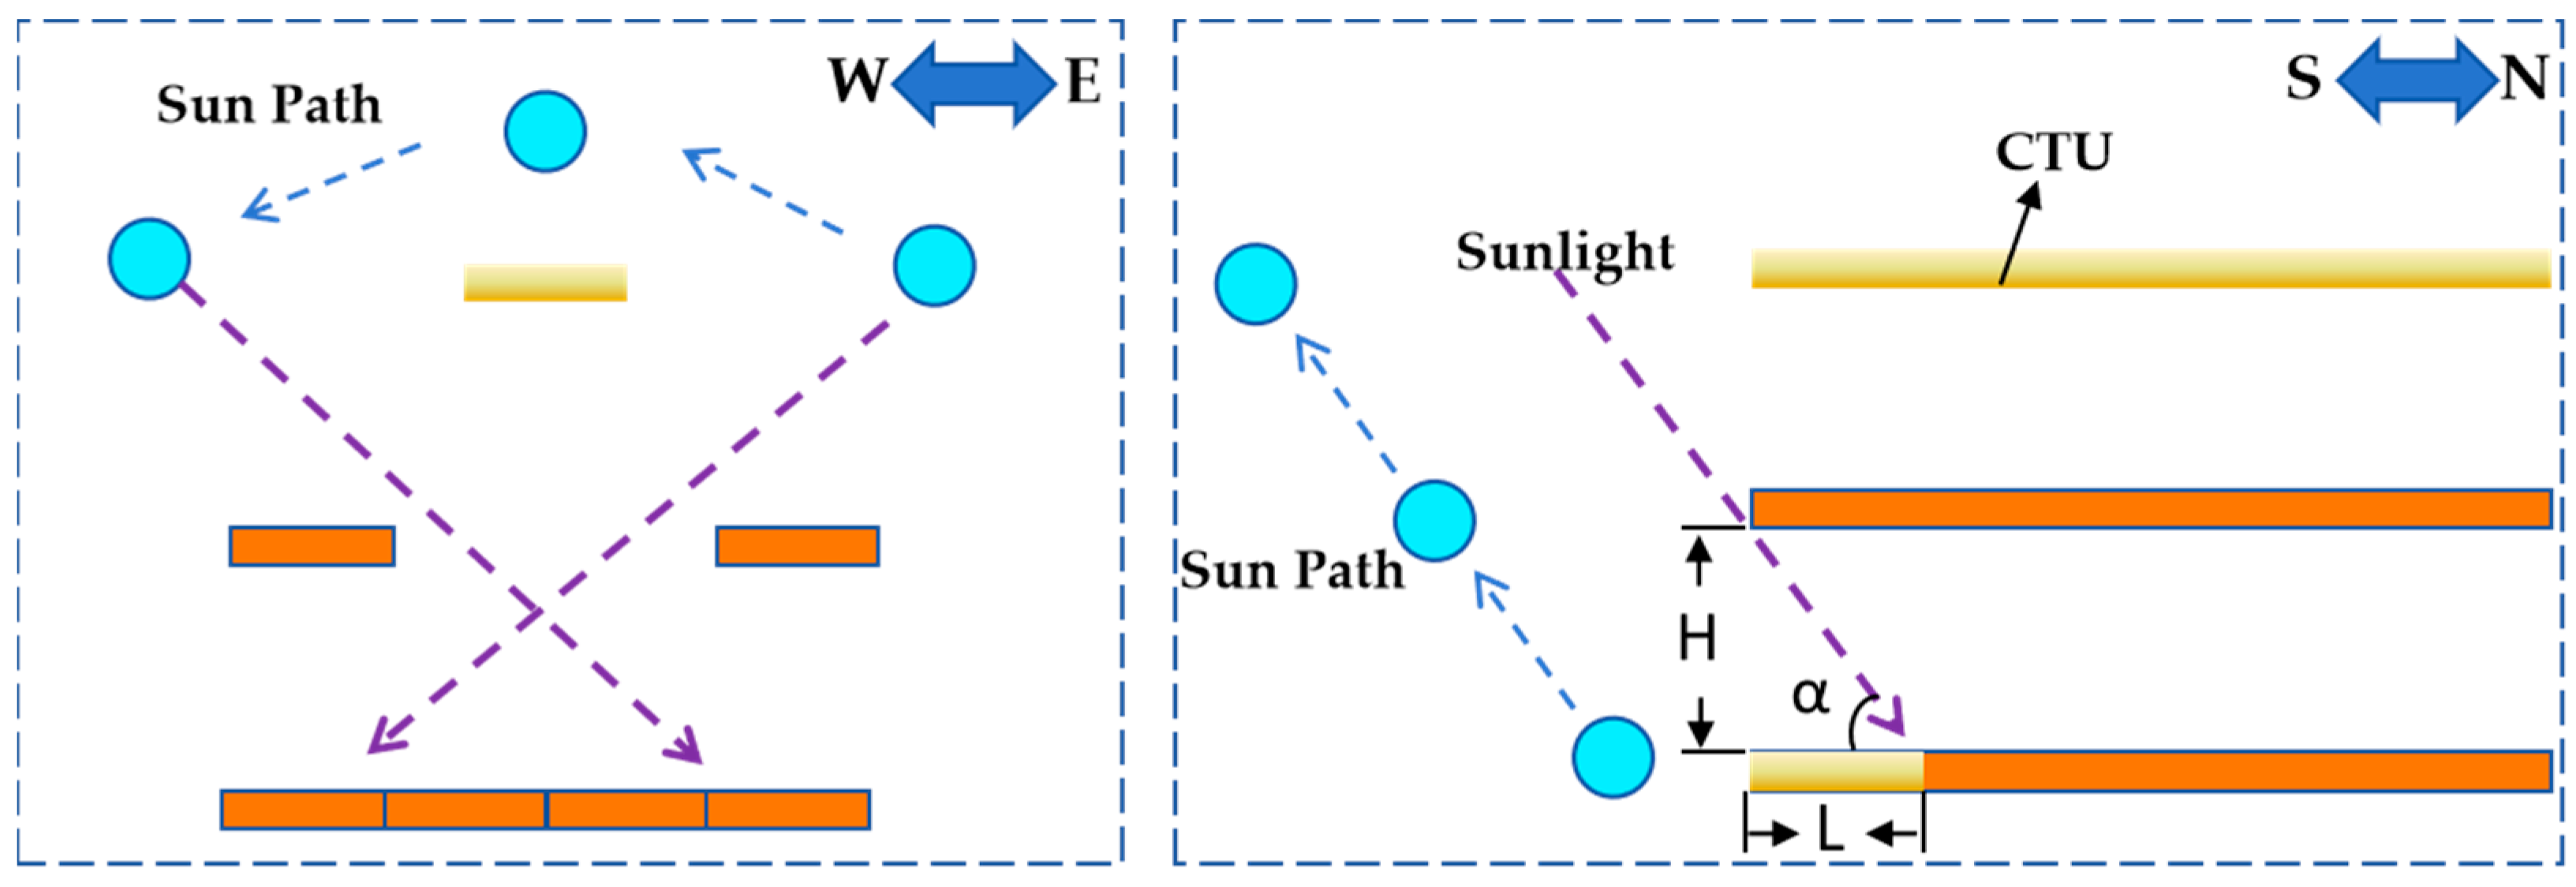
2.2.2. The CTU Structure and the Cultivation Frame Parameter Design Requirements

As shown in Figure 2, the CTU in this study is composed of a planting board, a planting cup, slides, and a U-shaped cultivation trough. Slides are installed at both ends of the cultivation trough, facilitating the handling of the cultivation plates. The U-shaped cultivation troughs are used for easy interior cleaning. The width of the CTU is 350 mm, the spacing of the cultivation holes is 175 mm, and the height is 70 mm. Each cultivation board is capable of planting 6 lettuces. To facilitate manual operation, the structural parameters of the designed NLSCF need to meet the following conditions:
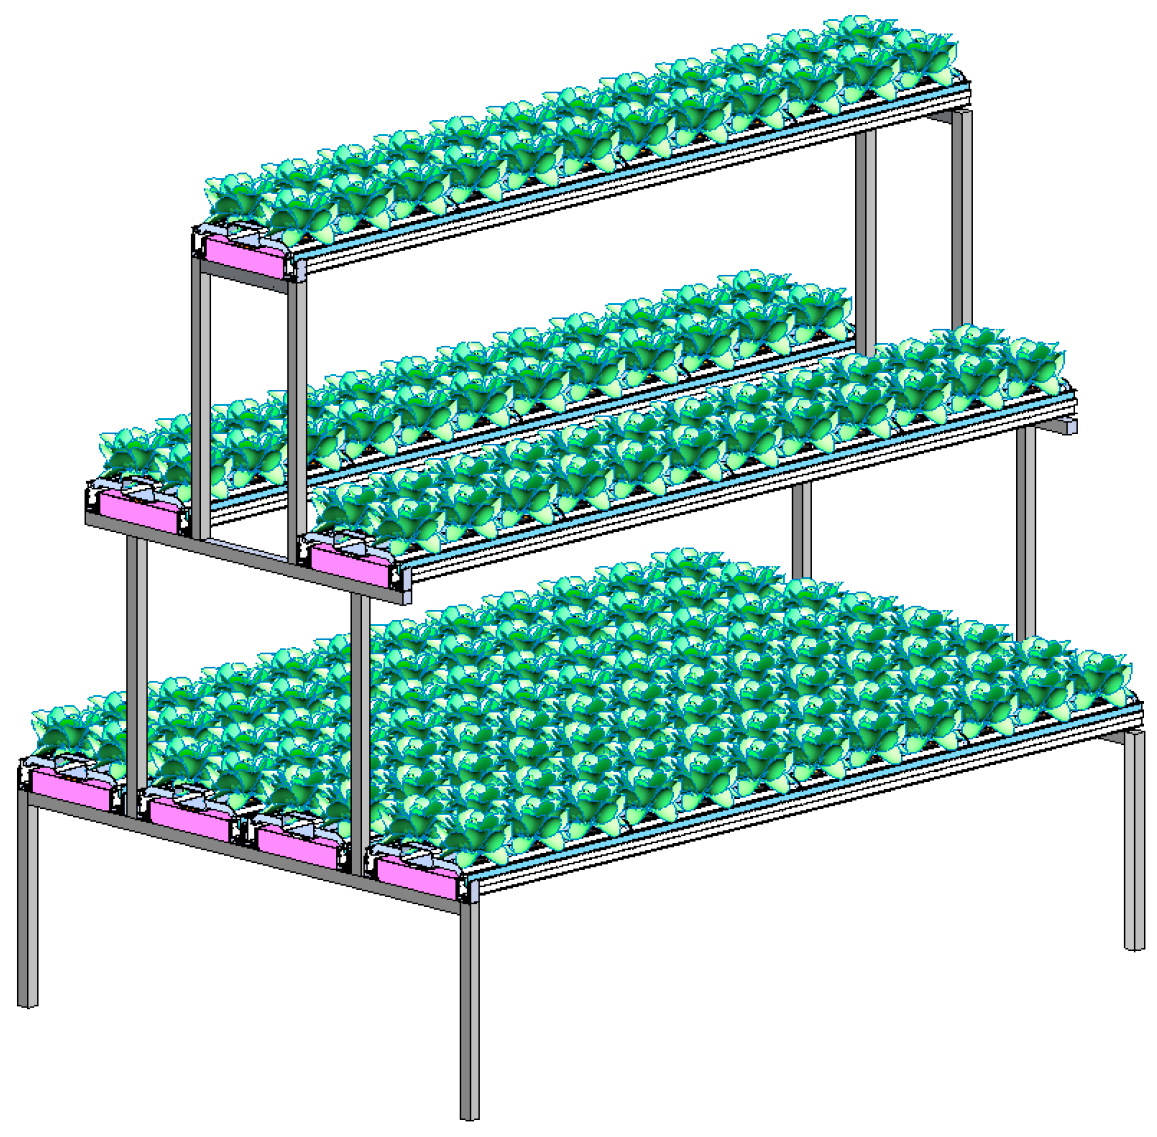
  • The cultivation frame should have 3 layers, the layer height is over 300 mm, the number of CTUs in the lower layer is 4 groups, and the overall width is 1400 mm.
  • The height of the cultivation frame should not exceed 2 m, and the between-group distance of the cultivation frame is 500 mm.
  • The width of the middle and upper layers should not exceed the width of the bottom layer.

2.3. Establishment of the Parametric Model

To facilitate the simulation analysis, the bracket part of the cultivation frame was omitted in the parametric modeling processes. The parametric variables of the cultivation frame were the layer height (H), the number of CTUs in each layer (N), and the distance between the CTUs (d). Each CTU was simplified as a rectangle with a width of 350 mm, a height of 70 mm, and a length of 4000 mm. Figure 3 is the schematic diagram of the parametric modeling section of the cultivation frame. To comprehensively analyze the shading pattern of the lower layers, the four CTU groups were divided into inner and outer groups for modeling; the height of the lower layer of the CTUs was 400 mm from the ground. To restrict the total height of the cultivation frame to less than 2 m, the layer height (H) ranged from 300 mm to 700 mm, and the number of the CTUs was set, respectively, as N = 1, 2, 3, and 4. The spacing between the CTUs (d) ranged from 0 mm to 700 mm. After analyzing the modeling parameters of the cultivation frame, the complete model of each layer was constructed in Grasshopper, and the parameters were set as digital sliders. Taken together, Figure 4 summarizes the battery connection for the cultivation frame model in Grasshopper.

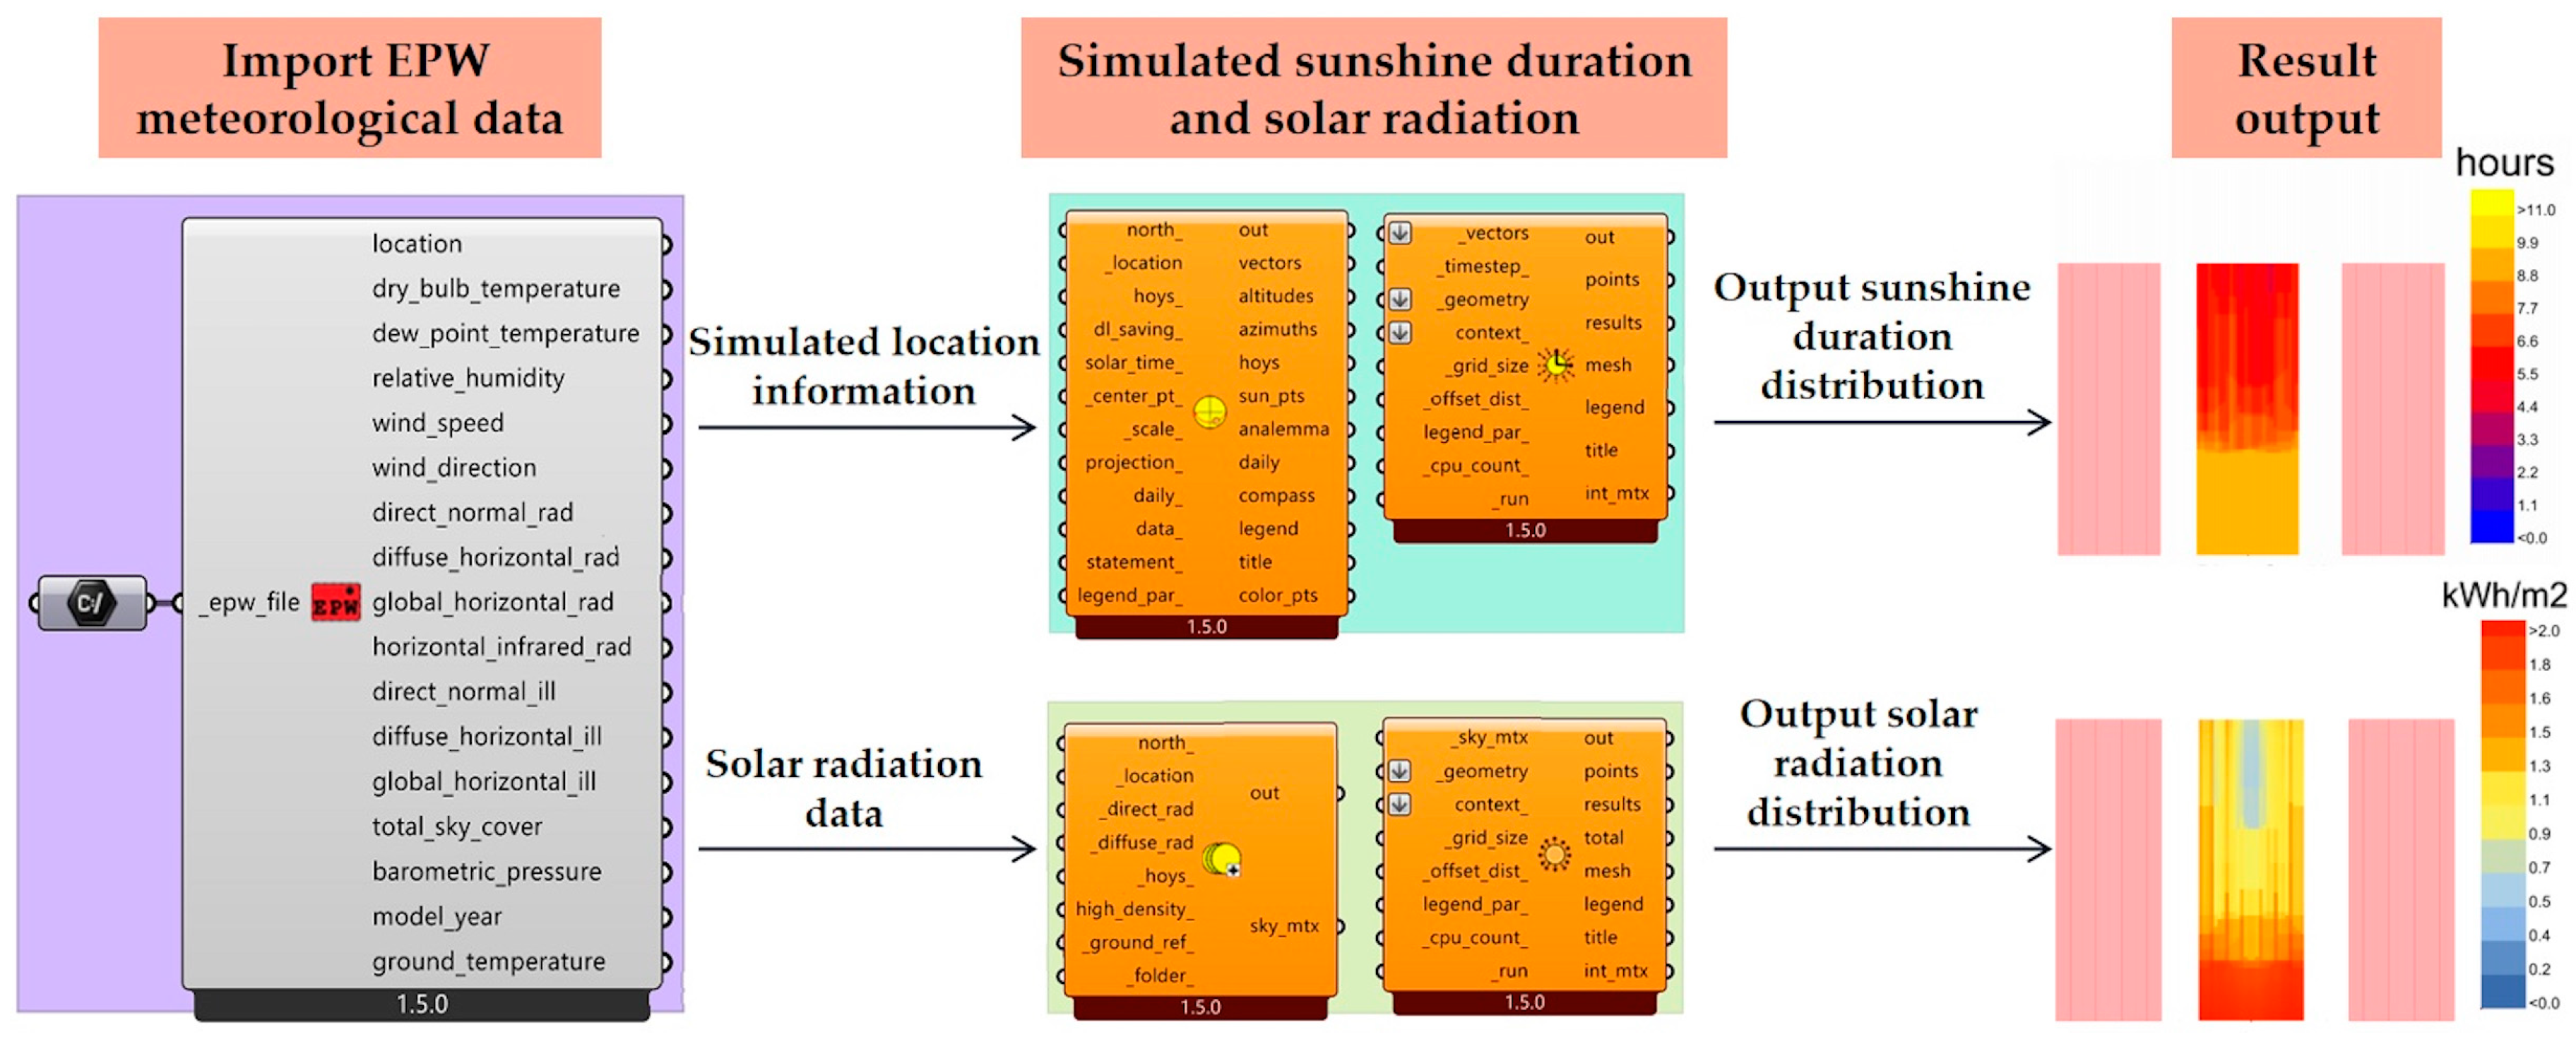
2.4. Establishment of the Light Simulation Platform

To simulate and analyze the sunshine duration and the solar radiation of the cultivation frame, we used the Ladybug 1.5 plug-in to build a light simulation platform for the cultivation frame. The location of the light simulation was Beijing, China. Firstly, we obtained the EPW meteorological data file of Beijing from https://www.ladybug.tools/epwmap/ (accessed on 27 July 2022), which contains the meteorological parameters of Beijing at any time of the year. Secondly, the standard EPW meteorological data file was imported into Ladybug 1.5 to construct the light simulation platform of sunshine duration and solar radiation (Figure 5). To make the results of the study more generalizable, the winter solstice (21 December), which has the worst light conditions in a year, was chosen for the cultivated frame light simulation. The solar trajectory of the winter solstice from 6 a.m. to 6 p.m. is shown in Figure 6. After the construction of the lighting simulation platform is completed, the simulation object (lower or middle layer of the cultivation frame) and the shadings (upper layer and its two sides of the cultivation frame) are, respectively, connected to the Geometry and Context ends of the sunshine duration module and the solar radiation module for simulation. Finally, we exported the simulation results for further analysis.

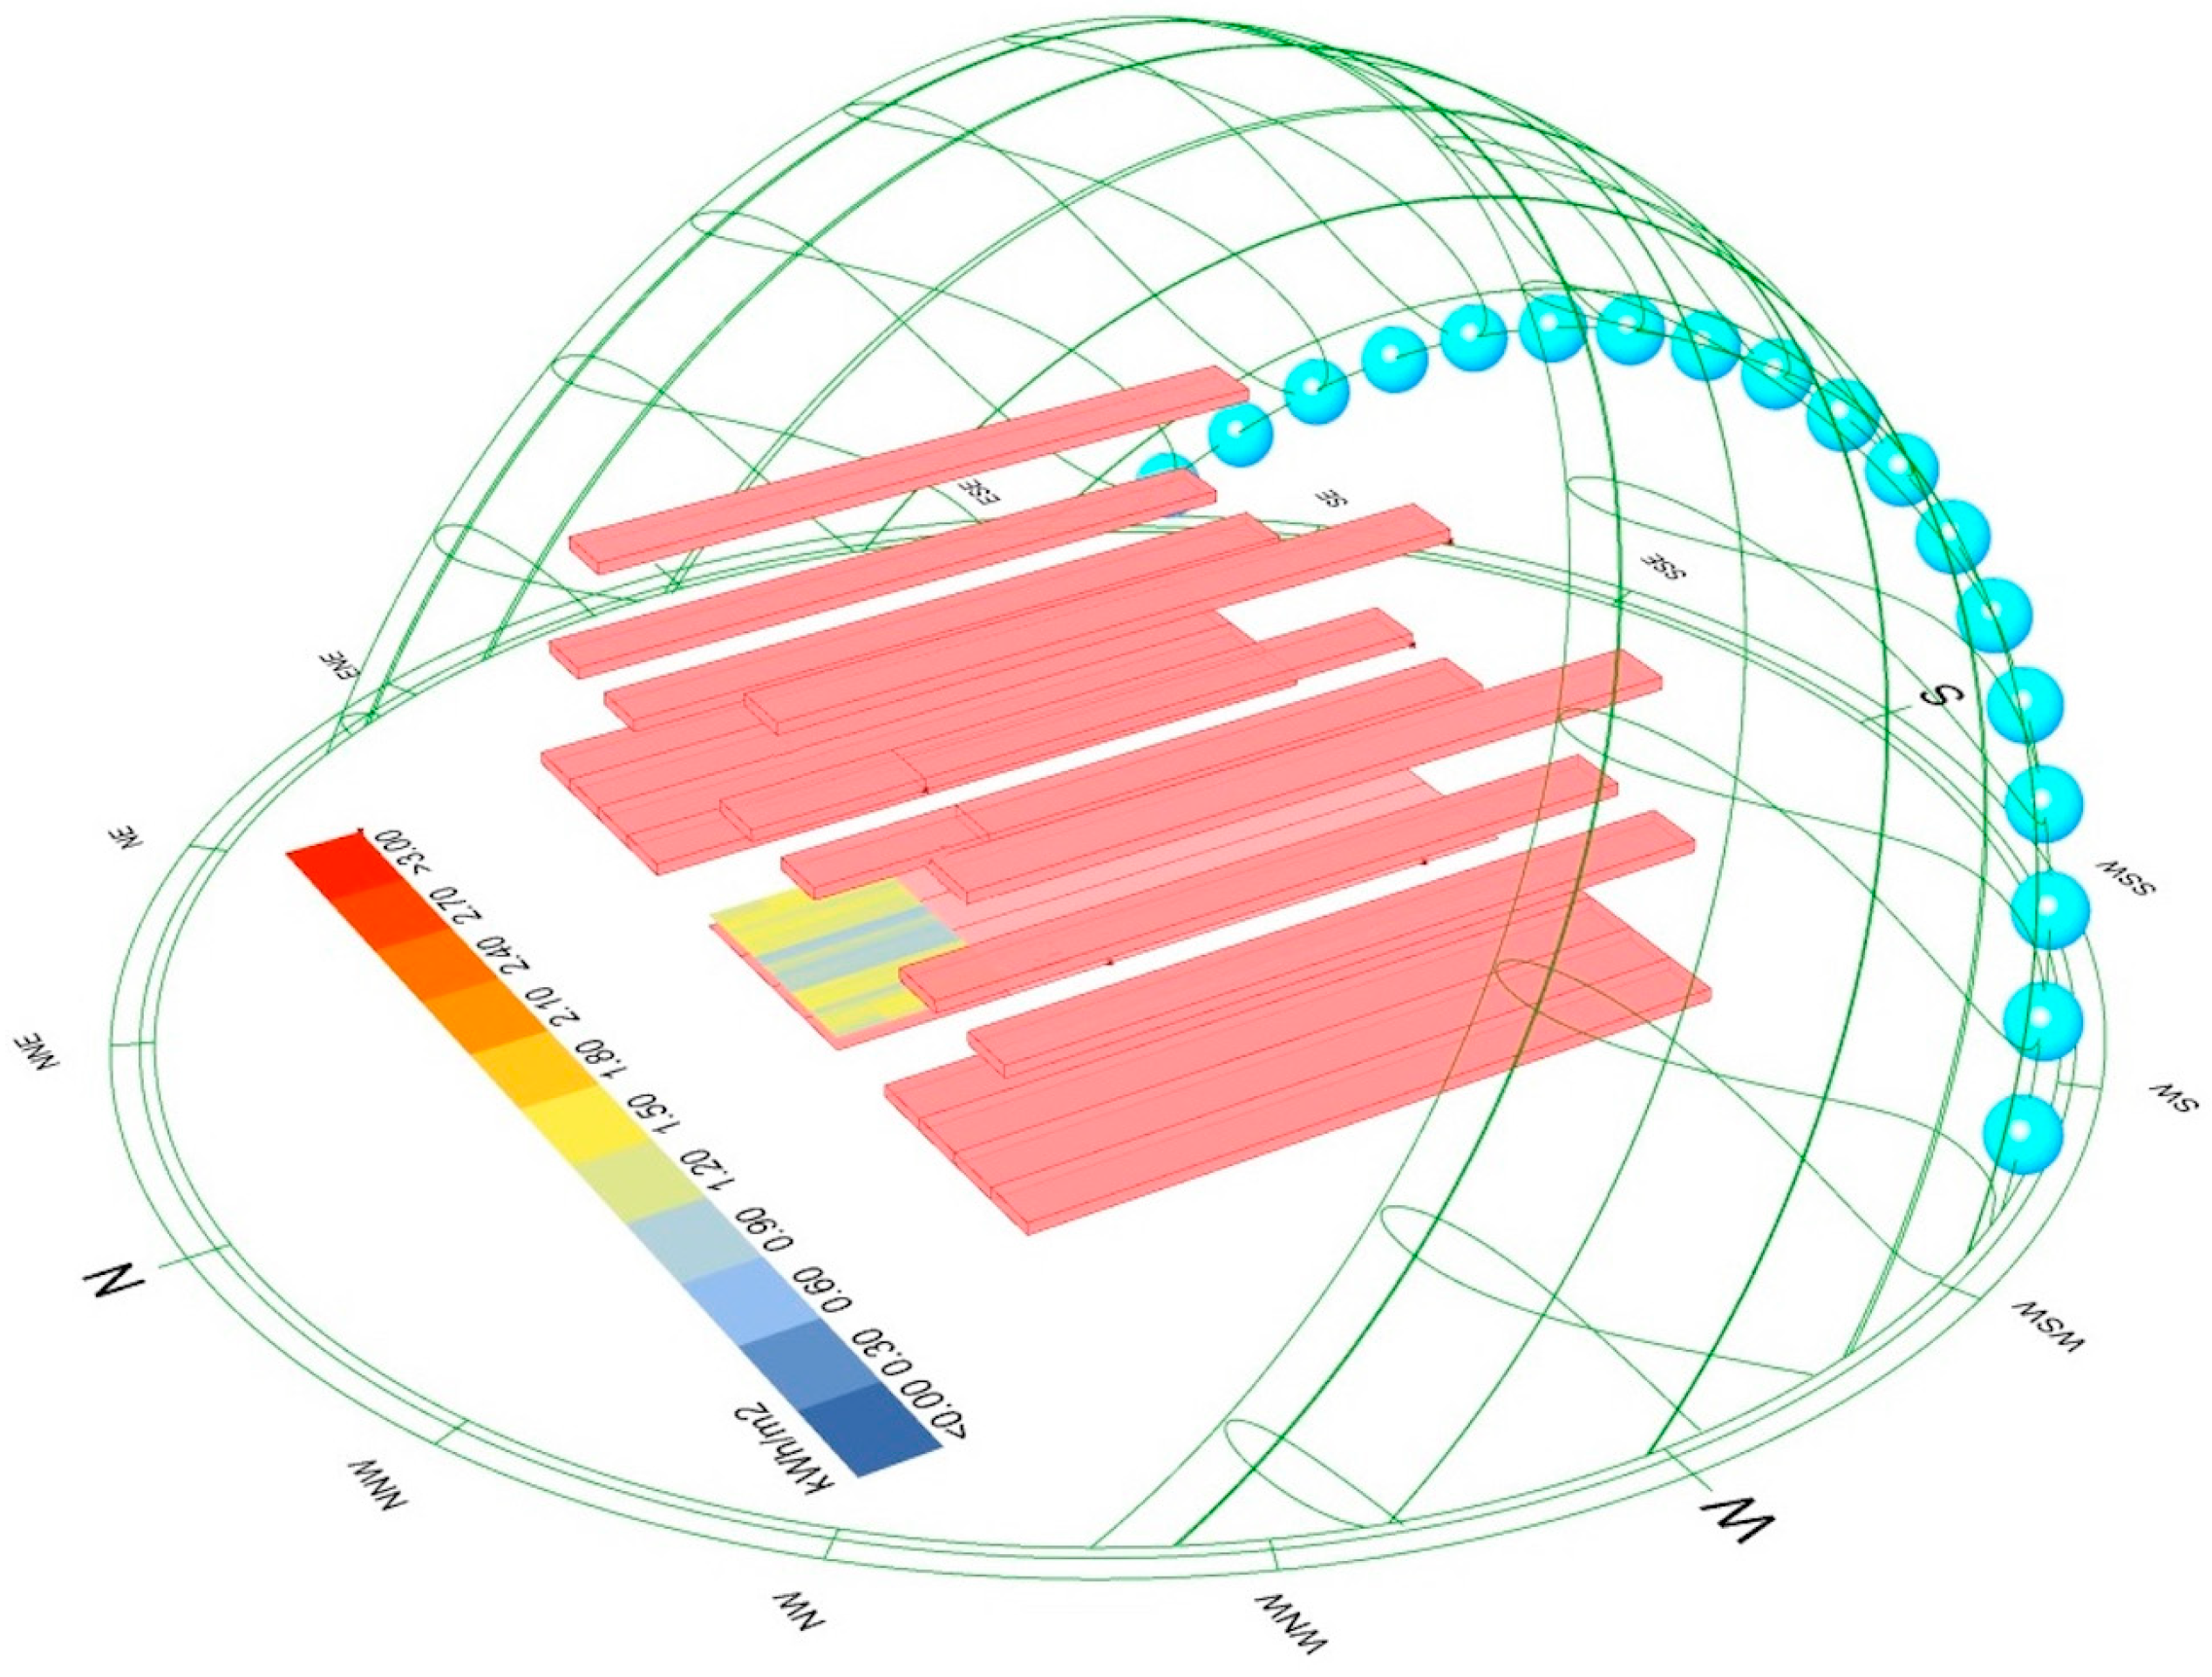
2.5. Calculation of the Solar Radiation Condition

To evaluate if the lower layer of the cultivation frame can obtain the light conditions necessary for crop growth, it is essential to determine the indicator of light conditions and the conversion relationship between this indicator and the simulated values of light. Previous studies have shown that the effect of light on plant growth is mainly reflected by the amount of light radiation received in plant photosynthesis. However, only a small range of the light spectrum—the photosynthetically active radiation between 400 and 700 nm—directly impacts plant development [32]. The accumulated quantity of photosynthetically active radiation reaching plants over 24 h is defined as the daily light integral (DLI), which has been shown to increase proportionally with the crop yield [33]. Therefore, we used the DLI as the light indicator of whether light is sufficient for normal crop growth in VF. The DLI can be converted to a simulated value of solar radiation (RAD) in Equation (1) [34]:
RAD = 5(DLI)/36
DLI is the daily light integral (mol·m−2·day−1); RAD is the simulated value of solar radiation (kWh·m−2).
Lettuce was selected as the experimental crop, which DLI required for normal growth was 6–12 mol·m−2·day−1 [35]. Additionally, since the greenhouse skeleton and covering materials would shade the cultivation frame (e.g., the light transmittance of a general glass greenhouse is 60–90%) [36], we set the light transmittance of the solarization greenhouse in this study to 70%. Therefore, the light conditions required for lettuce growth were DLI ≥ 8.57 mol·m−2·day−1. Combining the above conditions into Equation (1), the RAD required for lettuce growth should be over 1.19 kWh·m−2.

2.6. Genetic Algorithm

To homogenize and maximize the light conditions in the lower layer, this study optimally calculated the solar radiation in the lower layer of the cultivation frame for two objectives, the inner and outer CTU, using a genetic algorithm that is commonly used for multi-objective optimization problems. The instrument used in this study, Octopus, is a multi-objective optimization plug-in in Grasshopper. Octopus exhibits a fast solution speed, ease of operation for multi-objective optimization problems, and integrates Pareto optimality principles with a genetic algorithm. It features a visually intuitive 3D interface for observing and selecting optimal solutions, providing insights into the convergence of the genetic algorithm [37]. Based on the solution set obtained from the Pareto front distribution graph, we employed an iterative approach to optimize the results by adjusting the number of iterations until convergence and extracting the corresponding optimal solutions. Subsequently, we filtered out the optimized parameters and values that met the specified requirements.
As Octopus operators are designed to minimize objectives, we converted the desired maximization problem into a minimization problem through mathematical transformations. The optimization parameters in this study are the spacing of CTUs (d) and the layer height (H). The optimization objective aims to maximize the light intensity for both inner and outer cultivation trough units in the lower layer, with a preference for solutions minimizing the difference between the inner and outer light intensities. The optimization parameters were connected to the G-end, and the calculated solar radiation values of the optimization objectives were connected to the O-end (see Figure 7). The constraint variables of the genetic algorithm are cultivation trough unit spacing d and layer height H (see Table 1). The range of d is constrained to be 0–700 mm, and the range of H is constrained to be 300–700 mm. The key parameters incorporated into the genetic algorithm were Elitism, Mutation Probability, Mutation Rate, Crossover Rate, Population Size, Max Generations, Record interval, and Save interval. The values of each operational parameter were set as shown in Table 2.

2.7. Cultivation Experiment

After the structural parameters of NLSCF were determined, a cultivation validation experiment was conducted to verify each layer’s yield in the cultivation frame. The structure of the experimental NLSCF is shown in Figure 8a. The experiment location was in the glass greenhouse of the Beijing Academy of Agriculture and Forestry Sciences, Beijing, China (39.95° N, 116.28° E). The variety of lettuce selected for the experiment was Flandry from Rijk Zwaan Seed Company in the De Lier, Netherlands. The experimental procedure was as follows: Seedlings were nursed on 4 March 2023, and when the seedlings had 3 leaves and 1 heart on 25 March, the seedlings with the same growth conditions were selected for planting. All layers used identical irrigation conditions and nutrient solution during the planting period, and the temperature of the glasshouse was controlled between 18 and 25 °C. Plants were sampled and tested from the same location on the north side of the cultivation frame after 40 days of growth. The sampling layers were in order of upper, middle, inner, and outer lower layers. In accordance with Lei et al.’s [38] experiences in lettuce yield and quality, the indicators of design effectiveness include plant height (length from the base of the stem to the tallest part of the plant) and plant width (the widest part of the canopy) obtained by measuring live samples from the field, as well as the fresh weight of single plants (with roots removed) determined by taking samples in freshness and measuring them in a laboratory. Measuring equipment were electronic scales (range 0–500 g, accuracy 0.001 g) and straightedge (range 50 cm, accuracy 1 mm). The lettuce fresh weight measurements were retained with 2 valid digits, and plant width and height were retained with 1 valid digit. The average yield of five lettuces was calculated at each measurement and repeated three times (Figure 8b).

3. Results and Discussion

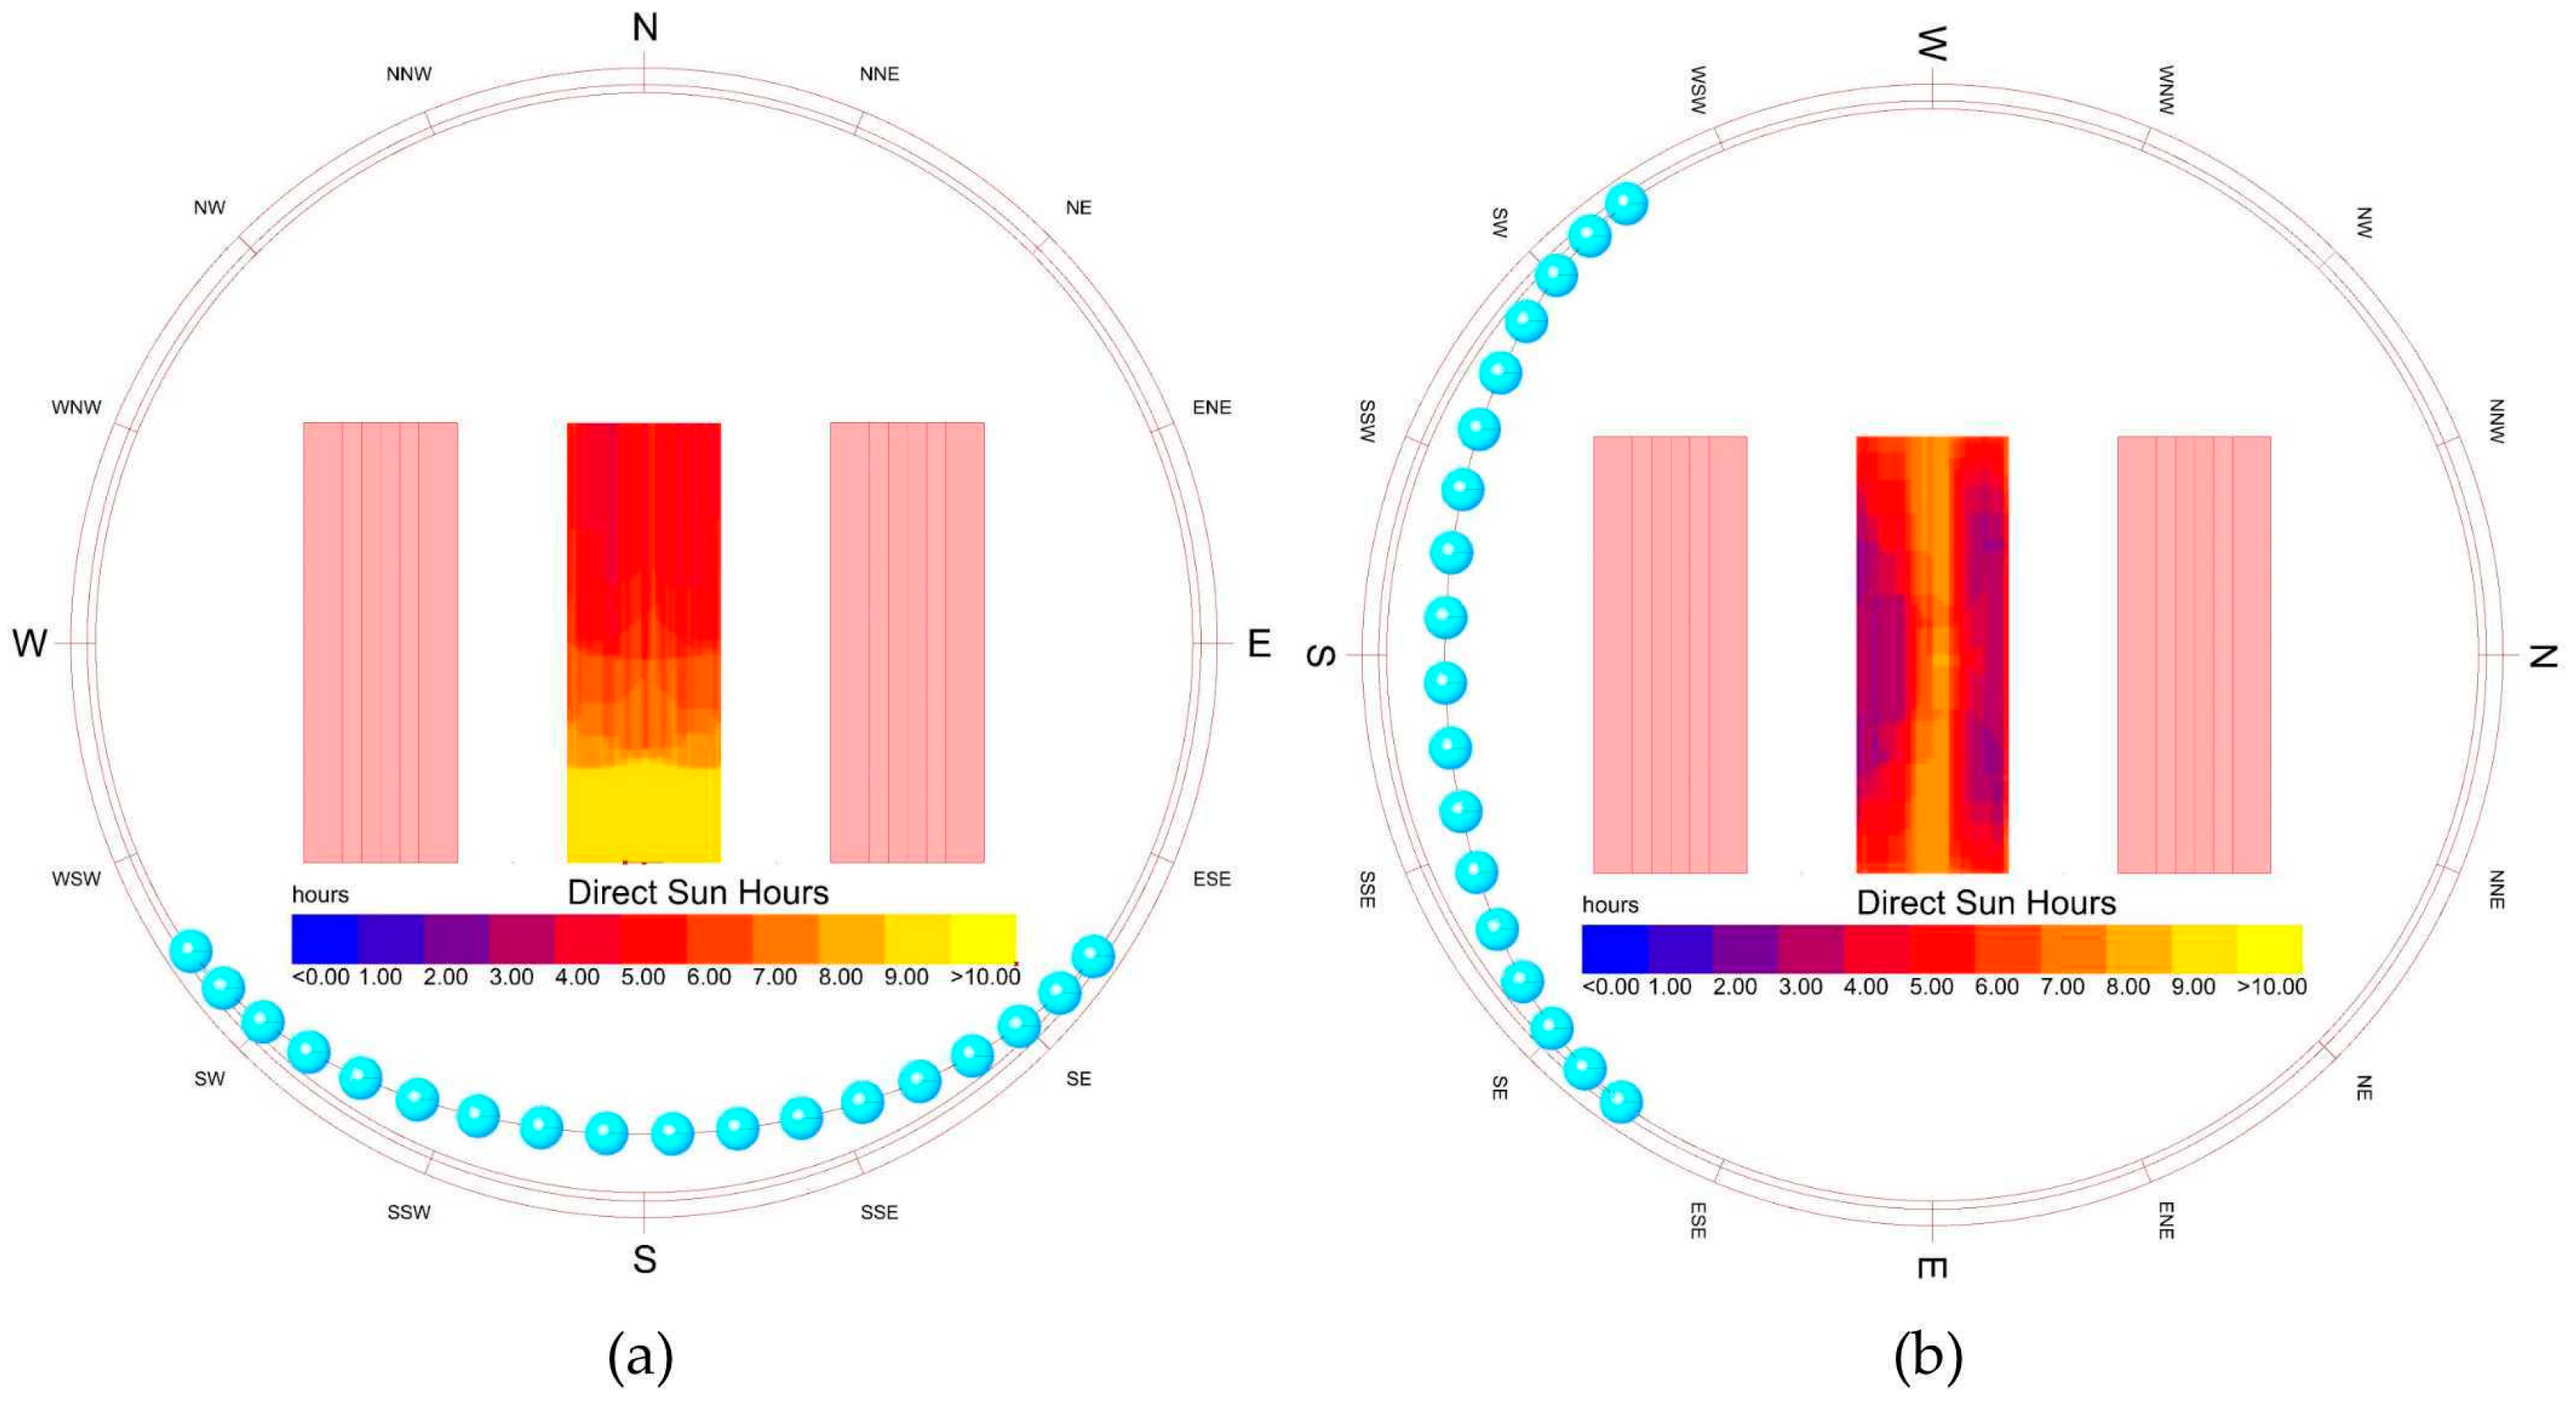
3.1. Analysis of the Arrangement Direction of the Cultivation Frame

Traditionally, cultivation frames have been arranged in either the east–west or north–south direction based on the length of the cultivation frame, influencing the uniformity of crop growth [39]. To determine the optimal orientation for the cultivation frames, this study conducted a comparative simulation of sunshine duration distribution for cultivation frames placed in north–south and east–west directions under identical simulated conditions. Two types of shading structures were employed: other cultivation frames on both sides and mid-layer and upper-layer CTUs within the frame. The cultivation frame structural parameters were consistently set with a layer height of 600 mm, two sets of mid-layer CTUs spaced at 700 mm, and one CTU set in the upper layer. The results of the sunshine duration distribution for both orientations under these simulation conditions are depicted in Figure 9.
As seen in Figure 9, the north–south direction (Figure 9a) outperforms the east–west direction (Figure 9b) in terms of sunshine duration and uniformity in the lower CTUs. Specifically, under the north–south direction, the average daily sunshine duration in the lower layer was 6.16 h, whereas, under the east–west direction, it was only 4.81 h. Additionally, the north–south direction resulted in a gradual reduction in sunshine duration from south to north in the lower CTUs, ensuring uniformity in the east–west direction, with no discernible short sunlight areas. Conversely, the east–west direction exhibited distinct regions of short sunlight on both sides of the lower cultivation frame (depicted in blue), with the central area experiencing longer sunshine durations, leading to overall disparities in sunlight distribution.
Further analysis revealed the critical importance of the relationship between the direction of the sun’s trajectory and the direction of the cultivation frame. When the sun’s trajectory was perpendicular to the frame direction, the shading areas of the upper layers on the lower layer moved with the sun’s trajectory, resulting in periodic exposure to sunlight for various areas of the lower layer, Periodic shading areas were formed in the east–west direction (as depicted in Figure 10 for the north–south direction). Additionally, due to the solar altitude angle, an unshaded area formed on the south side of the lower layer, gradually diminishing from south to north. Conversely, if the frame direction was parallel to the sun’s trajectory (as depicted in Figure 11 for the east–west direction), fully shaded areas were created in the lower layer while the sunlight passing through the shading structure formed a brighter unshaded area in the lower layer, unaffected by changes in the sun’s position.
Based on this analysis, it is evident that the north–south direction, perpendicular to the sun’s trajectory, ensures superior sunshine duration and uniformity in the lower cultivation frame. This aligns with the findings of Chaichana et al. [40] and Wang et al. [20]. Consequently, the designed direction of the NLSCF is consistently chosen as north–south, offering insights for the placement of the VF cultivation frame.

3.2. Analysis of the Influence of the Number of CTUs and the Layer Height on the Shading of the Lower Layer under a Single Shading Layer

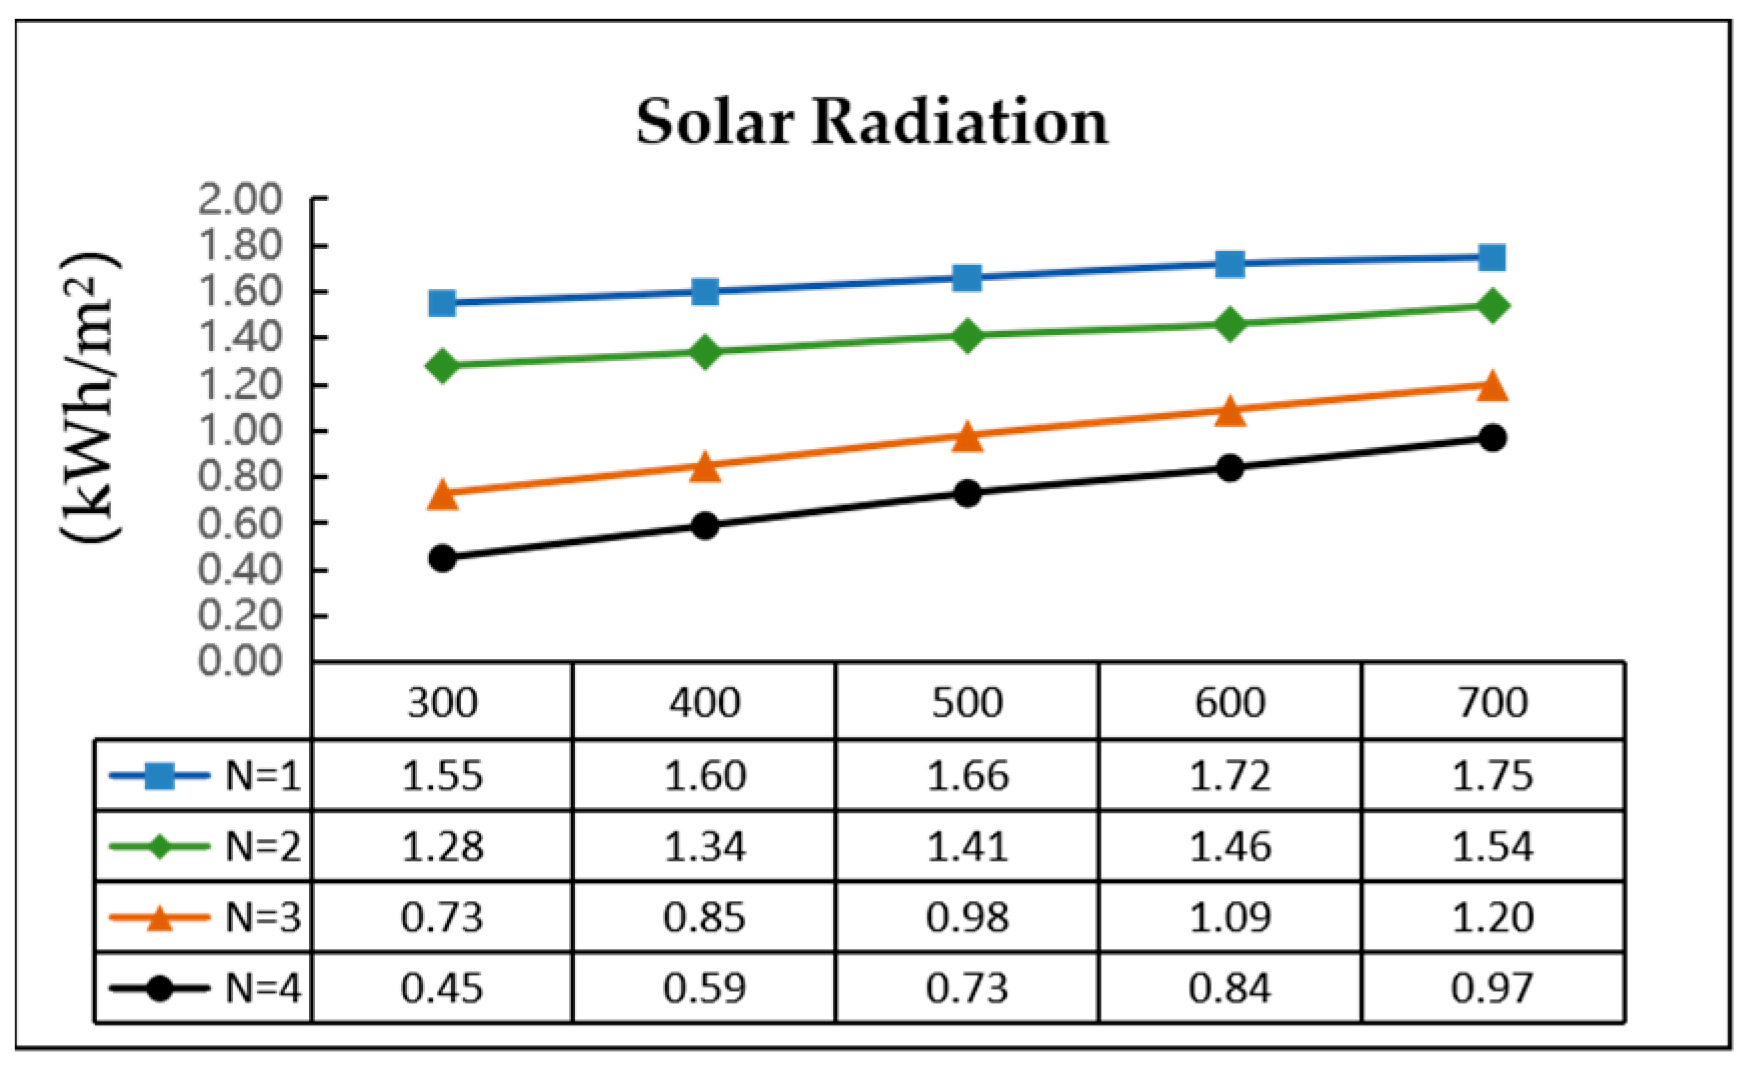
3.2.1. Simulation Calculation of Lower Layer Solar Radiation

To investigate the impact of the number of CTUs and layer height on lower layer shading, this study employed CTU number (N = 1, 2, 3, and 4 groups) and layer height (H = 300 mm, 400 mm, 500 mm, 600 mm, and 700 mm) as independent variables. The study focused on simulating the northern 1 m region of the lower layer. The simulation aimed to calculate the maximum average solar radiation values obtainable in the northern 1m region of the lower layer. The simulation results are presented in Figure 12.
As depicted in Figure 12, it is evident that, with a constant layer height, the maximum average solar radiation in the lower layer exhibits a declining trend with an increase in the number of CTUs. Conversely, when the number of CTUs remains constant, the maximum average solar radiation in the lower layer shows an increasing trend with the elevation of the layer height. When N = 4, the simulated cultivation frame structure resembles an H-shape cultivation frame. When N < 4, the simulated structure resembles an A-shape cultivation frame. As observed in Figure 12, with a decrease in the number of CTUs, the maximum average solar radiation in the lower layer consistently demonstrates an increasing trend. This further substantiates that the structural pattern of the A-shape cultivation frame is more conducive to achieving superior light conditions compared to the novel H-shape cultivation frame structure.

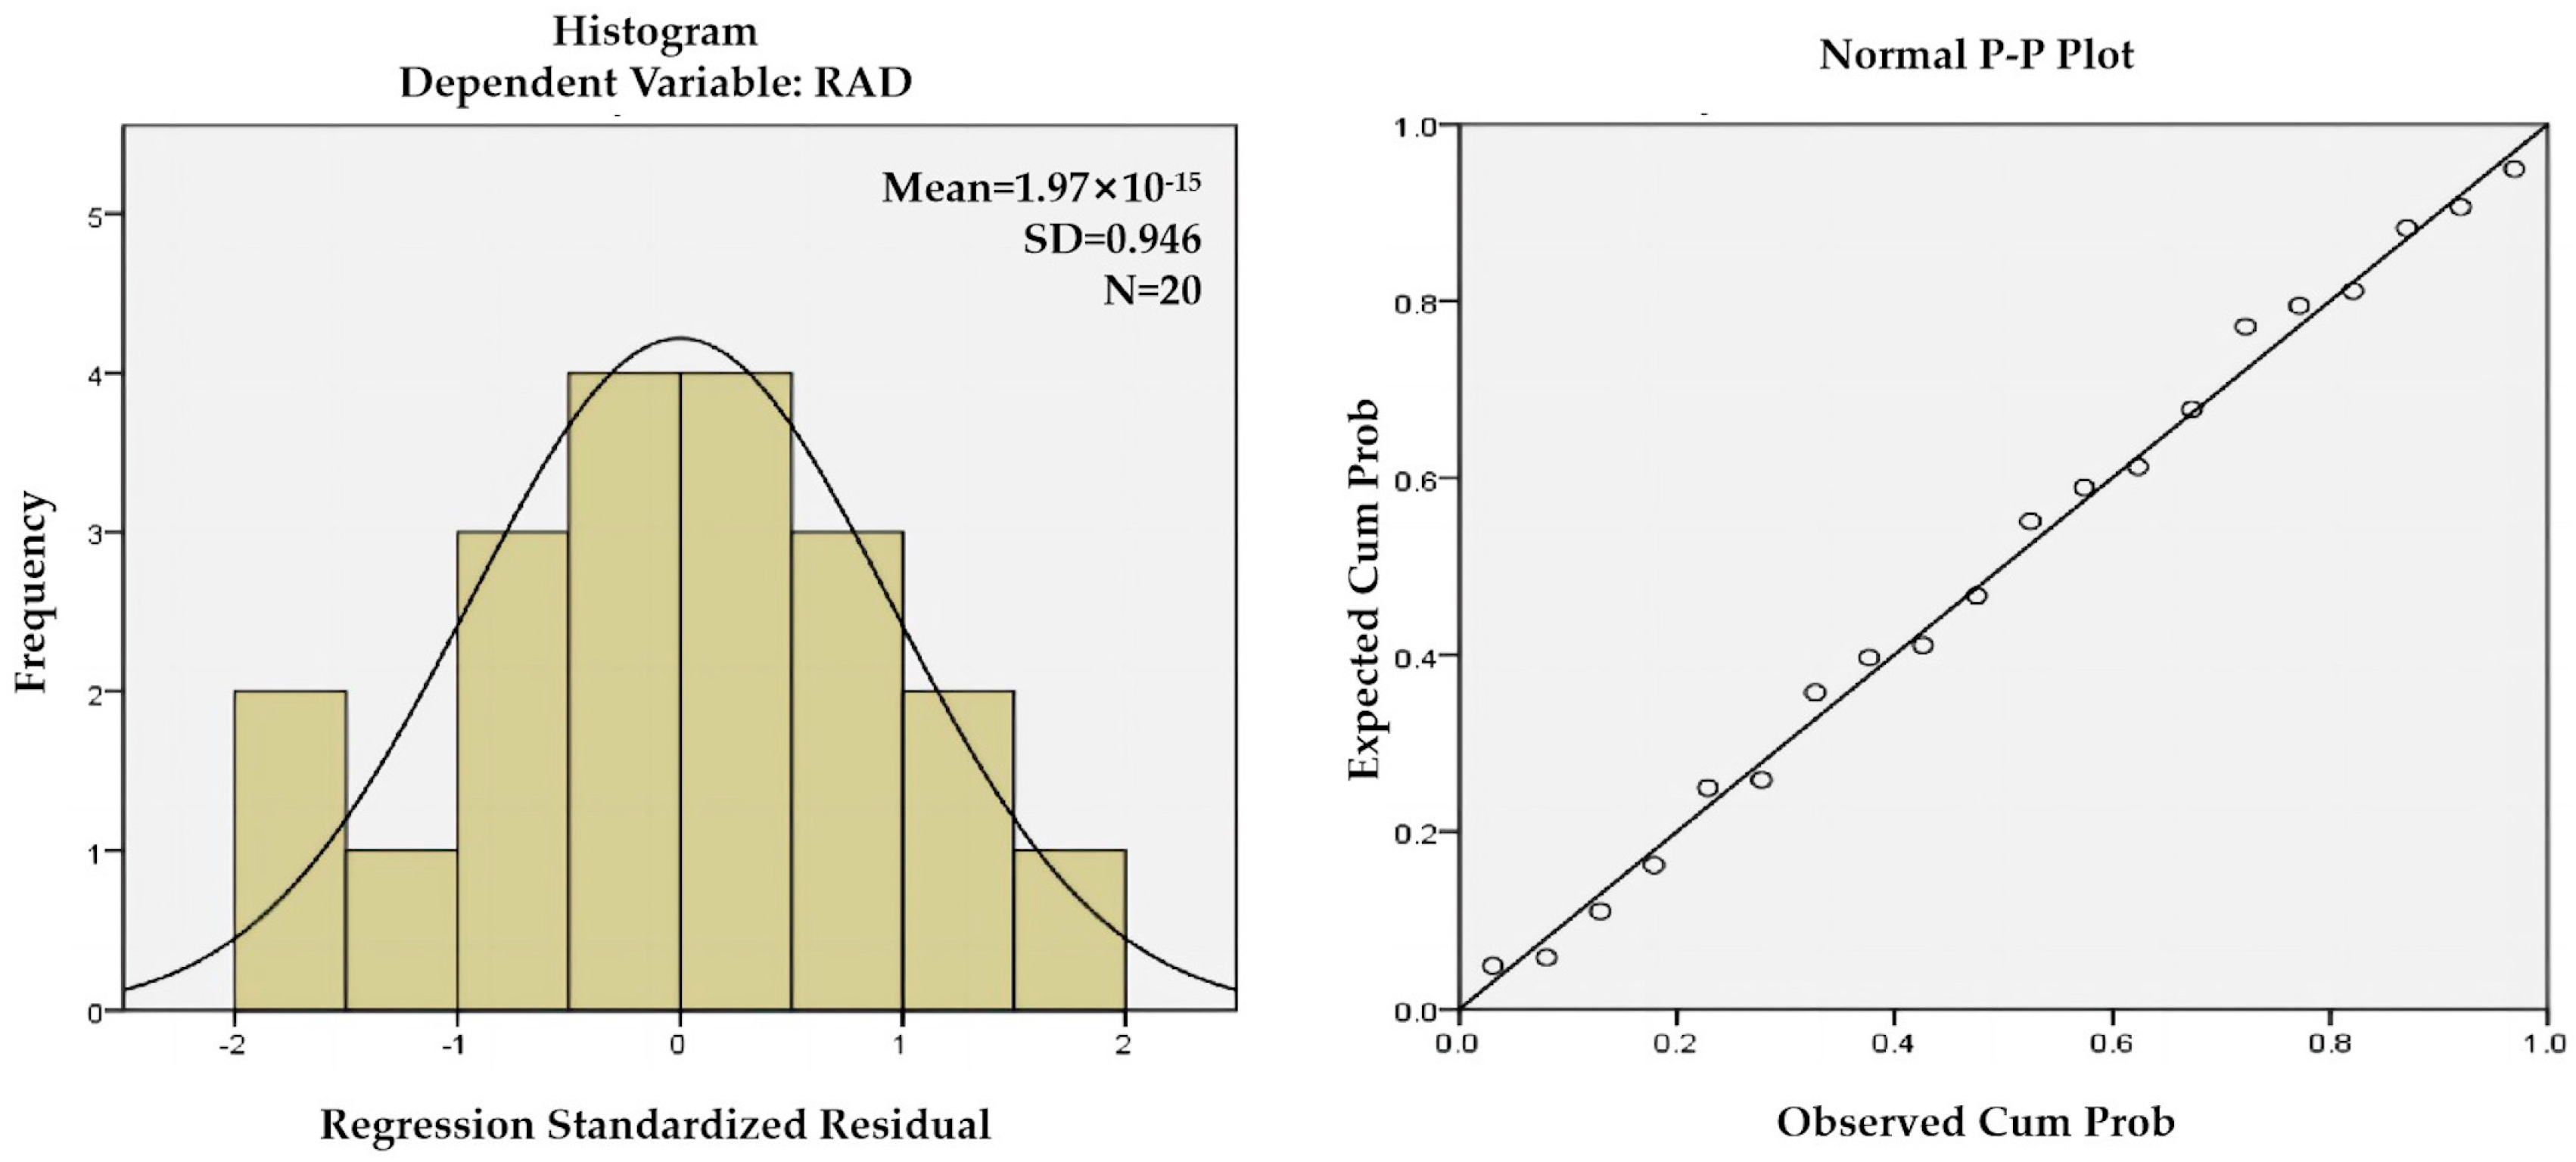
3.2.2. Regression Model Construction and Determination of the Maximum Number of CTUs of the Shading Layers

To comprehensively analyze the influence patterns of the number of CTUs and layer height on the shading effect in the lower layer, SPSS 26.0 software was employed to calculate a linear regression model for the maximum average solar radiation (RAD) in the lower layer. Subsequent to the computations, the results are presented in Table 3, and Figure 13 illustrates the residual analysis. The regression equation is as follows in Formula (2).
RAD = 1.547 − 0.326·N + 0.001·H
RAD is the maximum average solar radiation (kWh·m−2), H is layer height (mm), and N is the number of CTUs. The results indicate a negative impact on the CTU numbers and a positive impact on the layer height. Specifically, when the independent variables are limited to practical ranges, for each additional CTU, the RAD decreases by 0.326 kWh·m−2. Simultaneously, with every 100 mm increase in the layer height, the RAD increases by 0.1 kWh·m−2.
Table 3 shows that the p-values of the number of CTUs (N) and layer height (H) are both less than 0.001, indicating significant influences of these two variables on the solar radiation. With an R2 value of 0.971, the model demonstrates a satisfying fit. Residual analysis of the regression equation confirms its high accuracy. Previous researchers typically measured the solar radiation in the upper and lower layers of fixed-size cultivation frames directly using instruments. Subsequently, they studied the impact of sunlight on crop growth based on the yield and quality metrics [23,41]. However, these studies failed to capture the impact patterns of CTUs and layer height on the solar radiation in the lower layer. In contrast, the regression model obtained in this study provides an intuitive representation of the impact of the number of CTUs and layer height on the lower layer’s solar radiation. Additionally, the model allows for the determination of the maximum number of CTUs in a single-layer cultivation frame. For instance, substituting RAD = 1.19 kWh·m−2 from Section 2.4 into Formula (2) yields the following results: when N = 2 and H = 295 mm, the total height of the cultivation frame is 1200 mm; when N = 3 and H = 621 mm, the total height of the cultivation frame is 1852 mm; and when N = 4 and H = 947 mm, the total of the cultivation frame is 2504 mm. If the cultivation frame is too high, it will lead to difficulty in the cultivation operation and higher input costs, which are not conducive to market promotion. In this study, the total height of the cultivation frame is not more than 2000 mm, and when the number of CTUs is two, the total height of the cultivation frame is the smallest and the solar radiation obtained is the best, so this study chooses the maximum number of CTUs of a single layer to be two groups.

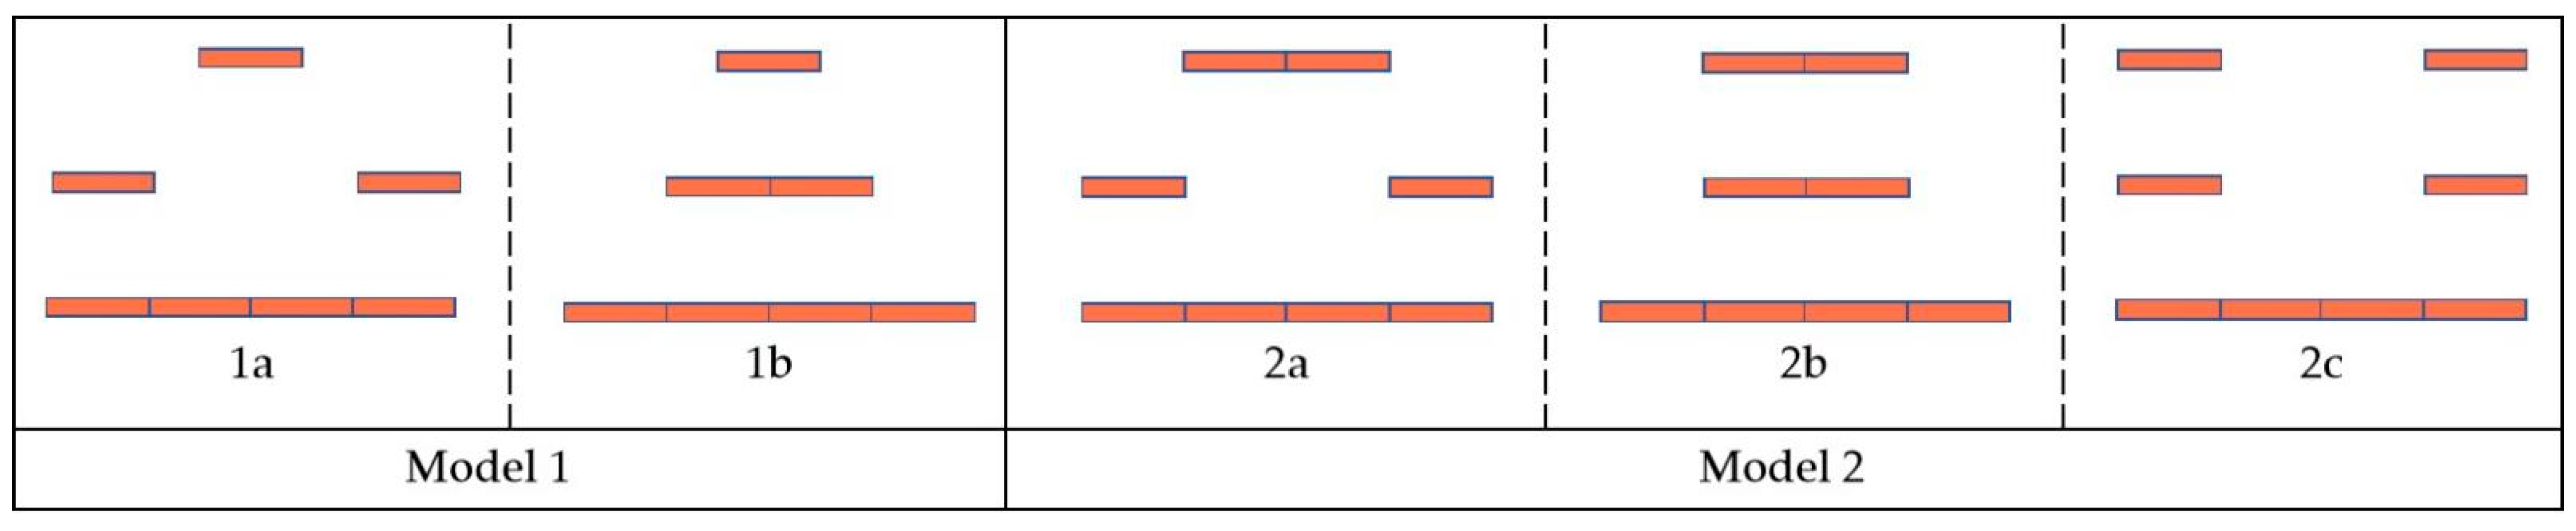
3.3. Simulation Solution for the Number of CTUs in the Upper Layer

Based on the findings from Section 3.1, the distribution of CTUs is as follows: four sets in the lower layer, two sets in the middle layer, and two or one sets in the upper layer. As shown in Figure 14, the configuration with one set in the upper layer is designated as Mode 1, while the configuration with two sets in the upper layer is designated as Mode 2. The layout structures of the cultivation frame under both Mode 1 and Mode 2 are denoted by a letter, with d = 0 mm in the middle layer as a, d = 700 mm as b, and d = 700 mm in the upper layer as c. This study employs the average solar radiation of 1.19 kWh·m−2 in the northern 1 m region of the lower layer of the cultivation frame as a constraint. Through simulation, the required layer height values for both modes are determined, thereby establishing the number of CTUs in the upper layer of the cultivation frame. The simulation results are presented in Figure 15 and Table 4.
Figure 15 illustrates that, when the solar radiation in the lower layer of the cultivation frame is set the same, Mode 1b outperforms the rest of the structures in uniformity of the solar radiation distribution. In regard to the solar radiation in the middle layer, Mode 1 (1a, 1b) shows higher solar radiation than that of Mode 2 (2a, 2b, 2c). The uniformity difference in the middle layer between Mode 1a and Mode 1b is not significant, while, in Mode 2, Mode 2a is significantly better than that of Modes 2b and 2c. According to Table 4, Mode 1b also shows the lowest minimum layer height (670 mm) and the lowest total height (1950 mm), showing the best convenience and efficiency for manual operation. Based on the above analysis, we followed the design of Mode 1b by setting one group of CTUs in the center position of the upper layer.

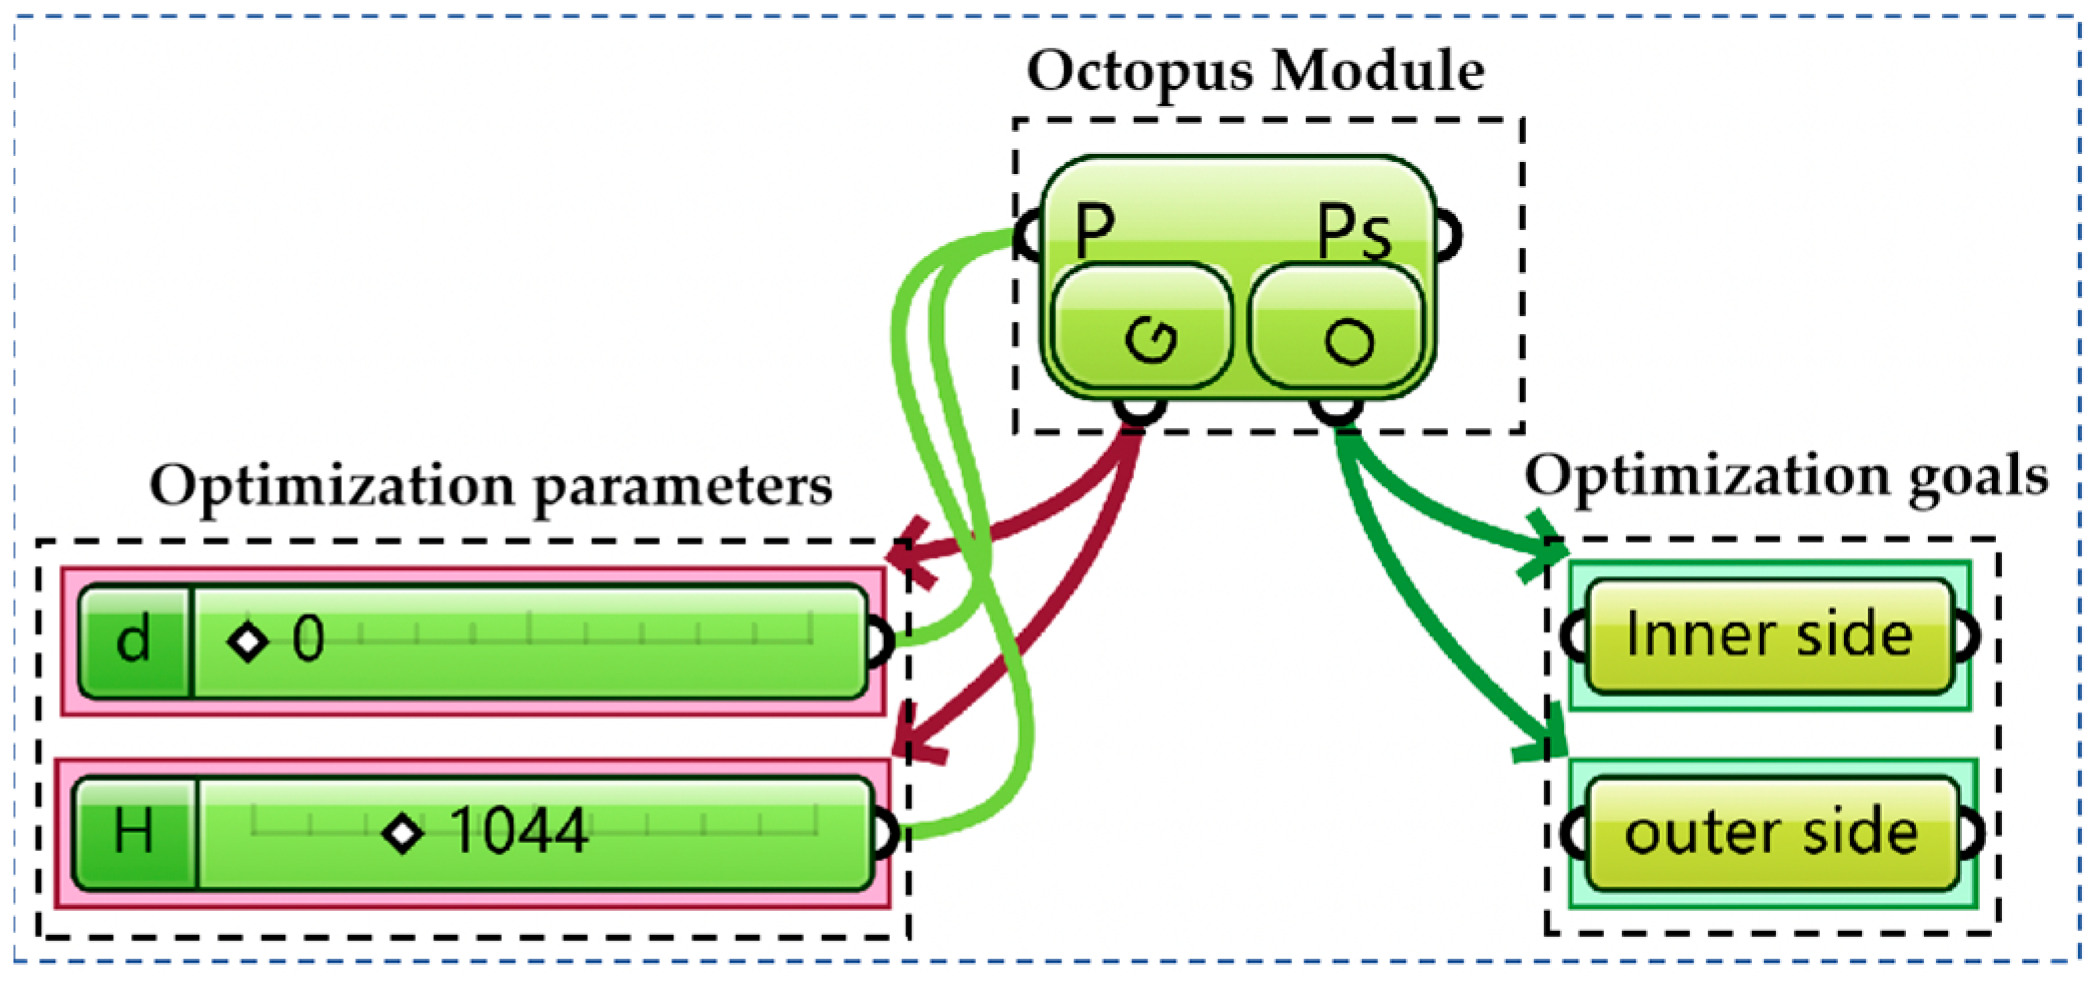
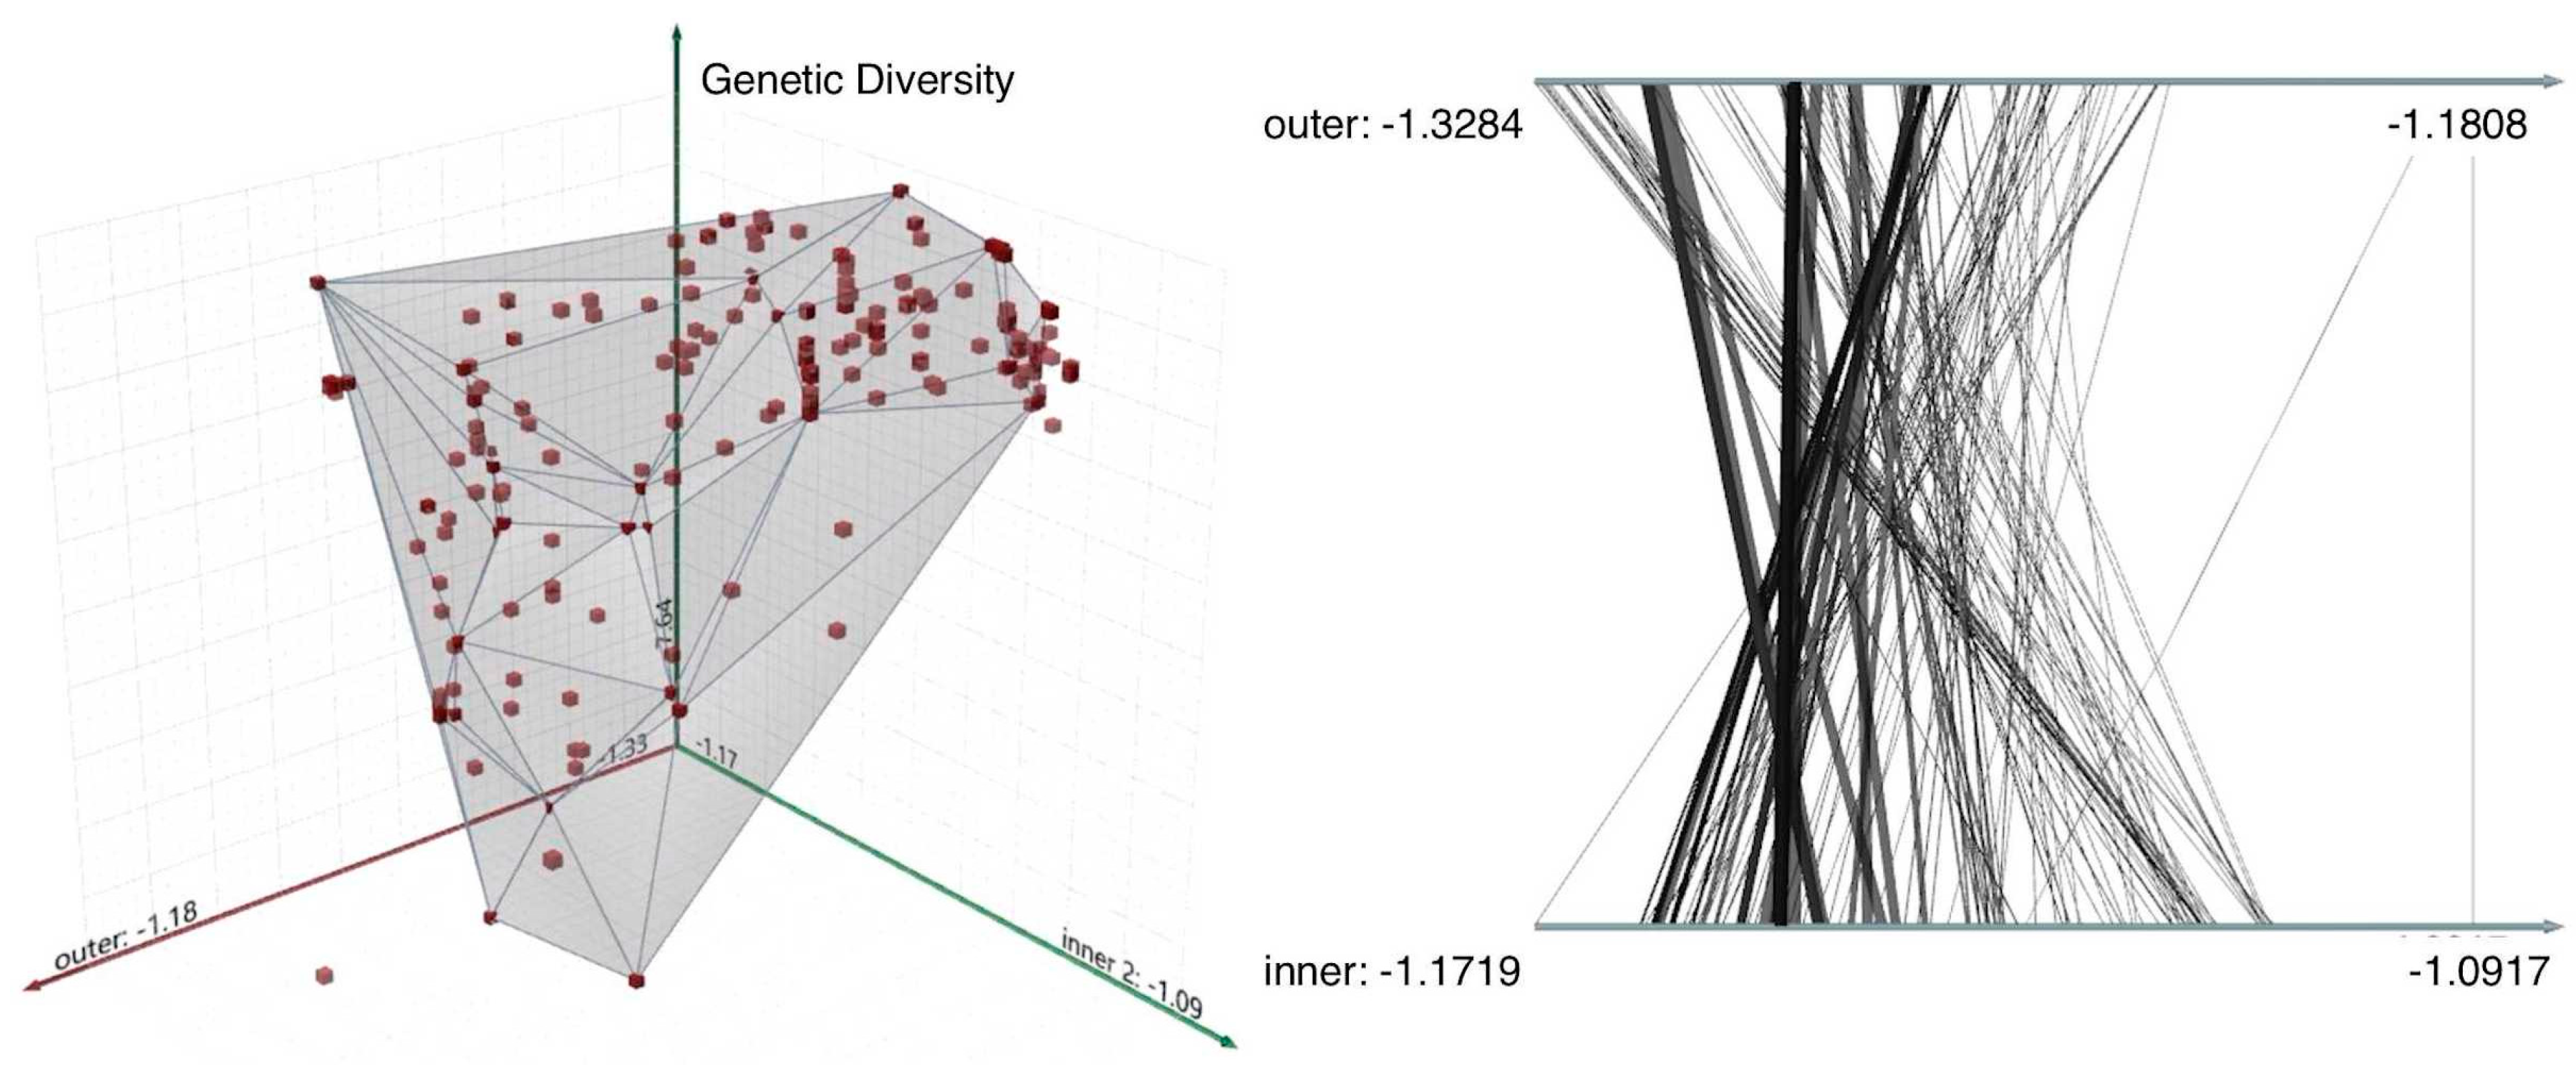
3.4. Optimization of the Cultivation Frame Structure Using Octopus

From the solar radiation distribution diagram of the lower layer for Mode 1 in Figure 15, it is evident that the CTUs on the inner side have lower solar radiation compared to those on the outer side. To achieve a more balanced and maximized solar radiation on the lower layer of the cultivation frame, this study optimized the layer height (H) and the spacing between CTUs (d) within the Octopus plugin, and the results are presented in Figure 16.
After 11 iterations, Octopus achieved convergence in optimizing the average solar radiation of the CTUs on the inner and outer sides of the lower layer. Combining the optimization parameter values and optimization target values corresponding to each solution on the Pareto frontier in Figure 16, we selected the conditions that meet the design requirements of the cultivation frame, and the optimal simulation results are as follows. The spacing between CTUs is 348 mm; the layer height is 685 mm; and the maximum average solar radiation on the outer side of the lower layer is 1.26 kWh·m−2 (i.e., DLI ≈ 9.07 mol·m−2·day−1), on the inner side is 1.13 kWh·m−2 (i.e., DLI ≈ 8.14 mol·m−2·day−1), and in the middle layer is 1.66 kWh·m−2 (i.e., DLI ≈ 11.95 mol·m−2·day−1). The solar radiation on the inner and outer sides of the lower layer and the middle layer are 60.6%, 54.3%, and 79.8% of those on the upper layer, respectively. For convenience in the subsequent design, d is set to 350 mm, and L is set to 685 mm. Therefore, the optimized design of the NLSCF is shown in Figure 17.
By contrast, the simulated light conditions of the NLSCF are superior to those used by previous researchers. For example, Fang et al. [42] found that the DLIs of the middle and lower layers in a stereoscopic cultivation frame were only 1.30 mol·m−2·day−1 and 1.26 mol·m−2·day−1, respectively, far lower than the results of this study: 11.95 and 8.61 mol·m−2·day−1. Chen et al. [24] studied the light–temperature effect of A-shape cultivation frames for strawberries, measuring that the photosynthetically active radiation in the middle and lower layers was only from 56.9% and from 39.3% of those in the upper layer on average, 22.9% and 18.2% lower than the present study. The NLSCF significantly increased the solar radiation of the lower and middle layers, making it possible to investigate the effects of natural lighting on lettuce yield and quality.

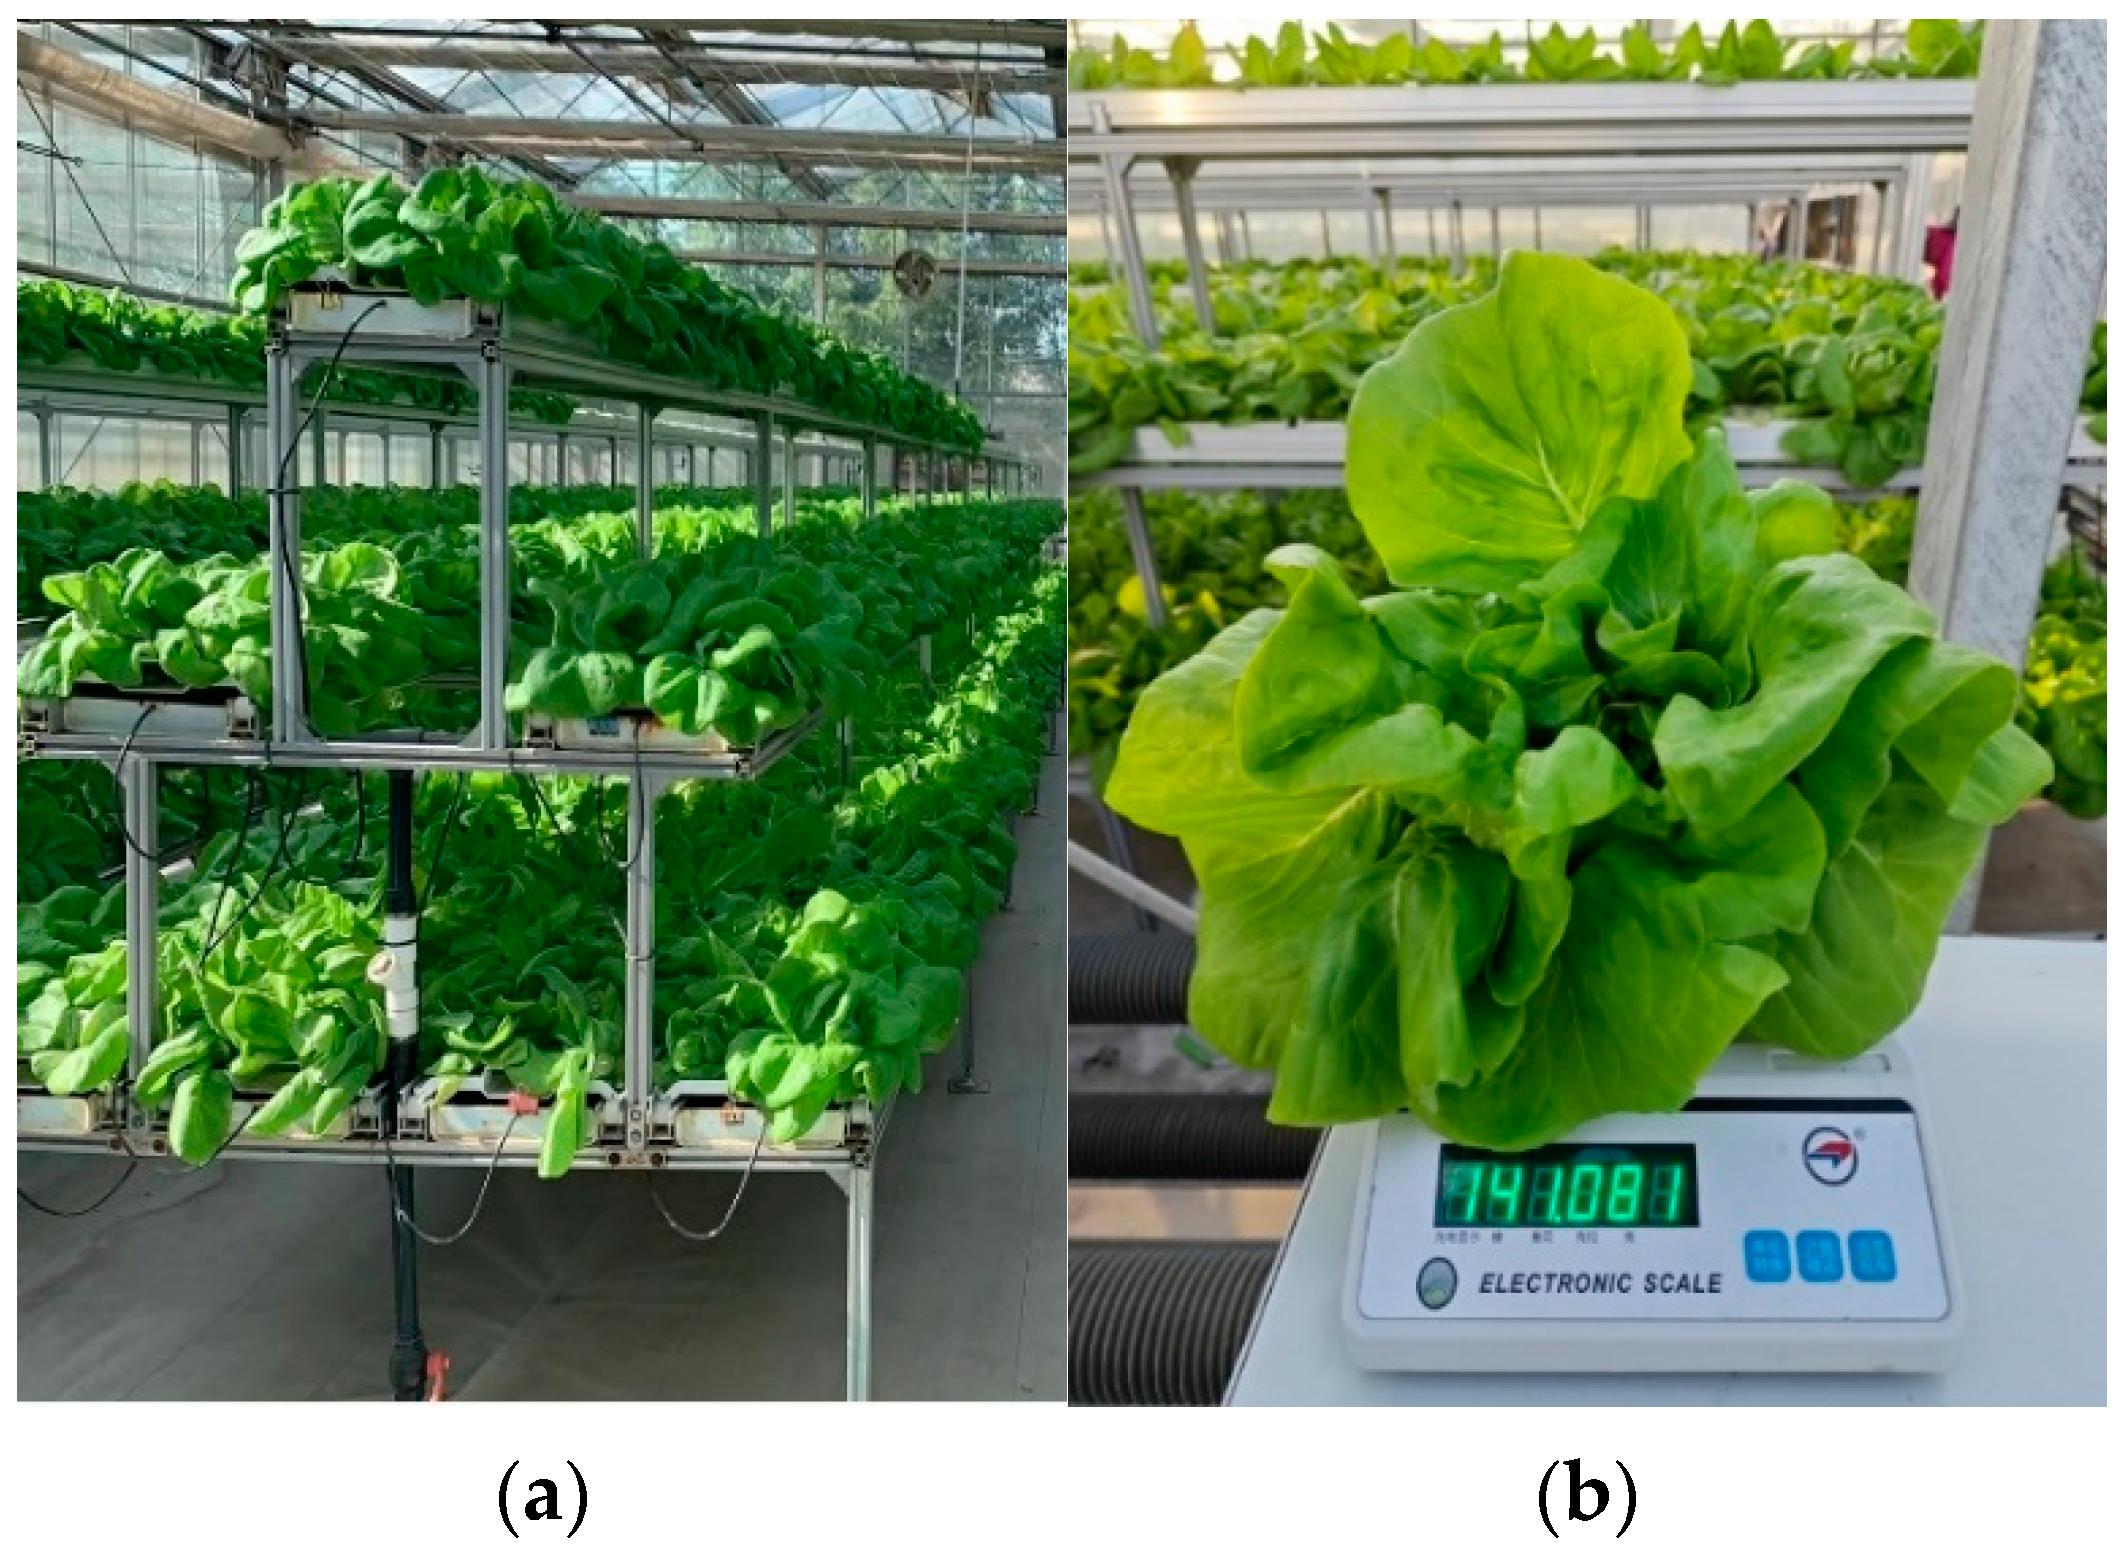
3.5. Lettuce Cultivation Experiment

In order to validate the feasibility of the designed NLSCF, we conducted an authentic cultivation experiment of lettuce without supplementary lighting. The average fresh weight, plant height, and plant width of lettuce in each layer are presented in Table 5.
In the pure sunlight greenhouse experiment, the three lettuce yield indicators for each layer of the cultivation frame exhibited relatively consistent outcomes (see Table 5). The fresh weight, plant width, and height of lettuce decreased in the following order: upper layer > middle layer > outer side of the lower layer > inner side of the lower layer. This order is in line with expectations, as it is consistent with previous solar radiation simulation results. The differences in yield indicators among the layers of the cultivation frame were not pronounced. For instance, compared with lettuce grown in the upper layer, the average fresh weight per plant in the inner side of the lower layer, the outer side of the lower layer, and middle layer were 82.9%, 89.0%, and 92.6% of the lettuces in the upper layer, respectively. The average plant heights in these layers were 80.4%, 84.0%, and 90.2% of the upper layer. It is noteworthy that our cultivation experiment relied solely on natural sunlight and ambient scattered light within the greenhouse, without the use of artificial supplementary lighting. Therefore, the remaining yield differences could be explained by the remaining differences in light intensity. The better the light conditions, the more photosynthetic products there were, and the greater the fresh weight and plant height of lettuce. The insignificant difference in the plant width of lettuce may be due to the improvement of the light uniformity. These results emphasize the NLSCF’s success in compensating for substantial differences in solar radiation among layers solely through harnessing natural light conditions. The results underscore the efficiency of the cultivation frame in creating a conducive environment for plant growth, effectively reducing the disparities in crop yields across different layers.
This experiment validates that the NLSCF improves interlayer light conditions, making the distribution of natural light more uniform, promoting biomass production, and consequently achieving yields in the middle and lower layers ranging from 82.9% to 92.6% of the upper layer. The optimized structure of the NLSCF could meet the normal growth requirements of lettuce. Compared with previous studies that optimized LED light recipes using the design of experiments (DoEs) methodology [43] and the Taguchi method [44], this study harnessed innovative computer simulation and modeling techniques, including parametric modeling, light simulation techniques, and the genetic algorithm method, to assess the impact of different design parameters on the lighting distribution and to utilize cost-efficient natural light in a better way.
Additionally, although the average simulated solar radiation (1.13 kWh·m−2) on the inner side of the lower layer did not reach the required 1.19 kWh·m−2 for lettuce growth, the experimental results still supported the significant and effective light optimization effect achieved in the inner side of the lower layer. This may be attributed to two reasons. Firstly, this study intentionally selected the winter solstice day with the least light as the simulation target, indicating relatively favorable natural light conditions during actual cultivation, making it somewhat easier to meet the growth requirements of these lettuces. Secondly, the average plant width on the inner side of the lower layer was relatively large. This phenomenon might be due to the phototropic growth of plants, causing lettuce leaves in the inner side of the lower layer cultivation trough to grow outward, resulting in an increased plant width and effectively addressing the shading issue on the inner side of the lower layer.
This study involves several potential limitations. Due to the research purpose of designing a natural light cultivation frame for VF, the variability in plant responses to various light qualities and spectrums was not fully considered. Moreover, while providing practical insights, the cultivation experiment may have inherent variability due to real-world conditions. Factors such as other crop types, temperature variations, nutrient distribution, and other environmental conditions in the glass greenhouse might introduce variations in lettuce growth. By acknowledging these limitations, the study ensures transparency regarding potential sources of error or bias, contributing to a more comprehensive interpretation of the results and recommendations. Future research could delve deeper into these limitations, refining the methodologies for more robust outcomes. Future research should delve deeper into these limitations, exploring the use of cutting-edge research methods, such as advanced lighting technology, the Internet of Things (IoT) and sensing technology, and artificial intelligence, for more robust and fully considered outcomes.

4. Conclusions

  • Novel optimization methods for the structure design of VF cultivation frames were explored. By harnessing parametric modeling and light simulation techniques, our research introduced innovative approaches to designing and optimizing VF frames. The pivotal findings underscore the remarkable capability of these methods to swiftly and precisely simulate light characteristics across diverse frame structures. Notably, parametric modeling emerges as a key facilitator, streamlining design modifications with unprecedented convenience. These innovative methods provide technical support for the construction of VF cultivation systems, effectively reducing the design costs and design cycle of VF. This paper’s primary contributions lie in expanding the technical toolkit for VF design and catalyzing practical advancements that propel the field toward enhanced sustainability and cost-effectiveness.
  • We designed a NLSCF to reduce supplementary lighting energy consumption in VF. This study fully considered the structural design requirements of the cultivation frame and the lighting needs of the lower layers. Through a combination of parametric modeling, light simulation, and genetic algorithm optimization, the structure of the cultivation frame was designed and optimized. Therefore, the NLSCF could meet the lighting design requirements for the middle and lower layers, even under no supplementary lighting conditions. The optimized structure consisted of four sets of CTUs for the lower layer, two sets for the middle layer, and one set for the upper layer, with a layer height of 685 mm and a spacing of 350 mm between CTUs.
  • We conducted cultivation experiments to validate the NLSCF. The results of lettuce cultivation under natural light verification experiments showed that the yields of the middle and lower layers could reach from 82.9% to 92.6% of the upper layer. Based on the simulated design, the practical effect of not requiring supplementary lighting was effectively verified.
  • Although the above research results provide a solution to reduce supplementary lighting energy consumption in VF, the planting density of the cultivation frame is lower than that of a plant factory. Further studies may apply the structural design methods and genetic algorithm to increase the height and number of layers of the cultivation frame and combine lifting and transporting equipment to achieve the goal of increasing planting density. The NLSCF system may also benefit from better light intensity range management, including avoiding photo saturation and photoinhibition and optimizing light distribution among layers.

Author Contributions

Conceptualization, D.J. and G.G.; methodology, D.J.; software, D.J.; validation, W.G. and Q.Z.; formal analysis, D.J.; investigation, D.J. and X.W.; resources, W.Z.; data curation, D.J.; writing—original draft preparation, D.J.; writing—review and editing, G.G.; visualization, X.W.; supervision, G.G.; project administration, W.Z.; funding acquisition, W.Z. All authors have read and agreed to the published version of the manuscript.

Funding

This research was funded by the Construction Project of Beijing Engineering Laboratory of Agricultural Internet of Things Technology (PT2023-29) and Beijing Innovation Team of the Modern Agricultural Research System (BAIC08-2023).

Institutional Review Board Statement

Not applicable.

Data Availability Statement

Data are contained within the article.

Conflicts of Interest

The authors declare no conflicts of interest.

References

  1. SharathKumar, M.; Heuvelink, E.; Marcelis, L.F.M. Vertical Farming: Moving from Genetic to Environmental Modification. Trends Plant Sci. 2020, 25, 724–727. [Google Scholar] [CrossRef] [PubMed]
  2. Van Gerrewey, T.; Boon, N.; Geelen, D. Vertical Farming: The Only Way Is Up? Agronomy 2021, 12, 2. [Google Scholar] [CrossRef]
  3. Sambo, P.; Nicoletto, C.; Giro, A.; Pii, Y.; Valentinuzzi, F.; Mimmo, T.; Lugli, P.; Orzes, G.; Mazzetto, F.; Astolfi, S.; et al. Hydroponic Solutions for Soilless Production Systems: Issues and Opportunities in a Smart Agriculture Perspective. Front. Plant Sci. 2019, 10, 923. [Google Scholar] [CrossRef] [PubMed]
  4. Benke, K.; Tomkins, B. Future Food-Production Systems: Vertical Farming and Controlled-Environment Agriculture. Sustain. Sci. Pract. Policy 2017, 13, 13–26. [Google Scholar] [CrossRef]
  5. Beacham, A.M.; Vickers, L.H.; Monaghan, J.M. Vertical Farming: A Summary of Approaches to Growing Skywards. J. Hortic. Sci. Biotechnol. 2019, 94, 277–283. [Google Scholar] [CrossRef]
  6. Montes Rivera, M.; Escalante-Garcia, N.; Dena-Aguilar, J.A.; Olvera-Gonzalez, E.; Vacas-Jacques, P. Feature Selection to Predict LED Light Energy Consumption with Specific Light Recipes in Closed Plant Production Systems. Appl. Sci. 2022, 12, 5901. [Google Scholar] [CrossRef]
  7. Pennisi, G.; Pistillo, A.; Orsini, F.; Cellini, A.; Spinelli, F.; Nicola, S.; Fernandez, J.A.; Crepaldi, A.; Gianquinto, G.; Marcelis, L.F.M. Optimal Light Intensity for Sustainable Water and Energy Use in Indoor Cultivation of Lettuce and Basil under Red and Blue LEDs. Sci. Hortic. 2020, 272, 109508. [Google Scholar] [CrossRef]
  8. Smirnov, A.A.; Semenova, N.A.; Dorokhov, A.S.; Proshkin, Y.A.; Godyaeva, M.M.; Vodeneev, V.; Sukhov, V.; Panchenko, V.; Chilingaryan, N.O. Influence of Pulsed, Scanning and Constant (16- and 24-h) Modes of LED Irradiation on the Physiological, Biochemical and Morphometric Parameters of Lettuce Plants (Lactuca sativa L.) While Cultivated in Vertical Farms. Agriculture 2022, 12, 1988. [Google Scholar] [CrossRef]
  9. Zhang, Y.; Kacira, M. Analysis of Climate Uniformity in Indoor Plant Factory System with Computational Fluid Dynamics (CFD). Biosyst. Eng. 2022, 220, 73–86. [Google Scholar] [CrossRef]
  10. Yeo, U.-H.; Lee, S.-Y.; Park, S.-J.; Kim, J.-G.; Cho, J.-H.; Decano-Valentin, C.; Kim, R.-W.; Lee, I.-B. Rooftop Greenhouse: (2) Analysis of Thermal Energy Loads of a Building-Integrated Rooftop Greenhouse (BiRTG) for Urban Agriculture. Agriculture 2022, 12, 787. [Google Scholar] [CrossRef]
  11. Graamans, L.; Baeza, E.; van den Dobbelsteen, A.; Tsafaras, I.; Stanghellini, C. Plant Factories versus Greenhouses: Comparison of Resource Use Efficiency. Agric. Syst. 2018, 160, 31–43. [Google Scholar] [CrossRef]
  12. Avgoustaki, D.D.; Xydis, G. Energy Cost Reduction by Shifting Electricity Demand in Indoor Vertical Farms with Artificial Lighting. Biosyst. Eng. 2021, 211, 219–229. [Google Scholar] [CrossRef]
  13. Hosseini, H.; Mozafari, V.; Roosta, H.R.; Shirani, H.; van de Vlasakker, P.C.H.; Farhangi, M. Nutrient Use in Vertical Farming: Optimal Electrical Conductivity of Nutrient Solution for Growth of Lettuce and Basil in Hydroponic Cultivation. Horticulturae 2021, 7, 283. [Google Scholar] [CrossRef]
  14. Büyüközkan, G.; Göçer, F.; Uztürk, D. A Novel Pythagorean Fuzzy Set Integrated Choquet Integral Approach for Vertical Farming Technology Assessment. Comput. Ind. Eng. 2021, 158, 107384. [Google Scholar] [CrossRef]
  15. Rengasamy, N.; Othman, R.Y.; Che, H.S.; Harikrishna, J.A. Artificial Lighting Photoperiod Manipulation Approach to Improve Productivity and Energy Use Efficacies of Plant Factory Cultivated Stevia Rebaudiana. Agronomy 2022, 12, 1787. [Google Scholar] [CrossRef]
  16. Watawana, B.; Isaksson, M. Design and Simulations of a Self-Assembling Autonomous Vertical Farm for Urban Farming. Agriculture 2023, 13, 112. [Google Scholar] [CrossRef]
  17. Zhang, Y.; Kacira, M. Comparison of Energy Use Efficiency of Greenhouse and Indoor Plant Factory System. Eur. J. Hortic. Sci. 2020, 85, 310–320. [Google Scholar] [CrossRef]
  18. Weidner, T.; Yang, A.; Hamm, M.W. Energy Optimisation of Plant Factories and Greenhouses for Different Climatic Conditions. Energy Convers. Manag. 2021, 243, 114336. [Google Scholar] [CrossRef]
  19. Jürkenbeck, K.; Heumann, A.; Spiller, A. Sustainability Matters: Consumer Acceptance of Different Vertical Farming Systems. Sustainability 2019, 11, 4052. [Google Scholar] [CrossRef]
  20. Wang, C.; Song, W.; Zhao, S.; Qu, S. Effect of different combinations of H-type cultivation frame on light and strawberry growth and yield. Trans. Chin. Soc. Agric. Eng. 2017, 33, 234–239. [Google Scholar] [CrossRef]
  21. Liao, P.; Liu, P.; Wang, Y.; Huang, C.; Lan, L.; Yang, Y.; Cui, X. Stereoscopic Cultivation of Panax Notoginseng: A New Approach to Overcome the Continuous Cropping Obstacle. Ind. Crops Prod. 2018, 126, 38–47. [Google Scholar] [CrossRef]
  22. Kempler, C. ’Out-of-season’ greenhouse production of raspberry and strawberry. Acta Hortic. 2004, 633, 459–465. [Google Scholar] [CrossRef]
  23. Lin, X.; Luo, Y.; Wang, H. Effect of light and temperature on strawberry in stereoscopic culture system. J. China Agric. Univ. 2014, 19, 67–73. [Google Scholar] [CrossRef]
  24. Chen, Z.; Liu, P.; Zhang, B.; Wang, J.; Song, S.; Wang, H. Light and temperature and their effects on photosynthesis characteristics of stereoscopic cultivation in strawberry. J. China Agric. Univ. 2011, 16, 42–48. [Google Scholar]
  25. Wang, C.; Sun, W.; Zhao, S.; Qu, M. Sun-tracking multi-layer stereo-cultivation system improving light and temperature environment and increasing yield for strawberry. Trans. Chin. Soc. Agric. Eng. 2017, 33, 187–194. [Google Scholar] [CrossRef]
  26. Goharian, A.; Daneshjoo, K.; Yeganeh, M. Standardization of Methodology for Optimizing the Well Aperture as Device (Reflector) for Light-Wells; A Novel Approach Using Honeybee & Ladybug Plugins. Energy Rep. 2022, 8, 3096–3114. [Google Scholar] [CrossRef]
  27. Eltaweel, A.; Su, Y. Controlling Venetian Blinds Based on Parametric Design; via Implementing Grasshopper’s Plugins: A Case Study of an Office Building in Cairo. Energy Build. 2017, 139, 31–43. [Google Scholar] [CrossRef]
  28. Saito, K.; Ishigami, Y.; Goto, E. Evaluation of the Light Environment of a Plant Factory with Artificial Light by Using an Optical Simulation. Agronomy 2020, 10, 1663. [Google Scholar] [CrossRef]
  29. Jung, D.H.; Lee, J.W.; Kang, W.H.; Hwang, I.H.; Son, J.E. Estimation of Whole Plant Photosynthetic Rate of Irwin Mango under Artificial and Natural Lights Using a Three-Dimensional Plant Model and Ray-Tracing. Int. J. Mol. Sci. 2018, 19, 152. [Google Scholar] [CrossRef]
  30. Badji, A.; Benseddik, A.; Bensaha, H.; Boukhelifa, A.; Hasrane, I. Design, Technology, and Management of Greenhouse: A Review. J. Clean. Prod. 2022, 373, 133753. [Google Scholar] [CrossRef]
  31. Wang, S.; Zhang, Q.; Liu, P.; Liang, R.; Fu, Z. A Parameterized Design Method for Building a Shading System Based on Climate Adaptability. Atmosphere 2022, 13, 1244. [Google Scholar] [CrossRef]
  32. Viršilė, A.; Brazaitytė, A.; Vaštakaitė-Kairienė, V.; Miliauskienė, J.; Jankauskienė, J.; Novičkovas, A.; Samuolienė, G. Lighting Intensity and Photoperiod Serves Tailoring Nitrate Assimilation Indices in Red and Green Baby Leaf Lettuce. J. Sci. Food Agric. 2019, 99, 6608–6619. [Google Scholar] [CrossRef] [PubMed]
  33. Yan, Z.; He, D.; Niu, G.; Zhai, H. Evaluation of Growth and Quality of Hydroponic Lettuce at Harvest as Affected by the Light Intensity, Photoperiod and Light Quality at Seedling Stage. Sci. Hortic. 2019, 248, 138–144. [Google Scholar] [CrossRef]
  34. Eaton, M.; Harbick, K.; Shelford, T.; Mattson, N. Modeling Natural Light Availability in Skyscraper Farms. Agronomy 2021, 11, 1684. [Google Scholar] [CrossRef]
  35. Torres, A.P.; Lopez, R. Measuring Daily Light Integral in a Greenhouse. Purdue Extension. Ho-238-W. 2012. 1–10. Available online: https://mdc.itap.purdue.edu/item.asp?itemID=19338 (accessed on 29 July 2023).
  36. Maraveas, C. Environmental Sustainability of Greenhouse Covering Materials. Sustainability 2019, 11, 6129. [Google Scholar] [CrossRef]
  37. Xue, Y.; Liu, W. A Study on Parametric Design Method for Optimization of Daylight in Commercial Building’s Atrium in Cold Regions. Sustainability 2022, 14, 7667. [Google Scholar] [CrossRef]
  38. Lei, C.; Engeseth, N.J. Comparison of Growth Characteristics, Functional Qualities, and Texture of Hydroponically Grown and Soil-Grown Lettuce. LWT 2021, 150, 111931. [Google Scholar] [CrossRef]
  39. Kwack, Y.; Kim, K.K.; Hwang, H.; Chun, C. Growth and Quality of Sprouts of Six Vegetables Cultivated under Different Light Intensity and Quality. Hortic. Environ. Biotechnol. 2015, 56, 437–443. [Google Scholar] [CrossRef]
  40. Chaichana, C.; Man, A.; Wicharuck, S.; Mona, Y.; Rinchumphu, D. Modelling of Annual Sunlight Availability on Vertical Shelves: A Case Study in Thailand. Energy Rep. 2022, 8, 1136–1143. [Google Scholar] [CrossRef]
  41. Lee, Y.Y.; Yik, J.; Koay, E.H.H.; Lau, H.H. Application of Light Redirecting Panels to Improve Sunlight Utilization in Multi-Tiered Vertical Farming Systems. Clean Technol. Environ. Policy 2023. [Google Scholar] [CrossRef]
  42. Fang, H.; Cheng, R.; Wu, G.; Tong, Y.; Liu, Q. Effects of multi-layer three-dimensional cultivation combined with artificial lighting on lettuce yield and quality in Greenhouse. J. China Agric. Univ. 2021, 26, 147–154. [Google Scholar] [CrossRef]
  43. Barbieri, F.; Barbi, S.; Bertacchini, A.; Montorsi, M. Combined Effects of Different LED Light Recipes and Slow-Release Fertilizers on Baby Leaf Lettuce Growth for Vertical Farming: Modeling through DoE. Appl. Sci. 2023, 13, 8687. [Google Scholar] [CrossRef]
  44. Farhangi, H.; Mozafari, V.; Roosta, H.R.; Shirani, H.; Farhangi, M. Optimizing Growth Conditions in Vertical Farming: Enhancing Lettuce and Basil Cultivation through the Application of the Taguchi Method. Sci. Rep. 2023, 13, 6717. [Google Scholar] [CrossRef] [PubMed]
Figure 1. Design optimization flow chart.
Agriculture 14 00084 g001
Figure 2. Structure diagram of the cultivation trough unit.
Agriculture 14 00084 g002
Figure 3. The schematic diagram of the parametric modeling section of the cultivation frame.
Agriculture 14 00084 g003
Figure 4. The battery connection diagram of the model in Grasshopper.
Agriculture 14 00084 g004
Figure 5. The description of the solar radiation analysis and sunshine duration analysis in Ladybug.
Agriculture 14 00084 g005
Figure 6. Sun path and parameterized model of the cultivation frame. The blue ball represents the sun, the green line represents the sun path, and the light pink rectangles represent the parametric model of the cultivation frame. The abbreviations at the bottom represent directions, such as NW representing northwest.
Agriculture 14 00084 g006
Figure 7. Multi-objective optimization components connection diagram in Grasshopper.
Agriculture 14 00084 g007
Figure 8. Cultivation experiment. (a) Planting effect of NLSCF. (b) Lettuce fresh weight measurement. The total length of the cultivation frame was 20 m. The spacing between the middle CTUs was 350 mm, the height of all layers was 685 mm, and the height of the lower layer from the ground was 400 mm. The ground of the greenhouse installation site was hardened and leveled to ensure the stability of the cultivation frame installation and the stability of drainage from cultivation troughs. Pipeline installation was arranged at both ends of the cultivation frame and buried underground to prevent the pipes from interfering with the movement of the cultivation boards. The operational aisle width was set to 500 mm to ensure sufficient operational space while minimizing the use of aisle space resources.
Agriculture 14 00084 g008
Figure 9. Sunshine duration analysis chart. (a) The cultivation frame is placed in a north–south direction. (b) The cultivation frame is placed in the east–west direction. Blue circles represent the sun path, outer circles indicate direction, and inner rectangles represent two shading cultivation frames and one observation cultivation frame. The abbreviations for the periphery represent directions, such as NW representing northwest.
Agriculture 14 00084 g009
Figure 10. The north–south direction of the cultivation frame sunshine schematic diagram. Note: The yellow blocks represent unshaded areas of the cultivation troughs during the day, the orange-red blocks represent periodic shading areas, and the gray blocks represent fully shaded areas.
Agriculture 14 00084 g010
Figure 11. The east–west direction of the cultivation frame sunshine schematic diagram. Note: The yellow blocks represent unshaded areas of the cultivation troughs during the day, the orange-red blocks represent periodic shading areas, and the gray blocks represent fully shaded areas.
Agriculture 14 00084 g011
Figure 12. Simulation results of solar radiation.
Agriculture 14 00084 g012
Figure 13. The solar radiation histogram of the model’s residual distribution, and the P–P diagram of the model’s normalized residuals.
Agriculture 14 00084 g013
Figure 14. Cross-sectional view of the cultivation frame structures in two modes. Each orange rectangle represents a CTU.
Agriculture 14 00084 g014
Figure 15. Solar radiation simulation results of Mode 1 and Mode 2.
Agriculture 14 00084 g015
Figure 16. Pareto frontier images. Notes: The left image represents a spatial schematic of the optimal solution set obtained through the optimization processes, where the deep red cubes represent the Pareto frontier solution set. The right image illustrates the parameter distance diagram from the optimization processes, with each line representing an optimized solution. The intersection of the line with the axis indicates the value of that parameter. The smaller and more concentrated slopes of the line indicate a higher degree of optimization. Densely populated areas of lines represent the region of the optimal solution set, while dispersed areas signify eliminated solutions during the iteration processes.
Agriculture 14 00084 g016
Figure 17. Structure diagram of the NLSCF.
Agriculture 14 00084 g017
Table 1. Optimization variable and constraint condition-setting table.
Optimization VariableConstraint Condition
d[0 mm, 700 mm]
H[300 mm, 700 mm]
Table 2. The operational parameter settings of Octopus.
Optimization ParametersValue
Elitism0.5
Mutation Probability0.1
Mutation Rate0.9
Crossover Rate0.8
Population Size100
Max Generation0
Record interval1
Save interval0
Note: Elitism refers to the percentage of new solutions selected from the elite solutions of the previous generation. Mutation Probability represents the probability of mutation for each gene, affecting the convergence speed. Mutation Rate indicates the degree of gene mutation, where a higher value corresponds to more drastic mutations. Crossover Rate represents the probability of exchanging parameters between two generations. Population Size indicates the size of the population, influencing the computation time. Max Generation specifies the termination generation of genetic operation; 0 indicates an infinite process until convergence. Record Interval and Save Interval denote the production interval for storing historical records and the time interval for saving file data, respectively.
Table 3. Linear regression analysis results of solar radiation.
ModelBtpCollinearity Statistics
ToleranceVIF
(Constant)1.54723.597<0.001
N−0.326−23.880<0.00111
H0.0018.419<0.00111
Dependent variable: RAD; notation: R2 = 0.971, p < 0.001.
Table 4. The results of the minimum layer height simulation calculations.
ModelThe Average Solar Radiation of the Lower Layer
(kWh·m−2)
The Average Solar Radiation of the Middle Layer
(kWh·m−2)
Minimum Layer Height
(mm)
The Total Height of the Cultivation Frame
(mm)
1a1.191.6910202650
1b1.191.646701950
2a1.191.4911302870
2b1.191.2110802770
2c1.191.2411102830
Table 5. Effects of different cultivation layers on the fresh weight, plant height, and plant width of lettuce.
VariableFresh Weight
(g)
Plant Width
(cm)
Plant Height
(cm)
The upper layer140.68 ± 6.84 a29.33 ± 2.38 a20.47 ± 1.95 a
The middle layer130.33 ± 11.63 ab28.97 ± 1.95 a18.46 ± 1.22 ab
The inner side of the lower layer116.56 ± 9.40 b29.27 ± 2.08 a16.46 ± 1.94 b
The outer side of the lower layer125.27 ± 7.51 ab25.66 ± 2.37 a17.20 ± 1.40 b
Values are given as the means ± standard error (n = 3). Different letter superscripts after the standard error indicate significant differences between treatments (Duncan’s test, p < 0.05).
Disclaimer/Publisher’s Note: The statements, opinions and data contained in all publications are solely those of the individual author(s) and contributor(s) and not of MDPI and/or the editor(s). MDPI and/or the editor(s) disclaim responsibility for any injury to people or property resulting from any ideas, methods, instructions or products referred to in the content.

