
Cold Climate Factors in Nitrogen Management for Maize

School of Integrative Plant Science, Cornell University, Ithaca, NY 14850, USA
Agriculture 2024, 14(1), 85; https://doi.org/10.3390/agriculture14010085
Submission received: 29 October 2023
/
Revised: 19 December 2023
/
Accepted: 21 December 2023
/
Published: 31 December 2023
(This article belongs to the Special Issue Optimizing Nutrient Management in Cold Climate Agroecosystems)
Abstract
:Among essential crop nutrients, nitrogen is the greatest management challenge in maize (Zea mays L.) production due to high requisite rates as well as dynamic transformations and losses. Climate plays a role in N management through changes in crop calendars, soil properties, agronomic practices, and yield effects. This study focuses on climate influences on maize N management and the objectives are to (i) review cold climate factors impacting economic optimum N rates (EONR), (ii) discuss approaches and climate considerations in estimating optimum N rates, and (iii) illustrate unexplored climate aspects related to optimum N rate assessment. Cold climate effects are expressed through inherent soil properties, agronomic management, and N fertilizer management. Most current N rate calculators do not explicitly account for climate factors, but implicitly integrate them through regional calibrations. Yield and EONR data from the US Corn Belt region indicate a positive correlation where lower means are associated with colder climates. High variability within climate regions is explained by differences in annual production environments, notably seasonal weather. Soil health models show that colder climates in the US are associated with higher stocks of soil organic matter, especially labile fractions. Adapt-N model simulations of a colder (North Central Wisconsin; 45.50, −89.70) and warmer (South Central Illinois; 38.50, −89.70) Corn Belt location show that higher soil organic N stocks do not increase crop N availability, presumably due to temperature-constrained N mineralization rates. The EONR for the colder site is 58 kg N ha−1 lower than the warmer site, which is well explained by differences in yield potential. Overall, abductive inferences suggest that colder climates are generally associated with higher levels of organic N stocks, but lower yields and crop N demands lessen EONRs. Seasonal weather and interactions with soil and agronomic factors also critically impact EONR, which can be assessed with model-based decision tools.
1. Introduction
Improved N use efficiency from cropping systems has become a compelling issue due to increasing N fertilizer prices and concerns about energy and environmental impacts. Anthropogenic N pollution has large social costs where agricultural N use causes major water quality concerns, including contamination of groundwater in rural areas and hypoxia in estuaries [1]. Also, gaseous forms of N are the largest contributor to agricultural greenhouse gas emissions in the US [2], and are also a source of fine particulate air pollution [3].
Maize is the most widely grown commodity crop that requires high N fertilization levels and is the main focus of this study. It is physiologically efficient at utilizing N (more yield per unit N accumulation), but paradoxically maize production systems as a whole have low fertilizer N use recovery efficiencies [4]. Studies have reported rapid increases in nitrate leaching and nitrous oxide gaseous losses when N rates for maize production exceed the “optimum”, which generally implies sufficient but not excess N for optimum yields [5,6]. However, farmers are managing an asymmetric risk as they consider applying uncertain N rates above or below the optimum (risk is higher below the optimum), which incentivizes excessive N applications [7]. Minimizing excessive N application thus requires correct estimation of crop fertilizer N needs, which is challenged by strong influences of climate, seasonal weather, soil, and agronomic management factors that interact in dynamic and complex ways [8]. The optimum N rate recommendation therefore has remained elusive as these N dynamics vary by location and time. The objectives of this study are to (i) review cold climate factors impacting optimum N fertilizer rates, (ii) discuss approaches and climate considerations in estimating optimum N rates, and (iii) use databases and model simulations to evaluate unexplored climate aspects related to optimum N rate assessment.
1.1. Cold Climate Considerations with N Management Factors
Complex interconnections between inherent and management factors that in turn interact with unpredictable weather factors complicate the management of a soil–crop nitrogen system in different climates. In order to adequately incorporate N dynamics into an N decision system, Sela et al. [8] suggested data inputs from five different factor groupings: (i) inherent resource elements (soil texture, organic matter, climate, etc.), (ii) agronomic management (rotation, cultivar, cover crop, tillage, irrigation/drainage, etc.), (iii) the source, placement, and timing of previous N applications, (iv) weather and climate (precipitation, temperature, and solar radiation), and (v) price and risk information.
1.1.1. Climate and Soil Factors
Mineralization of soil organic matter (SOM) can potentially supply a significant proportion of the required crop nitrogen, with typical values ranging from 60 to 130 kg N ha−1 [4,9], depending on region, soil type, and N stocks. The difference between the crop requirement and the soil N supply is ideally provided by supplemental N applications [10] and therefore impacts the economic optimum N rate (EONR; the rate that offers the highest net return to N application). In general, the soil N supply is a function of mineralizable organic matter which in turn is commonly estimated using information on the organic matter content and texture [6,11,12]. Soil chemistry additionally affects N gains and losses, notably with pH impacting the nitrification process [13].
Soil texture is an inherent and mostly unchangeable soil factor, but all classes are present across climate zones. However, soil N availability may be more prominently impacted by climate effects in that colder regions are generally associated with higher SOM levels [14], because soil biological activity and mineralization are reduced during extended periods of cold temperatures and possibly also wetter soil conditions. These protect the labile organic matter pool from mineralization, which is generally reversed when the soil warms or drains. This mineralization activity is believed to be enhanced by freeze–thaw cycles when substrate availability increases due to soil aggregate breakdown, the release of C and N from plant residues, death and lysing of microbial biomass, and the release of accumulated osmolytes from surviving microbes [15]. Conversely, warmer regions experience more continuous mineralization of organic N with longer periods for potential losses.
Despite higher total and labile SOM contents, uncertainty exists about whether net N mineralization is impacted by inherent soil factors due to lower rates of aerobic decomposition and higher potential for denitrification losses from longer wet periods. Also, freezing-induced water lift [16] during cold winters increases extended soil supersaturation in the surface layer during spring melts which is associated with high denitrification losses [17,18]. In all, it may be hypothesized that N mineralization in cold climates is favored by higher contents of total and labile organic matter pools, but crop N availability may not be greater due to lower soil temperatures and more persistent soil wetness from reduced evapotranspiration.
1.1.2. Climate and Agronomic Management Factors
Cropping system: The labile organic matter pool can be enhanced through cropping and agronomic management practices that generally also improve soil health. The soil N supply may be greatly enhanced when the crop is preceded by one that contributes residual biomass [19]. This N credit is especially significant when it involves a perennial legume (e.g., alfalfa, Medicago sativa) or a cropping system that involves the application of significant amounts of manure. N availability is also strongly impacted by management practices like timing of application and soil incorporation, especially involving manure, affecting ammonia losses [20]. Climate effects on cropping systems exist in that certain rotations are more associated with cooler climates, but a detailed review is beyond the scope of this paper.
Cover crops: Cover crops may contribute significant amounts of N to the following cash crop depending on cover crop type, biomass amount, and C:N ratio, as well as timing and method of termination [21]. However, cover cropping is challenged in colder climates due to the limited available heat units outside the main cropping period with certain crops like maize for grain. This often prevents the effective use of legumes as an N supplier to the following crop. Cereal rye (Secale cereale) generally provides the best cover crop option in colder regions as it is the most winter-hardy of cereals and can effectively function as an N-preserving catch crop. But not being a legume, it does not offer much additional N to a subsequent cash crop [21], although it can reduce N leaching losses and help increase the overall soil C and N pools on the long term [22]. Future improved cover crop varieties and seeding technologies/timing may improve organic N benefits, but cold climates will remain inherently disadvantaged for cover cropping when shorter growing seasons limit growth potential outside the main cropping period. Similarly, cold climates may prevent double cropping that may add more both revenue and biomass (and therefore N to feed soil organic matter). E.g., wheat (Triticum aestivum) can often be double cash-cropped with soybean (Glicene max) in temperate climates, but not colder climates.
Yield potential: Yield potential is generally regarded as an important determinant of the EONR [10], although not understood as such by some scientists [23]. Yield potential may be limited in colder climates and therefore less N may be required to achieve optimum yields. Improvements in crop genetics adapted to colder climate conditions (shorter-season maturity classes) may allow for more successful grain production and N use efficiencies [24], but current yield data support the notion that colder regions have lower yield potential (https://www.cornnratecalc.org, accessed on 1 October 2023).
1.1.3. Fertility Management
The 4R concept is widely promoted for increasing nutrient use efficiency [25,26]. It promotes the field application of nutrients from the right source, at the right time, right place, and right rate. The 4R approach is a straightforward concept but under the complexity of real production environments in farmer fields, including the effect of climate, effective implementation of the 4R concept is challenging for nitrogen. The “right” answer to each factor, especially for the N rate, remains difficult to define as it varies spatially among or within fields, as well as temporally for the same field location.
N source: Application of N sources like fertilizer, manure, and compost directly impacts soil N availability. Synthetic N sources like urea, anhydrous ammonia, and ammonium and nitrate salts are generally available for crop uptake within a few days under warm conditions. Organic sources like manure also have rapidly available N as ammonium and nitrate, but the organic N pool releases at a slow rate through biologically mediated mineralization. This in turn is impacted by weather conditions and fertilizer placement. Colder climates generally experience delayed availability of N from sources that rely on biological transformation processes (decomposition, nitrification, etc. [12]).
Timing of nitrogen application: The scheduling of N application affects the ability to synchronize crop N availability with crop N needs, which is known to impact environmental losses. In the US, only about a third of US maize growers apply supplemental synthetic fertilizer N within the active growing season, and in the Corn Belt region fall application of anhydrous ammonia is common [27]. Livestock-based farm operations also routinely apply organic N sources out of synchronization with crop uptake, typically for logistical reasons. In a simulation study, Sela et al. [28] determined that colder and drier climates are more adapted to fall anhydrous ammonia applications than warmer and wetter climates, mainly due to less occurrence of conditions that favor N losses. Enhanced efficiency compounds (EECs) such as nitrification or urease inhibitors can delay N transformations and reduce the loss potential of soil N [29,30]. Cold climate regions may have a lesser need for such additives as N transformations are more constrained by lower early season temperatures.
Nitrogen placement: The location of fertilizer N application can affect N losses and thereby crop availability. Incorporated applications, for example, are expected to increase crop N availability compared to surface broadcasting (see [31] for a recent review), especially when the formulation is susceptible to losses through volatilization like with urea or high-ammonium organic sources [32]. There is uncertainty regarding the quantitative gains of such practices in colder vs. warmer climates.
N rate: Weather elements are significant sources of variability for EONR, and they interact with soil and management factors [33]. From extensive analyses of maize N response curves over a range of climate conditions in North America, fields that received greater amounts of precipitation in the time period around sidedressing were found to have higher EONRs [34]. In-season weather parameters are by far the most relevant (72% to 81% of variability) to predict the uncertainty of N response [35], which likely represents much of the unexplained variability in yield and EONR [23]. Weather factors pose a unique challenge in that they are not predictable at the seasonal time scale, and that they interact strongly with the site-specific soil and agronomic management factors (crop rotation, tillage, fertilizer application, etc. [36]. Cold climate effects on weather variability are presumably relevant in as far as they impact potential N gains and losses.
1.1.4. N Rate Calculators
Generalized calculators: Estimating optimum N rates is complicated by the above-mentioned factors impacting field N dynamics, and most recommendation systems only account for a few of them. Institutions and companies have historically provided guidance to farmers on N rate applications [37]. The mass balance approach has been the most widely used method for making N fertilizer recommendations, which is generally based on a simple equation involving crop N demand (from yield goals) and N credits based on soil and crop management information [10]. As such, N calculators are generally calibrated based on regional conditions (states, provinces, or regions within), and therefore empirically account for soil and climate variation. Calculators for cold climate regions generally recommend lower N rates than those for warm climates [37], but neither are specific to localized dynamic factors like seasonal weather [12].
Several maize-producing states in the US Corn Belt have adopted the empirical “Maximum Return to N” (MRTN) approach [37], which abandons the mass balance method. It provides generalized regional or state-based recommendations based on extensive multi-year and multi-location field trials, curve-fitting, and adjustments based on grain and fertilizer prices. It does not explicitly consider maize yield potential [23] but implicitly accounts for it through regional adjustments based on the location of trials (at the state or substate level).
Sensors: In-season measurements can implicitly encompass the effects of climate and other factors in a production environment. Timely soil testing (e.g., pre-sidedress N test [38]) provides insights into the combined effects of climate, management practices, and weather to refine N fertilizer. Alternatively, plant N status can be assessed from individual leaf samples (e.g., SPAD meters) and more efficiently through remote or proximal sensing of crop canopies from different platforms (satellite, aircraft, drone, or field equipment-mounted [39]). Current challenges with the sensing approaches to N management include required reference strips, detection problems at adequate plant N levels, and water stress [40], and with satellite-based systems the long passover intervals (3–5 days) combined with possible cloud conditions limiting actionable sensing information during critical periods.
Models: Location- and time-specific N recommendations can also be made through the application of dynamic simulation models of a soil–crop system [41]. These tools offer real-time monitoring of soil and crop N status and estimate optimum N application rates through dynamic biophysical models that account for soil, weather, and management factors. Since many of these include climate-influenced factors (e.g., crop rotations, calendars, and genetics; soil organic matter levels; drainage class; N application timing, etc.), the modeling system can account for inherent climate differences among production environments.
2. Materials and Methods
Factors impacting cold climate nitrogen management are difficult to evaluate as most studies are conducted within small climate regions or are based on meta-analyses that provide limited insights into climate effects. Here, data analyses and model simulations are used to gain a deeper understanding of climate impacts related to N management approaches.
2.1. US Corn Belt Yield and EONR Comparisons
The US Corn Belt is located in the north central part of the contiguous continental US states and involves an extended plain without orographic features. It is characterized by isotherms that extend in east–west direction in that mean annual temperatures decrease approximately linearly with increasing latitude (Figure 1). The precipitation isohyets in the region extend in the NNE–SSW direction with NNW locations being drier.
The MRTN database [23] offers a large empirical data set on achieved yields and economic optimum N rates from over one thousand maize N response trials in the US Corn Belt. WebPlotDigitizer (https://automeris.io/WebPlotDigitizer, accessed on 16 July 2023) was used to extract data values on yield and EONR available from the Corn Nitrogen Rate Calculator application (https://www.cornnratecalc.org/, accessed on 16 July 2023). In order to obtain insights into climate effects, we compared EONR and maize yield data (in this case, maize after soybean) from the northern tier states (Minnesota (MN), Wisconsin (WI), and Michigan (MI); latitudes of maize region 42–45 °N) with respective adjacent states to their immediate south (Iowa (IA), Illinois (IL), and Ohio (OH); latitudes of maize region 39–42 °N).
2.2. Climate Effects on Soil Organic Matter Characteristics
Widespread adoption of comprehensive soil health assessment provides opportunities to better understand the effects of climate on a range of soil properties that are relevant to crop N availability, including total soil organic matter (SOM) and carbon (SOC) contents, as well as their labile constituents. The Soil Health Assessment Protocol and Evaluation (SHAPE) framework was developed as a tool that accounts for the interaction of inherent climate and edaphic factors when interpreting changes in dynamic soil health indicators. Using a large continental-scale database (n = 14,680), it applied Bayesian regression modeling to derive parameter estimates based on soil groupings defined by soil texture and suborder, and climate effects described by mean annual temperature (MAT) and precipitation (MAP). SHAPE functions were developed for soil organic carbon (SOC [42]), as well as aggregate stability, permanganate oxidizable organic carbon (POXC), and autoclaved citrate extractable protein (ACE-Protein [43]). In this study, these SHAPE models were applied to evaluate mean annual temperature (MAT) effects on soil properties affecting N availability along a gradient from 5 to 15 °C for a fixed level of 900 mm MAP, texture group T3 (silt and silt loam), and suborder group S2 (mostly Udolls and Ustolls). This geographic range approximately follows a transect from SE Kansas to N Wisconsin (Figure 1). MAT values were varied at 1 °C intervals in the SHAPE models for each soil health indicator.
2.3. Simulations Using the Adapt-N Framework
The Adapt-N tool (adapt-n.com) is a cloud-based nitrogen decision technology that includes virtual monitoring of soil N, crop N, and other agronomic and environmental elements using daily model simulations and inherently includes climate effects on soil and agronomic management, weather data and crop calendars [13]. Through on-farm strip trials in the northeastern, central, and southeastern US states this modeling technology showed benefits with increased partial profits and lower environmental losses compared to conventional grower practices [7,44,45]. The Adapt-N framework was used to perform a simulation-based comparison of two locations in the US Corn Belt region that represent different climates. The warmer location (38.50, −89.70; MAT 12.8 °C) is located in South Central Illinois while the colder location (45.00, −89.70; MAT 5.5 °C) is situated approximately 700 km to the north in North Central Wisconsin (Figure 1). Simulations were performed for 14 growing seasons (2010–2023) in a maize-after-soybean scenario. Data inputs are listed in Table 1. Assumed agronomic management practices were the same, except where climate effects were relevant. Notably, planting dates were 15 April for the warmer location and 15 May for the colder location, and soil organic matter contents were 3.0% and 4.5%, respectively, based on the SHAPE analysis (selected SOM values were 0.5% lower because annual grain cropping systems without organic inputs generally have below average SOM levels [14]). Also, crop maturity class was adjusted (115- vs. 100-day CRM), as well as yield potential based on the MRTN database: 15.1 vs. 11.9 Mg ha−1 for the southern vs. northern location, respectively (Table 2). Both scenarios received 56 kg N ha−1 from urea three days prior to planting, and the simulations were run for 60 days after planting (14 June and 14 July for the southern and northern sites, respectively), to generate a sidedress N recommendation.
3. Results and Discussion
3.1. US Corn Belt Yield and EONR Comparisons
Average annual temperatures in the northern state corn growing regions are approximately 5–8 °C lower than those in the southern tier states (note: Indiana data were excluded due to low trial numbers). Mass balance and empirical N rate recommendation approaches address climate effects on EONR in highly generalized ways (state or regional averages) but are not explicit on climate impacts in space and time. Although for each state/region, the EONR–maize yield relationship is purportedly weak or nonexistent when disregarding factors related to specific production environments and weather [25], an apparent linear relationship exists when considering the entire region (Figure 2). When 1312 N response trials as part of the MRTN database are combined (Figure 2), lower yields are associated with lower economic optimum N rates, which in turn on average are linked to the colder northern tier states compared with the adjacent states to their south (Table 2). The state averages (large colored dots) follow the general trendline, but the range and variability (R2 = 0.062) among all individual N response trials is much greater in terms of both EONR and yield, remarkably so for a simple maize–soybean rotation without organic inputs.
The average northern states’ EONR is 40 kg ha−1 lower than the southern states, while the average yield is lower by 1.2 Mg ha−1 (Table 2). In the eastern (more humid) states of the Corn Belt (MI and OH) the EONR and yield differences are 28 kg ha−1 and 0.4 Mg ha−1, respectively, while in the western (drier) region (IA and MN) the differences are minimal, perhaps also due to less latitude differential of the main maize production areas in each state. The largest difference is found in the Central Corn Belt, where the EONR for IL is 77 kg ha−1 higher and the average yield is 3.2 Mg ha−1 greater than for WI. In general, it appears that in the north–south comparisons both EONR and yield tend to decrease with colder climates. When there is little yield difference (MN and IA), the differences in EONR are also negligible. Although there are many other edaphic factors involved, the generally lower EONRs for the colder climate regions may therefore in part be explained by lower yield potentials.
3.2. Climate Effects on Soil Organic Matter Characteristics
Empirical SHAPE functions estimated a gradual reduction in SOC content from 3.0 to 2.0% along a MAT change from 5 to 15 °C, which is equivalent to a 33% mass loss with the warmer temperatures (Figure 3). POXC (also referred to as Active C) represents a labile fraction of SOC that is mostly associated with phenolic compounds, i.e., partially decomposed plant materials [46]. POXC content reduces from 620 to 375 ppm (−40%) along the 5 to 15 °C gradient. Similarly, ACE Protein content (associated with much of the N-containing organic compounds) declines from 6.6 to 3.45 mg g−1 (−48%). Both labile SOM fractions are apparently disproportionally conserved with respect to total SOC in soils in colder climates. Notably, both the POXC/SOC and ACE Protein/SOC ratios decline along the 5 to 15 °C gradient, the latter (most relevant for N dynamics) from 0.220 to 0.175.
Finally, wet aggregate stability, a physical property that impacts hydrological functioning and root development, also declines greatly along the 5 to 15 °C gradient, from 42 to 15%. In all, colder climate soils have higher organic matter fractions, more labile SOM, and better soil structure, which could be explained by longer periods of low decomposition rates of organic inputs (residues, manure, etc.), and increased wetness, as well as regional farming system differences. It is unclear from these data whether the greater stocks and lability of SOM in colder climates result in higher crop N availability. If the higher stocks are the result of lower N mineralization from reduced organic matter cycling due to temperature constraints, then this ipso facto also suggests that lower mineralization rates constrain crop N availability despite higher substrate levels. This is explored in the model study.
3.3. Simulations Using the Adapt-N Framework
Model simulations estimate that 60 days after planting the maize stage of development in the warmer (Illinois) location averaged V15 [47], while the colder (Wisconsin) location averaged V13 with a one-month later date of planting (Table 3). This suggests that the colder climate likely poses limitations on growing degree days and may account for overall lower crop growth potential (Table 2 and Table 3). Precipitation over the 60-day post-planting period averages similarly for the two locations but had considerable annual variation.
Simulated N mineralization (not including losses) averaged 17 kg N ha−1 lower for the colder Wisconsin site than the warmer Illinois site, despite the higher SOM content (4.5% vs. 3%). This supports the notion that lower soil temperatures reduced the biologically mediated process significantly in the early part of the growing season, even considering a delayed crop calendar. Post-planting N losses (leaching and denitrification in 60 days after planting) were generally equivalent for the sites and modest given the low preplant N application amount and the lack of organic N inputs.
The Adapt-N estimated optimum N rate averaged 173 kg ha−1 for the Illinois site and 115 kg ha−1 for the colder Wisconsin site. This is in both cases modestly below the EONR values from the MRTN database (28 and 9 kg ha−1, respectively; Table 2) which can be explained by high efficiency from the split applications (small preplant plus sidedress). The 58 kg ha−1 higher model-estimated optimum N rate for the warmer than the colder location aligns well with the 75 kg ha−1 difference from the MRTN database (again, with presumably a minor effect of N application timing).
Both locations show considerable seasonal variability. Adapt-N recommended N rates at the Illinois site ranged from 151 to 196 kg ha−1 (s = 14 kg ha−1), while they varied from 56 kg ha−1 to 151 kg ha−1 at the colder Wisconsin site (s = 27 kg ha−1). Seasonal variation is therefore considerable, in line with conclusions by Correndo et al., [37] that weather contributed 67% of the explained variance in maize EONR.
In all, the Adapt-N simulation experiment supports the notion that N mineralization tends to be lower in colder climates despite generally higher SOM stocks. N losses are minimally affected by climate, and the differential in net N credit from post-plant SOM mineralization is a modest 12 kg ha−1 for the Illinois over the Wisconsin site and does not explain the 58 kg N ha−1 lower optimum N rate in the other direction. The 3.2 Mg ha−1 average higher yield levels for the Illinois compared to the colder climate Wisconsin site (Table 2) would be associated with an equivalent higher (54 kg ha−1) N rate when assuming 18 kg ha−1 of N is required to produce an additional 1 Mg ha−1 grain yield [26]. This very close alignment with the model simulation results therefore supports the notion that lower maize EONRs in colder climates are primarily the result of lower N demand associated with lower crop yields. The model can capture these climate effects through inputs on crop metrics (including yield trends, soil health, and agronomy) while also incorporating the dynamic seasonal variations as a result of weather effects [37].
4. Conclusions
Correct estimation of maize N requirements is challenging due to the dynamic processes that impact N availability and optimum N rates. This is related to a multitude of factors, including yield potential, soil characteristics, and agronomic practices. Based on a US Corn Belt dataset, the average yields and EONRs for cold climate states is lower than their warmer southerly neighbor states. Over all trials, there was a correlation between EONR and yield, but the range and variability are much larger than can be explained by climate differences.
Soil health data patterns that were modeled using the SHAPE functions show that soil organic matter stocks, especially labile fractions, increase with lower mean annual temperature, presumably due to overall lower annual decomposition rates from extended cold periods. However, this may not result in higher crop N availability due to countervailing factors (again, presumably due to cooler soil temperatures). Model simulations reproduced these patterns in that (i) higher SOM levels in colder climate fields did not result in higher mineralized N levels, and (ii) optimum N rates averaged considerably lower for a cold climate site compared to a warmer climate site, although they each show high seasonal variability due to weather patterns. The difference in average optimum N rate is well explained by lower yield potentials at the colder site.
Overall, abductive inferences from multiple data sources indicate (but not prove) that colder climates are generally associated with higher levels of SOM-associated N stocks, but this may not result in greater crop N availability. Also, colder climates are on average associated with lower EONRs, which are mostly explained by lower yield expectations. But seasonal weather is an important superimposing factor impacting the EONR for all climates. Progress in N management therefore requires a dynamic approach that accounts for the effects of climate and weather with interacting agronomic factors for a specific growing environment.
Funding
This research received no external funding.
Data Availability Statement
Data generated in this research are available upon request from the author.
Conflicts of Interest
H.v.E. is employed by Cornell University and lead inventor of the Adapt-N software, which is currently licensed to Yara International, ASA. The author receives royalty payments and consulting fees from Yara.
References
- McIsaac, G.F.; David, M.B.; Gertner, G.Z.; Goolsby, D.A. Relating Net Nitrogen Input in the Mississippi River Basin to Nitrate Flux in the Lower Mississippi River. J. Environ. Qual. 2002, 31, 1610–1622. [Google Scholar] [CrossRef] [PubMed]
- EPA. Inventory of U.S. Greenhouse Gas Emissions and Sinks: 1990–2021. U.S. Environmental Protection Agency, EPA 430-R-23-002. 2023. Available online: https://www.epa.gov/ghgemissions/inventory-us-greenhouse-gas-emissions-and-sinks-1990-2021 (accessed on 19 December 2023).
- Pinder, R.W.; Adams, P.J.; Pandis, S.N. Ammonia emission controls as a cost-effective strategy for reducing atmos-pheric particulate matter in the eastern United States. Environ. Sci. Technol. 2007, 41, 380–386. [Google Scholar] [CrossRef] [PubMed]
- Cassman, K.G.; Dobermann, A.; Walters, D.T. Agroecosystems, Nitrogen-use efficiency, and nitrogen management. AMBIO 2002, 31, 132–140. [Google Scholar] [CrossRef] [PubMed]
- Hoben, J.P.; Gehl, R.J.; Millar, N.; Grace, P.R.; Robertson, G.P. Nonlinear nitrous oxide (N2O) response to nitrogen fertilizer in on-farm corn crops of the US Midwest. Glob. Chang. Biol. 2010, 17, 1140–1152. [Google Scholar] [CrossRef]
- McLellan, E.L.; Kenneth, G.; Cassman, P.B.; Woodbury, S.S.; Alison, J.E.; Christina, T.; Rebecca, D.M.; van Es, H.M. The Nitrogen Balancing Act: Tracking the Environmental Performance of Food Supply Chains. BioScience 2018, 68, 194–203. [Google Scholar] [CrossRef]
- van Es, H.M.; Marjerison, R.; Barik, M. Adapt—N. In Modeling for Precision Agriculture; Cammarano, D., Kempenaar, C., van Evert, F., Eds.; Springer Book Series; Springer: Berlin/Heidelberg, Germany, 2022; ISSN 2511-2260. [Google Scholar]
- Sela, S.; van Es, H.M.; Moebius-Clune, B.N.; Marjerison, S.R.; Kneubuhler, G. Dynamic model-based recom-mendations increase the precision and sustainability of N fertilization in midwestern US maize production. Comput. Electron. Agric. 2018, 153, 256–265. [Google Scholar] [CrossRef]
- Ketterings, Q.M.; Klausner, S.; Czymmek, K.J. Nitrogen Guidelines for Field Crops in New York, 2nd ed.; Cornell University: Ithaca, NY, USA, 2003. [Google Scholar]
- Stanford, G. Rationale for Optimum Nitrogen Fertilization in Corn Production. J. Environ. Qual. 1973, 2, 159–166. [Google Scholar] [CrossRef]
- Melkonian, J.J.; van Es, H.M.; DeGaetano, A.T.; Joseph, L. ADAPT-N: Adaptive nitrogen management for maize using high-resolution climate data and model simulations. In Proceedings of the 9th International Conference on Precision Agriculture, Denver, CO, USA, 20–23 July 2008. [Google Scholar]
- van Es, H.M.; Kay, B.D.; Melkonian, J.J.; Sogbedji, J.M. Nitrogen Management Under Maize in Humid Regions: Case for a Dynamic Approach. In Managing Crop Nutrition for Weather; Bruulsema, T., Ed.; International Plant Nutrition Institute Publications: Norcross, GA, USA, 2007; pp. 6–13. [Google Scholar]
- Kyveryga, P.M.; Blackmer, A.M.; Ellsworth, J.W.; Isla, R. Soil pH effects on nitrification of fall-applied anhydrous ammonia. Soil Sci. Soc. Am. J. 2004, 68, 545–551. [Google Scholar]
- Amsili, J.P.; van Es, H.M.; Schindelbeck, R.R. Cropping System and Soil Texture Impact Soil Health Outcomes and Interpretations. Soil Secur. 2021, 4, 100012. [Google Scholar] [CrossRef]
- Risk, N.; Snider, D.; Wagner-Riddle, C. Mechanisms leading to enhanced soil nitrous oxide fluxes induced by freeze–thaw cycles. Can. J. Soil Sci. 2013, 93, 401–414. [Google Scholar] [CrossRef]
- Miller, R.D. Freezing phenomena in soils. In Applications of Soil Physics; Hillel, D., Ed.; Academic Press: Cambridge, MA, USA, 1980; pp. 254–299. [Google Scholar]
- Wagner-Riddle, C.; Hu, Q.C.; van Bochove, E.; Jayasundara, S. Linking nitrous oxide flux during spring thaw to nitrate denitrification in the soil profile. Soil Sci. Soc. Am. J. 2008, 72, 908–916. [Google Scholar] [CrossRef]
- Wagner-Riddle, C.; Baggs, E.M.; Clough, T.J.; Fuchs, K.; O Petersen, S. Mitigation of nitrous oxide emissions in the context of nitrogen loss reduction from agroecosystems: Managing hot spots and hot moments. Curr. Opin. Environ. Sustain. 2020, 47, 46–53. [Google Scholar] [CrossRef]
- Correndo, A.A.; Rotundo, J.L.; Tremblay, N.; Archontoulis, S.; Coulter, J.A.; Ruiz-Diaz, D.; Franzen, D.; Franzluebbers, A.J.; Nafziger, E.; Schwalbert, R.; et al. Assessing the uncertainty of maize yield without nitrogen fertilization. Field Crop. Res. 2020, 260, 107985. [Google Scholar] [CrossRef]
- Jokela, W.E.; Meisinger, J.J. Ammonia Emissions from Land-Applied Manure: Environmental and Economic Benefits. In Proceedings of the Wisconsin Fertilizer, Aglime and Pest Management Conference, Madison, WI, USA, 15–17 January 2008; pp. 199–208. [Google Scholar]
- Melkonian, J.; Poffenbarger, H.J.; Mirsky, S.B.; Ryan, M.R.; Moebius-Clune, B.N. Estimating Nitrogen Mineralization from Cover Crop Mixtures Using the Precision Nitrogen Management Model. Agron. J. 2017, 109, 1944–1959. [Google Scholar] [CrossRef]
- Wood, S.A.; Bowman, M. Large-scale Farmer-led Experiment Demonstrates Positive Impact of Cover Crops on Multiple Soil Health Indicators. Nat. Food 2021, 2, 97–103. [Google Scholar] [CrossRef]
- Sawyer, J.; Nafziger, E.; Randall, G.; Bundy, L.; Rehm, G.; Joern, B. Concepts and Rationale for Regional Nitrogen Rate Guide Lines for Corn (PM-2015); Iowa State University Extension: Ames, IA, USA, 2006. Available online: https://publications.iowa.gov/3847/1/PM2015.pdf (accessed on 19 December 2023).
- Ciampitti, I.A.; Vyn, T.J. Grain Nitrogen Source Changes over Time in Maize: A Review. Crop. Sci. 2013, 53, 366–377. [Google Scholar] [CrossRef]
- Snyder, C.; Bruulsema, T.; Jensen, T.; Fixen, P. Review of greenhouse gas emissions from crop production systems and fertilizer management effects. Agric. Ecosyst. Environ. 2009, 133, 247–266. [Google Scholar] [CrossRef]
- TFI (The Fertilizer Institute). The 4R of Nutrient Stewardship. 2018. Available online: https://nutrientstewardship.com/4rs/ (accessed on 23 May 2023).
- USDA ERS (United States Department of Agriculture Economic Research Service). Tailored Reports: Crop Production Practices; USDA Economic Research Service: Washington, DC, USA, 2010. Available online: https://data.ers.usda.gov/reports.aspx?ID=17883 (accessed on 2 October 2023).
- Sela, S.; Woodbury, P.B.; Marjerison, R.; van Es, H.M. Towards applying N balance as a sustainability indicator for the US cornbelt: Realistic achievable targets, spatio-temporal variability and policy implications. Environm. Res. Lett. 2019, 14, 064015. [Google Scholar] [CrossRef]
- Abalos, D.; Jeffery, S.; Sanz-Cobena, A.; Guardia, G.; Vallejo, A. Meta-analysis of the effect of urease and nitrification inhibitors on crop productivity and nitrogen use efficiency. Agric. Ecosyst. Environ. 2014, 189, 136–144. [Google Scholar] [CrossRef]
- Halvorson, A.D.; Snyder, C.S.; Blaylock, A.D.; Del Grosso, S.J. Enhanced-efficiency nitrogen fertilizers: Potential role in nitrous oxide emission mitigation. Agron. J. 2014, 106, 715–722. [Google Scholar] [CrossRef]
- Nkebiwe, P.M.; Weinmann, M.; Bar-Tal, A.; Müller, T. Fertilizer placement to improve crop nutrient acquisition and yield: A review and meta-analysis. Field Crop. Res. 2016, 196, 389–401. [Google Scholar] [CrossRef]
- Rochette, P.; Angers, D.A.; Chantigny, M.H.; MacDonald, J.D.; Bissonnette, N.; Bertrand, N. Ammonia volatilization following surface application of urea to tilled and no-till soils: A laboratory comparison. Soil Tillage Res. 2009, 103, 310–315. [Google Scholar] [CrossRef]
- Kay, B.D.; Mahboubi, A.A.; Beauchamp, E.G.; Dharmakeerthi, R.S. Integrating soil and weather data to describe variability in plant available nitrogen. Soil Sci. Soc. Am. J. 2006, 70, 1210–1221. [Google Scholar] [CrossRef]
- Tremblay, N.; Bouroubi, Y.M.; B´elec, C.; Mullen, R.W.; Kitchen, N.R.; Thomason, W.E.; Ebelhar, S.; Mengel, D.B.; Raun, W.R.; Francis, D.D.; et al. Corn response to nitrogen is influenced by soil texture and weather. Agron. J. 2012, 104, 1658–1671. [Google Scholar] [CrossRef]
- Correndo, A.A.; Tremblay, N.; Coulter, J.A.; Ruiz-Diaz, D.; Franzen, D.; Nafziger, E.; Prasad, V.; Rosso, L.H.M.; Steinke, K.; Du, J.; et al. Unraveling uncertainty drivers of the maize yield response to nitrogen: A Bayesian and machine learning approach. Agric. For. Meteorol. 2021, 311, 108668. [Google Scholar] [CrossRef]
- Sela, S.; Woodbury, P.B.; van Es, H.M. Dynamic model-based N management reduces surplus nitrogen and improves the environmental performance of corn production. Environ. Res. Lett. 2018, 13, 054010. [Google Scholar] [CrossRef]
- Morris, T.F.; Scott Murrell, T.; Beegle, D.B.; Camberato, J.J.; Ferguson, R.B.; Grove, J.; Ketterings, Q.; Kyveryga, P.M.; Laboski, C.A.M.; McGrath, J.M.; et al. Strengths and Limitations of Nitrogen Rate Recommendations for Corn and Opportunities for Improvement. Agron. J. 2018, 110, 1–37. [Google Scholar] [CrossRef]
- Magdoff, F.R.; Ross, D.; Amadon, J. A soil test for nitrogen availability to corn. Soil Sci. Soc. Am. J. 1984, 48, 1301–1304. [Google Scholar] [CrossRef]
- Colaço, A.; Bramley, R. Do crop sensors promote improved nitrogen management in grain crops? Field Crops Res. 2018, 218, 126–140. [Google Scholar] [CrossRef]
- Hatfield, J.L. Precision nutrient management and crop sensing. In Phenomics in Crop Plants: Trends, Options and Lim-Itations; Kumar, J., Pratap, A., Kumar, S., Eds.; Springer: Delhi, India, 2013. [Google Scholar]
- Kersebaum, K. Application of a simple management model to simulate water and nitrogen dynamics. Ecol. Model. 1995, 81, 145–156. [Google Scholar] [CrossRef]
- Nunes, M.R.; Veum, K.S.; Parker, P.A.; Holan, S.H.; Karlen, D.L.; Amsili, J.P.; van Es, H.M.; Wills, S.A.; Seybold, C.A.; Moorman, T.B. The soil health assessment protocol and evaluation applied to soil organic carbon. Soil Sci. Soc. Am. J. 2021, 85, 1196–1213. [Google Scholar] [CrossRef]
- Nunes, M.R.; Veum, K.S.; Parker, P.A.; Holand, S.H.; Amsili, J.P.; van Es, H.M.; Wills, S.A.; Seybold, C.A.; Karlen, D.L. SHAPEv1.0 Scoring Curves and Peer Group Benchmarks for Dynamic Soil Health Indicators. Soil Sci. Soc. Am. J. 2023; in press. [Google Scholar]
- University of Nebraska. 2021 On-Farm Research Results. 2022. Available online: https://on-farm-research.unl.edu/pdfs/research/result-publications/2021research-results.pdf (accessed on 1 October 2023).
- University of Nebraska. 2022 On-Farm Research Results. 2023. Available online: https://on-farm-research.unl.edu/pdfs/research/result-publications/2022research-results.pdf (accessed on 1 October 2023).
- Christy, I.; Moore, A.; Myrold, D.; Kleber, M. A mechanistic inquiry into the applicability of permanganate oxidizable carbon as a soil health indicator. Soil Sci. Soc. Am. J. 2023, 87, 1083–1095. [Google Scholar] [CrossRef]
- Abendroth, L.J.; Elmore, R.W.; Boyer, M.J.; Marlay, S. Corn Growth and Development; Report PMR 1009; Iowa State University Extension and Outreach: Ames, IA, USA, 2011; 50p. [Google Scholar]
Figure 1.
Mean annual temperature (1991–2020) for contiguous continental US states in °F units (ToC = (ToF × 0.556) − 32) including Corn Belt states used for MRTN analysis (Table 1). Transect line indicates approximate 5 to −15 °C temperature change at the 900 mm annual precipitation line (Table 2). Star locations were used in Adapt-N simulations. Map source: NOAA.
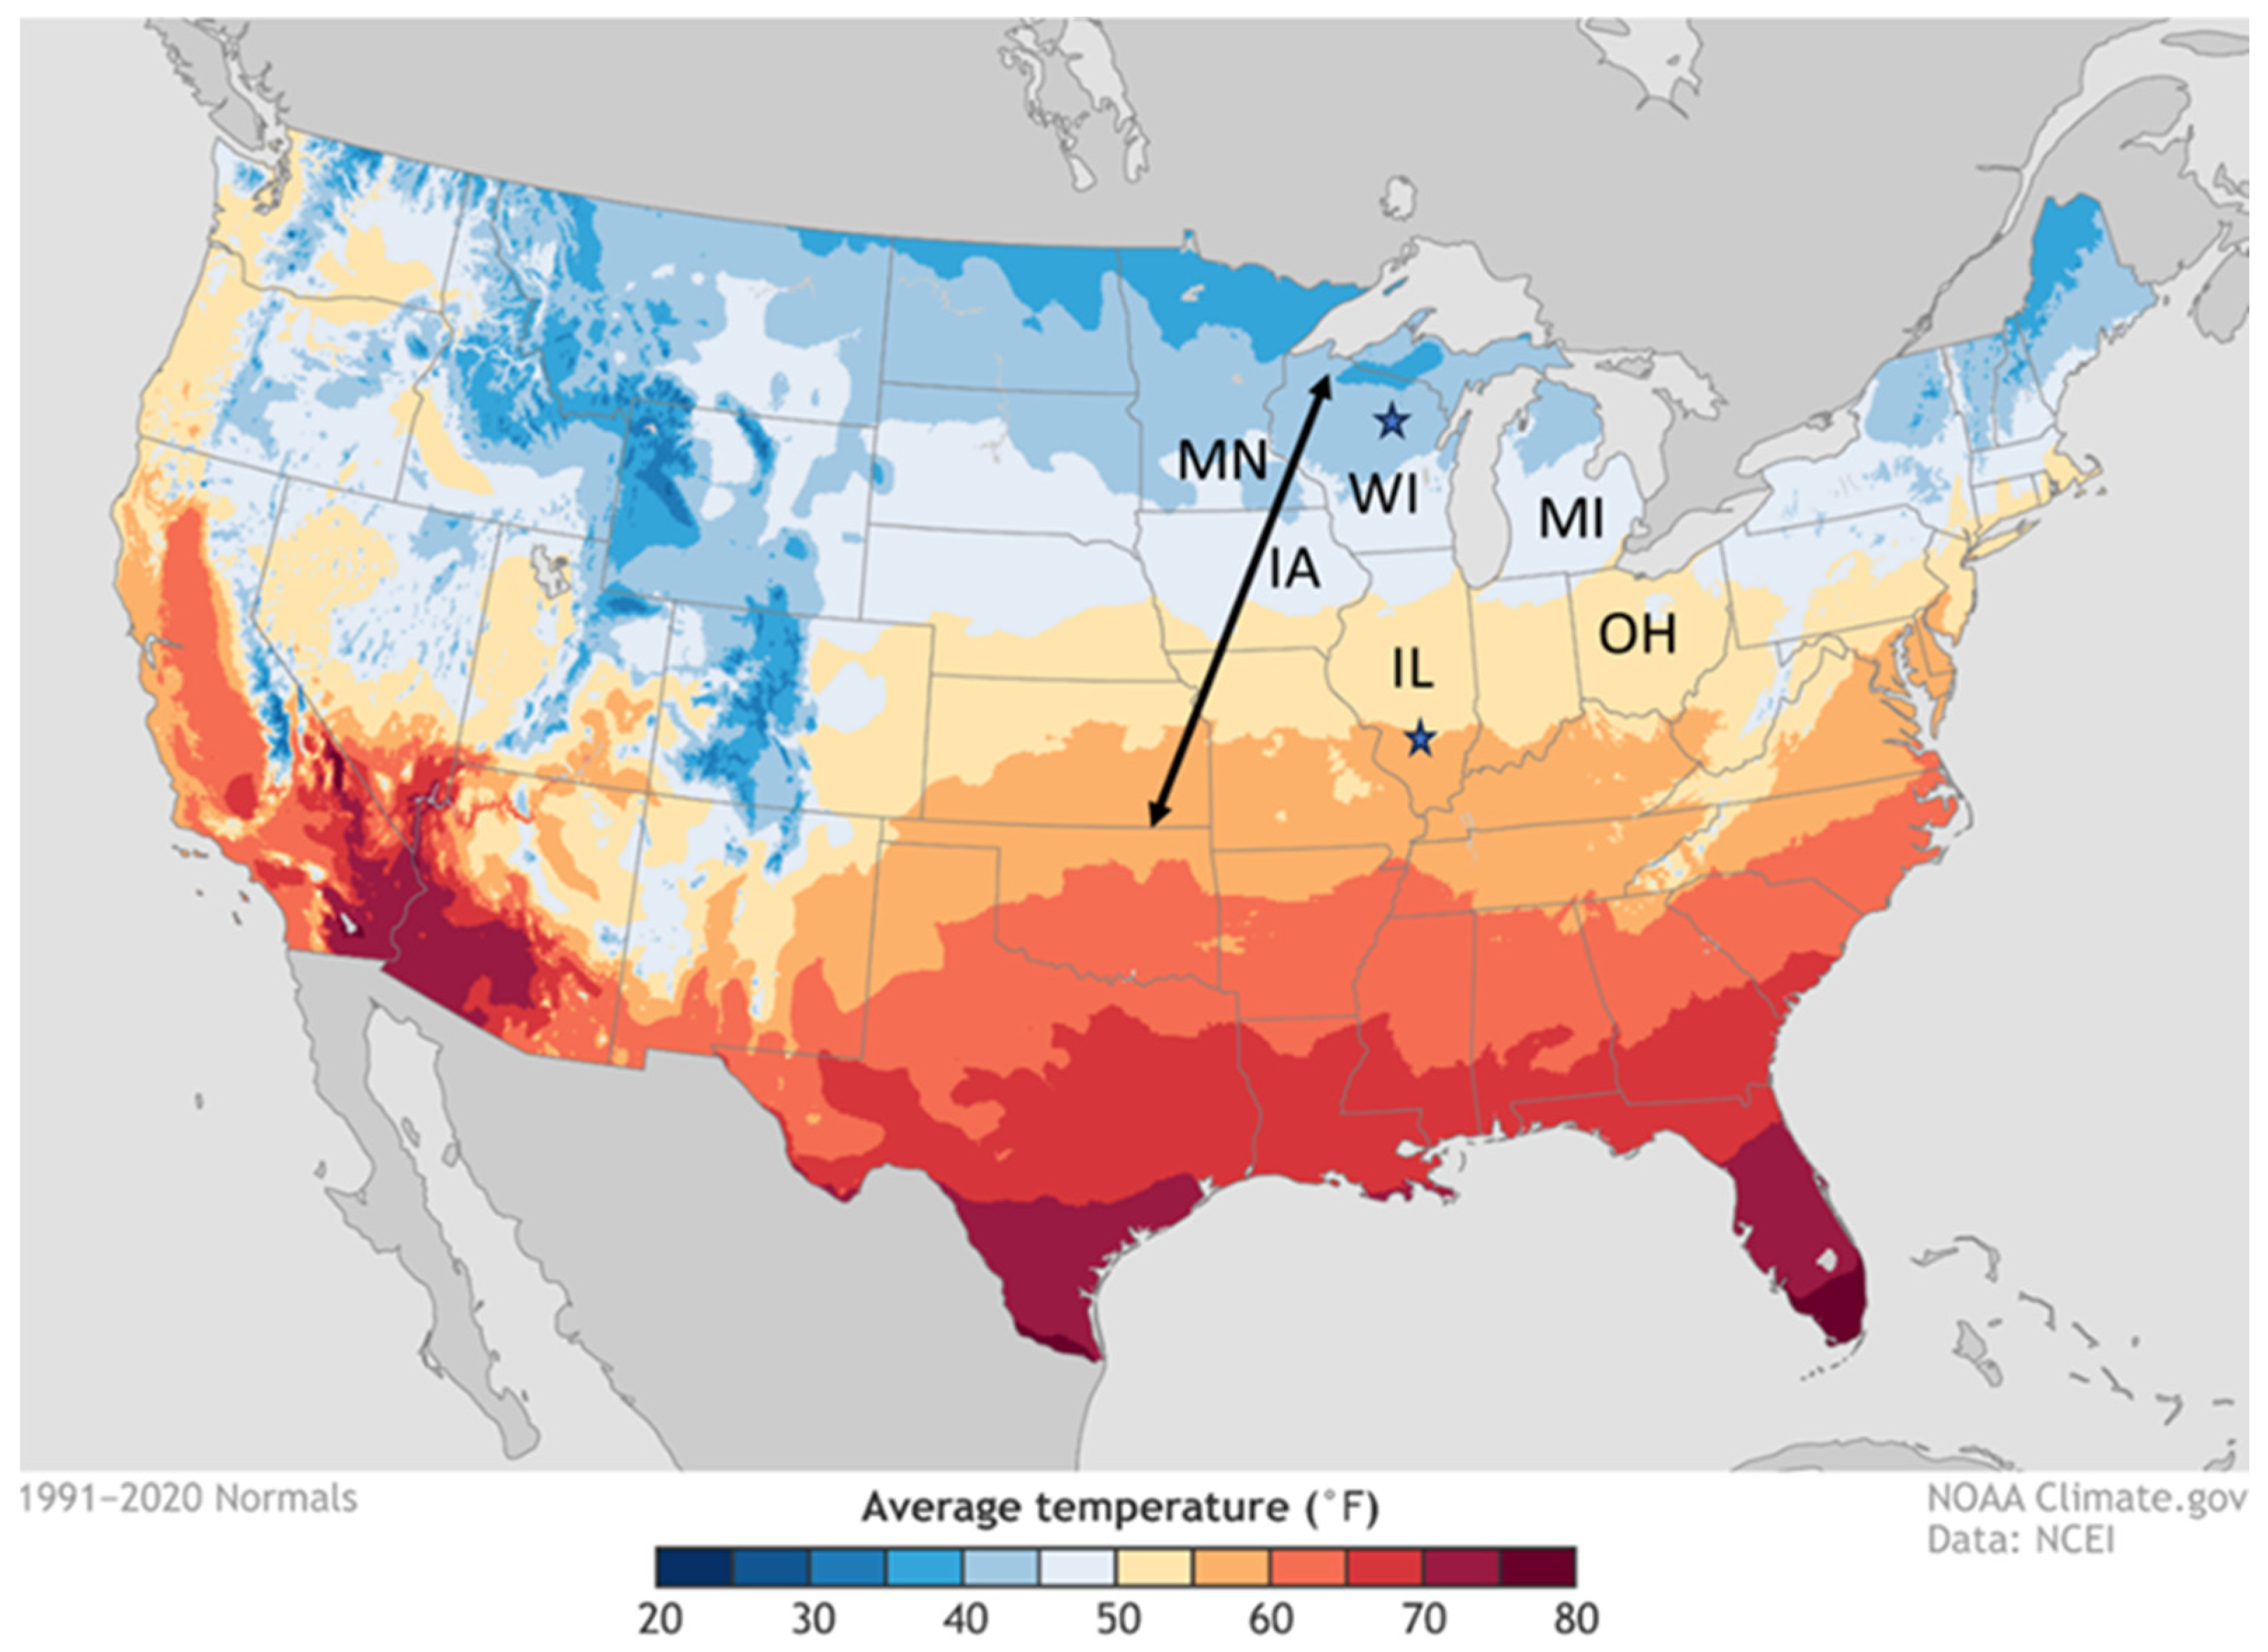
Figure 2.
Relationship between EONR and maize yield (after soybean) from MRTN dataset for US Corn Belt states. Large dots represent state averages for northern tier states (blue: MN, WI, MI) and southern tier states (red: IA, IL, OH).
Figure 2.
Relationship between EONR and maize yield (after soybean) from MRTN dataset for US Corn Belt states. Large dots represent state averages for northern tier states (blue: MN, WI, MI) and southern tier states (red: IA, IL, OH).

Figure 3.
Relationship between mean annual temperature (5–15 °C) and selected soil health indicators and derived ratios with SOC according to the SHAPE algorithms for 900 mm mean annual precipitation, texture group T3 (silt and silt loam), and suborder group S2 (mostly Udolls and Ustolls).
Figure 3.
Relationship between mean annual temperature (5–15 °C) and selected soil health indicators and derived ratios with SOC according to the SHAPE algorithms for 900 mm mean annual precipitation, texture group T3 (silt and silt loam), and suborder group S2 (mostly Udolls and Ustolls).


Table 1.
Adapt-N data factors and input values for Illinois-Wisconsin simulation comparison.
| Illinois Field (38.5, −90.7) | Wisconsin Field (45.0, −89.7) | |
|---|---|---|
| Weather | Daily precipitation; max–min temperature; solar radiation | |
| Soil | Texture and pH: regional silt loam; slope class: 0.5–3%; drainage class: well-drained; rooting depth: 800 mm; | |
| Soil organic matter content | 3.0% | 4.5% |
| Maize cultivation | Cultivar: grain, 115-day RM; expected yield: 15.1 Mg ha−1; harvest population: 70,000 plants ha−1; previous crop: soybean; planting date: April 15 | Cultivar: grain, 100-day RM; expected yield: 11.9 Mg ha−1; harvest population: 70,000 plants ha−1; previous crop: soybean; planting date: May 15 |
| N Fertilizer applications | Preplant application date: April 12; rate: 56 kg ha−1; type: urea; placement depth: 50–100 mm; stabilizers: none | Preplant application date: May 12; rate: 56 kg ha−1; type: urea; placement depth: 50–100 mm; stabilizers: none |
| Tillage system | Type: conservation tillage; residue level: 50% | |
| Organic inputs | None | |
| Cover crops | None | |
| Irrigation | None | |
| Economic and risk | Fertilizer price: USD 1.87 kg−1; grain price: USD 0.73 kg−1; EONR uncertainty: 22 kg ha−1 | |
| Field observations | PSNT result: as modeled; date of emergence: as modeled | |
Table 2.
EONR for maize after soybean trials in regions of the US Corn Belt organized by longitude and latitude (data source: https://www.cornnratecalc.org/, accessed on 26 July 2023). Economic optimum N rate based on 0.17 (USD kg−1 grain/USD kg−1 N) price ratio. HYP: high yield potential areas in WI. MAP: mean annual precipitation.
| Western Corn Belt States (Lowest MAP) | Central Corn Belt States | Eastern Corn Belt States (Highest MAP) | Mean | ||||||||
|---|---|---|---|---|---|---|---|---|---|---|---|
| EONR kg ha−1 | Avg Yield Mg ha−1 | EONR kg ha−1 | Avg Yield Mg ha−1 | EONR kg ha−1 | Avg Yield Mg ha−1 | EONR kg ha−1 | Avg Yield Mg ha−1 | ||||
| Northern | Minnesota (n = 165) | 159 | 13.3 | Wisconsin HYP (n = 58) | 124 | 11.9 | Michigan (n = 54) | 176 | 11.8 | 153 | 12.3 |
| Southern | Iowa (n = 178) | 165 | 13.1 | Illinois North + Central (n = 430) | 201 | 15.1 | Ohio (n = 256) | 204 | 12.2 | 193 | 13.5 |
Table 3.
Results of Adapt-N simulation comparison Illinois vs. Wisconsin, including estimated crop stage 60 days after planting, cumulative precipitation, N mineralization, N losses (leaching + gaseous), and recommended N rate 60 days after planting.
Table 3.
Results of Adapt-N simulation comparison Illinois vs. Wisconsin, including estimated crop stage 60 days after planting, cumulative precipitation, N mineralization, N losses (leaching + gaseous), and recommended N rate 60 days after planting.
| Illinois (38.5, −89.7) | Wisconsin (45.0, −89.7) | |||||||||
|---|---|---|---|---|---|---|---|---|---|---|
| Year | Crop Stage | Precip | Nmin | Nloss | Nrate | Crop Stage | Precip | Nmin | Nloss | Nrate |
| mm | kg ha−1 | mm | kg ha−1 | |||||||
| 2010 | V17 | 254 | 72 | 40 | 179 | V14 | 330 | 69 | 34 | 67 |
| 2011 | V15 | 345 | 73 | 35 | 179 | V12 | 165 | 50 | 25 | 123 |
| 2012 | V16 | 132 | 95 | 25 | 162 | V15 | 142 | 76 | 21 | 56 |
| 2013 | V13 | 422 | 72 | 45 | 190 | V12 | 266 | 47 | 37 | 134 |
| 2014 | V15 | 208 | 72 | 36 | 168 | V12 | 259 | 47 | 31 | 134 |
| 2015 | V15 | 221 | 68 | 31 | 174 | V10 | 327 | 57 | 40 | 112 |
| 2016 | V15 | 213 | 81 | 38 | 168 | V13 | 216 | 67 | 19 | 112 |
| 2017 | V15 | 274 | 84 | 45 | 151 | V12 | 338 | 63 | 30 | 140 |
| 2018 | V19 | 130 | 75 | 29 | 157 | V17 | 178 | 59 | 28 | 106 |
| 2019 | V14 | 330 | 72 | 36 | 196 | V11 | 290 | 48 | 34 | 151 |
| 2020 | V12 | 267 | 75 | 38 | 190 | V15 | 376 | 57 | 31 | 134 |
| 2021 | V13 | 157 | 74 | 32 | 179 | V15 | 437 | 71 | 39 | 106 |
| 2022 | V16 | 185 | 74 | 36 | 174 | V12 | 251 | 54 | 26 | 123 |
| 2023 | V14 | 89 | 82 | 16 | 151 | V15 | 135 | 60 | 9 | 112 |
| Mean | V15 | 230 | 76 | 34 | 173 | V13 | 265 | 59 | 29 | 115 |
| StDev | V2 | 93 | 7 | 8 | 14 | V2 | 91 | 9 | 9 | 27 |
Disclaimer/Publisher’s Note: The statements, opinions and data contained in all publications are solely those of the individual author(s) and contributor(s) and not of MDPI and/or the editor(s). MDPI and/or the editor(s) disclaim responsibility for any injury to people or property resulting from any ideas, methods, instructions or products referred to in the content. |
© 2023 by the author. Licensee MDPI, Basel, Switzerland. This article is an open access article distributed under the terms and conditions of the Creative Commons Attribution (CC BY) license (https://creativecommons.org/licenses/by/4.0/).
Share and Cite
MDPI and ACS Style
van Es, H. Cold Climate Factors in Nitrogen Management for Maize. Agriculture 2024, 14, 85. https://doi.org/10.3390/agriculture14010085
AMA Style
van Es H. Cold Climate Factors in Nitrogen Management for Maize. Agriculture. 2024; 14(1):85. https://doi.org/10.3390/agriculture14010085
Chicago/Turabian Stylevan Es, Harold. 2024. "Cold Climate Factors in Nitrogen Management for Maize" Agriculture 14, no. 1: 85. https://doi.org/10.3390/agriculture14010085
Note that from the first issue of 2016, this journal uses article numbers instead of page numbers. See further details here.