Article

The Dynamics of Soil Macropores and Hydraulic Conductivity as Influenced by the Fibrous and Tap Root Systems

1
College of Ecology and Environment, Chengdu University of Technology, Chengdu 610059, China
2
Tianfu Yongxing Laboratory, Chengdu 610213, China
3
Key Laboratory of Ministry of Education on Land Resources Evaluation and Monitoring in Southwest China, Sichuan Normal University, Chengdu 610066, China
*
Author to whom correspondence should be addressed.
Agriculture 2024, 14(10), 1676; https://doi.org/10.3390/agriculture14101676
Submission received: 2 August 2024 / Revised: 16 September 2024 / Accepted: 24 September 2024 / Published: 25 September 2024
(This article belongs to the Section Agricultural Soils)

Abstract

:
Herbaceous plants influence soil hydraulic conductivity by changing soil macropore structure through their root systems, but the effects of different root types on macropore structure have yet to be clarified. In this study, soil column experiments were conducted to investigate temporal variations in soil macropores and saturated hydraulic conductivity, as influenced by herbaceous plants with fibrous roots (Cynodon dactylon) and taproots (Medicago sativa L.). Computed tomography (CT) scanning was used to quantify soil macropore indices, and the saturated hydraulic conductivity (Ks) was measured from April to November after 3, 5, and 7 months of sowing. The results showed that both soil macropore indices and Ks increased with grass growth. The taproots had macroporosity (MP), macropore diameter (MD), and global connectivity (Γ) values that were 1.94, 2.76, and 2.45 times higher than fibrous roots, which are more efficient at increasing the number of soil macropores (PN). This resulted in higher Ks values for the fibrous roots during the experimental period than for the taproot herbs. For both plants, the top 5 cm of soil had a higher macropore index and Ks values than the bottom layer. The Ks for fibrous roots was most closely related to PN. On the other hand, Ks for the taproot soil column was most closely related to MP and MD. Based on a combination of soil macropore indices, functions were established to predict Ks values for fibrous root and taproot herbaceous plants.

1. Introduction

Soil erosion is a major environmental problem that affects soil productivity and leads to land degradation [1]. Soil erosion driven by water is recognized as the most widespread type of erosion in the world, with raindrop splashes and concentrated flow causing severe soil loss from slopes lacking vegetation cover [2,3]. Vegetation restoration is recognized as an efficient method to control soil erosion on these slopes and improve soil erosion resistance and optimize slope stability [4,5]. Underground plant roots changes soil structure and play an important role in reducing runoff and soil loss. It has been reported that half of all reduction in soil erosion occurs due to the living roots of plants [6]. Plant root systems can influence soil water infiltration capacity and paths [7]. In particular, plant roots enhance soil macropore formation by penetrating soil masses and increasing hydraulic conductivity [8].
Soil macropores play a critical role in the hydrological functions of vegetation [9]. Although macropores (diam. >1000 μm) make up only a small proportion of the total soil volume, they have been reported to be the main determinant of hydraulic conductivity [10]. Studies have shown that the saturated hydraulic conductivity (Ks) of a soil is more strongly affected by its macropore properties [11] than by other soil properties. Macropore indices such as macroporosity, macropore diameter, volume, and connectivity were found to be related to hydraulic conductivity [12]. In previous studies, dye tracers [13] and resin impregnation techniques [14] were used to quantify the macropore index. X-ray computed tomography (CT) is a quick, nondestructive, and noninvasive method for visualizing and quantifying soil macropore structure. It can be used to capture images of soil sections and establish 3D soil pore network structures, providing reliable information [15]. This novel technique has been employed to quantify soil macropore characteristics and their relationships with hydraulic conductivity [16]. Most macropore parameters are positively correlated with Ks [10,17]. Many researchers have proposed models for estimating Ks based on macropore parameters [18]. Wang et al. (2024) found that the number of macropores [19] or the presence of macropores [10,20] could explain most of the variability in Ks. Zhang et al. (2019) [13] indicated that it is critical to quantify the macropore characteristics of the limiting soil layer to predict soil Ks. The mechanisms governing Ks are associated with soil macropore characteristics, which are influenced by different vegetation types [21].
Plant roots are considered the primary modifiers of soil macropore structure; they influence macropores both directly by creating biopores and indirectly by re-packing and rearranging soil particles [22]. Compared with climate, soil type, and soil texture, scientists have suggested that vegetation and its root network are the most significant variables that provide first-order control of soil macropore properties [23]. Root development and subsequent root decay are beneficial for soil macropore formation [24]. Furthermore, plant roots can not only overcome soil resistance to form new biological macropores but also expand into existing soil macropores to alter soil pore sizes [25]. Vegetation type affects plant residue and root characteristics, which can cause differences in macropore properties [26]. Studies have confirmed that herbs perform better than woody plants at improving soil hydrological properties [27]. Herbaceous plants and their extensive root systems are often the first to protect barren soil [28]. Due to their rapid growth and wide adaptability, herbs are important for restoring bare slopes and soil erosion [29,30]. The roots of herbs are further divided into two types: taproots and fibrous roots [31]. Fibrous root systems, with their numerous fine roots, spread widely in shallow soil layers [32], while taproot systems, characterized by a thick primary root, penetrate deeply into the soil [33]. The root length density, root mass density, and root diameter of plant roots of the two morphologies mentioned above were used to quantify the effects on Ks and soil erosion [10,34]. The root architecture of herbaceous plants is also closely related to soil macropore characteristics [35] and affects Ks of soil [36]. Hu et al. (2019) applied X-ray CT to study the relationships among soil macropores, plant root architecture, and the hydrological characteristics of alpine meadows [24], and they reported that Ks and soil macropores changed with root architecture. The soil macropores and hydraulic conductivity change greatly with various stages of herbaceous plant growth [10].
The above studies have contributed greatly to the understanding of the effect of vegetation on soil macropores and hydraulic conductivity. However, few studies have been focused on herbaceous plants with different types of roots and the related response in soil macropore structure in explaining changes in soil hydraulic conductivity. In this study, two different types of grasses, MS and CD, were selected as representative taproot and fibrous root plants, respectively, which are also typical soil and water conserving herbs. The aim of this study was (1) to quantify temporal variations in the macropore characteristics of soils with herbs with taproots and fibrous roots using X-CT and (2) to analyze the dynamic response in Ks of soils with the two herbs and its correlation to macropore characteristics. The results of this study advance the current understanding of the mechanisms by which herbaceous root systems influence soil macropores and hydraulic conductivity, elucidating the benefits of using herbaceous plants for soil and water conservation and allowing for the optimization of vegetation restoration measures.

2. Materials and Methods

2.1. Experimental Setup

A vegetation soil column experiment was conducted from April 2021 to November 2022 (8 months). The experimental soil was collected from grasslands in northeastern Chengdu, China. The local soil is classified as an Anthrosol according to the World Reference Base (WRB) system. The soil texture is classified as loamy according to the USDA classification, with 33.16% sand, 41.51% silt, and 25.33% clay. The average soil organic matter content was 10.4 g·kg−1. After removing roots and stones, the soil was passed through a sieve for the experiments. To avoid the potential impact of soil fauna on soil macropores and focus on the effect of vegetation, the experiment was performed in a trough 50 cm deep × 100 cm wide × 200 cm long. Soil that passed through a 5 mm sieve was filled into the trough and compacted in layers with a bulk density of approximately 1.2 g·cm−3. After the soil was filled the trough, PVC pipes with a diameter of 11 cm were used to form soil columns. These PVC pipes were made up of upper and lower sections of 5 cm each. The two sections were joined together to form a 10 cm high cylinder, which was fixed in the middle with tape. A PVC pipe was pressed into the soil until its top was aligned with the soil surface. Then, CD and MS were sown at a density of 15 g·m−2. Water was supplied every 3 to 5 days to maintain soil moisture at 80% of field capacity, and weekly weeding was conducted to reduce weed competition [37].

2.2. Soil Samples

Medicago sativa L. (MS) and Cynodon dactylon (CD) exhibit two phases of rapid root growth, the meristematic phase (2–3 months after sowing) and the fruiting phase (4–5 months after sowing), before stabilizing [38]. Therefore, after sowing in April, soil columns were sampled for CT scanning and infiltration experiments at three different stages: July, September, and November, corresponding to 3, 5, and 7 months after sowing, respectively. During each sampling, five soil columns were collected for each plant for CT scanning and to quantify soil macropore characteristics. Grass stems in the soil columns were cut prior to sampling. These soil columns were sealed with plastic wrap and sent to Sichuan Friendship Hospital for CT scanning immediately after collection (Figure 1). During transportation, foam boards were used to secure the soil columns to prevent shaking and damage to the soil structure during transportation. In total, 35 soil columns were used for CT scanning, including 30 soil columns for the two types of grass samples and 5 control soil columns without grass. These soil columns were used for saturated hydraulic conductivity (Ks) determination after CT scanning together with the other samples.

2.3. X-ray CT Scanning of Soil Samples, Image Processing, and Analysis

All the soil samples were CT scanned using a GE Light-Speed VCT 64 Slice medical CT scanner (Sichuan Friendship Hospital, Chengdu, Sichuan). The X-ray scans were carried out at a voltage of 120 kV and a current of 120 mA. The exposure time was 1 s, and the slice thickness was 0.625 mm. The field of view was set to 135.48 × 135.48 mm with a matrix size of 512 × 512 pixels, which gave 16-bit DICOM images with a 0.265 mm resolution [10]. Approximately 80 continuous cross-section image slices were obtained for the upper and lower layers of each soil column. Then, the DICOM images were converted into Tagged image file format (TIFF) files.
The scanned images were further analyzed using the software program ImageJ 1.52a, which is a digital image processing program developed by the National Institute of Health [11]. The “clear outside” tool in ImageJ was applied to obtain the region of interest (ROI) with a diameter and height of 85.05 mm to avoid any potential artifacts from the PVC wall and the uneven top and bottom of the soil column. After converting 16-bit images to 8-bit images, a median filter was used to minimize noise for thresholding (Figure 1) [39]. Based on the principle that background pixels are different from foreground pixels, image segmentation is the most important step in processing. In this study, the images were segmented using global thresholding based on the intensity histogram of the entire sample as described by reference [40]. The threshold was determined by visual inspection and the “Try All” option in the automatic local threshold plug-in [41]. An artificial pore of known diameter was also used to set the threshold for image segmentation, similar to the approach used by Budhathoki et al. (2022) [14]. After segmentation, the pore voxels were made isotropic, and the pore networks were reconstructed for further three-dimensional analysis. Due to resolution limitations and partial volume effects, all pores with diameters of more than 0.7 mm were identified as macropores [11]. The grass roots appear as macropores from the scanned image interpretation.
The macropore volume and surface area could be obtained from the 3D Objects counter and Analyze Particles Tool. The Bone-J plugin of ImageJ was used to obtain the mean diameter of the macropores and the fractal dimension. Based on these results, the macropore properties of soil in columns with the two grasses were calculated in different growth stages. The macropore indicators included the macroporosity (MP), the macroporosity of the limiting layer (MPLL), the mean diameter of a macropore (MD), the hydraulic radius (HD), global connectivity (Γ), and the fractal dimension (FD). MP represents the overall macropore volume within the sample. MPLL was defined as the minimum macroporosity value along the ROI depth. MD refers to the average diameter of macropores. HD was calculated as the ratio of macroporous volume to macroporous surface area [42]. Γ represents the probability that two pores are part of the same network, with Γ = 1 indicating complete connectivity and Γ ≈ 0 indicating scattered, unconnected pores. FD calculated with the BoneJ plugin in ImageJ reflects soil pore size and the irregularity of interfaces between pores and particles [43]. The specific statistics and calculation methods for these porosity indices were presented in Wang et al. (2024) [10].

2.4. Measure of Saturated Hydraulic Conductivity

The saturated hydraulic conductivity, Ks, was determined using the constant head method, in which the soil Ks is determined while a constant head is maintained at the inlet end during the measurement process [44]. To investigate the effect of grass roots on Ks at different depths, the 10 cm PVC soil columns were cut in the middle with a thin blade and divided into upper and lower layers 5 cm in height. The bottom of each half of the soil columns was covered with an 11 cm diameter permeable ring cover to prevent the soil from falling out. The separated 5 cm high soil columns were soaked in distilled water for 12 h until the soil was saturated [45]. During the soaking process, the water depth was 5 cm, and both the water level and the soil column were kept level. An empty PVC cylinder of the same size was then placed on top of the saturated soil column. The contact interface between the two cylinders was sealed with cellophane tape and Vaseline to prevent water leakage at the edges during infiltration. The assembled double PVC pipe was fixed on an iron frame, and the ring edge was kept horizontal. A funnel and beaker were placed under the soil to collect the water percolating the soil. During the infiltration process, a constant head of 5 cm was maintained in the empty PVC pipe above. A timer was started when the first drop of water fell below the funnel. The beaker under the funnel was replaced every 2, 3, and 5 min according to the rate of water outflow [46], and the corresponding water flowing out was measured. The amount of water flowing into the beaker was measured until the amount of water flowing out per unit time was the same. Water was added to maintain the water layer thickness at 5 cm during the experiment, and the water temperature during infiltration was measured by a thermometer. The saturated hydraulic conductivity (Ks) at a given water temperature equal to t (°C) was calculated according to the following equation:
K s = Q × L S × t × h
where Ks is the saturated hydraulic conductivity (mm/min), Q is the water outflow volume (mL), t is the water outflow time (min), S is the cross-sectional area of the soil column (cm2), L is the height of the column (mm), and h is the head at the inlet end (mm). Finally, the Ks of the soil at different temperatures was converted into the hydraulic conductivity at 10 °C using the following formula. An increase in temperature lowers the viscosity of water, which affects its flow in the soil and consequently impacts the saturated hydraulic conductivity [47].
K 10 = K s 0.7 + 0.03 t
where K10 is the Ks value (mm/min) at a temperature of 10 °C, Ks is the K10 value (mm/min) at t, and t is the water temperature at the time of measurement (°C) [48].

2.5. Statistical Analysis

Statistical analyses were completed using the software package IBM SPSS 27 Statistics for Windows version 20.0, and graphs were prepared in Origin 2023. One-way analysis of variance (ANOVA) and the least significant difference (LSD) test were used to assess significant differences in the macropore characteristics and Ks among the different stages at the p = 0.05 level. The results are reported at the p < 0.05 and p < 0.01 levels of significance. Spearman rank correlation analyses were performed to test for correlations between the macropore characteristics and Ks. Regression analyses were conducted to establish the relationship between Ks and selected macropore characteristics.

3. Results

3.1. Soil Macropore Characteristics in Columns with the Two Plants

3.1.1. Macropore Indices in the Soil Columns with the Two Plants at Different Stages

Table 1 shows the soil pore indices for the different stages. All the macropore indices for Cynodon dactylon (CD) and Medicago sativa L. (MS) showed an obvious upward trend. Except for the hydraulic radius, which generally remained constant during the experimental period, most of the pore indicators exhibited a slight increase during the initial growth phase and a significant increase in the subsequent growth stage for both grasses. Compared with no-grass treatment, the macroporosity, the macroporosity of the limiting layer, and the global connectivity of the CD vegetation increased by 75.77%, 94.20%, and 62.96%, respectively, in November. However, the above three indicators increased by only 8%, 33.3%, and 20%, respectively, in July. The macroporosity and fractal dimension of MS also showed greater increases in the late growth stage than in the early growth stage. In November, the two pore indices for the MS treatment increased by 81.79% and 36.80%, respectively, compared to those of the no-grass treatment. In July, they only increased by 21.43% and 10.43%, respectively. However, some of the soil macropore indices (the macroporosity of the limiting layer, macropore diameter, and global connectivity) for MS exhibited a significant increase until September but then decreased in November.

3.1.2. Comparison of Macropore Indices of the Upper and Lower Layers

Table 2 shows the soil macropore indices of the two herbs and two different soil layers from July to December. Most of the indices for the two herbs followed the order MS > CD for both soil layers. The macropore indices that differed most between the two herbs in the upper soil layers were global connectivity and the macroporosity of the limiting layer, which were 2.45 and 2.28 times greater for MS than for CD, respectively. In the lower layer, the two macropore indices mentioned above were also the most different and were 1.94 times and 2.76 times greater in MS than in CD. For the same herb, these macropore indices were also relatively greater in the top layer (0–50 mm) than in the lower layer (50–100 mm). The average values of the macropore indices in the upper layers of CD and MS were 1.33 and 1.41 times greater than those in the lower layer, respectively. This was especially the case for the macroporosity (p = 0.03) and macropore diameter (p = 0.003) of MS, which were significantly different between the top and lower layers. The average variation coefficients (CV) of the different soil macropore indices were also greater in the top layer than in the lower layer for CD. However, the average CV for the MS in the top layer (40.38%) was lower than that in the lower layer (51.76%). Notably, both the hydraulic radius and the fractional dimension indices showed little difference between the two soil layers or between the two herbs. The variation coefficients of the two indices are also low and were less than 30% in most cases.

3.1.3. Variation in Number of Macropores with Depth

The number of macropores in soil with herbs generally decreased with depth in the ROI for all the soil samples (Figure 2). Overall, the macropore number in the CD treatment was 1.32 times greater than that in MS, as evidenced by the fact that the macropore number in the top layer of CD was 1.38 times greater than that in MS; however, the macropore number in the lower layer of the columns with the two herbs did not substantially differ. For CD, the number of soil macropores in the top layer of the soil column was obviously greater than that in the lower layer of the soil column. In a comparison of the average macropore number in the three growth periods, the macropore number in the top layer was 2.09 times greater than that in the lower layer. Moreover, the macropore number in CD gradually increased with growing time, and the macropore number in November was 1.72 and 3.73 times greater than that in September and July, respectively. In September and July, the macropore numbers in the upper layer of MS were 3.38 and 2.85 times greater than that in the lower layer, respectively. In November, however, the difference in macropore density between the upper and lower layers of MS gradually decreased, and the distribution became more homogeneous.

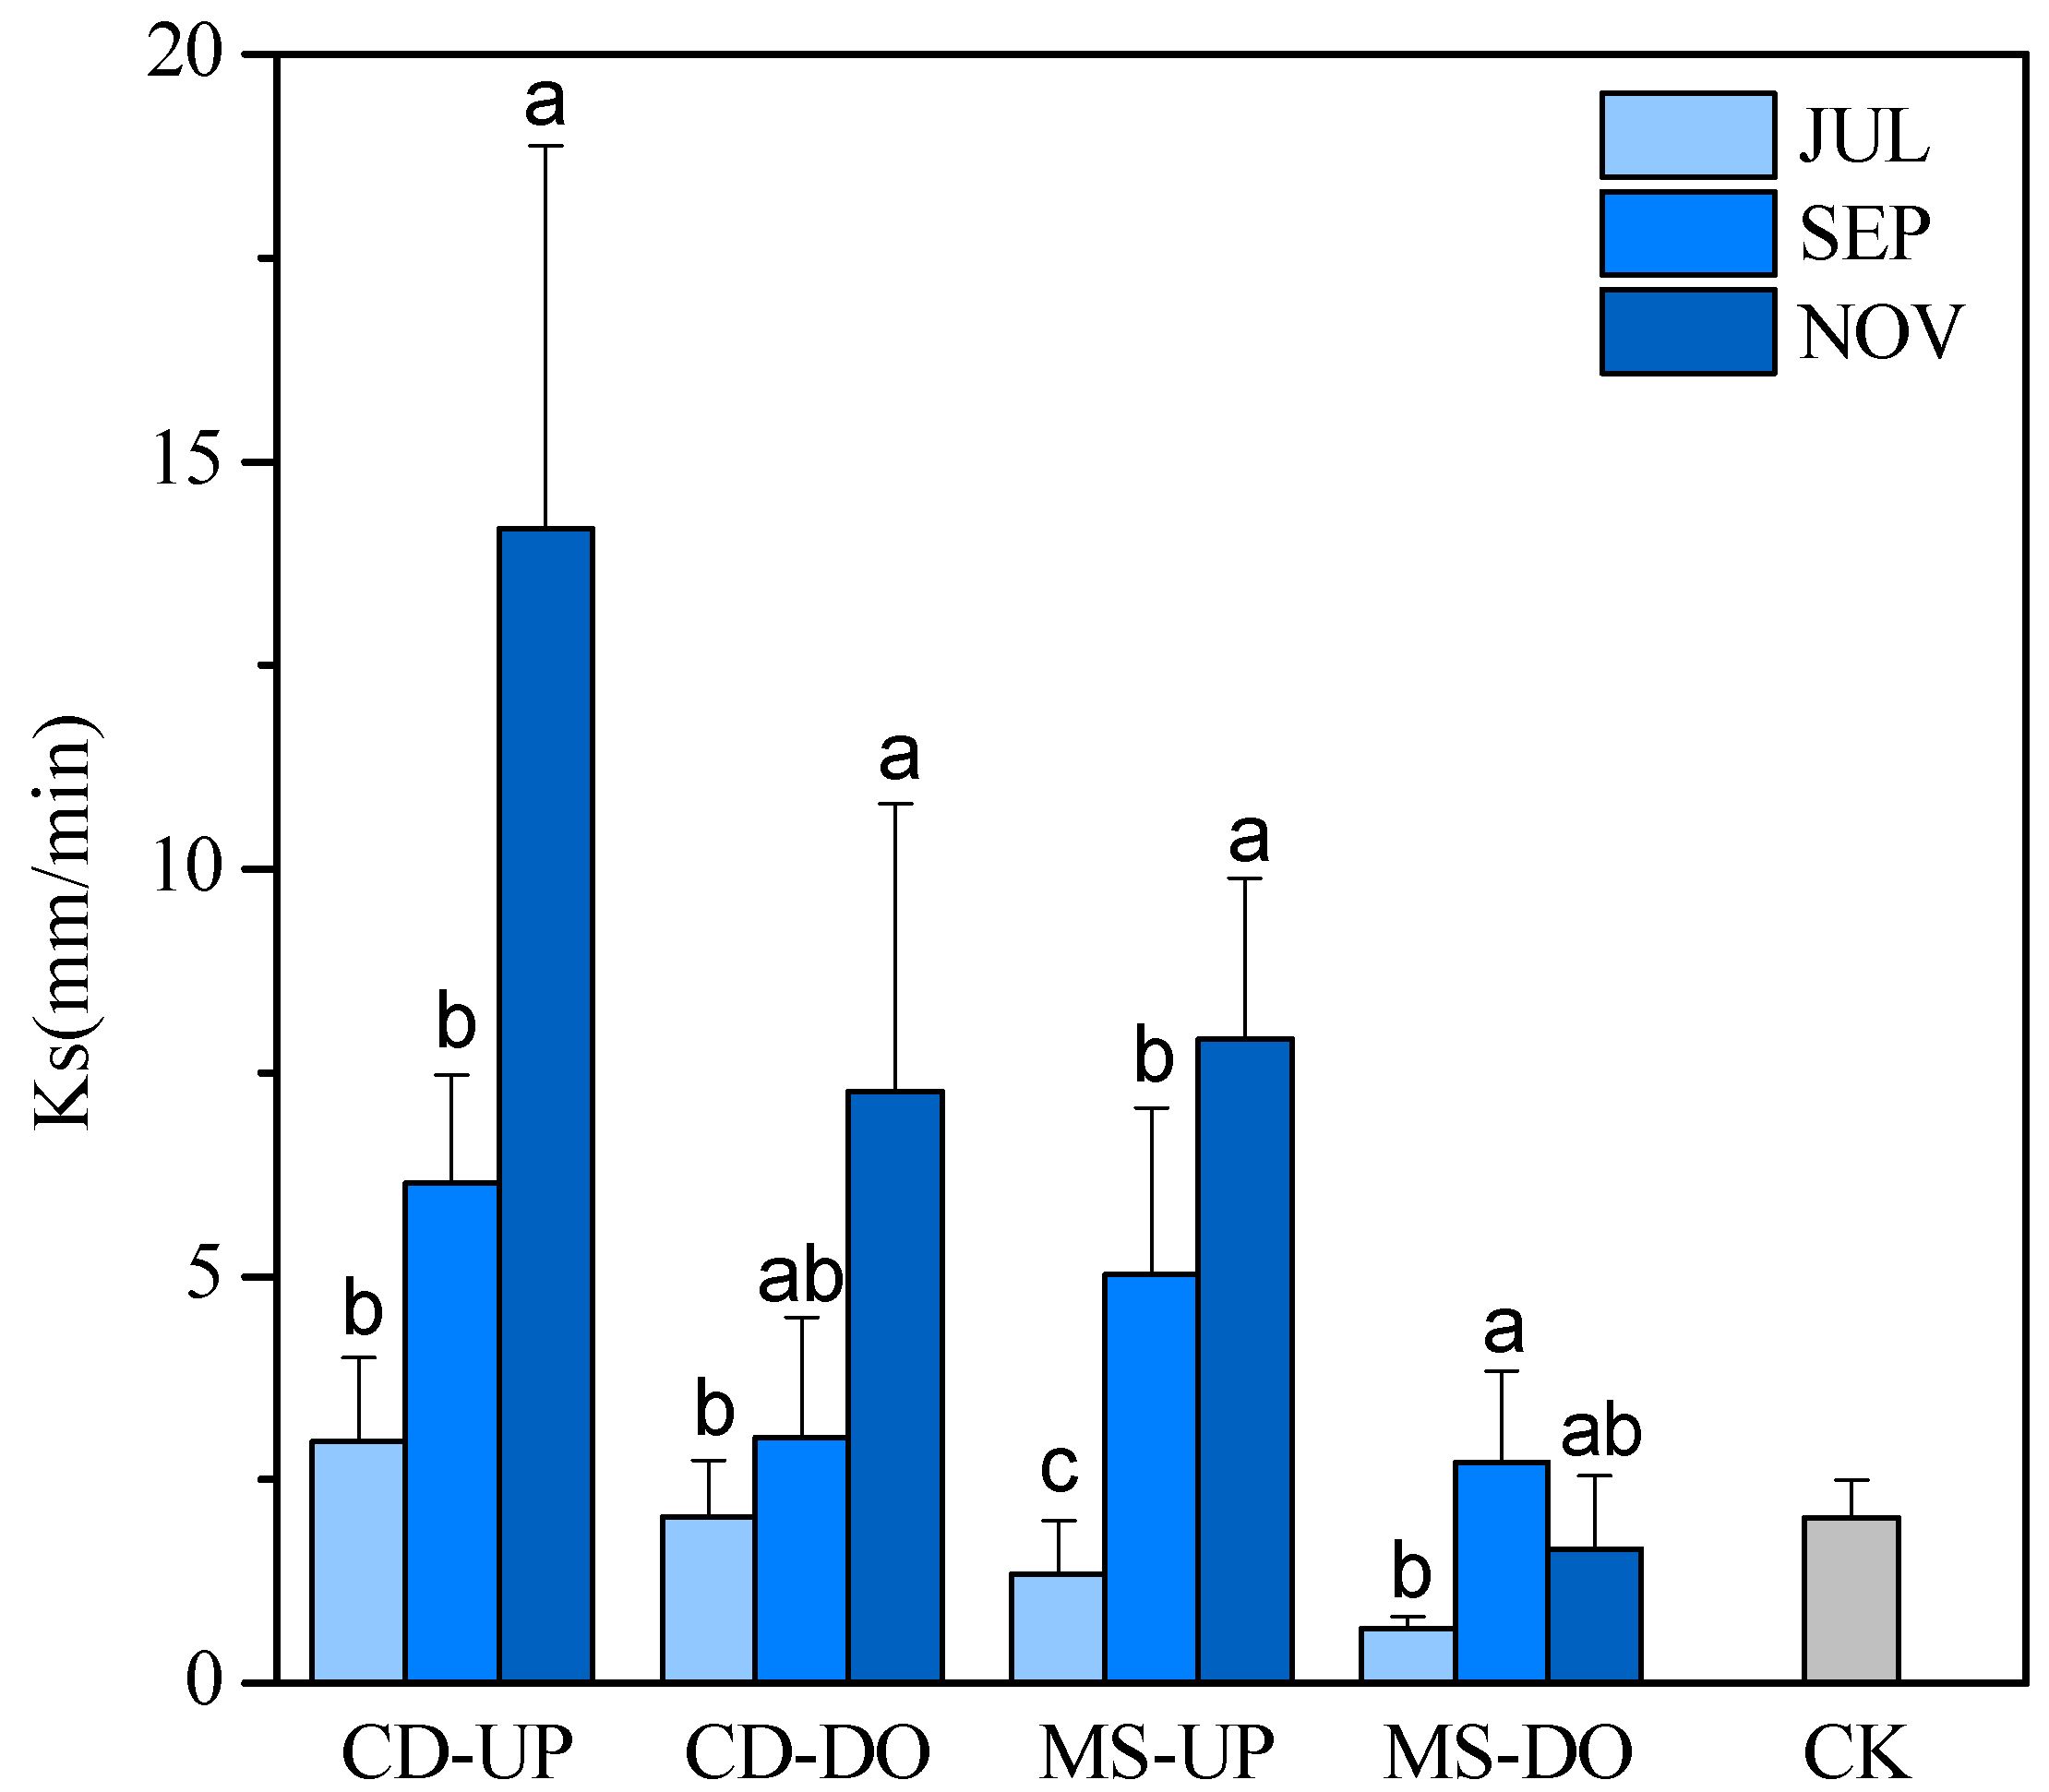
3.2. Trends in Saturated Hydraulic Conductivity (Ks)

The variations in the saturated hydraulic conductivity (Ks) of the soil columns with the two herbs over time are shown in Figure 3. Overall, the Ks of both the upper and lower layers of the CD and MS treatments was greater than that of the no-grass treatment, except for the hydraulic conductivity of the lower layer of MS in July, which was lower than that of the no-grass treatment. Further analysis revealed that the average Ks of the top layer was 1.81 and 2.89 times greater than that of the lower layer for CD and MS, respectively. In both the top and lower layers, the average values of Ks of the soil with the two herbs were CD > MS. In the top layer, there was a significant difference in Ks between soils with the two herbs in July (p = 0.03). In the lower layer of soil with the two herbs, a significant difference in Ks was also detected in July (p = 0.004) and in November (p = 0.041).
Except in the lower layer of MS, the Ks of the soil with the two herbs increased with increasing growing time. Compared with that in July, the mean Ks of CD and MS in the top layer increased by 79.05% and 82.93%, respectively, in November. Similarly, the mean Ks in CD in the lower layer increased by 71.80% in November compared to that in July. For the top layer, further analysis revealed that there was a significant difference in the mean value of Ks for the same herb at the 0.05% level among the three growing seasons. Significant differences in CD (p = 0.01) and MS (p = 0.001) were observed among the three growing seasons. In the lower layer, the Ks in CD in November was significantly greater than that in the other two seasons (p = 0.047). The Ks in MS in the lower layer first increased in September and then decreased in November. There were significant differences in the mean values in the three periods (p = 0.016).

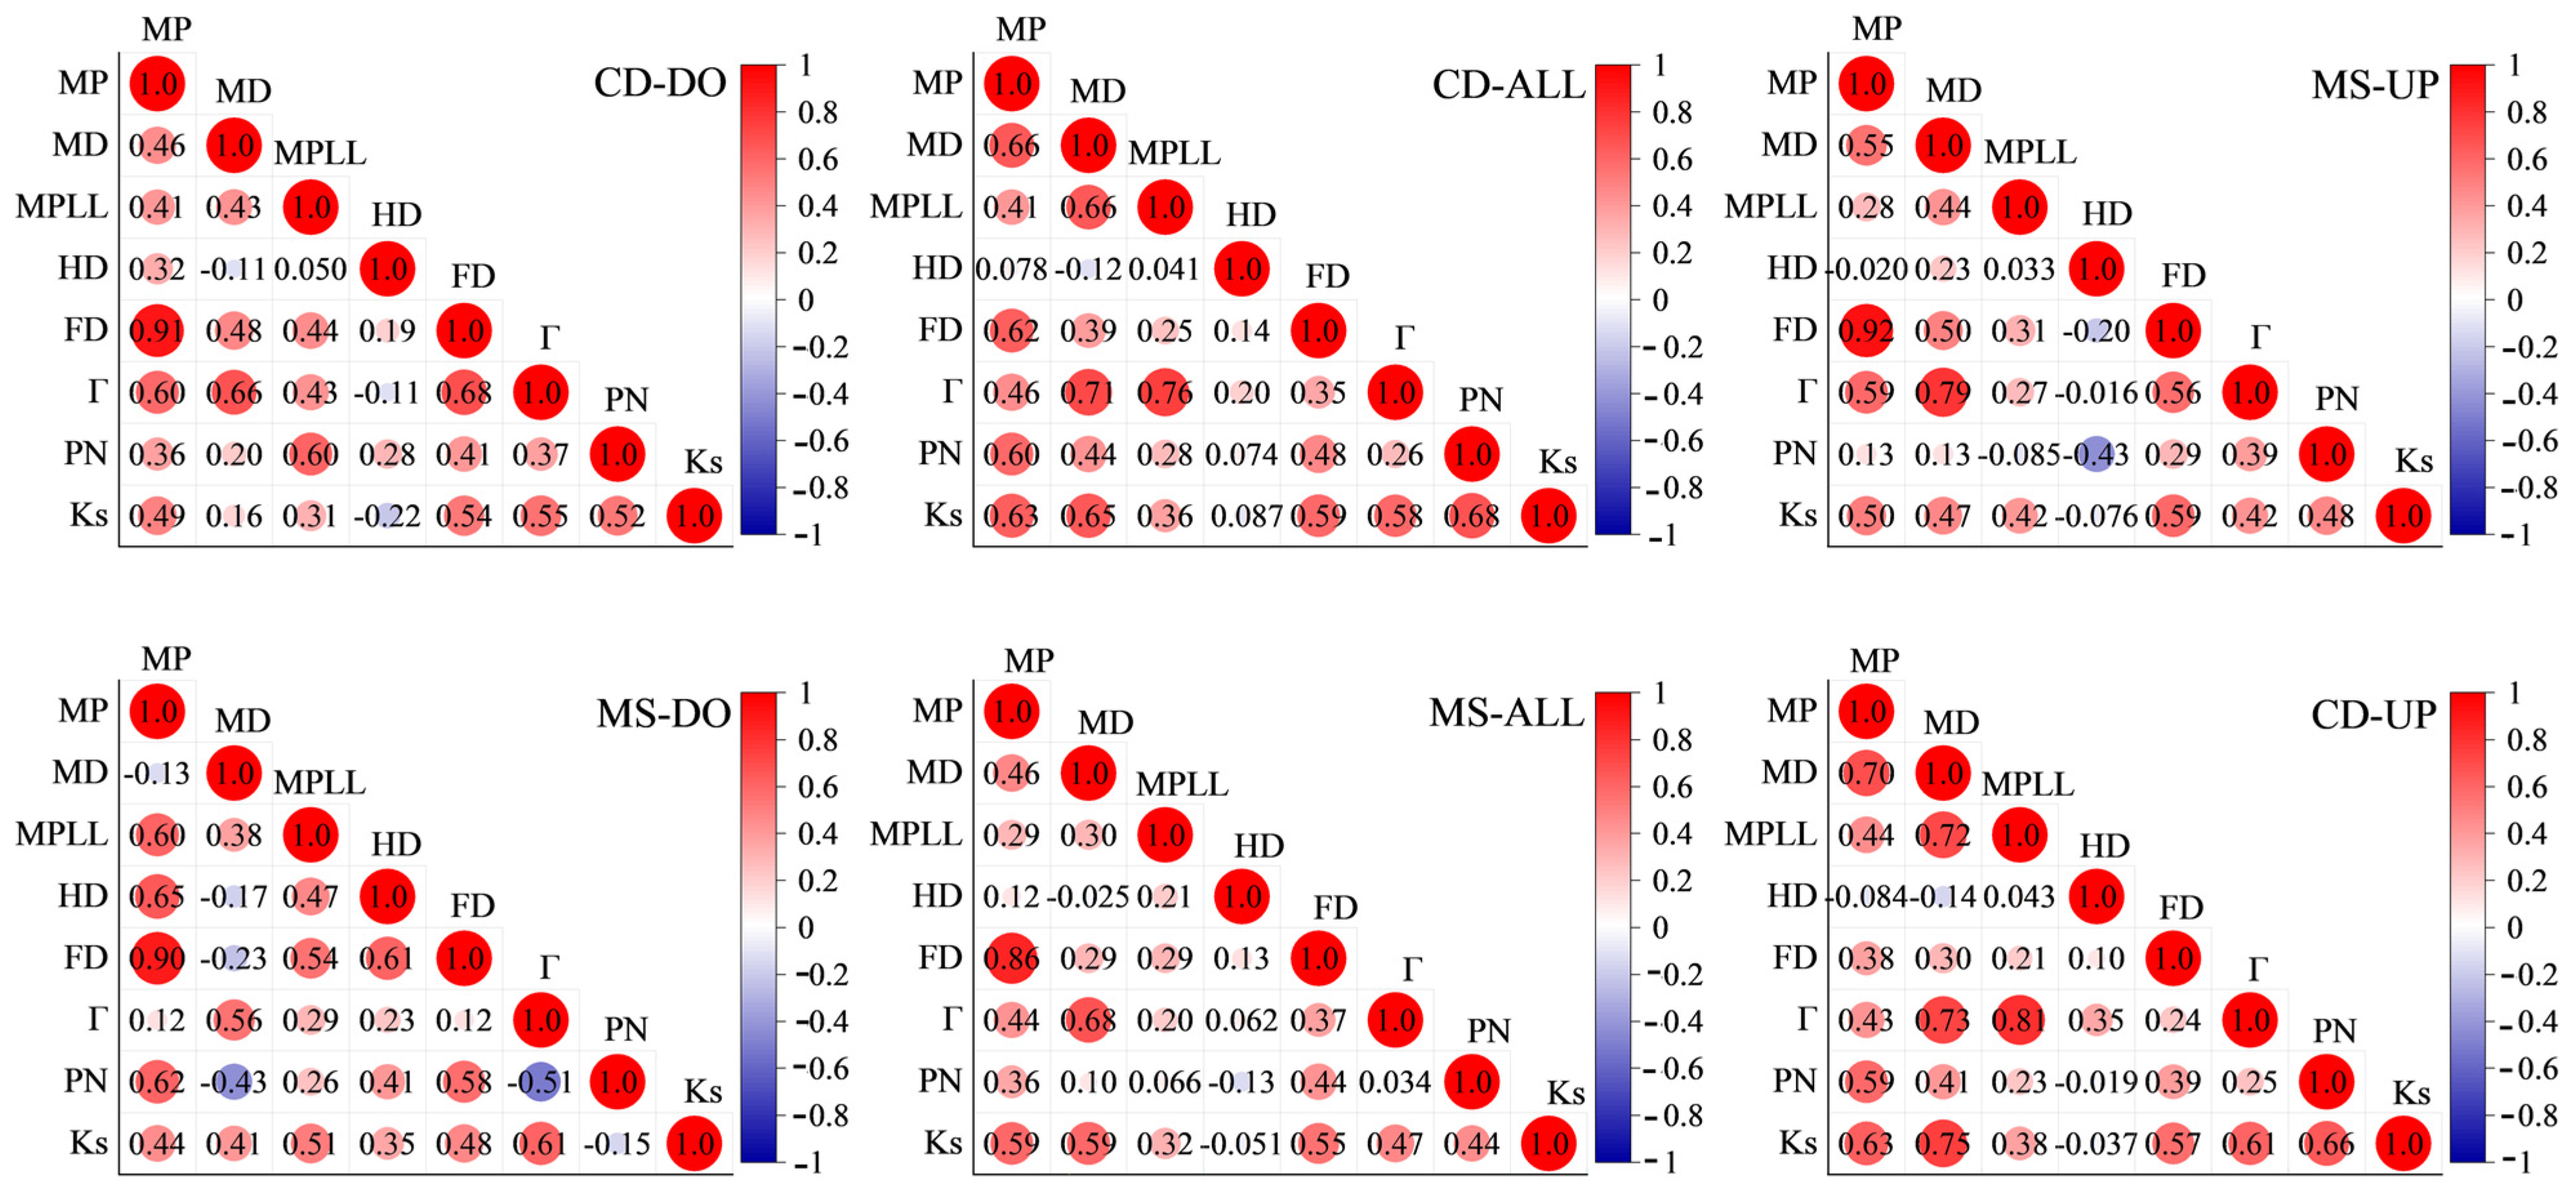
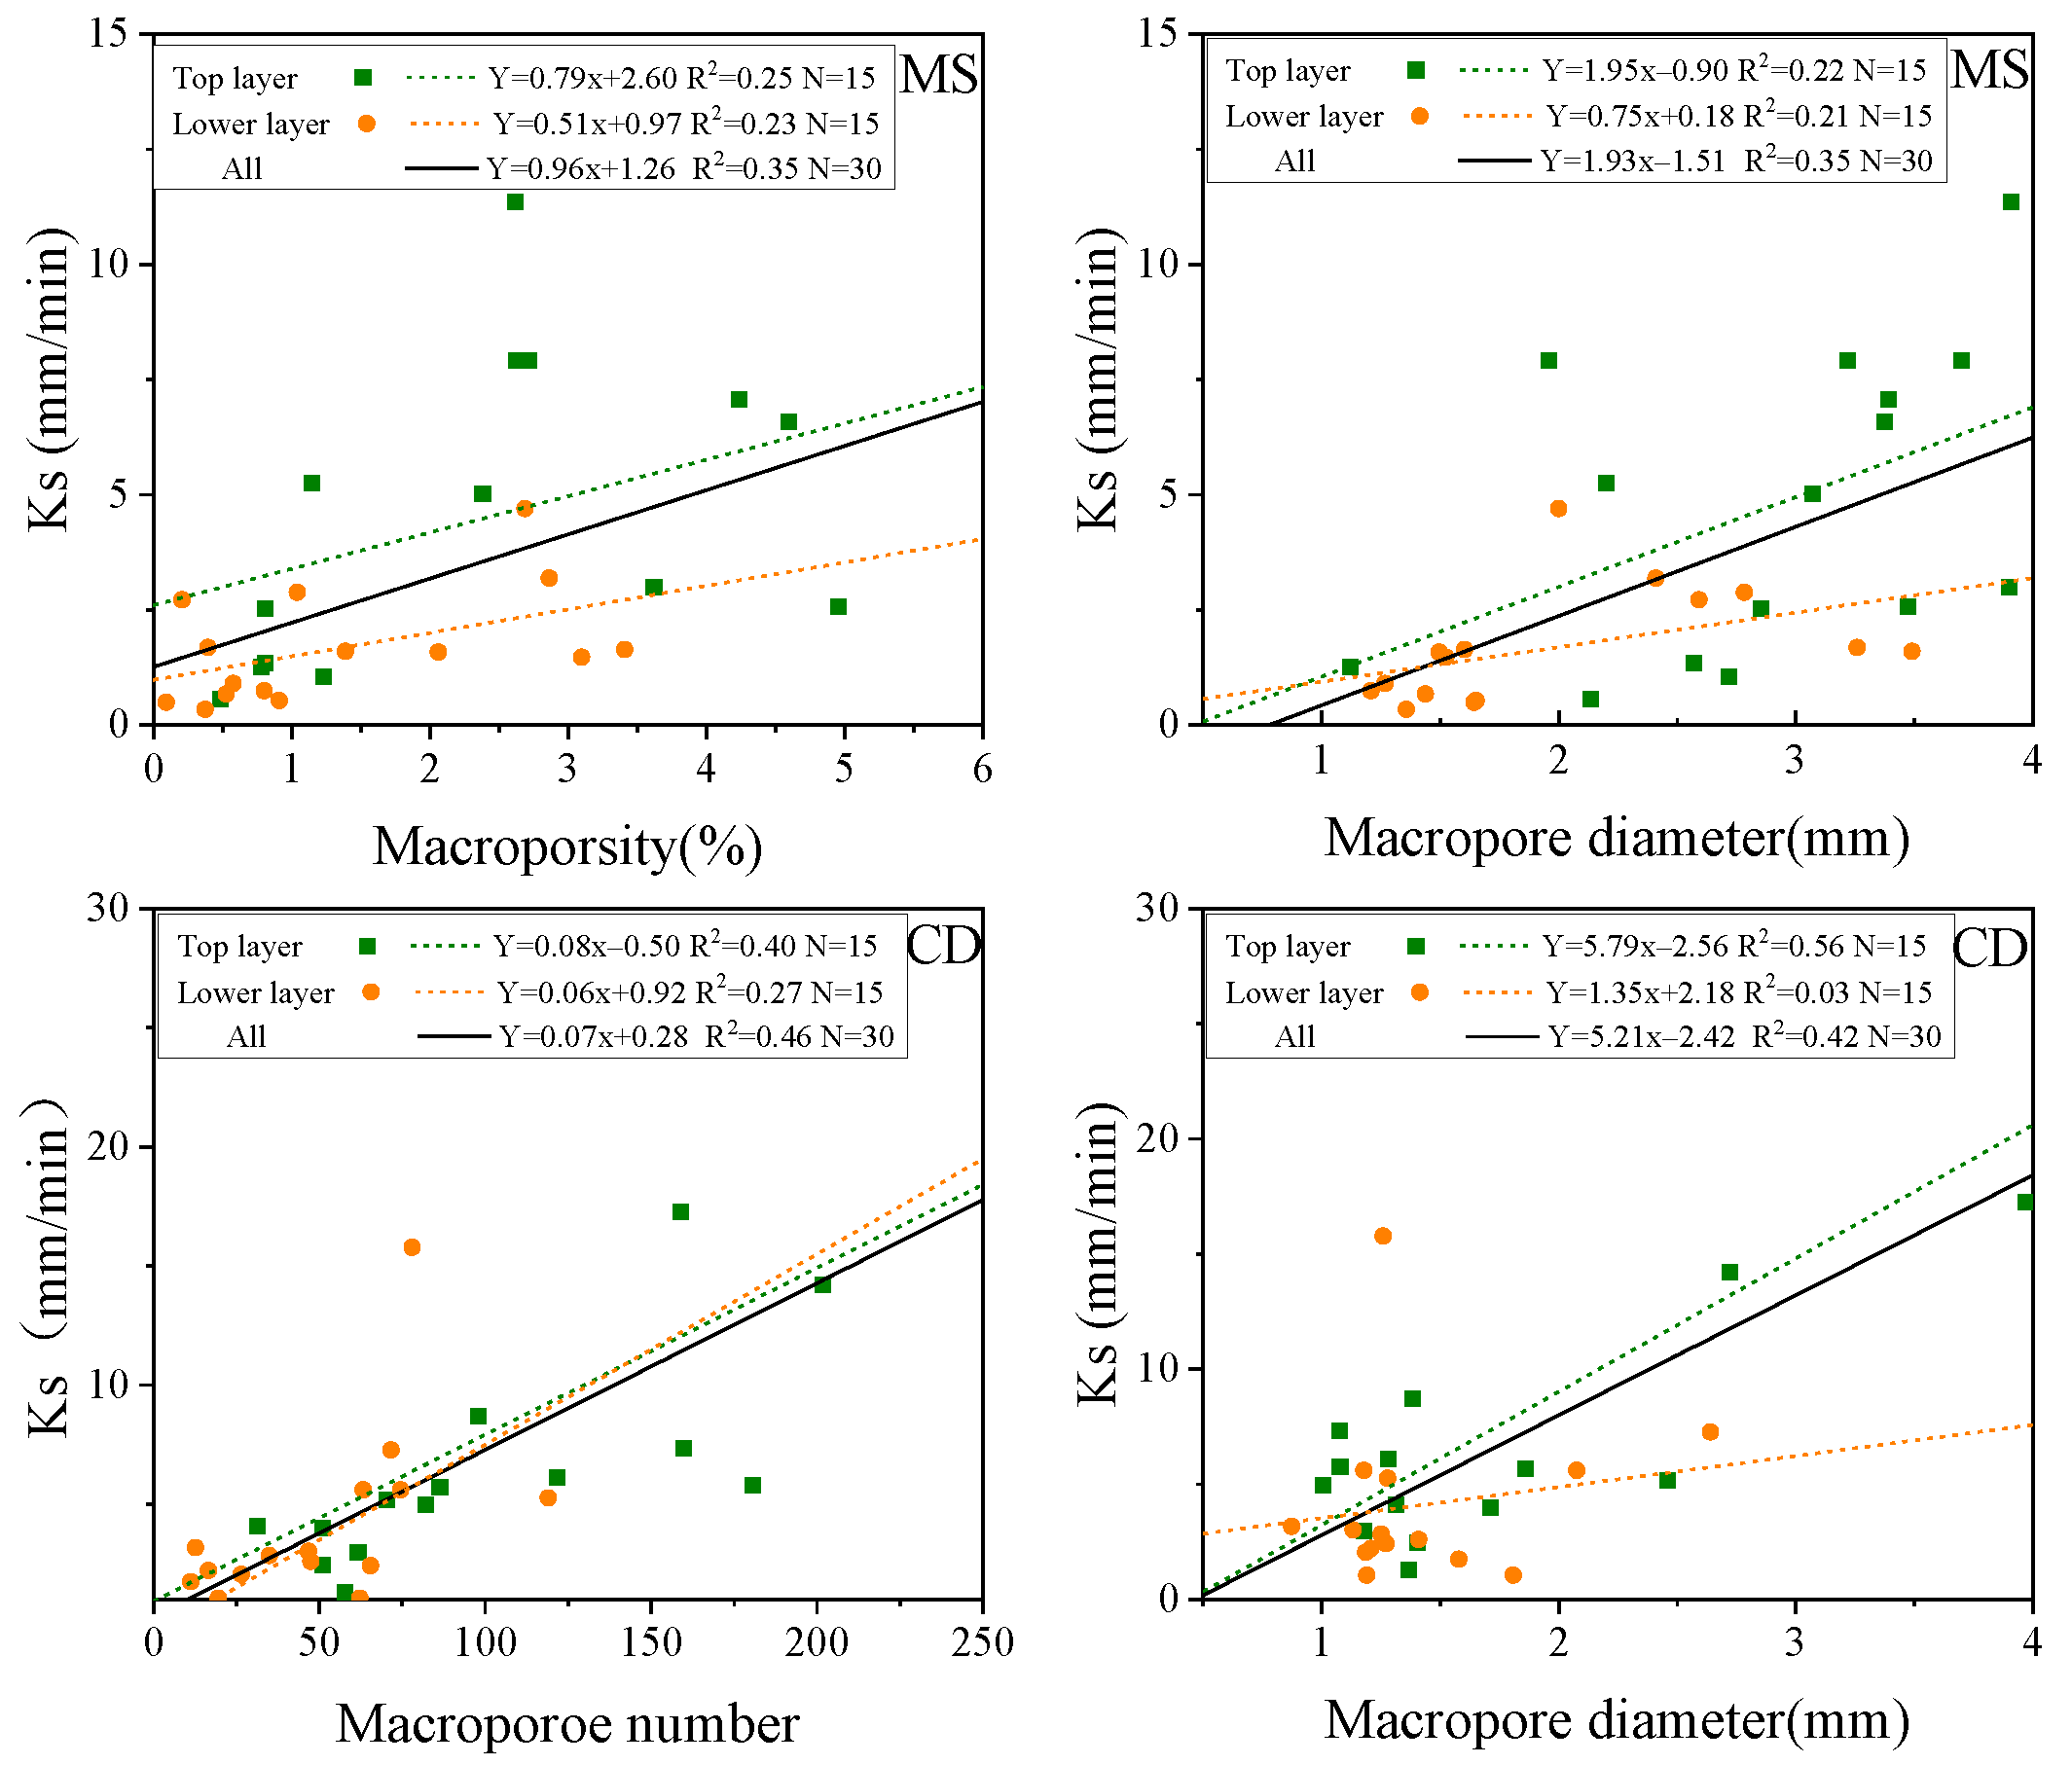
3.3. Relationships between Macropore Indexes and Saturated Hydraulic Conductivity

In this analysis, the Pearson correlations between seven CT-measured macropore parameters (macroporosity, macropore diameter, hydraulic conductivity, macroporosity of the limiting layer, global connectivity, fractal dimension, and macropore number) of the soil in the columns and Ks were analyzed (Figure 4). For CD, all macropore characteristics except the hydraulic radius were positively correlated with Ks. The two indices that most strongly correlated with Ks were the macropore number (r = 0.68) and macropore diameter (r = 0.65) for CD. In addition to hydraulic radius, all macropore characteristics were positively correlated with Ks in MS. Macropore diameter (r = 0.58) and macroporosity (r = 0.58) had the strongest correlations with Ks.
Based on the above pore indexes that had the strongest correlations with Ks, further regression analysis was carried out, and linear fit equations were established (Figure 5). According to the R2 in Figure 5, most of the variability in Ks in the CD treatment was explained by the macropore number, at 46%, and macropore diameter ranked second, accounting for 42% of the variation. Further analysis revealed that the macropore number in the upper layer explained 40% of the variation in Ks; however, the macropore number in the lower soil layer explained only 27%. The difference between the Ks of the upper and lower soil layers explained by the CD macropore diameter was even greater at 53%.
When the macropore number was combined with macropore diameter and global connectivity, the prediction was more accurate for CD, explaining 61% and 63%, respectively, of the variation in Ks (Table 3). For MS, macropore diameter and macroporosity could better explain the Ks when they were combined into a single variable, and both R2 values were 0.35 (Figure 5). A discrepancy between the upper and lower layers was not obvious. The macropore diameter combined with macroporosity and fractal dimension explained 48% and 52%, respectively, of the variation in Ks in MS.

4. Discussion

4.1. The Response of Soil Macropores to the Growth of the Two Plant Species

This study found that the soil macropore characteristics of herbaceous plants were superior to those of soil with non-grass, confirming that herb roots extend through soil, creating more macropores [49,50]. This reflected the importance of herbaceous plants in maintaining the health and stability of soil ecosystems. Since the fibrous root and herbaceous taproot differ in terms of root morphological characteristics and developmental processes, then the differences in root architecture among herbaceous species would influence macropore formation [26]. In this study, the number of macropores in CD was obviously greater than that in MS, probably because plants with fibrous roots have a dense, fine mesh structure that penetrates deep into the soil, both increasing root contact area with the soil and creating more soil pores [51]. Nevertheless, the soil macropore diameter of MS, which has coarse roots and taproots, was 1.51 times greater than that of CD, suggesting that root diameter is an important root-induced pore formation trait [52]. The results also confirmed the lower rooting densities of coarsely rooted species, which nonetheless had a high impact on the macropore range [53]. Furthermore, coarse roots are beneficial for increasing soil macroporosity [54] and global connectivity, as taproots tend to penetrate deeper into soils [55]. Therefore, the macroporosity of the limiting layer, microporosity, and global connectivity in MS were 2.52, 1.29, and 2.20 times greater than those in CD due to the vigorous and deeply rooted system of MS. In summary, our results suggest that the fibrous root is more efficient in increasing the number of soil macropores, while the taproot could produce larger macropores and increase the macroporosity. This is consistent with previous research that measured soil pores by different methods [53,56,57]. Furthermore, the higher macropore diameter of the MS (Table 1) seems to support the hypothesis of Chen et al. (2021) [56] that a coarse taproot can produce large biopores (>2 mm).
In addition to the above differences, we also found that the soil macropore indices for the two treatments showed different dynamics and vertical distributions. In terms of seasonal variation, most of the macropore indexes for the CD continuously increased during the experiment duration, while some of the MS indexes increased from April to September, but kept stable or decreased in the next stage (Table 1). This is mainly due to the fact that the root characteristics of the MS would reach a stable state after about 5 months [58]. Regarding vertical hierarchical differences in the soil column, it has been reported that plant roots are often concentrated in the topsoil and that the total root density decreases with increasing soil depth [59]. As a consequence, except for the hydraulic radius, the macropore indicators of the upper soil layer were generally more effective compared to the lower soil layer for the same herbs. In particular, in CD, the number of macropores in the upper soil layer was much greater than that in the lower soil layer in this study (Figure 2). These results are in agreement with those of Katuwal et al. (2015) [60], who reported that the number of macropores was significantly greater in the top 4 cm. This was also related to the fact that dense fine roots are usually present in the top 5 cm of soil [61]. The coarsely rooted and taproot species were more effective at alleviating soil compaction in deep soils [62] and had a greater effect on macropore formation in deep soil layers [26]. As a result, the roots of MS gradually penetrated into the soil subsurface, which resulted in a relatively even vertical distribution of soil macropores in November (Figure 2). The above results imply that the effect of grass root in changing soil structure is mainly reflected within the surface layer of the soil. This was especially in the case of the fibrous roots that showed a greater concentration in topsoil layer than that of the taproot. It should be noted that the depth of the soil columns in this study may have limited the space for root growth. In future research, deeper soil columns should be used to show the potential grass root characteristics and vertical hierarchical variation of soil macropore, thus clarifying the effects of fibrous roots and taproot plants on deep soil structure, which can provide a scientific basis for soil conservation and environmental restoration.

4.2. The Mechanism That Determines Soil Hydraulic Conductivity with the Two Plants

The macropore formation induced by plant roots is particularly important for water infiltration and percolation to deeper soil layers due to the different characteristics of these macropores [63]. In this study, the saturated hydraulic conductivity (Ks) of the soil columns with the two herbs was obviously greater than that of the control soil columns (Figure 3). Moreover, the Ks of the columns with the two herbs increased with growing time and was greater in the upper layer than in the lower layer. The temporal dynamic and vertical variation of Ks in the two grass soil columns were similar to the soil macropore property variations discussed in Section 4.1. The extension of the root system and the number of root branches differ between the two herbs [49]. Thus, the soil macropore characteristics of MS and CD differed at different growing stages, leading to variations in soil Ks. This result is consistent with Wang et al. (2024) [10], who reported that soil macropore dynamics would determine the seasonal variation of soil hydraulic conductivity. For the same time stage and soil layer, the CD had a higher Ks than that of the MS (Figure 3). It reflected that the fibrous root system was superior to the taproot system in improving soil infiltration capacity under the conditions of this study. This is consistent with previous research that has reported that fine fibrous roots could improve the soil macropore Ks better than the taproot [56,59,64]. The reduction in Ks in the lower layer of MS in November may be related to large roots compressing and shrinking the porosity of the adjacent soil material. This compression could reduce the soil’s water conductivity in that layer [65]. However, it differs from that of Zhu et al. (2020) [66], who found that the tap roots can increase soil infiltration by increasing the amount of large pore via their decomposition, whereas the fibrous roots decrease soil infiltration by clogging soil pores. This may be because the duration of the experiment in this study is not long enough for coarse roots to decompose. Our result is supported by Chen et al. [56], who reported that the fine roots are more likely to decompose and improve soil hydraulic conductivity, whereas the coarse roots would decompose more slowly, and their effects on soil infiltration cannot be reflected in a short period. It should be noted that the CT scanning technology would extract the undecayed biomass of the taproots as soil macropores, which are likely to block water flow. This may explain why many of the soil macropore indexes for MS are higher than those for CD, but the Ks is relatively low. It implies that the CT-scanned soil macropore index may not always reflect the real soil infiltration capacity [14], and more comparative analyses over a long plant growth period are needed in future research.
The Ks had a positive correlation with all CT-measured macropore parameters except the hydraulic radius (Figure 4). The hydraulic radius showed an insignificant relationship with the Ks. This was mainly due to the small variation in hydraulic radius between the two herbs during the experimental period (Table 1 and Table 2). The macropore parameters that best described the increasing trend in Ks in CD and MS were the number of macropores and macroporosity, respectively. The number of macropores showed the best linear fit with saturated conductivity, which is similar to the results reported in previous works where linear functions have been used to predict soil hydraulic conductivity [10] and improve the water conductivity of soils [51]. Similarly, the Ks in the CD treatment was greater than that in the MS treatment in both soil layers, and the correlation coefficient between Ks and macropore number (r = 0.68) was highest among all the parameters studied (Figure 3). The reason may be that fibrous herbaceous plants have greater root density, which is closely associated with the number of macropores, and the number of macropores was the best parameter for predicting hydraulic conductivity [17]. The coarser larger roots in CD could provide more positive feedback for the development of macropores and increase macroporosity [50,67]. Macroporosity was most closely related to Ks (r = 0.58) in this study in MS, which is consistent with the findings of Wang et al. (2024) [10]. It should be noted that the above correlation between soil macropore index and Ks was greater in the upper soil layer for both herbs than in the lower layer (Figure 5). This may reflect the fact discussed in Section 4.1 that the effect of grass roots in changing soil structure and macropore is mainly reflected within the topsoil layer. This result would help to determine the critical soil depth and guide the design of the grass conservation measure to protect the surface soil.

5. Conclusions

In this study, we performed long-term soil column experiments and adopted the CT scanning technology to quantify temporal differences in soil macropores and saturated hydraulic conductivity (Ks) in soils with Medicago sativa L. (MS) and Cynodon dactylon (CD), which are herbaceous plants with fibrous roots and taproots, respectively. The results showed that the soil macropore indices and hydraulic conductivity increased over time with grass growth. Nevertheless, these indices differed between soils with the two herbs. According to the CT-scanned soil macropore information, the fibrous root is more efficient in increasing the number of soil macropores, while the taproot could produce larger macropores and increase macroporosity. The effect of grass roots in altering soil macropores and improving infiltration capacity is mainly reflected in the top 5 cm layer of the surface soil. We found that the soil Ks for the finer fibrous roots was greater than for the taproots, for which the undecayed root biomasses may block water flow, although the CT scanning extracted them as soil macropores. For the fibrous root system, the closest relationship was observed between Ks and the number of macropores, followed by that between Ks and macropore diameter. In the case of the taproots system, macroporosity and macropore diameter were found to be most related to Ks. Predictive equations were developed to evaluate the Ks based on the above soil macropore indices.

Author Contributions

Conceptualization, L.C.; methodology, T.Z.; software, Y.T. and T.Z.; validation, H.P.; formal analysis, Y.T.; investigation, Y.T. and H.P.; resources, Y.T.; data curation, T.Z.; writing—original draft preparation, Y.T.; writing—review and editing, L.C. and Y.W.; visualization, Y.T. and H.P.; supervision, L.C.; project administration, L.C.; funding acquisition, L.C. and Y.W. All authors have read and agreed to the published version of the manuscript.

Funding

This research was funded by Natural Science Foundation of Sichuan Province, China, grant number 2024NSFSC0105, and the Fund from the Key Laboratory of Land Resources Evaluation and Monitoring in Southwest (Sichuan Normal University), Ministry of Education, China (TDSYS202310).

Institutional Review Board Statement

Not applicable.

Data Availability Statement

The data that support the findings of this study are available from the corresponding author upon reasonable request.

Acknowledgments

The authors would like to thank Xin Li, Mingming Shi, and Yani Zhang for their assistance with field sampling.

Conflicts of Interest

The authors declare no conflicts of interest.

References

  1. Tsvetnov, E.V.; Makarov, O.A.; Strokov, A.S.; Tsvetnova, O.B. The Role of Soils in Land Degradation Assessment: A Review. Eurasian Soil Sci. 2021, 54, 441–447. [Google Scholar] [CrossRef]
  2. Prats, S.A.; Malvar, M.C.; Coelho, C.O.A.; Wagenbrenner, J.W. Hydrologic and erosion responses to compaction and added surface cover in post-fire logged areas: Isolating splash, interrill and rill erosion. J. Hydrol. 2019, 575, 408–419. [Google Scholar] [CrossRef]
  3. Luo, J.; Zheng, Z.; Li, T.; He, S. Changes in micro-relief during different water erosive stages of purple soil under simulated rainfall. Sci. Rep. 2018, 8, 3483. [Google Scholar] [CrossRef] [PubMed]
  4. Yang, F.; Zhong, Y.; Han, G.; Li, X.; Luo, L.; Cai, X.; Long, X.; Li, T.; Huang, L. Effect of different vegetation restoration on soil organic carbon dynamics and fractions in the Rainy Zone of Western China. J. Environ. Manag. 2023, 331, 117296. [Google Scholar] [CrossRef] [PubMed]
  5. Islam, M.A.; Islam, M.; Elahi, T.E. Effectiveness of vetiver grass on stabilizing hill slopes: A numerical approach. In Geo-Congress 2020; American Society of Civil Engineers: Reston, VA, USA, 2020. [Google Scholar]
  6. Wang, B.; Zhang, G.; Shi, Y.; Li, Z.; Shan, Z. Effects of Near Soil Surface Characteristics on the Soil Detachment Process in a Chronological Series of Vegetation Restoration. Soil Sci. Soc. Am. J. 2015, 79, 1213–1222. [Google Scholar] [CrossRef]
  7. Hao, M.; Zhang, J.; Meng, M.; Chen, H.Y.H.; Guo, X.; Liu, S.; Ye, L. Impacts of changes in vegetation on saturated hydraulic conductivity of soil in subtropical forests. Sci. Rep. 2019, 9, 8372. [Google Scholar] [CrossRef]
  8. Stokes, A.; Douglas, G.B.; Fourcaud, T.; Giadrossich, F.; Gillies, C.; Hubble, T.; Kim, J.H.; Loades, K.W.; Mao, Z.; McIvor, I.R.; et al. Ecological mitigation of hillslope instability: Ten key issues facing researchers and practitioners. Plant Soil 2014, 377, 1–23. [Google Scholar] [CrossRef]
  9. Liu, M.; Cui, W.; Wu, D.; Liao, L.; Du, W. Soil Macropore Structures and their Effect on Preferential Flow. Appl. Mech. Mater. 2014, 522–524, 990–994. [Google Scholar] [CrossRef]
  10. Wang, Y.; Li, Y.; Cao, L.; Qin, X.; Hou, D. Temporal variation in soil macropore properties and hydraulic conductivity in croplands in the dry-hot valley region of Southwest China. J. Soil Sediment. 2024, 24, 1576–1590. [Google Scholar] [CrossRef]
  11. Budhathoki, S.; Lamba, J.; Srivastava, P.; Williams, C.; Arriaga, F.; Karthikeyan, K.G. Impact of land use and tillage practice on soil macropore characteristics inferred from X-ray computed tomography. Catena 2022, 210, 105886. [Google Scholar] [CrossRef]
  12. Yu, X.; Fu, Y.; Lu, S. Characterization of the pore structure and cementing substances of soil aggregates by a combination of synchrotron radiation X-ray micro-computed tomography and scanning electron microscopy. Eur. J. Soil Sci. 2017, 68, 66–79. [Google Scholar] [CrossRef]
  13. Zhang, Z.; Liu, K.; Zhou, H.; Lin, H.; Li, D.; Peng, X. Linking saturated hydraulic conductivity and air permeability to the characteristics of biopores derived from X-ray computed tomography. J. Hydrol. 2019, 571, 1–10. [Google Scholar] [CrossRef]
  14. Budhathoki, S.; Lamba, J.; Srivastava, P.; Malhotra, K.; Way, T.R.; Katuwal, S. Temporal and spatial variability in 3D soil macropore characteristics determined using X-ray computed tomography. J. Soil Sediment. 2022, 22, 1263–1277. [Google Scholar] [CrossRef]
  15. Ju, X.; Jia, Y.; Li, T.; Gao, L.; Gan, M. Morphology and multifractal characteristics of soil pores and their functional implication. Catena 2021, 196, 104822. [Google Scholar] [CrossRef]
  16. Dal Ferro, N.; Sartori, L.; Simonetti, G.; Berti, A.; Morari, F. Soil macro- and microstructure as affected by different tillage systems and their effects on maize root growth. Soil Tillage Res. 2014, 140, 55–65. [Google Scholar] [CrossRef]
  17. Udawatta, R.P.; Anderson, S.H. CT-measured pore characteristics of surface and subsurface soils influenced by agroforestry and grass buffers. Geoderma 2008, 145, 381–389. [Google Scholar] [CrossRef]
  18. Naveed, M.; Moldrup, P.; Arthur, E.; Wildenschild, D.; Eden, M.; Lamandé, M.; Vogel, H.; de Jonge, L.W. Revealing Soil Structure and Functional Macroporosity along a Clay Gradient Using X-ray Computed Tomography. Soil Sci. Soc. Am. J. 2013, 77, 403–411. [Google Scholar] [CrossRef]
  19. Udawatta, R.P.; Anderson, S.H.; Gantzer, C.J.; Garrett, H.E. Agroforestry and Grass Buffer Influence on Macropore Characteristics. Soil Sci. Soc. Am. J. 2006, 70, 1763–1773. [Google Scholar] [CrossRef]
  20. Kim, H.; Anderson, S.H.; Motavalli, P.P.; Gantzer, C.J. Compaction effects on soil macropore geometry and related parameters for an arable field. Geoderma 2010, 160, 244–251. [Google Scholar] [CrossRef]
  21. Ben-Hur, M.; Yolcu, G.; Uysal, H.; Lado, M.; Paz-González, A. Soil structure changes: Aggregate size and soil texture effects on hydraulic conductivity under different saline and sodic conditions. Soil Res. 2009, 47, 688–696. [Google Scholar] [CrossRef]
  22. Gregory, P.J. RUSSELL REVIEW Are plant roots only “in” soil or are they “of” it? Roots, soil formation and function. Eur. J. Soil Sci. 2022, 73, e13219. [Google Scholar] [CrossRef]
  23. Shougrakpam, S.; Sarkar, R.; Dutta, S. An experimental investigation to characterise soil macroporosity under different land use and land covers of northeast India. J. Earth Syst. Sci. 2010, 119, 655–674. [Google Scholar] [CrossRef]
  24. Hu, X.; Li, X.; Wang, P.; Liu, Y.; Wu, X.; Li, Z.; Zhao, Y.; Cheng, Y.; Guo, L.; Lyu, Y.; et al. Influence of exclosure on CT-measured soil macropores and root architecture in a shrub-encroached grassland in northern China. Soil Tillage Res. 2019, 187, 21–30. [Google Scholar] [CrossRef]
  25. Lucas, M.; Nguyen, L.; Guber, A.; Kravchenko, A. Cover crop influence on pore size distribution and biopore dynamics: Enumerating root and soil faunal effects. Front. Plant Sci. 2022, 13, 928569. [Google Scholar] [CrossRef]
  26. Perkons, U.; Kautz, T.; Uteau, D.; Peth, S.; Geier, V.; Thomas, K.; Lütke Holz, K.; Athmann, M.; Pude, R.; Köpke, U. Root-length densities of various annual crops following crops with contrasting root systems. Soil Tillage Res. 2014, 137, 50–57. [Google Scholar] [CrossRef]
  27. Lu, E.; Yang, B.; Liu, W.; Zhu, X. Herbs perform better than woody plants at improving soil hydrological properties in rubber agroforestry systems. Agroforest Syst. 2023, 97, 1391–1404. [Google Scholar] [CrossRef]
  28. Liu, C.; Qiang, F.; Liu, G.; Ai, N.; Gao, R. Characteristics of understory herb communities across time during restoration in coal mine reclamation areas and their coupling with soil properties. Acta Pratacult. Sin. 2022, 31, 61–68. [Google Scholar] [CrossRef]
  29. Federica, G.; Chiara, V.; Rodolfo, G.; Anne, B.; Pierre, C.; Sandra, C.; Chiaradia, E.A. Root Characteristics of Herbaceous Species for Topsoil Stabilization in Restoration Projects. Land. Degrad. Dev. 2017, 28, 2074–2085. [Google Scholar] [CrossRef]
  30. Löbmann, M.T.; Geitner, C.; Wellstein, C.; Zerbe, S. The influence of herbaceous vegetation on slope stability—A review. Earth-Sci. Rev. 2020, 209, 103328. [Google Scholar] [CrossRef]
  31. Qin, M.; Cui, P.; Jiang, Y.; Guo, J.; Zhang, G.; Ramzan, M. Occurrence of shallow landslides triggered by increased hydraulic conductivity due to tree roots. Landslides 2022, 19, 2593–2604. [Google Scholar] [CrossRef]
  32. Chen, F.; Zhang, J.; Zhang, M.; Wang, J. Effect of Cynodon dactylon community on the conservation and reinforcement of riparian shallow soil in the Three Gorges Reservoir area. Ecol. Process 2015, 4, 3. [Google Scholar] [CrossRef]
  33. Huang, Z.; Liu, Y.; Cui, Z.; Fang, Y.; He, H.; Liu, B.; Wu, G. Soil water storage deficit of alfalfa (Medicago sativa) grasslands along ages in arid area (China). Field Crops Res. 2018, 221, 1–6. [Google Scholar] [CrossRef]
  34. Kang, Z.; Lou, G.; Guo, Y.; Xu, P. The anti-erosion potential of taproots and fibrous roots in alluvial loess of north China: A pot experiment. J. Soil Sediment. 2024, 24, 847–862. [Google Scholar] [CrossRef]
  35. Bacq-Labreuil, A.; Crawford, J.; Mooney, S.J.; Neal, A.L.; Ritz, K. Cover crop species have contrasting influence upon soil structural genesis and microbial community phenotype. Sci. Rep-Uk 2019, 9, 7473. [Google Scholar] [CrossRef]
  36. Zhu, P.; Zhang, G.; Zhang, B. Soil saturated hydraulic conductivity of typical revegetated plants on steep gully slopes of Chinese Loess Plateau. Geoderma 2022, 412, 115717. [Google Scholar] [CrossRef]
  37. Zhang, J.; Ran, Y.; Ma, D.; Chen, L.; Wu, Y.; Huang, P. Dynamic Characteristics of Cynodon Dactylon Root Growth and Its Influence on Soil Pore Evolution. Acta Pedol. Sin. 2024, in press. [Google Scholar]
  38. Li, J.; He, B.; Chen, Y.; Huang, R.; Tao, J.; Tian, T. Root distribution features of typical herb plants for slope protection and their effects on soil shear strength. Nongye Gongcheng Xuebao/Trans. Chin. Soc. Agric. Eng. 2013, 29, 144–152. [Google Scholar] [CrossRef]
  39. Iassonov, P.; Gebrenegus, T.; Tuller, M. Segmentation of X-ray computed tomography images of porous materials: A crucial step for characterization and quantitative analysis of pore structures. Water Resour. Res. 2009, 45. [Google Scholar] [CrossRef]
  40. Meira Cássaro, F.A.; Posadas Durand, A.N.; Gimenez, D.; Pedro Vaz, C.M. Pore-Size Distributions of Soils Derived using a Geometrical Approach and Multiple Resolution MicroCT Images. Soil Sci. Soc. Am. J. 2017, 81, 468–476. [Google Scholar] [CrossRef]
  41. Neerad, P.; Sumit, M.; Ashish, S.; Madhuri, J. Adaptive local thresholding for detection of nuclei in diversity stained cytology images. In Proceedings of the 2011 International Conference on Communications and Signal Processing, Kerala, India, 10–12 February 2011; pp. 218–220. [Google Scholar]
  42. Larsbo, M.; Koestel, J.; Jarvis, N. Relations between macropore network characteristics and the degree of preferential solute transport. Hydrol. Earth Syst. Sc. 2014, 18, 5255–5269. [Google Scholar] [CrossRef]
  43. Zhao, S.; Zhao, Y.; Wu, J. Quantitative analysis of soil pores under natural vegetation successions on the Loess Plateau. Sci. China Earth Sci. 2010, 53, 617–625. [Google Scholar] [CrossRef]
  44. Bagarello, V.; Sgroi, A. Using the simplified falling head technique to detect temporal changes in field-saturated hydraulic conductivity at the surface of a sandy loam soil. Soil Tillage Res. 2007, 94, 283–294. [Google Scholar] [CrossRef]
  45. Nijp, J.J.; Metselaar, K.; Limpens, J.; Gooren, H.P.A.; van der Zee, S.E.A.T. A modification of the constant-head permeameter to measure saturated hydraulic conductivity of highly permeable media. Methodsx 2017, 4, 134–142. [Google Scholar] [CrossRef] [PubMed]
  46. Zhang, L.; Wang, J. Prediction of the soil saturated hydraulic conductivity in a mining area based on CT scanning technology. J. Clean. Prod. 2023, 383, 135364. [Google Scholar] [CrossRef]
  47. Joshi, D.C.; Iden, S.C.; Peters, A.; Das, B.S.; Durner, W. Temperature Dependence of Soil Hydraulic Properties: Transient Measurements and Modeling. Soil Sci. Soc. Am. J. 2019, 83, 1628–1636. [Google Scholar] [CrossRef]
  48. Tang, Q.; Duan, X.; He, L.; Liao, D.; Cai, C.; Deng, Y. Variability and driving factors of the soil saturated hydraulic conductivity along the horizontal and vertical directions in the upper catchment of Benggang. Catena 2023, 222, 106810. [Google Scholar] [CrossRef]
  49. Athmann, M.; Kautz, T.; Pude, R.; Köpke, U. Root growth in biopores—Evaluation with in situ endoscopy. Plant Soil 2013, 371, 179–190. [Google Scholar] [CrossRef]
  50. Li, Z.; Hu, X.; Li, X. Characterization of Root Architectures and Soil Macropore Networks Under Different Ecosystems Using X-ray CT Scanning in the Qinghai Lake Watershed, NE Qinghai–Tibet Plateau. J. Soil Sci. Plant Nut. 2019, 19, 743–757. [Google Scholar] [CrossRef]
  51. Han, E.; Kautz, T.; Perkons, U.; Lüsebrink, M.; Pude, R.; Köpke, U. Quantification of soil biopore density after perennial fodder cropping. Plant Soil 2015, 394, 73–85. [Google Scholar] [CrossRef]
  52. Valentine, T.A.; Hallett, P.D.; Binnie, K.; Young, M.W.; Squire, G.R.; Hawes, C.; Bengough, A.G. Soil strength and macropore volume limit root elongation rates in many UK agricultural soils. Ann. Bot. Bot. 2012, 110, 259–270. [Google Scholar] [CrossRef]
  53. Bodner, G.; Leitner, D.; Kaul, H.P. Coarse and fine root plants affect pore size distributions differently. Plant Soil 2014, 380, 133–151. [Google Scholar] [CrossRef] [PubMed]
  54. Uteau, D.; Pagenkemper, S.K.; Peth, S.; Horn, R. Root and time dependent soil structure formation and its influence on gas transport in the subsoil. Soil Tillage Res. 2013, 132, 69–76. [Google Scholar] [CrossRef]
  55. Yu, Y.; Loiskandl, W.; Kaul, H.; Himmelbauer, M.; Wei, W.; Chen, L.; Bodner, G. Estimation of runoff mitigation by morphologically different cover crop root systems. J. Hydrol. 2016, 538, 667–676. [Google Scholar] [CrossRef]
  56. Chen, J.; Wu, Z.; Zhao, T.; Yang, H.; Long, Q.; He, Y. Rotation crop root performance and its effect on soil hydraulic properties in a clayey Utisol. Soil Tillage Res. 2021, 213, 105136. [Google Scholar] [CrossRef]
  57. Jiang, X.; Zhong, X.; Yu, G.; Zhang, X.; Liu, J. Different effects of taproot and fibrous root crops on pore structure and microbial network in reclaimed soil. Sci. Total Environ. 2023, 901, 165996. [Google Scholar] [CrossRef]
  58. Bai, W.; Zuo, Q.; Huang, Y.; Li, B. Effect of water supply on root growth and water uptake of alfalfa in wulanbuhe sandy region. Chin. J. Plant Ecol. 2001, 25, 29–35. [Google Scholar]
  59. Zhong, R.; Hu, J.; Bao, Y.; Wang, F.; He, X. Soil nutrients in relation to vertical roots distribution in the riparian zone of Three Gorges Reservoir, China. J. Mt. Sci. 2018, 15, 1498–1509. [Google Scholar] [CrossRef]
  60. Katuwal, S.; Norgaard, T.; Moldrup, P.; Lamandé, M.; Wildenschild, D.; de Jonge, L.W. Linking air and water transport in intact soils to macropore characteristics inferred from X-ray computed tomography. Geoderma 2015, 237–238, 9–20. [Google Scholar] [CrossRef]
  61. Baets, S.D.; Poesen, J.; Knapen, A.; Galindo, P. Impact of root architecture on the erosion-reducing potential of roots during concentrated flow. Earth Surf. Proc. Land. 2007, 32, 1323–1345. [Google Scholar] [CrossRef]
  62. Chen, G.; Weil, R.R. Penetration of cover crop roots through compacted soils. Plant Soil 2010, 331, 31–43. [Google Scholar] [CrossRef]
  63. Ghestem, M.; Sidle, R.C.; Stokes, A. The Influence of Plant Root Systems on Subsurface Flow: Implications for Slope Stability. BioScience 2011, 61, 869–879. [Google Scholar] [CrossRef]
  64. Li, J.; Yuan, X.; Ge, L.; Li, Q.; Li, Z.; Wang, L.; Liu, Y. Rhizosphere effects promote soil aggregate stability and associated organic carbon sequestration in rocky areas of desertification. Agric. Ecosyst. Environ. 2020, 304, 107126. [Google Scholar] [CrossRef]
  65. Xiao, T.; Li, P.; Fei, W.; Wang, J. Effects of vegetation roots on the structure and hydraulic properties of soils: A perspective review. Sci. Total Environ. 2024, 906, 167524. [Google Scholar] [CrossRef]
  66. Zhu, P.; Zhang, G.; Wang, H.; Xing, S. Soil infiltration properties affected by typical plant communities on steep gully slopes on the Loess Plateau of China. J. Hydrol. 2020, 590, 125535. [Google Scholar] [CrossRef]
  67. Rasse, D.P.; Smucker, A.J.M.; Santos, D. Alfalfa Root and Shoot Mulching Effects on Soil Hydraulic Properties and Aggregation. Soil Sci. Soc. Am. J. 2000, 64, 725–731. [Google Scholar] [CrossRef]
Figure 1. The procedure for soil column sampling and CT scanned image processing.
Agriculture 14 01676 g001
Figure 2. Changes in the macropore number in the ROI with depth in different stages for the two grasses.
Agriculture 14 01676 g002
Figure 3. Saturated hydraulic conductivity (Ks) of the soil in the upper and lower parts of the columns with the two grasses in different months. Different letters indicate a significant difference in Ks at different growing times (p < 0.05). UP and DO stand for the top layer and lower layer, respectively. The CK treatment was not divided into top and lower layers.
Agriculture 14 01676 g003
Figure 4. Pearson’s correlations between the macropore and saturated hydraulic conductivity. MP, MPLL, MD, HD, FD, Γ, and PN stand for the macroporosity, macroporosity of the limiting layer, mean diameter of a macropore, hydraulic radius, fractal dimension, global connectivity, and number of macropores, respectively.
Agriculture 14 01676 g004
Figure 5. Saturated hydraulic conductivity as a function of the macropore for the soil with the two grass species.
Agriculture 14 01676 g005
Table 1. Macropore characteristics of the two grasses in different months.
Plant SpeciesMonthMP (%)MPLL (%)MD (mm)HD (mm)FDΓ
CK 0.55 ± 0.070.04 ± 0.0051.10 ± 0.260.14 ± 0.0011.46 ± 0.140.10 ± 0.04
CDJuly0.60 ± 0.19 b0.06 ± 0.01 b1.36 ± 0.09 a0.23 ± 0.005 b1.57 ± 0.13 b0.12 ± 0.02 a
Sep1.77 ± 0.28 a0.41 ± 0.11 a1.51 ± 0.15 a0.23 ± 0.006 b2.07 ± 0.08 a0.21 ± 0.06 a
Nov2.27 ± 0.55 a0.69 ± 0.38 a1.94 ± 0.33 a0.26 ± 0.008 a2.08 ± 0.13 a0.27 ± 0.07 a
MSJuly0.70 ± 0.10 b0.20 ± 0.06 b1.86 ± 0.66 b0.23 ± 0.0031.63 ± 0.30 b0.29 ± 0.06 b
Sep2.39 ± 0.52 ab1.34 ± 0.29 a2.99 ± 0.65 a0.23 ± 0.0032.02 ± 0.54 ab0.55 ± 0.09 a
Nov3.05 ± 0.65 a1.31 ± 0.28 a2.48 ± 0.99 a0.25 ± 0.0022.31 ± 0.61 a0.45 ± 0.09 a
Different letters indicate significant differences in the macroporosity indices at different growth stages (p < 0.05). MP, MPLL, MD, HD, FD, and Γ stand for the macroporosity, macroporosity of the limiting layer, mean diameter of a macropore, hydraulic radius, fractal dimension, and global connectivity, respectively.
Table 2. Macropore characteristics at different depths for the two types of grasses from July to December.
Plant SpeciesROI Depth (cm)ValueMP
(%)
MPLL
(%)
MD
(mm)
HD
(mm)
FDΓ
CD0–5Mean2.020.431.780.252.030.20
CV%68.3897.2245.1314.9242.82100.42
5–10Mean1.080.341.420.241.780.19
CV%92.3794.0038.8120.5135.4452.46
MS0–5Mean2.730.982.910.242.160.49
CV%71.0997.6525.6110.2620.1842.97
5–10Mean1.360.941.980.231.820.37
CV%81.5378.6736.205.1932.1676.89
CV represents the variation coefficients. MP, MPLL, MD, HD, FD, and Γ stand for the macroporosity, macroporosity of the limiting layer, mean diameter of a macropore, hydraulic radius, fractal dimension, and global connectivity, respectively.
Table 3. The saturated hydraulic conductivity as functions of soil macropore indexes.
Plant SpeciesEquationsR2pN
CDKs = −3.79 + 3.50 MD + 0.05 PN0.610.00030
Ks = −1.61 + 14 Γ+ 0.06 PN0.630.00030
MSKs = −1.36 + 0.65 MP + 1.33 MD0.480.00030
Ks = −4.87 + 2.17 FD +1.54 MD0.520.00030
MP, MD, FD, Γ, and PN stand for the macroporosity, mean diameter of a macropore, fractal dimension, global connectivity, and number of macropores, respectively. N is the number of samples.
Disclaimer/Publisher’s Note: The statements, opinions and data contained in all publications are solely those of the individual author(s) and contributor(s) and not of MDPI and/or the editor(s). MDPI and/or the editor(s) disclaim responsibility for any injury to people or property resulting from any ideas, methods, instructions or products referred to in the content.

