Article

A Risk Assessment Method for Phosphorus Loss in Intensive Agricultural Areas—A Case Study in Henan Province, China

1
College of Resources and Environment, Henan Agricultural University, Zhengzhou 450002, China
2
College of Civil Engineering, Zhengzhou University of Technology, Zhengzhou 450044, China
*
Author to whom correspondence should be addressed.
Agriculture 2024, 14(10), 1681; https://doi.org/10.3390/agriculture14101681
Submission received: 13 July 2024 / Revised: 22 September 2024 / Accepted: 24 September 2024 / Published: 26 September 2024

Abstract

:
Agricultural phosphorus (P) loss constitutes a significant factor in agricultural non-point source pollution (ANSP). Due to the widespread occurrence and complexity of ANSP, emphasis on risk prevention and control is preferable to retroactive treatment, to reduce costs. Effective risk identification is an issue that needs to be addressed urgently. Henan Province, a typical intensive agricultural region in China, was used as a case study to develop a straightforward and precise model for assessing the risk of P loss. Total phosphorus (TP) emission intensity at the county level in Henan Province was estimated based on planting, livestock and poultry breeding, and rural domestic activities. Subsequently, influential factors were selected to determine the extent of P loss in rivers. Finally, the model was validated using water quality data. The results indicate that (1) TP emission and rainfall are the primary contributors to the risk of P loss, whereas vegetation coverage has negligible effects. (2) The primary sources of TP emission, in descending order of magnitude, are livestock and poultry breeding, rural domestic activities, and planting. Livestock and poultry breeding represents the largest proportion at approximately 50%. (3) High-risk areas for P loss are concentrated in the plains of the central, eastern, and northern Henan Province, while low-risk areas are mainly located in the western mountainous and hilly regions. (4) The model exhibits high accuracy with a determination coefficient (R2) of 0.81 when compared to surface water quality monitoring data. This study provides a new framework for assessing the risk of P loss in intensive agricultural settings.

1. Introduction

Agricultural non-point source pollution (ANSP) poses a significant threat to the rural ecological environment, water quality, and sustainable agricultural development in China [1]. Unlike point source pollution, ANSP is difficult to control due to its diverse origins, monitoring challenges, and unpredictable nature [2]. Phosphorus (P) is an important nutrient found in rivers, with studies showing that human activities are significantly increasing P levels in rivers, which is a major cause of ANSP [3]. Identifying and analyzing the sources of risk are crucial for managing P loss. By comprehensively assessing and analyzing pollutants in specific environments, we can understand how human activities affect P loss and implement targeted interventions based on regional factors, primary pollution sources, and natural environmental characteristics. This approach will help improve river water quality management, reduce water eutrophication, and support sustainable agricultural practices to improve human settlements [4].
Mechanistic models and empirical models play vital roles in assessing ANSP risk [5]. Mechanistic models typically integrate hydrological, soil erosion, nutrient transport, and plant management modules. Common models like SWAT [6,7,8] (Soil and Water Assessment Tool), AnnAGNPS [9] (Annualized Agricultural Non-Point Source Pollution Model), and HSPF [10] (Hydrological Simulation Program Fortran) are recognized for their high simulation accuracy. Although these models can accurately simulate P loss, they require complex data and are often difficult to obtain due to the lack of a complete and unified dataset, which limits their practical application [11]. They also face challenges from flat terrain, complex water systems, and regions with extensive water conservation projects [12]. Empirical models, on the other hand, are based on input–output relationships and are not deeply involved with pollution mechanisms. These models require fewer data inputs and parameters, making them suitable for estimating average annual pollution loads or assessing pollution risks in watersheds. Models used for predicting P loss risk, for example, are widely applied due to their simplicity and minimal parameter requirements [13,14]. However, they may inaccurately reflect local conditions with methods like the fixed output coefficient [15], leading to discrepancies between predicted and actual results [16]. Additionally, pollutant losses may not precisely match inputs into rivers. To improve model applicability, landscape factors such as topography [17], climate [18], and soil conditions [19] must be considered as they directly influence pollutant infiltration, adsorption, and transport [20]. Current research methods, including the P index method [21,22] and minimum resistance model [13,20], are widely used around the world [23,24], yet their application in different regions in China with varying soil, climate, and agricultural conditions requires adaptation [25].
Henan Province serves as a crucial water source for the South-to-North Water Diversion Project and is a key national grain production hub. Despite its significance in agriculture, the province faces challenges such as low agricultural refinement, excessive pesticide and fertilizer use, and significant ANSP issues [26]. In 2020, the application rate of P fertilizer in Henan Province was about 259 kg/hm2, far higher than the average level in China. The per capita arable land area of the rural population in Henan Province is only 0.17 hectares. For farmers, investing in more fertilizers and pesticides is a better way to achieve higher yields. In 2020, the scale breeding rate of livestock and poultry in Henan Province was about 67.3%. Although scale breeding is conducive to the centralized treatment of pollutants and resource utilization, it still generates a significant amount of P emissions due to the large number of animals. In addition, the domestic sewage and garbage generated by densely distributed rural residential areas can also have a significant impact on water quality. All of these factors greatly increase the risk of P loss and are not conducive to controlling ANSP. “Announcement of the second national survey of pollution sources in Henan Province” shows that agricultural sources contribute about 83% of the P emissions in Henan Province [27]. Therefore, accurately identifying the P loss generated by agricultural production activities is of great significance for controlling ANSP. Recognizing the limitations in traditional empirical models, such as insufficient pollution source categorization, incomplete indicator selection, and disparities in weighting, this study integrated local conditions in Henan Province to build a new P loss risk assessment model, and enhanced the factor selection and weight determination. This model might provide a scientific foundation and theoretical support for effectively preventing and controlling ANSP in the region.

2. Materials and Methods
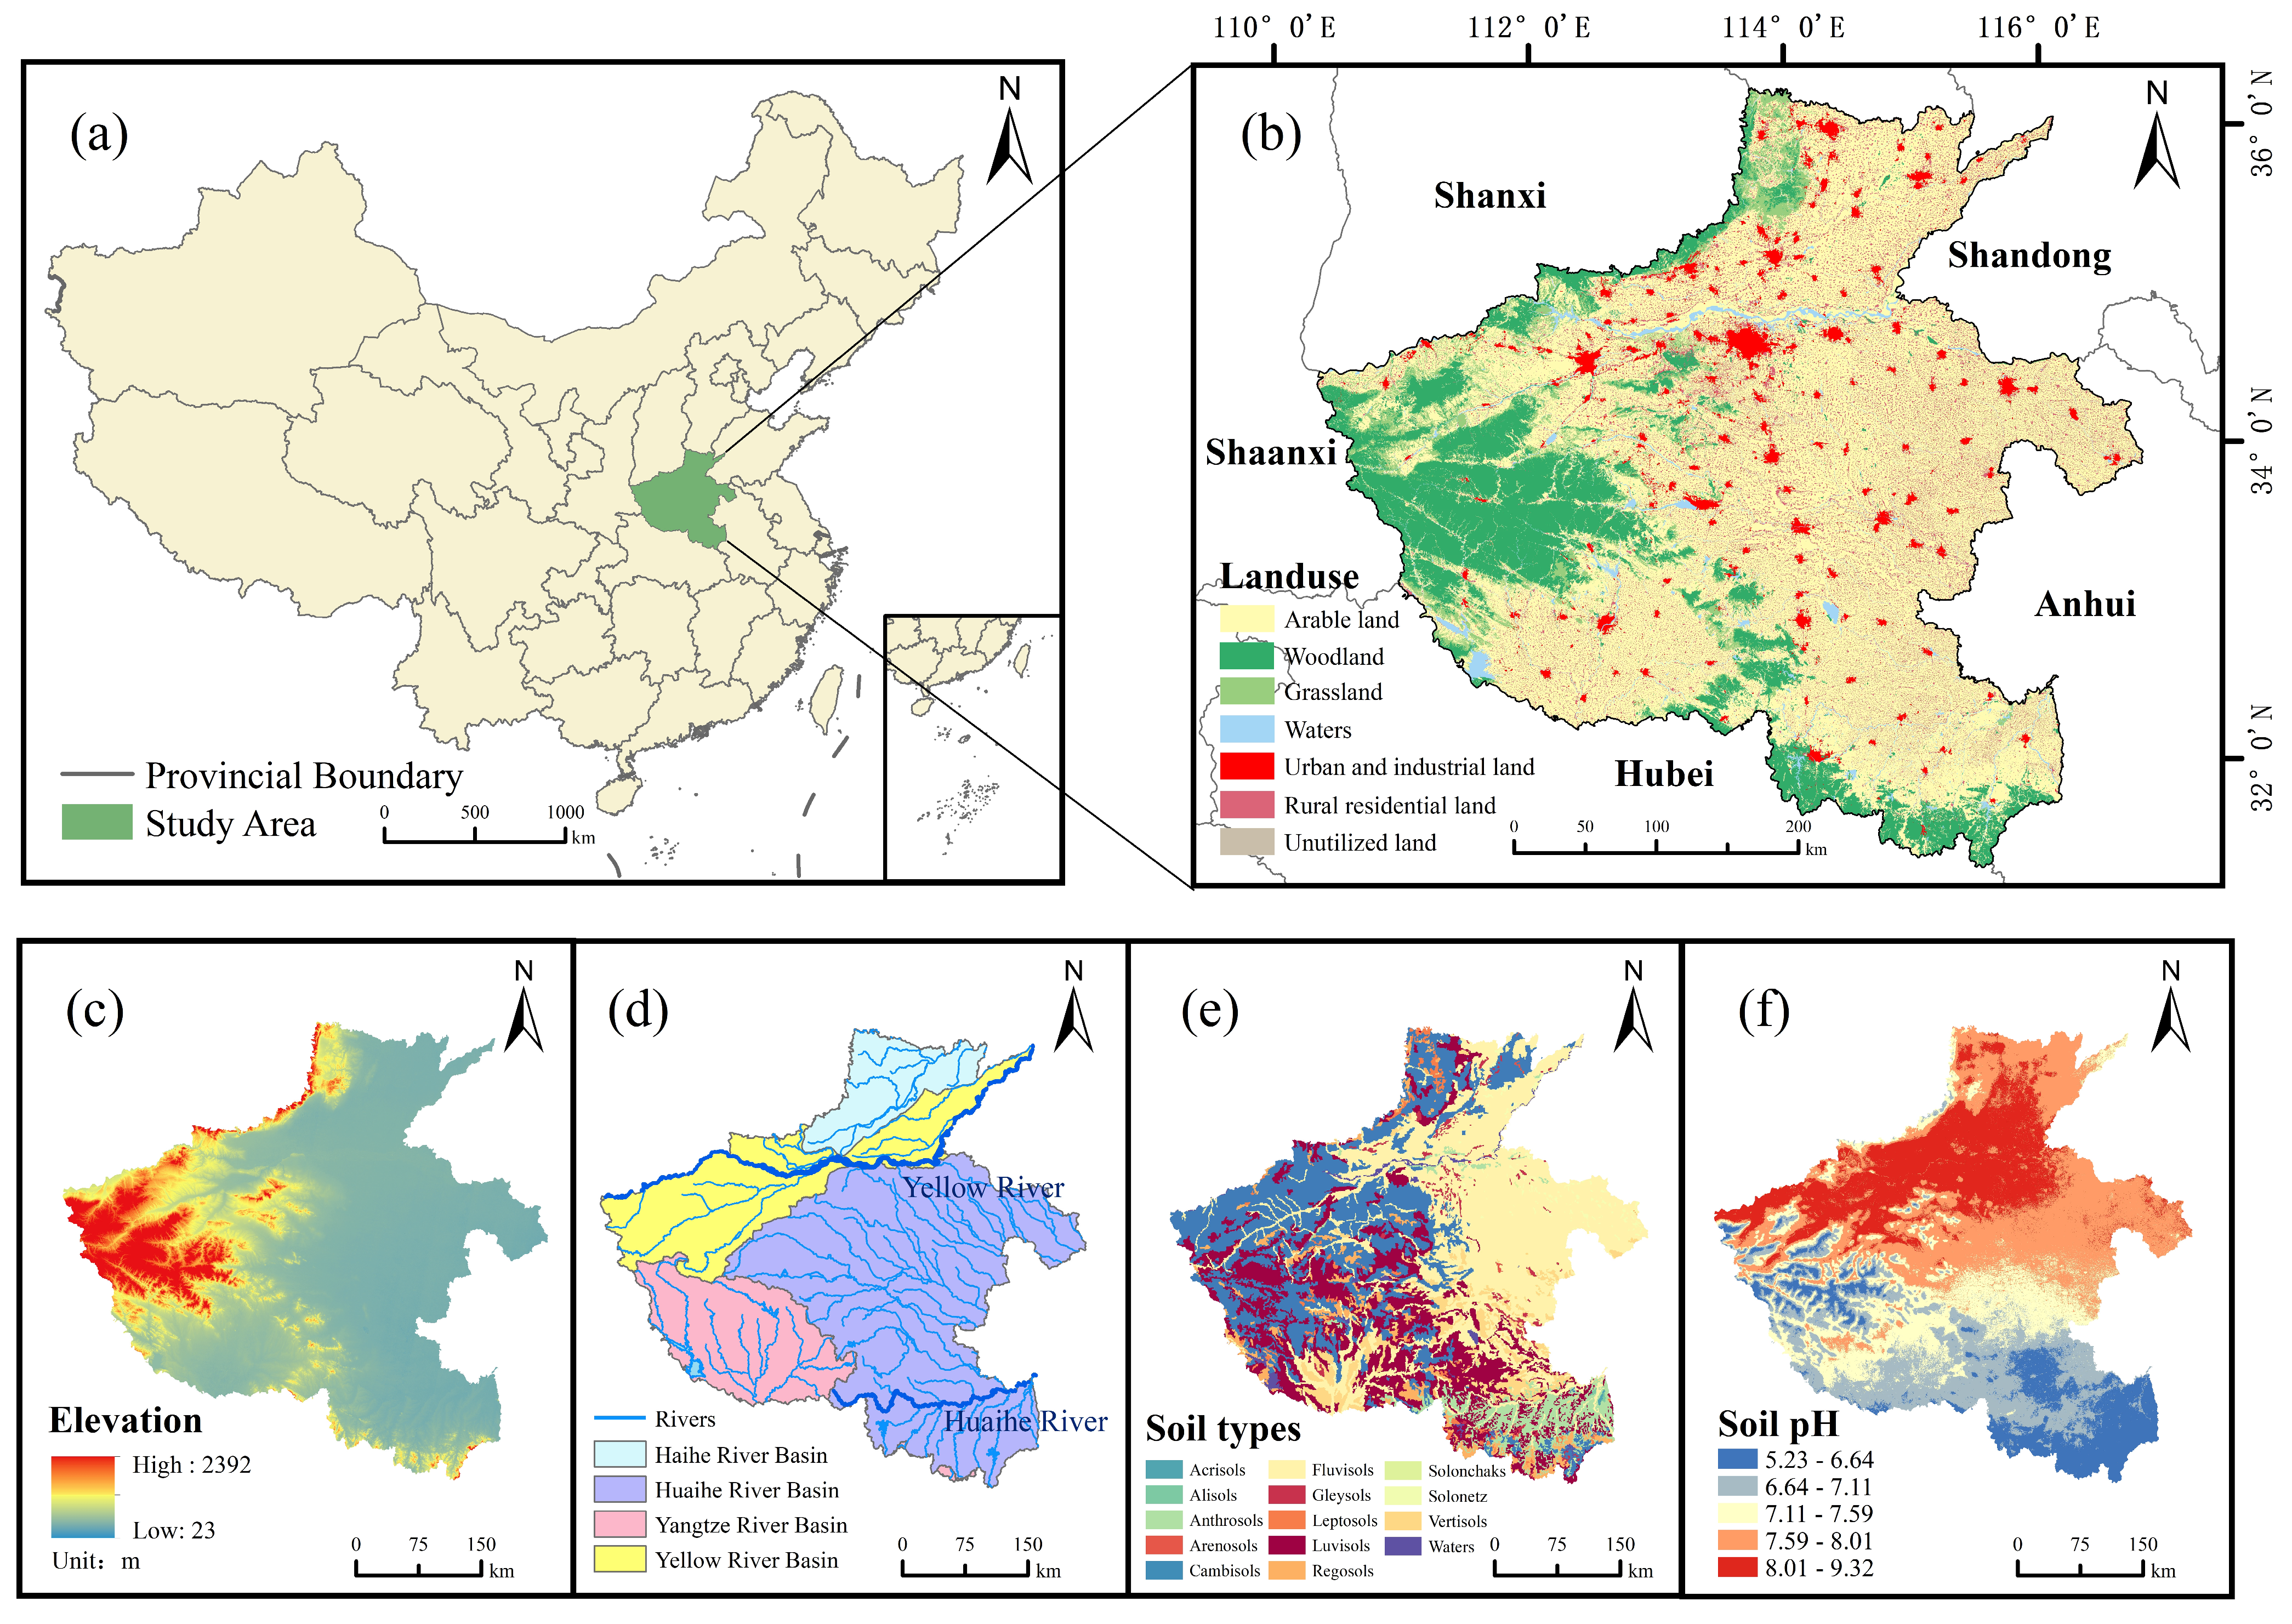
2.1. Study Area

Henan Province, situated in central China (31°23′–36°22′ N, 110°21′–116°39′ E), covers an area of 1.67 × 10⁵ km2. Its terrain is characterized by higher elevations in the west, gradually sloping toward the lower eastern regions (Figure 1). The province spans the Yellow River Basin, Huaihe River Basin, Yangtze River Basin, and Haihe River Basin, experiencing a temperate monsoon climate. The plain area accounts for 55.7% of the province, while mountainous and hilly regions make up the remaining 44.3%. Key rivers such as the Yellow River, Huaihe River, and Ying River form an extensive water system crucial for agricultural irrigation and water supply. The soil types in Henan Province are mainly fluvisols, cambosols, and luvisols, accounting for about 80% of the total area of Henan Province. Fluvisols and ambosols are mainly composed of silt and sand, while luvisols are mainly composed of sand. The average soil pH in Henan Province is approximately 7.2, with lower values in the south and higher values in the north. Over the past 30 years, soil in the region has shown a trend toward acidification, improper fertilization was one of the main causes [28].
Henan Province is primarily an agricultural and animal husbandry province, with arable land covering 7.514 × 10⁶ hm2. The predominant cropping pattern is wheat–corn rotation. Henan Province is an important grain production base in China, with a wheat planting area of 5.69 × 10⁶ hm2, which yielded 38.02 × 10⁶ t of wheat in 2021, accounting for about 27.77% of China’s total wheat output. Corn cultivation covers 3.86 × 10⁶ hm2, yielding 20.34 × 10⁶ t of corn, which accounts for about 7.46% of China’s corn production. The main livestock species in Henan Province include cattle, pigs, sheep, and poultry. In 2021, the meat output of the province amounted to 6.46 × 10⁶ t, along with 4.47 × 10⁶ t of eggs and 2.16 × 10⁶ t of milk, accounting for 7.3%, 13.1%, and 5.8%, respectively, of the total output in China.

2.2. Data Preparation

The data used in this study primarily include elevation data, land use data, remote sensing data, soil data, meteorological data, agricultural data, and water quality data from Henan Province in 2021. The agricultural data covers all 158 counties and districts in Henan Province, and the water quality data was recorded daily by 94 automatic water quality monitoring stations in Henan Province. Table 1 provides detailed information on the data sources.

2.3. Methodology

2.3.1. Quantification and Validation of P Loss Risk

The occurrence of P loss is a complex process affected by many factors. According to the role of each influencing factor in the process of P loss, TP emission factor (TP-E), soil TP content factor (TP-C), rainfall factor (R), vegetation coverage factor (FVC), slope factor (S), soil erodibility factor (K), and distance to water factor (D) were selected from the aspects of human activities, hydrometeorology, soil, topography, and vegetation. Where TP-e and TP-c are the source of P loss, R is the driving force; FVC, S, and K are the underlying surface; and D is the distance factor. The seven factors were converted to raster data by ArcGIS. Based on the identified influencing factors, we established a method to determine the risk of P loss, designated as PLRI. The equation used to calculate PLRI is as follows:
P L R I = W i × I i .
Here, P L R I represents the P loss risk index; W i represents the weight of the i t h factor, ranging from 0 to 1; and I i represents the grading values of the i t h factor, ranging from 1 to 4.
The P loss risk model developed in this study was based on the analytic hierarchy process (AHP). Table 2 illustrates the grading standards, grading values, and classification basis for each factor. According to the contribution of each factor to the risk of P loss, the factors were divided into four levels and assigned a value of 1, 2, 3, or 4 for dimensionless treatment. PLRI was obtained by grid superposition with ArcGIS 10.2, and the risk of P loss was divided into five risk levels by the natural breakpoint method.
A correlation analysis was performed between the P concentration data collected from 94 automatic water quality monitoring stations in Henan Province and the P L R I values calculated using Equation (1). This analysis aimed to verify the accuracy of the model’s evaluations.

2.3.2. Selection of Influencing Factors

TP-e can be classified as having agricultural, livestock, and rural domestic sources based on pollutant discharge pathways [30]. Considering that P is not easily diffused and dissolved in moist soil, excessive application of phosphorus fertilizer in farmland all year round will easily result in high phosphorus content in soil, so TP-c was selected [31]. Relevant studies have shown that P is usually attached to soil particles as a transport carrier, and their production is largely controlled by soil erosion. The RUSLE model, widely used globally for soil erosion prevention and environmental protection [32], guided the selection of R, FVC, S, K, and D as factors affecting pollutant migration [33]. The spatial distribution of factors is shown in Figure 2, with their respective explanations and formulae provided below:
(1)
The soil TP content (TP-c) is an important indicator of soil P nutrient availability. When TP-c levels exceed the needs of crops, the impact on yield is minimal, but the risk of P entering water bodies increases significantly. Excess P can leach into groundwater or be carried into surface water through runoff during heavy rainfall events [23].
(2)
The emission of TP (TP-e) was assessed using statistical data from 158 counties in Henan Province, focusing on three main categories: planting sources, livestock and poultry breeding sources, and rural domestic sources. In this study, arable land and rural residential land were considered to be contributors to TP-e, while other land use types had a TP-e of 0 due to the absence of agricultural production activities. The equation used to calculate P emission intensity is as follows:
L i = A i + B i + D i a r e a × 1 1000
where L i represents the P emission intensity (kg/km2); i represents each county in Henan Province; A i represents the P emission from planting sources (t); B i represents the P emission of livestock and poultry breeding sources (t); D i represents the P emission from rural domestic sources (t); a r e a represents the sum of arable land and rural residential land (km2); and 1000 is the unit conversion factor.
The planting sources were calculated using the soil nutrient balance equation [34,35]. Considering that the amount of P loss is often not equal to the amount of P entering the river, a loss coefficient was introduced and calibrated based on the agricultural emission data from the Second Source Survey in Henan Province. Increased nutrient surplus increases the risk of P loss, resulting in higher nutrient losses through surface runoff and leaching. The equations used to calculate the parameters are as follows:
A i = P s u r × P l o s s
P s u r = P i n p u t P o u t p u t
P i n p u t = P c f e r + P o f e r + P i r r + P d e p + P s t r + P s e e d + P c a k e
P o u t p u t = P c r o p
where i represents each county in Henan Province; P s u r represents the P surplus (t); and P l o s s represents the P emission coefficient of the planting industry, which was 0.389% for wheat and corn rotation, 0.406% for other field crops (except wheat and corn rotation), 0.948% for open field vegetables, and 0.694% for rice. P i n p u t represents the P input (t); P o u t p u t represents the P output (t); P c f e r represents the chemical fertilizer (t); P o f e r represents organic fertilizer made from livestock and poultry manure (t); P i r r represents the P introduced by irrigation water (t); P d e p represents the P brought into the atmosphere by dry and wet deposition (t); P s t r represents the P brought into the field by straw incorporation (t); P s e e d represents the P brought into the field by crop seeds (t); P c a k e represents the P brought into the field by cake fertilizer (t); and P c r o p represents the P absorbed by crops (t). The values of P i r r , P d e p ,   P s t r , P s t r , P s e e d , and P c a k e refer to the research findings presented by Ma and Wang [36,37].
Livestock and poultry breeding sources include manure and urine from both factory farms and traditional farms. The manure and urine generated during animal breeding have not been completely eliminated and enter the surface environment. Below is the calculation formula:
B i = n = 1 2 s j × f j × m i , j / 1000
where n represents the scale of livestock and poultry breeding, including factory farms and traditional farms; i represents each county in Henan Province; j represents different breeds of livestock and poultry; s j represents the proportion of scale for livestock and poultry species in Class j ; f j represents the annual P emissions of Class j livestock and poultry at different breeding scales; m i , j represents the number of j livestock or poultry in County i ; and 1000 is the unit conversion factor.
Rural domestic sources predominantly involve the direct discharge of untreated wastewater, encompassing pollution from toilets, kitchen waste, and bathing sewage. Below is the calculation formula:
D i = q i × u i × 365 × 1 e i × t i / 100
where i represents each county in Henan Province; q i represents the number of permanent rural residents of County i (10,000); u i represents the pollution production intensity per person per day in County i (g); e i represents the comprehensive removal rate of pollutants in County i (%); t i represents the sewage disposal rate of County i (%); and 100 is the unit conversion coefficient.
(3)
Rainfall (R) significantly influences P loss, as its intensity and frequency directly affect surface runoff and P discharge. Elevated P concentrations in water bodies often coincide with heavy rainfall and snowmelt periods [38].
(4)
Average vegetation coverage (FVC): Vegetation coverage is an essential parameter for characterizing surface vegetation [39]. It mirrors the ground cover, and regions with more dense vegetation exert a stronger influence on soil and water conservation during erosion, as well as on pollutant interception during runoff [38]. In this study, we calculated the monthly average vegetation coverage across all 12 months of 2021 in Henan Province. The calculation formula is presented below:
F V C = N D V I N D V I s o i l N D V I v e g N D V I s o i l
where F V C represents the vegetation coverage and N D V I represents the vegetation index. N D V I s o i l represents the NDVI values of pure bare soil pixels. N D V I v e g represents the NDVI value of a pure vegetation pixel or high vegetation coverage area.
(5)
Slope (S) accelerates soil erosion and runoff velocity, and a terrain with a higher slope has a greater risk of P loss.
(6)
The soil erodibility factor (K) measures the susceptibility of soil to erosion. Higher soil erodibility results in a greater K value, which is influenced by soil components like clay, loam, gravel, and organic carbon [40]. The equations used were as follows:
K E P I C = 0.2 + 0.3 e x p 0.0256 S a 1 S i 100 × S i C l + S i 0.3 × 1 0.25 C C + e x p 3.72 2.95 C × 1 0.7 S n S n + exp 5.51 + 22.9 S n
S n = 1 S a 100
K C h i n a = 0.01383 + 0.51575 K E P I C
K = 0.1317 × K C h i n a
where K E P I C represents the soil erodibility factor calculated by the EPIC model; K C h i n a represents the soil erodibility factor in China; S a represents the sand content; S i represents the silt content; C l represents the clay content; C represents the soil organic carbon content; and 0.1317 is the unit conversion factor of the US system and the international system.
(7)
Distance to water (D): Due to the way P is attenuated and absorbed during transport, P from areas near rivers tends to migrate into river systems more readily than P from other regions [41]. Agricultural lands in Henan Province are predominantly flat, with an extensive network of artificial rivers and main canals connecting natural waterways. This significantly alters the flow dynamics and hydrological connections of natural rivers. Fertilizers and domestic sewage are directed into rivers through drainage ditches, serving as important pathways for transferring pollutants.

2.3.3. Weight Determination

The weights of the influencing factors were determined using a combination of the expert scoring method and the entropy method.
(1)
We used the AHP to calculate subjective weight values for indicators by constructing a discriminant matrix using the scale construction method. Factors were compared pairwise to determine their relative importance, resulting in corresponding index weights. In the AHP, the weight calculation results of the influencing factors are largely determined by the experience of experts [42]. The weight of this method is closely related to the subjective rating of experts, which can enable the weight to be closer to the actual situation.
(2)
Natural factors such as slope and rainfall are less affected by human activities. The entropy method measures the distinctions between different influencing factors through data calculations to determine their respective weights [43]. In information theory, entropy serves as a measure of uncertainty. A greater amount of information indicates smaller uncertainty and, thus, lower entropy, while a lower amount of information indicates greater uncertainty and higher entropy. Entropy calculations help to assess the randomness and disorder of events and evaluate the dispersion of specific indices. Specifically, a 4 km × 4 km grid was generated for each factor using ArcGIS. Mean values from these grids were extracted and exported to an Excel file for standardization. The entropy method can compute weights, as described below:
H i = 1 l n i = 1 n y i l n y i
y i = x i i = 1 n x i
where H i represents the entropy value of the factor; y i represents the proportion of the standardized value corresponding to the factor in the total standardized value of the factor; and x i represents the value of the factor.
E i = 1 H i n i = 1 n H i
where E i represents the weight of the entropy method of the factor, which satisfies i = 1 n H i = 1 .
(3)
Once the subjective and objective weights of the evaluation indicators were established, their combined weights were calculated by multiplying them. The resulting calculations are detailed in Table 3, with the formula as follows:
W i = A i E i A i E i
where W i represents the combined weight, A i represents the AHP weight, and E i represents the entropy method weight.
Table 3. Weight distributions of different factors.
Factor A i E i W i
TP-e0.2030.13650.1975
TP-c0.1870.12680.169
R0.2030.12690.1836
S0.0850.17630.1068
C0.0790.10640.0599
K0.1220.15530.135
D0.1210.17180.1482

3. Results

3.1. Contribution and Spatial Distribution of Factors

Figure 2 illustrates the spatial distribution of P loss factors in Henan Province. The distribution of TP-e corresponded closely with TP-c, increasing from the southwest to the northeast of Henan Province. High-value areas were concentrated in the central-eastern and northern parts of Henan Province. Vegetation cover (FVC) aligned with land use, predominantly crops. The temperate monsoon climate of Henan Province results in increasing rainfall from the south to the north. Soil erodibility factor (K) variation was significantly affected by proximity to rivers, with higher erosion intensity along the river exceeding 0.018. The slope (S) of the region was primarily shaped by topography, with higher values in the west and lower in the east. Due to the sparse arable land and low population density in the western mountainous areas, S was assigned a lower weight by experts. According to expert scoring and entropy methods, the weights of each influencing factor were ranked as follows: TP-e > R > TP-c > D > K > S > FVC. The parameters TP-e and rainfall exerted the greatest influence, with weights of 0.1975 and 0.1836, respectively, implicating human activities and rainfall as the primary drivers of P loss. The smallest weight was assigned to FVC, due to the extensive arable land and minimal spatial variation in Henan Province. These comprehensive findings align with the actual conditions in Henan Province, and the weight of each factor could be used to calculate the subsequent risk of P loss.

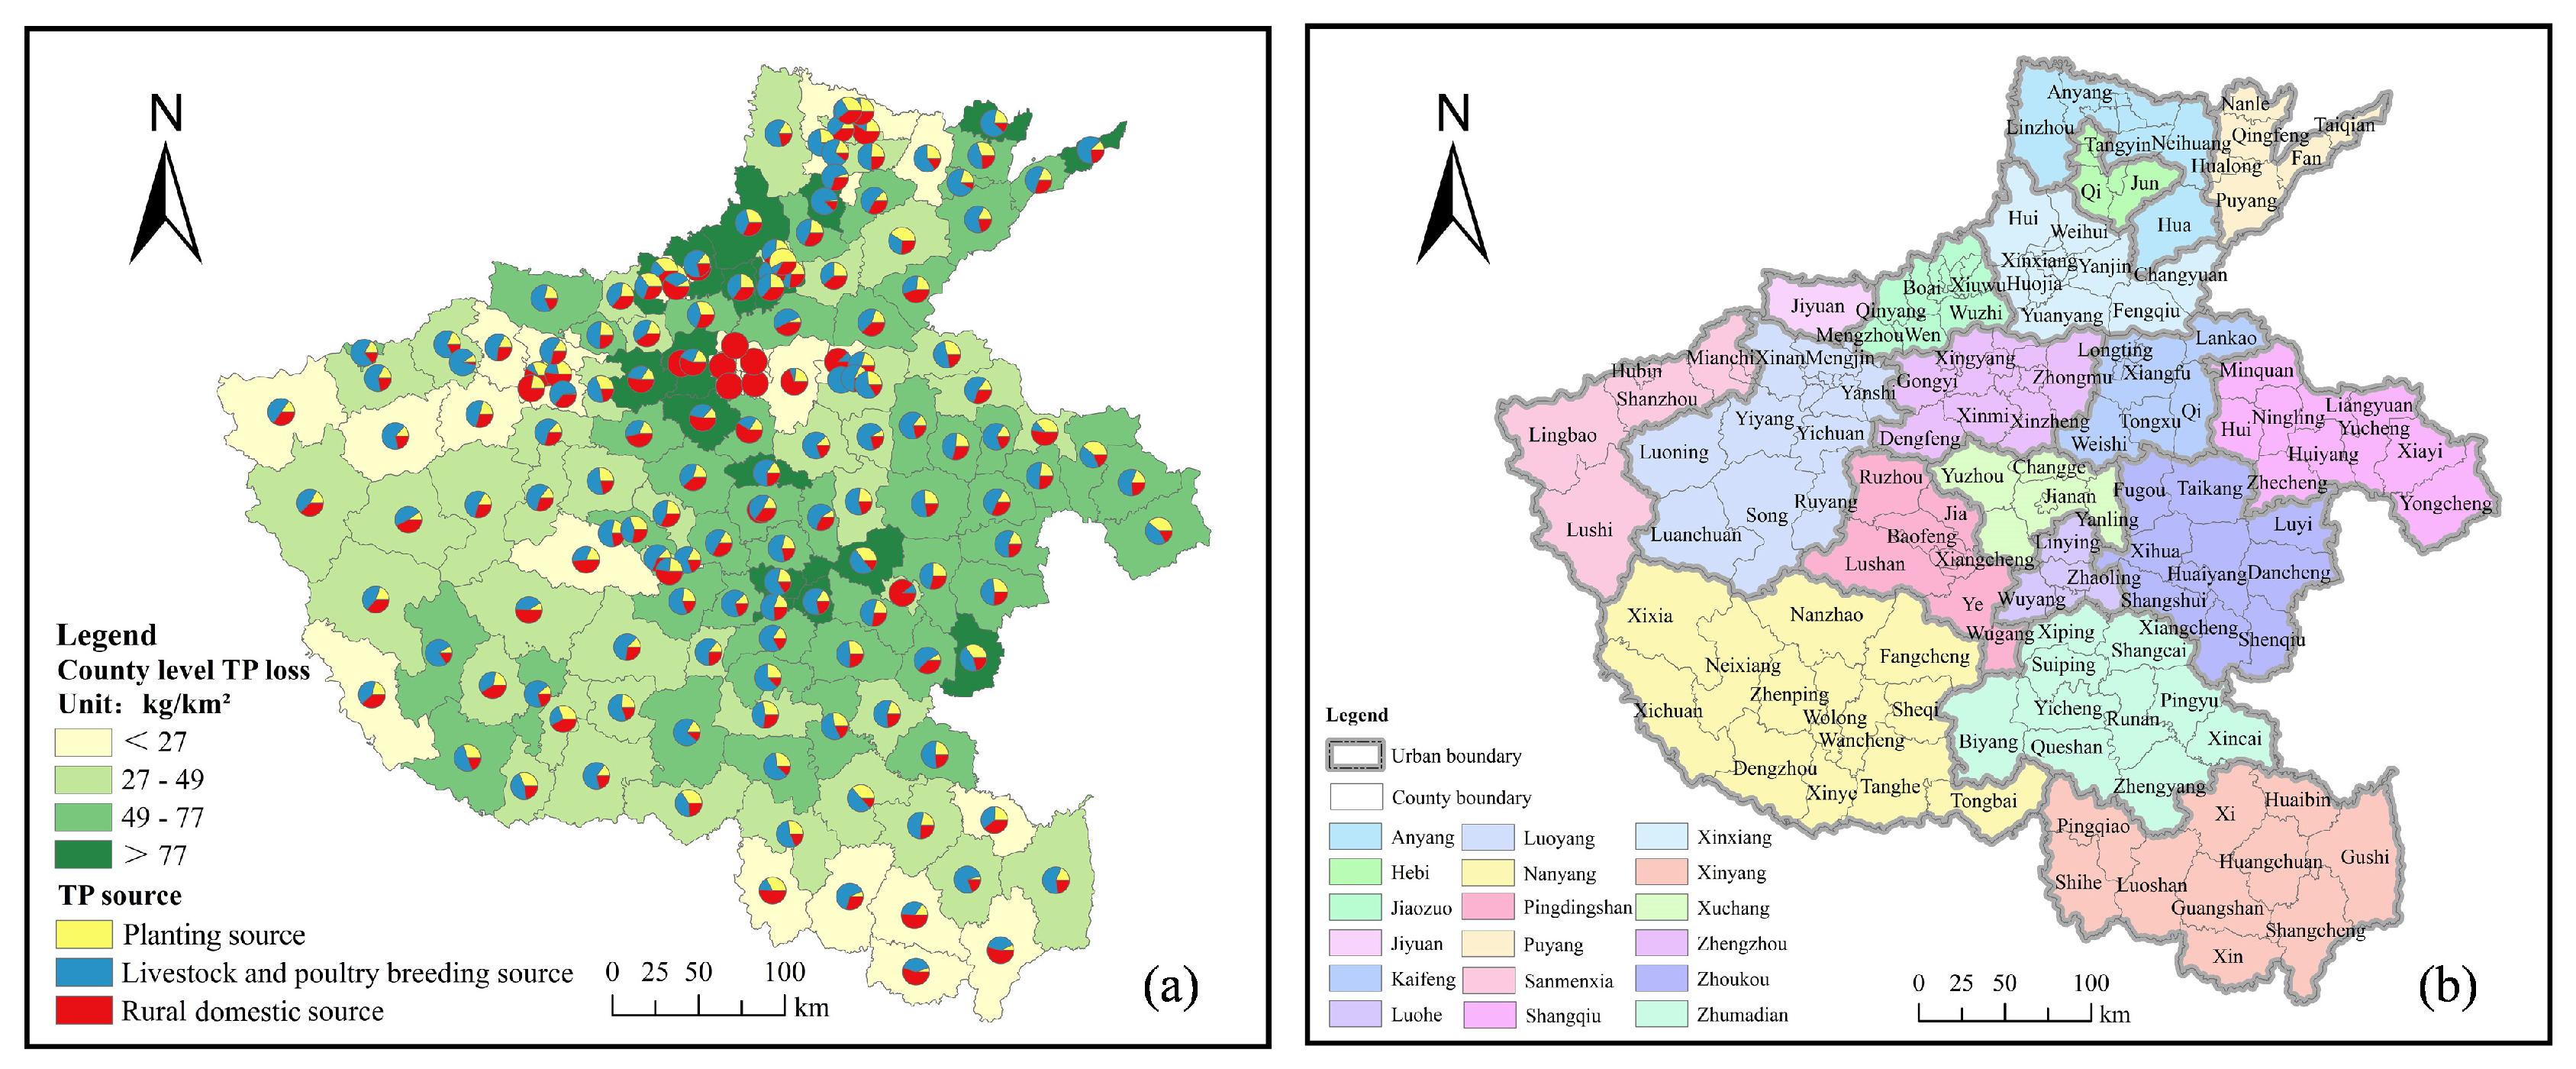
3.2. Risk and Source Analysis of TP-e Intensity at the County Scale

The spatial distribution of TP-e in Henan Province is shown in Figure 3. Planting sources, livestock and poultry breeding sources, and rural domestic sources contributed 21.76%, 51.89%, and 26.35%, respectively, to TP-e, consistent with findings from “Announcement of the Second National Pollution Source Survey in Henan Province” and research by Ma [27,44]. Affected by the “reducing weight and increasing efficiency” policy, the amount of P fertilizer applied in Henan Province has decreased annually, while the proportion of factory farm breeding has increased annually, exceeding 70%. This shift has made livestock and poultry breeding the primary source of P loss in Henan Province.
The TP-e in Henan Province exhibited a general pattern of low values in the western regions and higher values in the central and eastern regions. Livestock and poultry breeding sources generally showed higher TP-e values compared to planting and domestic sources in high-value counties. At the county level, TP-e values were lower in the west and south and higher in the central, eastern, and northern regions, correlating strongly with the topographical features of the province. The western Henan Province, encompassing the Taihang Mountains, Funiu Mountains, Tongbai Mountains, and Dabie Mountains, is characterized by steep terrain. In contrast, the central, eastern, and northern parts, located in the Huang-Huai-Hai alluvial plain, feature relatively flat terrain, conducive to concentrated agricultural activities and serving as the primary areas for livestock and poultry production. Notably, the regions with elevated TP-e values included Xuchang, Luohe, Zhoukou, Xinxiang, Puyang, and other cities, with Nanle County in Puyang exhibiting the highest P emission intensity, primarily from livestock and poultry breeding. In this study, the average TP-e in Henan Province was about 48 kg/km2, while in Nanle County it reached 118 kg/km2, which is more than twice the average in Henan Province. During the study period, the livestock population in Nanle County reached 16.02 × 10⁶, the poultry population was 35.74 × 10⁶, and the annual P fertilizer application amount was 9.7 × 10³ t, amounts which are higher than the county averages of 39.5 × 10⁴, 4.45 × 10⁶, and 5.4 × 10³ t in Henan Province, respectively. Notably, the TP-e from planting and livestock breeding activities in Nanle County far exceeded provincial averages. Similarly, Shenqiu, Xihua, Biyang, Dengzhou, Neixiang, and other counties also exhibited high TP-e values comparable to Nanle County. In contrast, the areas with low TP-e values were mainly located in mountainous and hilly regions, such as Sanmenxia, Luoyang, and Xinyang. These locations have a relatively small proportion of arable land and a low intensity of agricultural production activities.

3.3. Spatial Distribution of P Loss Risk

The natural breakpoint method was used to divide the P L R I of Henan Province into categories, yielding proportions of 7%, 25%, 22%, 31%, and 15% for no risk (1 to 1.6), low risk (1.6 to 1.9), medium risk (1.9 to 2.2), relatively high risk (2.2 to 2.5), and high risk (2.5 to 3.2), respectively. The Huaihe River Basin, Haihe River Basin, Yellow River Basin, and Yangtze River Basin were ranked in descending order of risk. Figure 4 shows that medium- to high-risk areas were concentrated in the Huaihe River Basin, the northern Yellow River Basin, and the eastern parts of the Haihe River Basin. Conversely, low-risk and no-risk areas were mainly found in mountainous regions of the Yellow River Basin and the western parts of the Yangtze River Basin. In Henan Province, areas with high or relatively high risk were primarily located in the Huang-Huai-Hai alluvial plain due to its intensive agricultural practices, significant livestock breeding operations, widespread arable land, and rural residential areas acting as pollution sources. Despite some areas in southern Xinyang showing low TP-e values, they pose higher risks due to their heavy rainfall patterns and dense water systems. High-risk zones like Jiaozuo, Xinxiang, and Puyang in the northern Henan Province were heavily affected by livestock breeding, rural domestic sources, and TP-c. The northern Henan Province has fluvisols formed by Yellow River alluvial deposits [45], which are rich in silted sediment containing high P levels, contributing to high TP-c. Although the mountainous terrain of western Henan facilitates pollutant dispersion due to its steep slopes, its less-distributed arable land and extensive woodland coverage effectively intercept pollutants, resulting in an overall lower risk profile.

3.4. Relationship between P Loss Risk and TP Concentration

In this study, P L R I was used to assess the risk of P loss. A higher P L R I indicates a greater potential for P loss. Given the varying sizes of the sub-basins, their significant differences in discharge, and the complexity of their drainage systems, it is practical to verify the model by analyzing the average P L R I and water quality data across different sub-basins [13,19,46]. Referring to Zhang’s basin division results [47], 10 sub-basins in Henan Province with extensive coverage, well-established water systems, and evenly distributed monitoring sections were selected (Figure 5). The concentrations measured at 94 hydrological monitoring stations in 2021 were analyzed, and the average P L R I of each basin was calculated. The findings demonstrated a high level of accuracy in the linear fit (R2 = 0.81) between the P L R I and TP concentration, indicating the credibility of our macroscale assessment of P loss risk (Figure 6).

4. Discussion

4.1. Migration Process of P

There are three main ways for P from farmland soil and impervious surfaces to enter surface water and groundwater: surface runoff, soil erosion, and leaching [48]. The migration of P is influenced by several factors, including terrain, rainfall, soil texture, and vegetation. Rainfall is the primary driver of P loss [49]. As rainfall increases, surface runoff intensifies, leading to greater erosion and transport of P. While rainfall can encourage P deposition, it also exacerbates soil erosion, contributing to the redistribution of P. Slope, vegetation coverage, and soil erodibility are the underlying surfaces of P migration. Steeper slopes facilitate more rapid P movement, while higher vegetation cover reduces P transport. The higher the value of the soil erodibility factor, the more severe the soil erosion. In addition, distance is an important factor affecting P entering the water body, with the risk of P entering water systems increasing as the distance from rivers or lakes decreases. Leaching is another important way for nitrogen and P to enter water. This process occurs through precipitation, adsorption, and desorption, and is affected by factors such as fertilizer use, soil texture, soil depth, land use mode, and crop type [11]. Studies show a strong correlation between P leaching and precipitation, with leaching peaks often corresponding to periods of intense rainfall [50]. However, due to the complexity of vertical movement, it is difficult to estimate the amount of P loss caused by leaching [51]. Additionally, soil pH also influences P loss. In recent decades, Henan Province, particularly along the Yellow River, has experienced significant soil acidification and salinization. The resulting soil compaction further exacerbates surface runoff and soil erosion, leading to P loss. Despite its importance, research on this issue remains limited, making it a critical area for future study.
In this study, the mechanism of P loss was not discussed in depth, but five factors that can generally reflect the process of P loss were selected to simplify the modeling process. Surface runoff, soil erosion, and leaching were all affected by the above factors. The complexity of P transport is often overlooked in traditional models, but this study tried to restore this process as much as possible.

4.2. Comparison with Traditional Empirical Models

Compared to traditional empirical models, this study mainly improved the evaluation index system and weight determination methods. Traditional empirical models typically focus on farmland as the primary pollution source [22], which is less suitable for Henan Province, where arable land predominates. Moreover, these models often attribute pollutants mainly to chemical fertilizers, overlooking contributions from crop uptake, livestock waste, and domestic sewage. In contrast, this study comprehensively considered multiple sources of pollution. It introduced the soil nutrient balance equation to estimate P loss from agricultural activities, assigned P loss to specific grid layers of arable land and rural settlements, and considered the land type generating pollutants comprehensively. Furthermore, determining the weights of influencing factors is crucial in studies on ANSP [13]. The existing risk assessment models share common factors, but vary in weight distribution; for example, weights for factors like rainfall, slope, vegetation coverage, and land use range from 0.05 to 0.5 [13,19,21,22,29]. The applicability of these models across regions differs due to varying weight assignments that may not account for regional distinctions or rely solely on subjective expert scoring methods [52], which, though effective, may lack universal applicability [24]. Given that weights should reflect regional characteristics that are influenced differently by natural and human factors across research areas, this study used the entropy method combined with expert scoring to determine relative importance at a regional scale—this approach has broader applicability across different regions as it reflects unique natural and human influences [44]. Moreover, unlike conventional ANSP assessment methods limited to watershed scales or entire regions, the evaluation model used in this study allows visualization of the degree of P loss risk at various scales through grid superposition, extending beyond watershed boundaries. Thus, it provides an administrative-scale reference for controlling P loss.

4.3. Potentials and Limitations

In this study, certain limitations exist regarding the time and resolution of the data. For example, the soil texture data (sand, silt, and clay) were obtained from a world soil database with low resolution. Soil TP content data were collected earlier based on China’s second national soil census. Using higher-resolution and more recent data could enhance the accuracy of the models. Additionally, the study did not account for the effects of point source pollution, such as aquaculture and industrial wastewater. Despite these limitations, given the study’s large scale, the effect of these data constraints on the results is small. However, improving the accuracy of the data is necessary for application in smaller study areas. Furthermore, atmospheric deposition of P is a significant pathway into water bodies [53]. However, this study did not differentiate treatments across regions in Henan Province due to limited relevant studies—an issue that needs to be addressed in future research. It should be noted that the factors selected in this study are not fixed and can be adjusted according to different research areas to better match the actual local situation. Overall, the data and methods selected in this study are reasonable. The source of pollutants, the underlying surface, and the distance of pollutants were comprehensively considered, and the selected data and calculation method meet the P loss evaluation criteria.

5. Conclusions

Using Henan Province, a typical intensive agricultural area in China, as an example, this study developed a model to evaluate P loss risk. The principal conclusions are as follows:
(1)
The main factors influencing P loss were TP emission and rainfall, with weights of 0.2083 and 0.1846, respectively. Agricultural activities were a significant contributor to P loss, while rainfall accelerated the transport of pollutants, highlighting its crucial role. Vegetation coverage contributed minimally to the overall risk.
(2)
The average intensity of TP emission in Henan Province was about 48 kg/km2. Livestock and poultry breeding was the main source and contributed about 50%. The high values of TP emission were mainly distributed in the Huang-Huai-Hai Plain in the eastern Henan Province.
(3)
In Henan Province, regions with no, low, medium, relatively high, and high risk of P loss constituted 7%, 25%, 22%, 31%, and 15%, respectively. The risk levels varied across the Huaihe River Basin, Haihe River Basin, Yellow River Basin, and Yangtze River Basin, ranging from high to low.
(4)
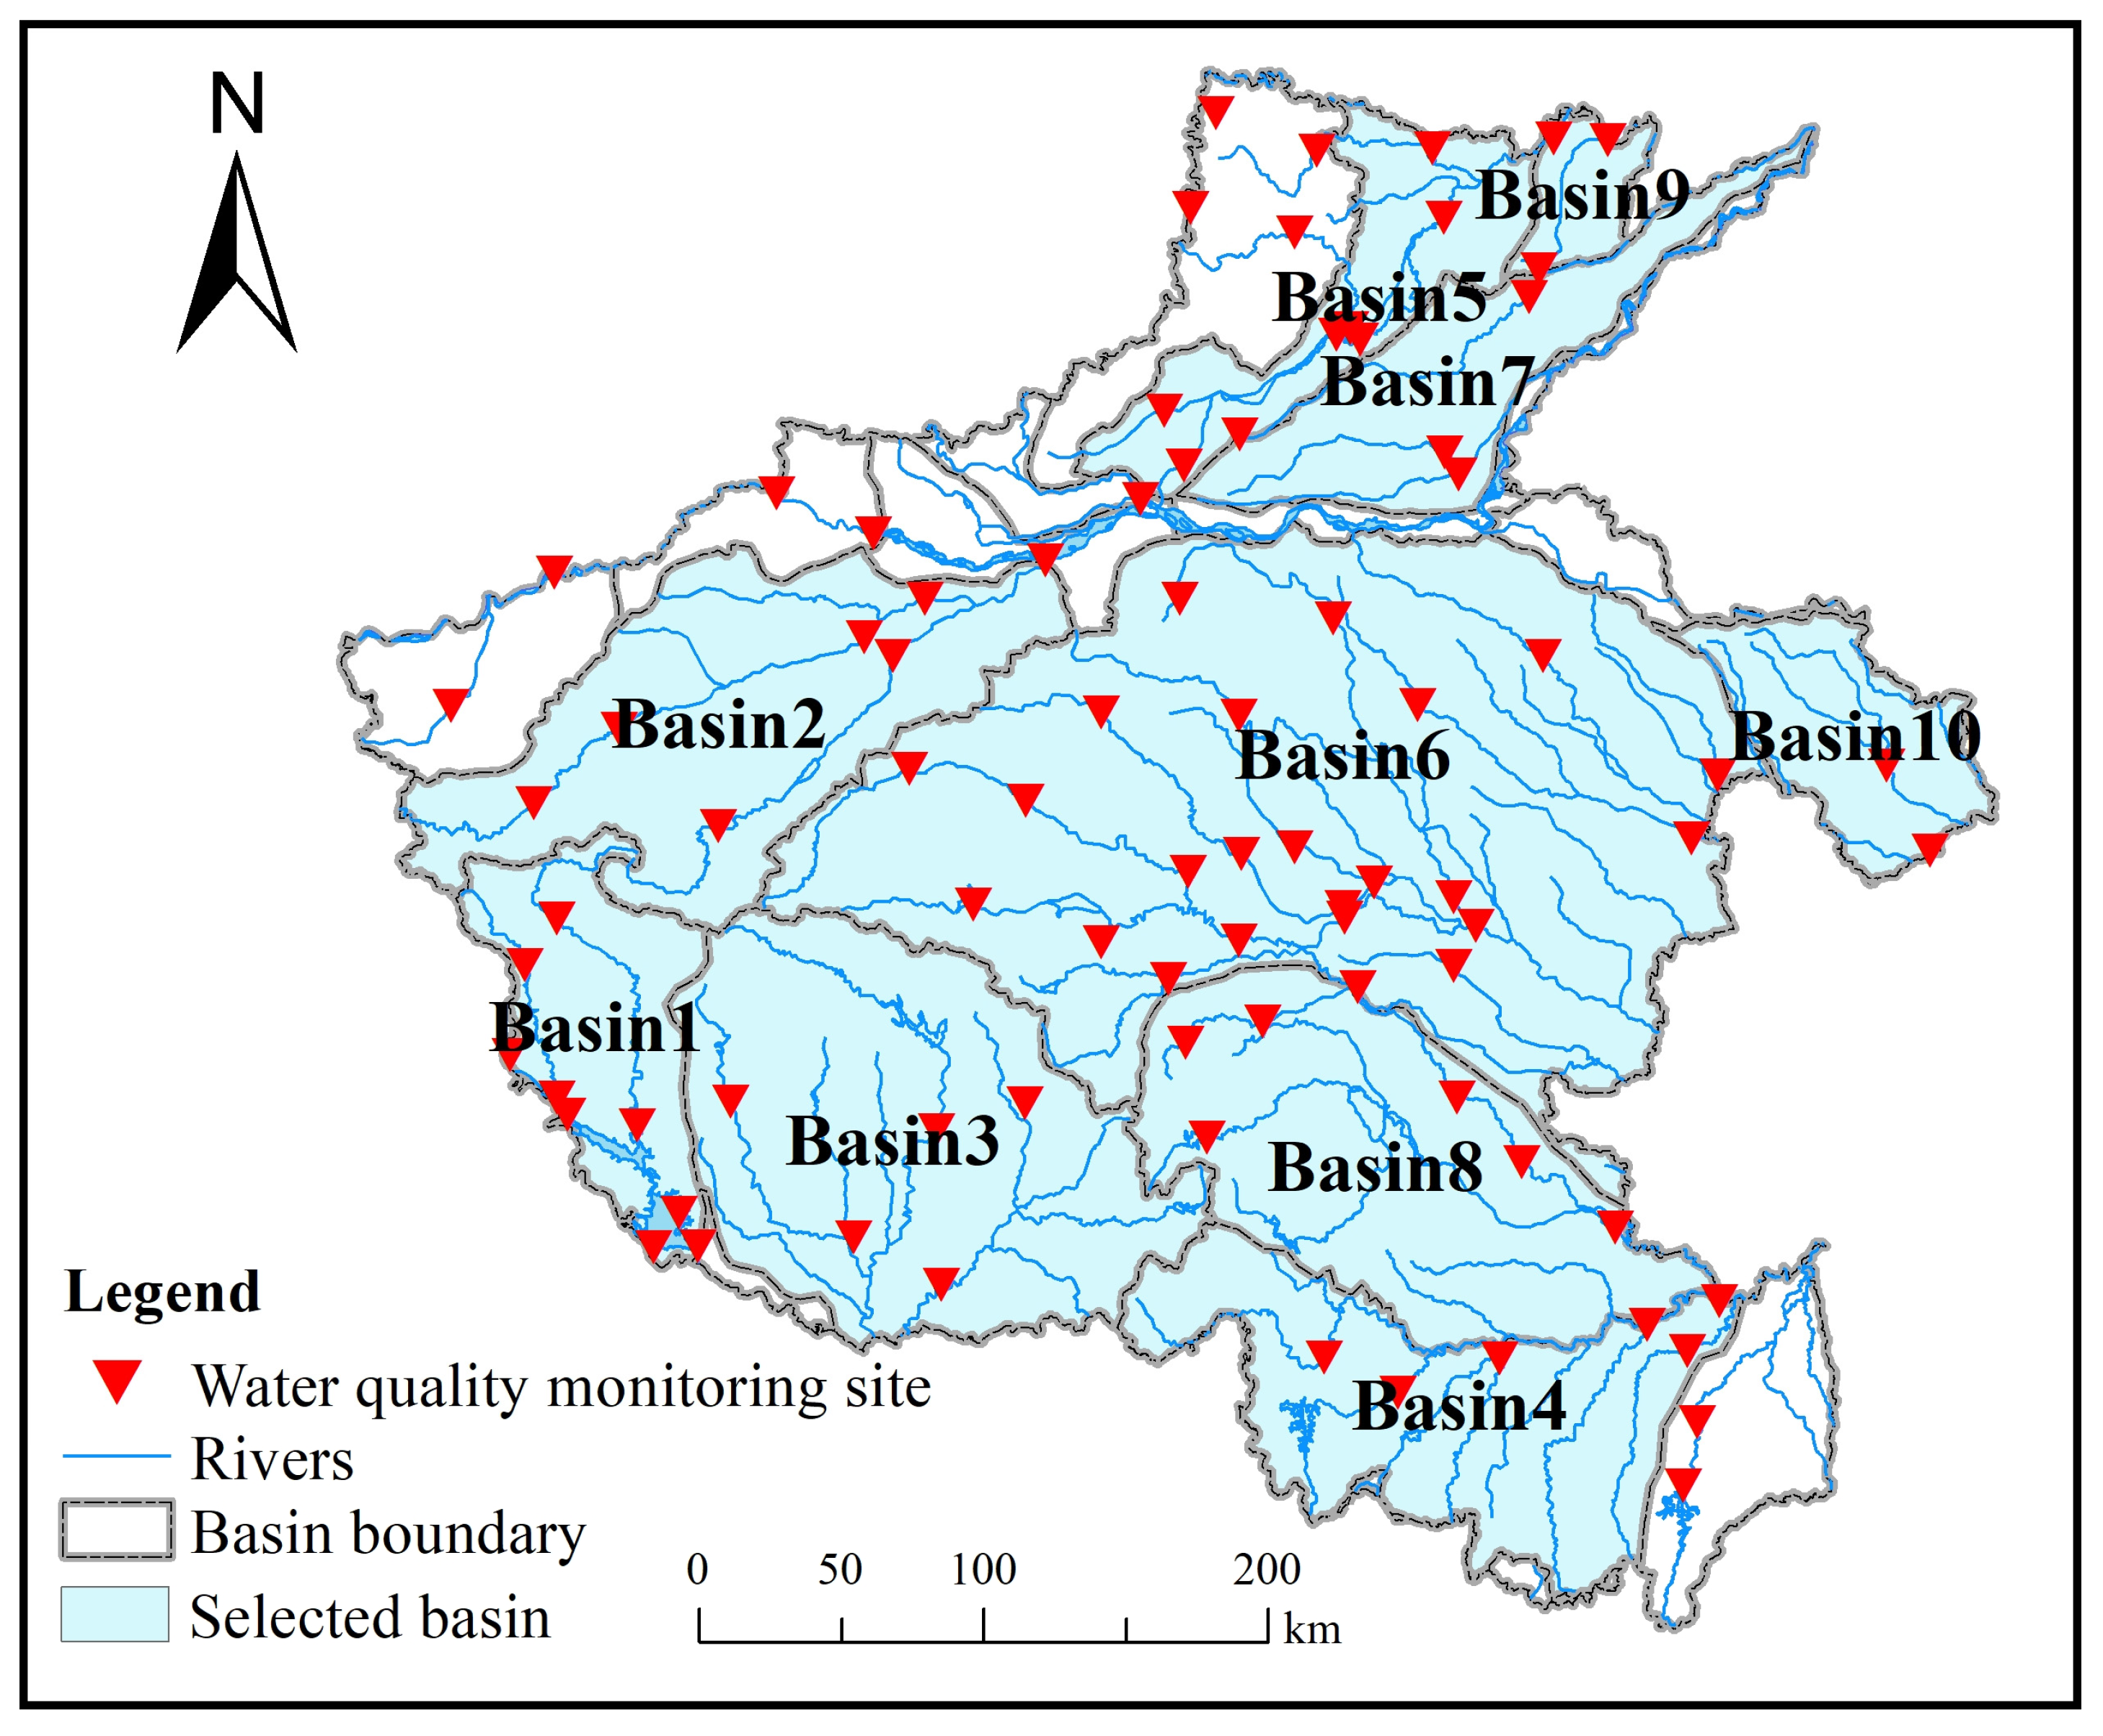
The coefficient of determination between the PLRI and the measured TP concentration was 0.81, suggesting that the model developed in this study is reasonably reliable for assessing P loss risk at the macroscale.

Author Contributions

Conceptualization, L.G. and Y.W.; methodology, L.G.; software, L.G.; validation, L.G., Y.W. and L.L.; formal analysis, C.S.; investigation, C.S.; resources, L.L.; data curation, D.L.; writing—original draft preparation, L.G.; writing—review and editing, X.L.; visualization, L.G.; supervision, D.L.; project administration, L.L.; funding acquisition, L.L. All authors have read and agreed to the published version of the manuscript.

Funding

This research was funded by the National Key R&D Program, grant number 2021YFD1700900; the Henan Provincial Science and Technology R&D Program Joint Fund, grant number 225200810045; the Henan Province Science and Technology Research Projects, grant numbers 242102320138, 232102110055; the Key scientific research projects plan of colleges and universities in Henan Province, grant numbers 22A170022, 23A630014; and the Science and Technology Innovation Funds of Henan Agricultural University, grant number KJCX2020C05.

Institutional Review Board Statement

Not applicable.

Data Availability Statement

The original data source has been indicated in the article, and further research results can be obtained by consulting with the corresponding author.

Conflicts of Interest

The authors declare no conflicts of interest.

References

  1. Zou, L.; Liu, Y.; Wang, Y.; Hu, X. Assessment and analysis of agricultural non-point source pollution loads in China: 1978–2017. J. Environ. Manag. 2020, 263, 110400. [Google Scholar] [CrossRef] [PubMed]
  2. Henri, C.V.; Harter, T.; Diamantopoulos, E. On the conceptual complexity of non-point source management: Impact of spatial variability. Hydrol. Earth Syst. Sci. 2020, 24, 1189–1209. [Google Scholar] [CrossRef]
  3. Wang, Y.; Xie, X.; Liu, C.; Wang, Y.; Li, M. Variation of net anthropogenic phosphorus inputs (NAPI) and riverine phosphorus fluxes in seven major river basins in China. Sci. Total Environ. 2020, 742, 140514. [Google Scholar] [CrossRef]
  4. Wang, S.; Wang, Y.; Wang, Y.; Wang, Z. Assessment of influencing factors on non-point source pollution critical source areas in an agricultural watershed. Ecol. Indic. 2022, 141, 109084. [Google Scholar] [CrossRef]
  5. Guo, X.; Tankpa, V.; Wang, L.; Ma, F.; Wang, Y. Framework of multi-level regionalization schemes based on non-point source pollution to advance the environmental management of small watersheds. Environ. Sci. Pollut. Res. 2021, 28, 31122–31137. [Google Scholar] [CrossRef]
  6. Li, Y.; Wang, H.; Deng, Y.; Liang, D.; Li, Y.; Gu, Q. Applying water environment capacity to assess the non-point source pollution risks in watersheds. Water Res. 2023, 240, 120092. [Google Scholar] [CrossRef]
  7. Shrestha, M.K.; Recknagel, F.; Frizenschaf, J.; Meyer, W. Assessing SWAT models based on single and multi-site calibration for the simulation of flow and nutrient loads in the semi-arid Onkaparinga catchment in South Australia. Agric. Water Manag. 2016, 175, 61–71. [Google Scholar] [CrossRef]
  8. Liang, K.; Zhang, X.; Liang, X.-Z.; Jin, V.L.; Birru, G.; Schmer, M.R.; Robertson, G.P.; McCarty, G.W.; Moglen, G.E. Simulating agroecosystem soil inorganic nitrogen dynamics under long-term management with an improved SWAT-C model. Sci. Total Environ. 2023, 879, 162906. [Google Scholar] [CrossRef]
  9. Chen, Y.; Lu, B.; Xu, C.; Chen, X.; Liu, M.; Gao, L.; Deng, H. Uncertainty Evaluation of Best Management Practice Effectiveness Based on the AnnAGNPS Model. Water Resour. Manag. 2022, 36, 1307–1321. [Google Scholar] [CrossRef]
  10. Roostaee, M.; Deng, Z. Effects of digital elevation model data source on HSPF-based watershed-scale flow and water quality simulations. Environ. Sci. Pollut. Res. 2023, 30, 31898–31916. [Google Scholar] [CrossRef]
  11. Tan, S.; Xie, D.; Ni, J.; Chen, L.; Ni, C.; Ye, W.; Zhao, G.; Shao, J.; Chen, F. Output characteristics and driving factors of non-point source nitrogen (N) and phosphorus (P) in the Three Gorges reservoir area (TGRA) based on migration process: 1995–2020. Sci. Total Environ. 2023, 875, 162543. [Google Scholar] [CrossRef] [PubMed]
  12. Sun, C.; Chen, L.; Zhu, H.; Xie, H.; Qi, S.; Shen, Z. New framework for natural-artificial transport paths and hydrological connectivity analysis in an agriculture-intensive catchment. Water Res. 2021, 196, 117015. [Google Scholar] [CrossRef] [PubMed]
  13. Huang, C.; Hou, X.; Li, H. An improved minimum cumulative resistance model for risk assessment of agricultural non-point source pollution in the coastal zone. Environ. Pollut. 2022, 312, 120036. [Google Scholar] [CrossRef] [PubMed]
  14. Rao, P.; Wang, S.; Wang, A.; Yang, D.; Tang, L. Spatiotemporal characteristics of nonpoint source nutrient loads and their impact on river water quality in Yancheng city, China, simulated by an improved export coefficient model coupled with grid-based runoff calculations. Ecol. Indic. 2022, 142, 109188. [Google Scholar] [CrossRef]
  15. Johnes, P.J. Evaluation and management of the impact of land use change on the nitrogen and phosphorus load delivered to surface waters: The export coefficient modelling approach. J. Hydrol. 1996, 183, 323–349. [Google Scholar] [CrossRef]
  16. Wang, W.; Chen, L.; Shen, Z. Dynamic export coefficient model for evaluating the effects of environmental changes on non-point source pollution. Sci. Total Environ. 2020, 747, 141164. [Google Scholar] [CrossRef]
  17. Wu, J.; Lu, J. Spatial scale effects of landscape metrics on stream water quality and their seasonal changes. Water Res. 2021, 191, 116811. [Google Scholar] [CrossRef]
  18. Li, T.; Zhang, Y.; He, B.; Wu, X.; Du, Y. Nitrate loss by runoff in response to rainfall amount category and different combinations of fertilization and cultivation in sloping croplands. Agric. Water Manag. 2022, 273, 107916. [Google Scholar] [CrossRef]
  19. Wang, Y.; Liu, G.; Zhao, Z.; Wu, C.; Yu, B. Using soil erosion to locate nonpoint source pollution risks in coastal zones: A case study in the Yellow River Delta, China. Environ. Pollut. 2021, 283, 117117. [Google Scholar] [CrossRef]
  20. Tan, S.; Xie, D.; Ni, J.; Chen, F.; Ni, C.; Shao, J.A.; Wang, J.; Zhu, D.; Wang, S.; Lei, P.; et al. Identification of nonpoint source pollution source/sink in a typical watershed of the Three Gorges Reservoir Area, China: A case study of the Qijiang River. J. Clean. Prod. 2022, 330, 129694. [Google Scholar] [CrossRef]
  21. Wu, H.; Wan, W.; Shan, Y.; Chen, Y.; Li, Q.; Li, C.; Hu, H.; Zhang, B. Environmental risk assessment of phosphorus loss from farmland based on phosphorus index model in the Haihe River Basin. Trans. CSAE 2020, 36, 17–27. (In Chinese) [Google Scholar] [CrossRef]
  22. Zheng, B.; Liu, H.; Wu, H.; Wu, Z.; Liu, Z.; Zhu, J.; Wan, W. Risk Assessment and Key Driving Factors of Phosphorus Loss in Farmland of China. Trans. CSAE 2024, 40, 332–343. (In Chinese) [Google Scholar] [CrossRef]
  23. Li, Z.; Zhang, R.; Liu, C.; Zhang, R.; Chen, F.; Liu, Y. Phosphorus spatial distribution and pollution risk assessment in agricultural soil around the Danjiangkou reservoir, China. Sci. Total Environ. 2020, 699, 134417. [Google Scholar] [CrossRef] [PubMed]
  24. Ma, H.; Lei, Q.; Du, X.; Zhao, Y.; Li, Y.; An, M.; Wu, S.; Fan, B.; Liu, H. Review on development of phosphorus indices in the United States. J. Agro-Environ. Sci. 2024, 43, 965–973. (In Chinese) [Google Scholar] [CrossRef]
  25. Pintos Andreoli, V.; Shimadera, H.; Koga, Y.; Mori, M.; Suzuki, M.; Matsuo, T.; Kondo, A. Inverse estimation of nonpoint source export coefficients for total nitrogen and total phosphorous in the Kako river basin. J. Hydrol. 2023, 620, 129395. [Google Scholar] [CrossRef]
  26. Zhang, Z.; Liu, X.; Hou, S.; Shu, X.; Wang, Q.; Guo, C. Spatial-temporal Differentiation and Environmental Risk Assessment of Fertilizer Application in Henan Province. Henan Sci. 2023, 41, 1738–1745. [Google Scholar]
  27. Henan Provincial Department of Ecology and Environment, Henan Provincial Bureau of Statistics, Henan Provincial Department of Agriculture and Rural Areas. Announcement of the second national survey of pollution sources in Henan Province [EB/OL]. Available online: https://www.henan.gov.cn/2020/12-01/1916810.html (accessed on 22 September 2024).
  28. Zhang, Y.; Li, L.; Wang, X.; Lu, J. Temporal and spatial variation of soil pH in Henan. Chin. J. Soil Sci. 2019, 50, 1091–1100. (In Chinese) [Google Scholar] [CrossRef]
  29. Yang, J.; Feng, A.; Wang, X.; Li, X.; Wang, C.; Tian, Z. An identification method of potential risk for agricultural non-point source pollution in the Haihe River Basin. China Environ. Sci. 2021, 41, 4782–4791. (In Chinese) [Google Scholar] [CrossRef]
  30. Wang, W.; Liu, G.; Zhang, Y.; Wang, M.; Pan, Y.; Meng, X.; Xiong, J.; Shen, Z.; Chen, L. Enhancing watershed management through adaptive source apportionment under a changing environment. Npj Clean Water 2024, 7, 29. [Google Scholar] [CrossRef]
  31. Fang, H. Effect of soil conservation measures and slope on runoff, soil, TN, and TP losses from cultivated lands in northern China. Ecol. Indic. 2021, 126, 107677. [Google Scholar] [CrossRef]
  32. Li, P.; Xie, Z.; Yan, Z.; Dong, R.; Tang, L. Assessment of vegetation restoration impacts on soil erosion control services based on a biogeochemical model and RUSLE. J. Hydrol. Reg. Stud. 2024, 53, 101830. [Google Scholar] [CrossRef]
  33. Phinzi, K.; Ngetar, N.S. The assessment of water-borne erosion at catchment level using GIS-based RUSLE and remote sensing: A review. Int. Soil Water Conserv. Res. 2019, 7, 27–46. [Google Scholar] [CrossRef]
  34. He, W.; Jiang, R.; He, P.; Yang, J.; Zhou, W.; Ma, J.; Liu, Y. Estimating soil nitrogen balance at regional scale in China’s croplands from 1984 to 2014. Agric. Syst. 2018, 167, 125–135. [Google Scholar] [CrossRef]
  35. Li, S.; Jin, J. Characteristics of Nutrient Input/Output and Nutrient Balance in Different Regions of China. Sci. Agric. Sin. 2011, 44, 4207–4229. (In Chinese) [Google Scholar]
  36. Ma, J.; Liu, Y.; He, W.; He, P.; Haygarth, P.; Surridge, B.; Lei, Q.; Zhou, W.J.S.U. The long-term soil phosphorus balance across Chinese arable land. Soil Use Manag. 2018, 34, 306–315. [Google Scholar] [CrossRef]
  37. Wang, X.; Feng, A.; Wang, Q.; Wu, C.; Liu, Z.; Ma, Z.; Wei, X. Spatial variability of the nutrient balance and related NPSP risk analysis for agro-ecosystems in China in 2010. Agric. Ecosyst. Environ. 2014, 193, 42–52. [Google Scholar] [CrossRef]
  38. Dai, Y.; Chen, L.; Zhang, P.; Xiao, Y.C.; Hou, X.S.; Shen, Z.Y. Construction of a cellular automata-based model for rainfall-runoff and NPS pollution simulation in an urban catchment. J. Hydrol. 2019, 568, 929–942. [Google Scholar] [CrossRef]
  39. Kong, Z.; Ling, H.; Deng, M.; Han, F.; Yan, J.; Deng, X.; Wang, Z.; Ma, Y.; Wang, W. Past and projected future patterns of fractional vegetation coverage in China. Sci. Total Environ. 2023, 902, 166133. [Google Scholar] [CrossRef]
  40. Zhang, K.L.; Shu, A.P.; Xu, X.L.; Yang, Q.K.; Yu, B. Soil erodibility and its estimation for agricultural soils in China. J. Arid. Environ. 2008, 72, 1002–1011. [Google Scholar] [CrossRef]
  41. Han, X.; Xiao, J.; Wang, L.; Tian, S.; Liang, T.; Liu, Y. Identification of areas vulnerable to soil erosion and risk assessment of phosphorus transport in a typical watershed in the Loess Plateau. Sci. Total Environ. 2021, 758, 143661. [Google Scholar] [CrossRef]
  42. Shi, Y.; Yang, S.; Zhang, L.; Chen, W.; Fan, Y.; Lu, L.; Chen, H.; Zhang, C. Forecasting and advancing water carrying capacity in Henan Province in China: Application of ‘four determinations with water’ in AHP and SD modeling. Sci. Total Environ. 2024, 919, 170757. [Google Scholar] [CrossRef] [PubMed]
  43. Guan, X.; Tao, Y.; Chen, H.; Chang, X. Assessing risk and governing of agricultural non-point source pollution in Three Gorges Reservoir Areas. Trans. CSAE 2023, 39, 200–210. (In Chinese) [Google Scholar] [CrossRef]
  44. Ma, H.; Lei, Q.; Du, X.; Yan, T.; Pei, W.; Zhang, T.; Li, Y.; Luo, J.; Zhou, J.; Liu, H. Spatio-temporal variation and the impacts from parameters analysis of net anthropogenic phosphorus inputs in Henan province. China Environ. Sci. 2022, 42, 1318–1326. (In Chinese) [Google Scholar] [CrossRef]
  45. Cui, Y.; Zhang, Z.; Wang, C.; Ma, Z.; Luo, F.; Zhang, M. Surface soil distribution of phosphorus fractions in the Yellow River Delta. J. Beijing Norm. Univ. 2021, 57, 59–68. (In Chinese) [Google Scholar] [CrossRef]
  46. Kacprzak, M.; Neczaj, E.; Fijalkowski, K.; Grobelak, A.; Grosser, A.; Worwag, M.; Rorat, A.; Brattebo, H.; Almas, A.; Singh, B.R. Sewage sludge disposal strategies for sustainable development. Environ. Res. 2017, 156, 39–46. [Google Scholar] [CrossRef]
  47. Derx, J.; Kılıç, H.S.; Linke, R.; Cervero-Aragó, S.; Frick, C.; Schijven, J.; Kirschner, A.K.T.; Lindner, G.; Walochnik, J.; Stalder, G.; et al. Probabilistic fecal pollution source profiling and microbial source tracking for an urban river catchment. Sci. Total Environ. 2023, 857, 159533. [Google Scholar] [CrossRef]
  48. Lv, J. Phosphorus leaching from agricultural soils and its prediction. Acta Ecol. Sin. 2003, 23, 2689–2701. [Google Scholar]
  49. Tilahun, A.B.; Dürr, H.H.; Schweden, K.; Flörke, M. Perspectives on total phosphorus response in rivers: Examining the influence of rainfall extremes and post-dry rainfall. Sci. Total Environ. 2024, 940, 173677. [Google Scholar] [CrossRef]
  50. Chen, L.; Guo, C.; Zhu, K.; Wang, Y.; Pu, Y.; Li, J.; Lv, M.; Sun, C.; Shen, Z. Size-dependent of phosphorus loss and migration driven by rainfall: Evidences from observation and stochastic simulation. Agric. Ecosyst. Environ. 2024, 375, 109220. [Google Scholar] [CrossRef]
  51. Fan, B.; Wang, H.; Zhai, L.; Li, J.; Fenton, O.; Daly, K.; Lei, Q.; Wu, S.; Liu, H. Leached phosphorus apportionment and future management strategies across the main soil areas and cropping system types in northern China. Sci. Total Environ. 2022, 805, 150441. [Google Scholar] [CrossRef]
  52. Zhu, K.; Chen, Y.; Zhang, S.; Yang, Z.; Huang, L.; Lei, B.; Li, L.; Zhou, Z.; Xiong, H.; Li, X. Identification and prevention of agricultural non-point source pollution risk based on the minimum cumulative resistance model. Glob. Ecol. Conserv. 2020, 23, e01149. [Google Scholar] [CrossRef]
  53. Qiu, Y.; Zhang, Y.; Lan, P.; Liu, H.; Wang, H.; Wang, W.; Zhao, P.; Li, Y. Influence of Atmospheric Phosphorus and Nitrogen Sedimentation on Water Quality in the Middle Route Project of the South-to-North Water Diversion in Henan Province. Int. J. Environ. Res. Public Health 2022, 19, 14346. [Google Scholar] [CrossRef] [PubMed]
Figure 1. The location (a), land use types (b), elevation (c), basins (d), soil types (e) and soil pH (f) of Henan Province.
Agriculture 14 01681 g001
Figure 2. The spatial distribution of influence factors. TP emission, soil TP content, average vegetation coverage, slope, soil erodibility, rainfall, and distance to water, respectively (ag).
Agriculture 14 01681 g002
Figure 3. TP emission in counties (a) and administrative divisions (b) in Henan Province.
Agriculture 14 01681 g003
Figure 4. Risk levels of P loss.
Agriculture 14 01681 g004
Figure 5. Distribution of sub-basins and water quality monitoring sections in Henan Province.
Agriculture 14 01681 g005
Figure 6. Relationship between P L R I and TP concentration at the sub-basin scale.
Agriculture 14 01681 g006
Table 1. Data sources and spatial scales.
Data TypeSpatial ScaleData Sources
Dem30 mResources and Environment Science and Data Center (https://www.resdc.cn, accessed on 11 November 2023).
Land use30 mResources and Environment Science and Data Center (https://www.resdc.cn, accessed on 11 November 2023).
NDVI250 mMODIS Data Products: MOD13Q1, NASA
(https://ladsweb.modaps.eosdis.nasa.gov, accessed on 1 March 2024).
Soil texture1000 mHarmonized World Soil Database
(https://www.fao.org/soils-portal/soil-survey/soil-maps-and-databases, accessed on 23 March 2024).
Soil TP content250 mNational Earth System Science Data Center
(https://www.geodata.cn, accessed on 27 March 2024).
Rainfall1000 mNational Earth System Science Data Center
(http://www.geodata.cn, accessed on 27 March 2024).
Fertilizer use, crop yield, crop sown area, etc.County scaleStatistical yearbook of cities in Henan Province
Water quality dataMonitoring stationsNational Water Quality Automatic Supervision Platform (https://szzdjc.cnemc.cn:8070/GJZ/Business/Publish/Main.html, accessed on 23 September 2024).
Table 2. Risk evaluation system for P loss risk in Henan Province.
Grading Values/FactorTP-e/(kg·km−2)R/
(mm)
S/
(°)
K/
(t·h·MJ1·mm−1)
FVCTP-c/(mg·kg−1)D (m)
10~300<7500~60~0.005>0.75<480>3000
2300~485750~10006~150.005~0.0130.60~0.75480~6401500~3000
3485~7551000~120015~250.013~0.0180.45~0.60640~780500~1500
4>755>1200>25>0.0180~0.45>780<500
Classification basisNatural breaksNatural breaksGrade standard of sloping farmlandLiterature and documents [29]Literature and documents [29]Soil nutrient classification standard and natural breaksLiterature and documents [22]
Disclaimer/Publisher’s Note: The statements, opinions and data contained in all publications are solely those of the individual author(s) and contributor(s) and not of MDPI and/or the editor(s). MDPI and/or the editor(s) disclaim responsibility for any injury to people or property resulting from any ideas, methods, instructions or products referred to in the content.

