Article

Integrated Analysis Reveals Genetic Basis of Growth Curve Parameters in an F2 Designed Pig Population Based on Genome and Transcriptome Data

1
Key Laboratory of Agricultural Animal Genetics, Breeding, and Reproduction of Ministry of Education, Huazhong Agricultural University, Wuhan 430070, China
2
The Cooperative Innovation Center for Sustainable Pig Production, Huazhong Agricultural University, Wuhan 430070, China
*
Authors to whom correspondence should be addressed.
Agriculture 2024, 14(10), 1704; https://doi.org/10.3390/agriculture14101704 (registering DOI)
Submission received: 29 July 2024 / Revised: 25 September 2024 / Accepted: 26 September 2024 / Published: 28 September 2024
(This article belongs to the Section Farm Animal Production)

Abstract

:
Appropriate growth curves can reflect more sophisticated growth patterns of animals than body weight, and thus, the identification of genes and variants related to the growth curve parameter traits contributes to revealing the fine growth and development characteristics of livestock. However, the ability of single genome-wide association analysis (GWAS) and transcriptome analyses to identify valuable genes and variants is limited. In this study, based on genome and transcriptome data, the growth curve parameter traits of hybrid pigs were analyzed, and a set of genes and variants were identified. The Gompertz–Laird growth curve model was optimized to reveal the growth pattern of F2 individuals of Duroc × Erhualian pigs over four time points. Five growth parameters were estimated, including initial body weight ( W 0 ) , instantaneous growth rate per day (L), coefficient of relative growth or maturing index (k), body weight at inflection point ( W i ) , and average growth rate (GR). These five parameters were subjected to a genome-wide association study, differential gene expression analysis, and weighted gene co-expression network analysis (WGCNA). In the study, 336 pigs were genotyped, and 39,494 SNP markers were used for each pig in the analysis. Thirty of these pigs were also included in the transcriptomics analysis. Based on genome and transcriptome data, the integrated analyses identified five putative SNPs (including INRA0056460 on chromosome X, DRGA0004151 on chromosome 3, INRA0056460 on chromosome X, H3GA0049324 on chromosome 17, and H3GA0037747 on chromosome 13) and 15 candidate genes (PDGFA, VEGFD, CSPP1, EFHC1, PIK3C3, ZZZ3, GCC2, MAPK14, ZPR1, ISG15, ANG, CEBPD, ZHX3, CTBP2, and MYNN). The functional analysis indicated that these candidate genes played important roles in cell division and differentiation, development and aging, and skeletal muscle and fat formation. Our results provide insight into the genetic mechanisms underlying the growth and development of hybrid pigs and offer a theoretical basis for genomic breeding.

1. Introduction

Growth is a complex quantitative trait with moderate–high heritability in pigs, and it is of great economic value [1,2]. Improving the growth or fattening efficiency of pigs is an important goal of pig genetic improvement. It has been reported that the fattening efficiency of pigs is significantly affected by the growth performance of piglets [3]. At present, there have been some genetic studies on immunity in piglets [4,5,6]. However, there is a lack of revelation of the genetic basis of the growth pattern of piglets. Traditional genetic studies of growth traits can be performed by analyzing animal body weight at representative time points or by analyzing growth performance indicators such as average daily gain in pigs [7,8]. Although quantitative trait locus (QTL) and genes related to growth traits detected by these two methods are helpful to animal breeding, they are not adequate to elucidate the growth patterns of animals. Since animal growth is nonlinear, the growth pattern can be explained by nonlinear functions, and these nonlinear functions with good fitting effects are defined as the growth curves [9]. These growth curve parameters such as instantaneous growth rate and maturity index display the growth characteristics of the animal. Genetic analysis based on these parameters helps to reveal the genetic basis of animal growth patterns [10].
It has been reported that the Gompertz model is one of the most commonly used growth curve models [11]. The complete growth curve of a pig is close to the S-shaped growth curve, and the Gompertz model can describe the growth pattern of pigs well. However, the original Gompertz model is dependent on mature weight, which cannot fit the growth curve well for a specific period, and thus an optimized model was developed by researchers, namely, the Gompertz–Laird model [12,13]. The Gompertz–Laird model is a flexible Gompertz model with a variable inflection point, and thus, it does not depend on mature weight [14]. At present, the Gompertz–Laird model has been successfully used to fit growth data of poultry, livestock, and marine animals [14,15,16].
A genome-wide association study (GWAS) has been widely used to reveal the genetic basis of growth patterns in common poultry and livestock such as chickens, cattle, pigs, and rabbits [10,14,17,18]. However, for the complex genetic structure of growth traits, traditional mixed linear model (MLM) statistical power is limited [19]. Liu et al. introduced FarmCPU as an improved multi-locus model, which improved statistical power and detected more candidate genes [20,21,22]. Subsequently, Huang et al. developed BLINK, which further improved the computational efficiency and statistical power of GWAS [23]. Despite the development of these powerful GWAS models, given the growth traits of complex genetic structure, a single GWAS model is still not widely applicable. Hence, the combination of these models for the genetic analysis of complex traits has gained increasing popularity [24,25].
GWAS uses genomic information to identify genetic variants associated with a target trait. However, there is often more than one gene in the genome region involved in the significant genetic variation, which is not conducive to the identification of candidate genes. An effective solution is to identify candidate genes based on both genome and transcriptome data [25,26]. Therefore, in this study, in order to reveal the genetic basis of the growth pattern of piglets, the genomic and transcriptomic data were integrated for genetic analysis based on the growth curve parameters of pigs during the corresponding period. This research filled the gap in the research regarding the genetic basis of the growth pattern of piglets and provided valuable information for improving the efficiency of pig growing.

2. Materials and Methods

2.1. Ethics Statement

All the animal experiments were approved by the Science Ethics Committee of Huazhong Agricultural University, China, following the protocols and guidelines (approval number: HZAUSW-2018-008).

2.2. Animal and Genotyping Data

The population utilized in this study consisted of a hybrid F2 population (containing 393 pigs) derived from hybridization between Duroc and Erhualian pigs [27]. All the animals were raised by Qingyuan Wenshi Pig Breeding Technology Co., Ltd. (Qingyuan City, Guangdong Province, China). Individual pig weight was measured at four time points, namely, day 1, 21, 35, and 80, respectively.
Genomic DNA was extracted from frozen ear or tail tissue samples (336 pigs). All the samples were genotyped by Illumina PorcineSNP60 BeadChip, and a total of 62,163 SNPs were obtained. Quality control (QC) of the resultant SNPs was performed using PLINK1.9 [28]. The SNPs with a call rate < 0.95 were excluded from the analysis. Subsequently, missing genotype data were imputed using Beagle5.4 software [29]. Then, SNPs with a minor allele frequency (MAF) < 0.01 were excluded. After genotype data processing, 39,494 SNPs were retained for subsequent analysis.

2.3. Animals and Transcriptome Data

This study used the transcriptome data published in our previous studies [27,30]. The RNA was extracted from blood samples collected from the anterior vena cava of piglets at the age of 33 days, and RNA tagging and hybridization were performed at a commercial Affymetrix array service company (GeneTech Biotechnology Limited Company, Shanghai, China). Raw expression data were processed and normalized using the Robust Multichip Average methods [31]. Affymetrix Pig microarray was annotated using the Affymetrix Pig Genome Array Annotation file (Release 36, https://www.affymetrix.com/index.affx, accessed on 26 February 2024). Pipeline was carried out in an R environment. Firstly, the affy package was used to process chip data, and then an annotation file was used to obtain the gene expression matrix [32]. The transcriptome data were derived from 30 individual hybrid F2 pigs with genotyping, and 10,261 genes were annotated.

2.4. Growth Curve Construction

The Gompertz–Laird model was used to fit the growth curve based on the 336 pigs with genotyping. Five estimated growth curve parameters were used as parameter traits, namely, initial body weight (W0), instantaneous growth rate per day (L), coefficient of relative growth or maturing index (k), body weight at inflection point (Wi), and average growth rate (GR). The statistical functions of the Gompertz–Laird model and growth curve parameters are presented in Table 1.

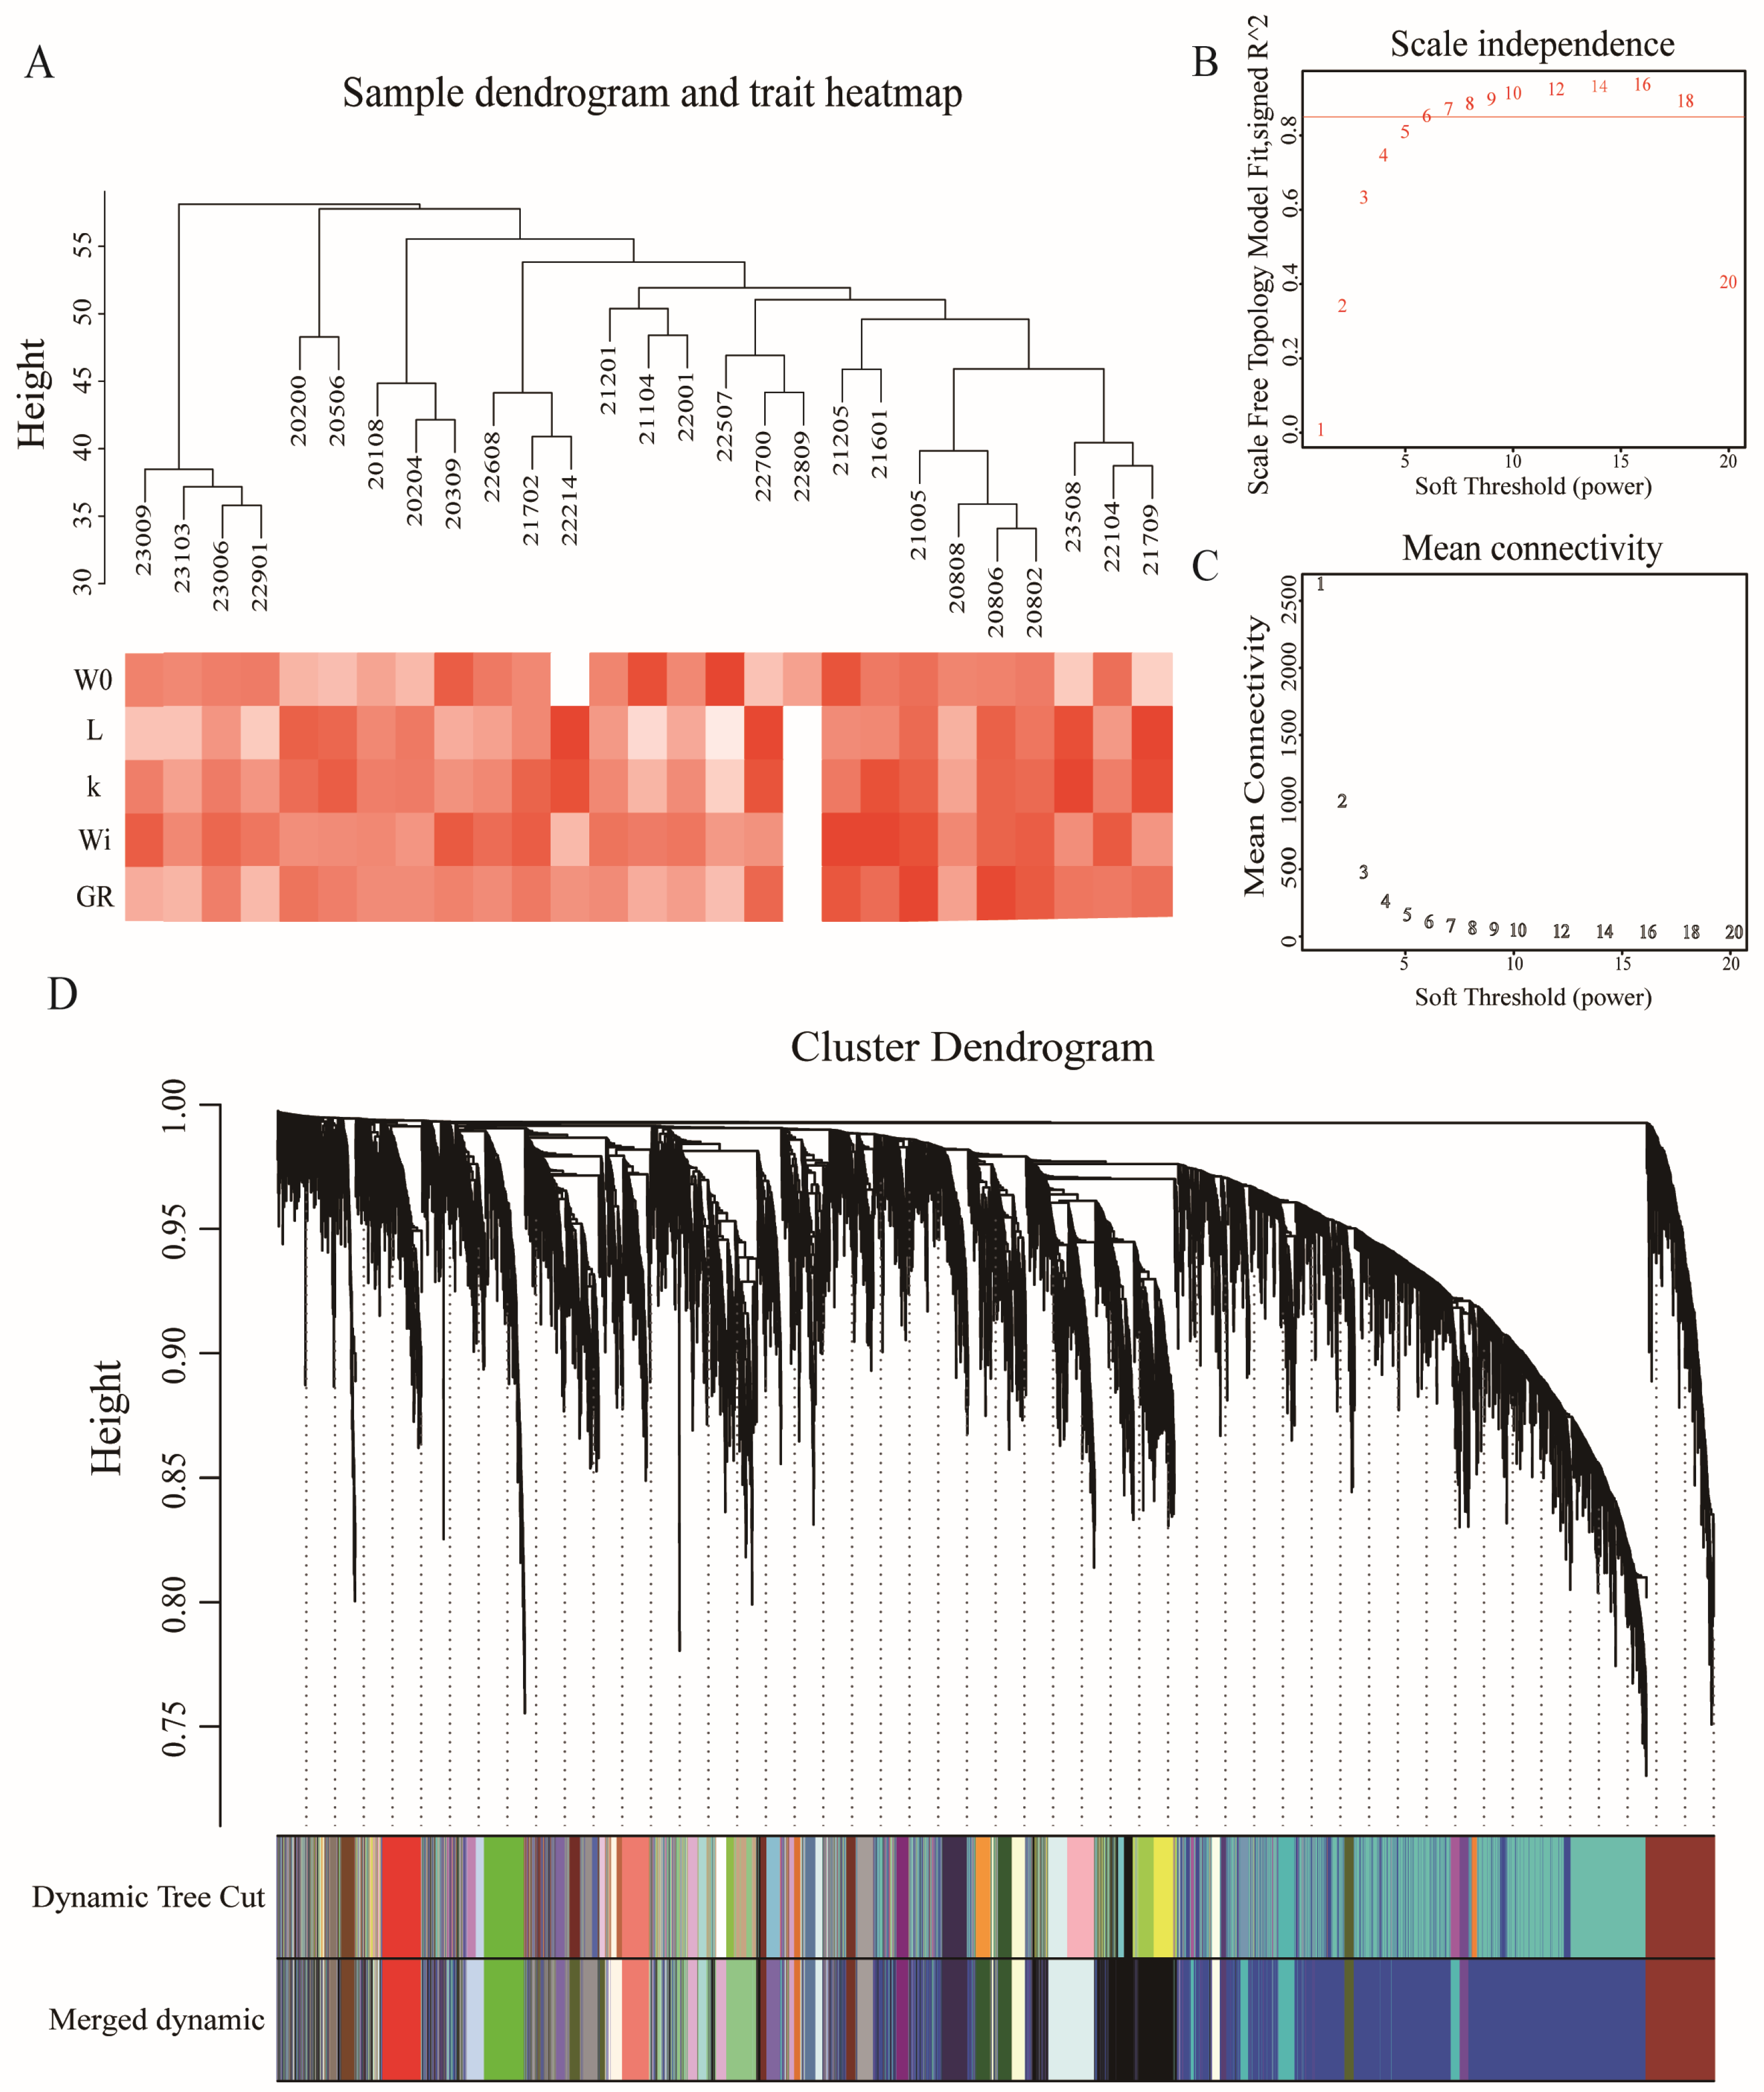
2.5. Weighted Gene Co-Expression Network Analysis (WGCNA)

We used the R package WGCNA to construct the gene co-expression network [33]. Firstly, 10,261 genes and 30 samples were assessed as available, and 3 outliers were removed from samples by sample clustering. Secondly, the optimal soft threshold was selected. Based on this optimal soft threshold, we constructed an adjacency matrix (power = 6) to describe the correlation strength between nodes and then transformed the adjacency matrix into a topological overlap matrix (TOM). The TOM matrix is a method to quantitatively describe the similarity between two nodes by comparing their weighted correlation with other nodes. Next, hierarchical clustering was performed to identify the modules, with each module containing at least 30 genes (minClusterSize = 30). Afterward, we calculated the similarity of module eigengenes, hierarchically clustered the modules, and merged similar modules (abline = 0.2). The gene set with high topological overlap similarity was defined as a module, and in the same module, genes tended to be highly co-expressed. Further, we identified the co-expression modules most associated with target traits and selected the most important genes in the modules as WGCNA candidate genes (WCGs). Candidate genes were identified by the correlation (module membership, MM) between in-module gene expression and the eigenvalue of the module as well as the correlation (gene significance, GS) between in-module gene expression and the corresponding phenotype, with the threshold values of MM > 0.8 and GS > 0.2 [34].

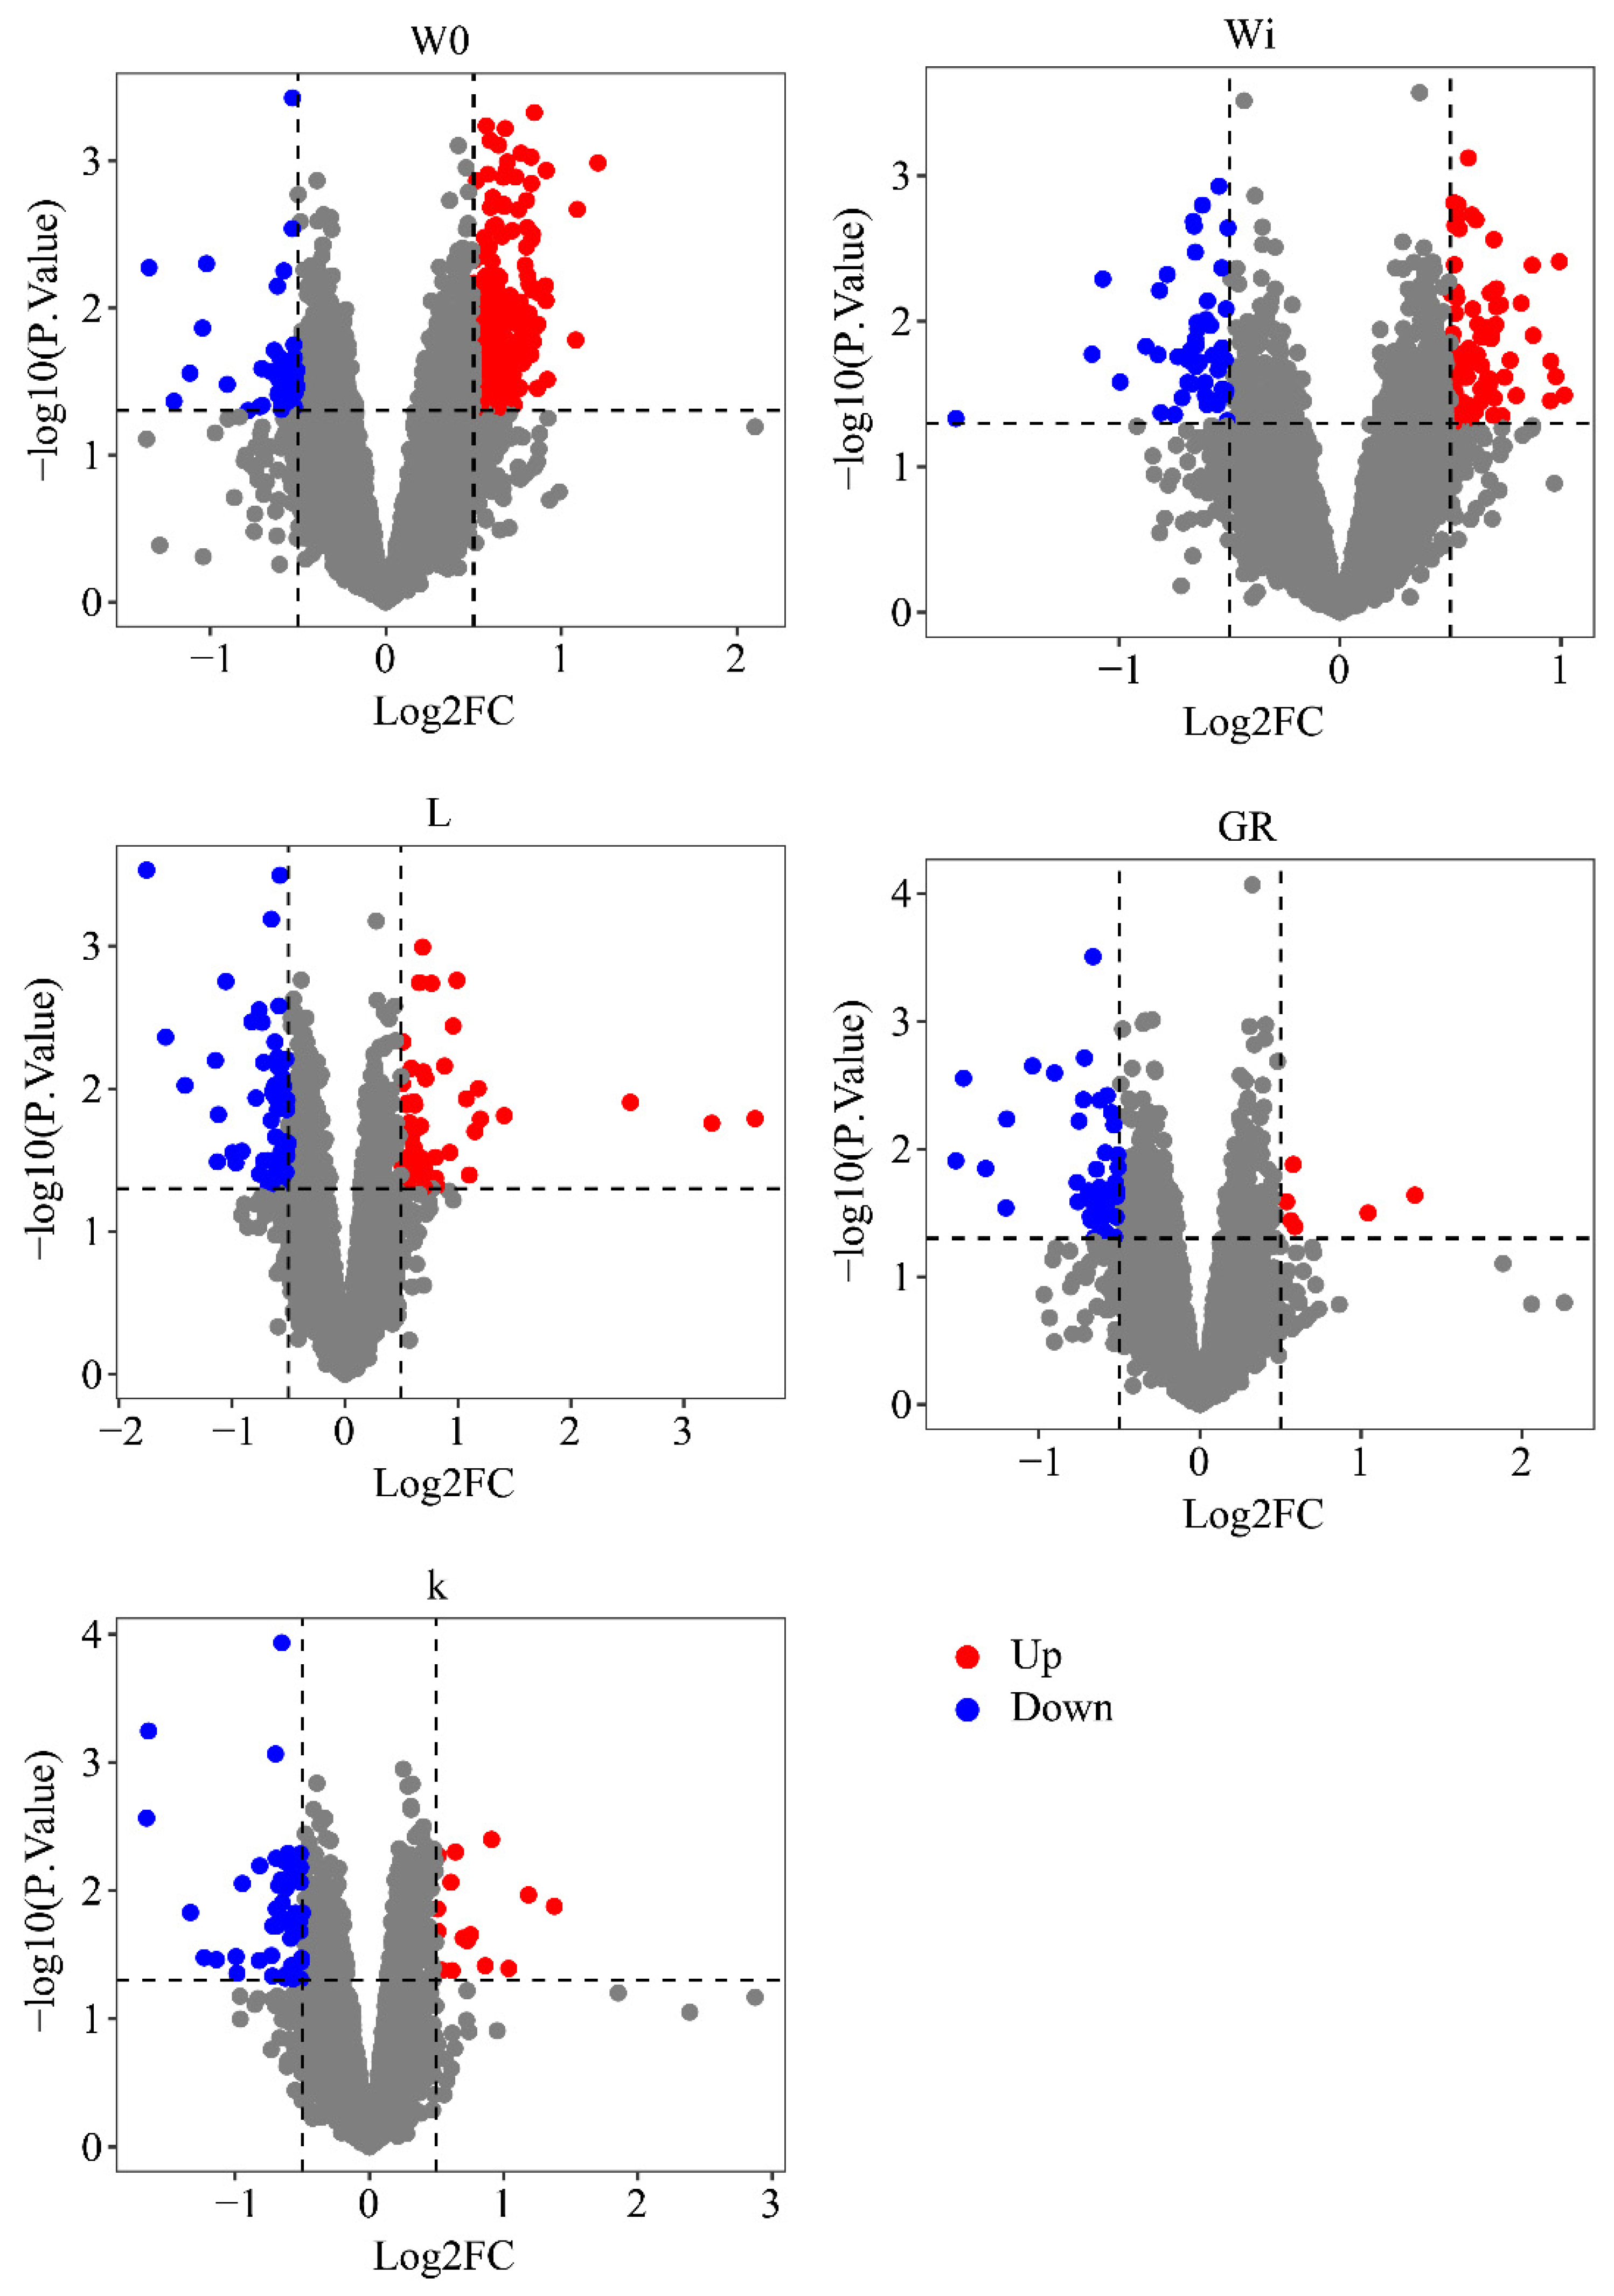
2.6. Differential Gene Expression Analysis

For each parameter trait, all individuals (30 pigs with both transcriptome and genome information) were ranked based on their trait values. Ten extreme individuals were then selected from both ends of the distribution for each parameter trait, and these selected individuals (20 pigs) were categorized into high (treatment) and low (control) groups for subsequent differential gene expression analysis. Differentially expressed genes (DEGs) were identified by empirical Bayes correction using limma packages with the threshold of p < 0.05 and log-fold change |(log2FC)| > 0.5 [35].

2.7. Genome-Wide Association Analysis

In this study, the genome-wide association studies (GWAS) were performed using the FarmCPU [20] and BLINK [23] models in R packages rMVP [36] and GAPIT [37]. The genome-wide significance thresholds were set as p = 0.05/N and p = 0.01/N, respectively, where N represented the number of SNPs. To avoid overlooking potential linkage signals, the threshold for suggestive association was set as p = 1/N, where N represented the number of SNPs. An intersection strategy was employed to reduce false positives, in which the overlapped significant SNPs from both models (FarmCPU and BLINK) were defined as the final significant SNPs. The significant GWAS genes (SGGs) within 1 Mb segments surrounding each significant SNP were detected using the biomaRt (v2.58.2) package [38].

2.8. Gene Ontology Enrichment Analysis

Gene Ontology (GO) enrichment analysis was carried out by clusterProfiler package [39]. We integrated WCGs, DEGs, and SGGs as the overall gene set, and then performed GO enrichment analysis. Subsequently, GO terms containing SGGs were screened for the candidate gene identification.

2.9. Identification of Candidate Genes

The GO terms containing SGGs were named the SGH-GO terms (Figure S2). Genes involved in more biological processes associated with the trait may play a more important role in the regulation of the trait. For each trait, the top 5 genes with the highest enrichment frequency (terms ratio) in the relevant biological processes (BP) SGH-GO terms were defined as candidate genes, and the genes with the same enrichment frequency as the top 5 genes were also defined as candidate genes (Figure S2).

3. Results

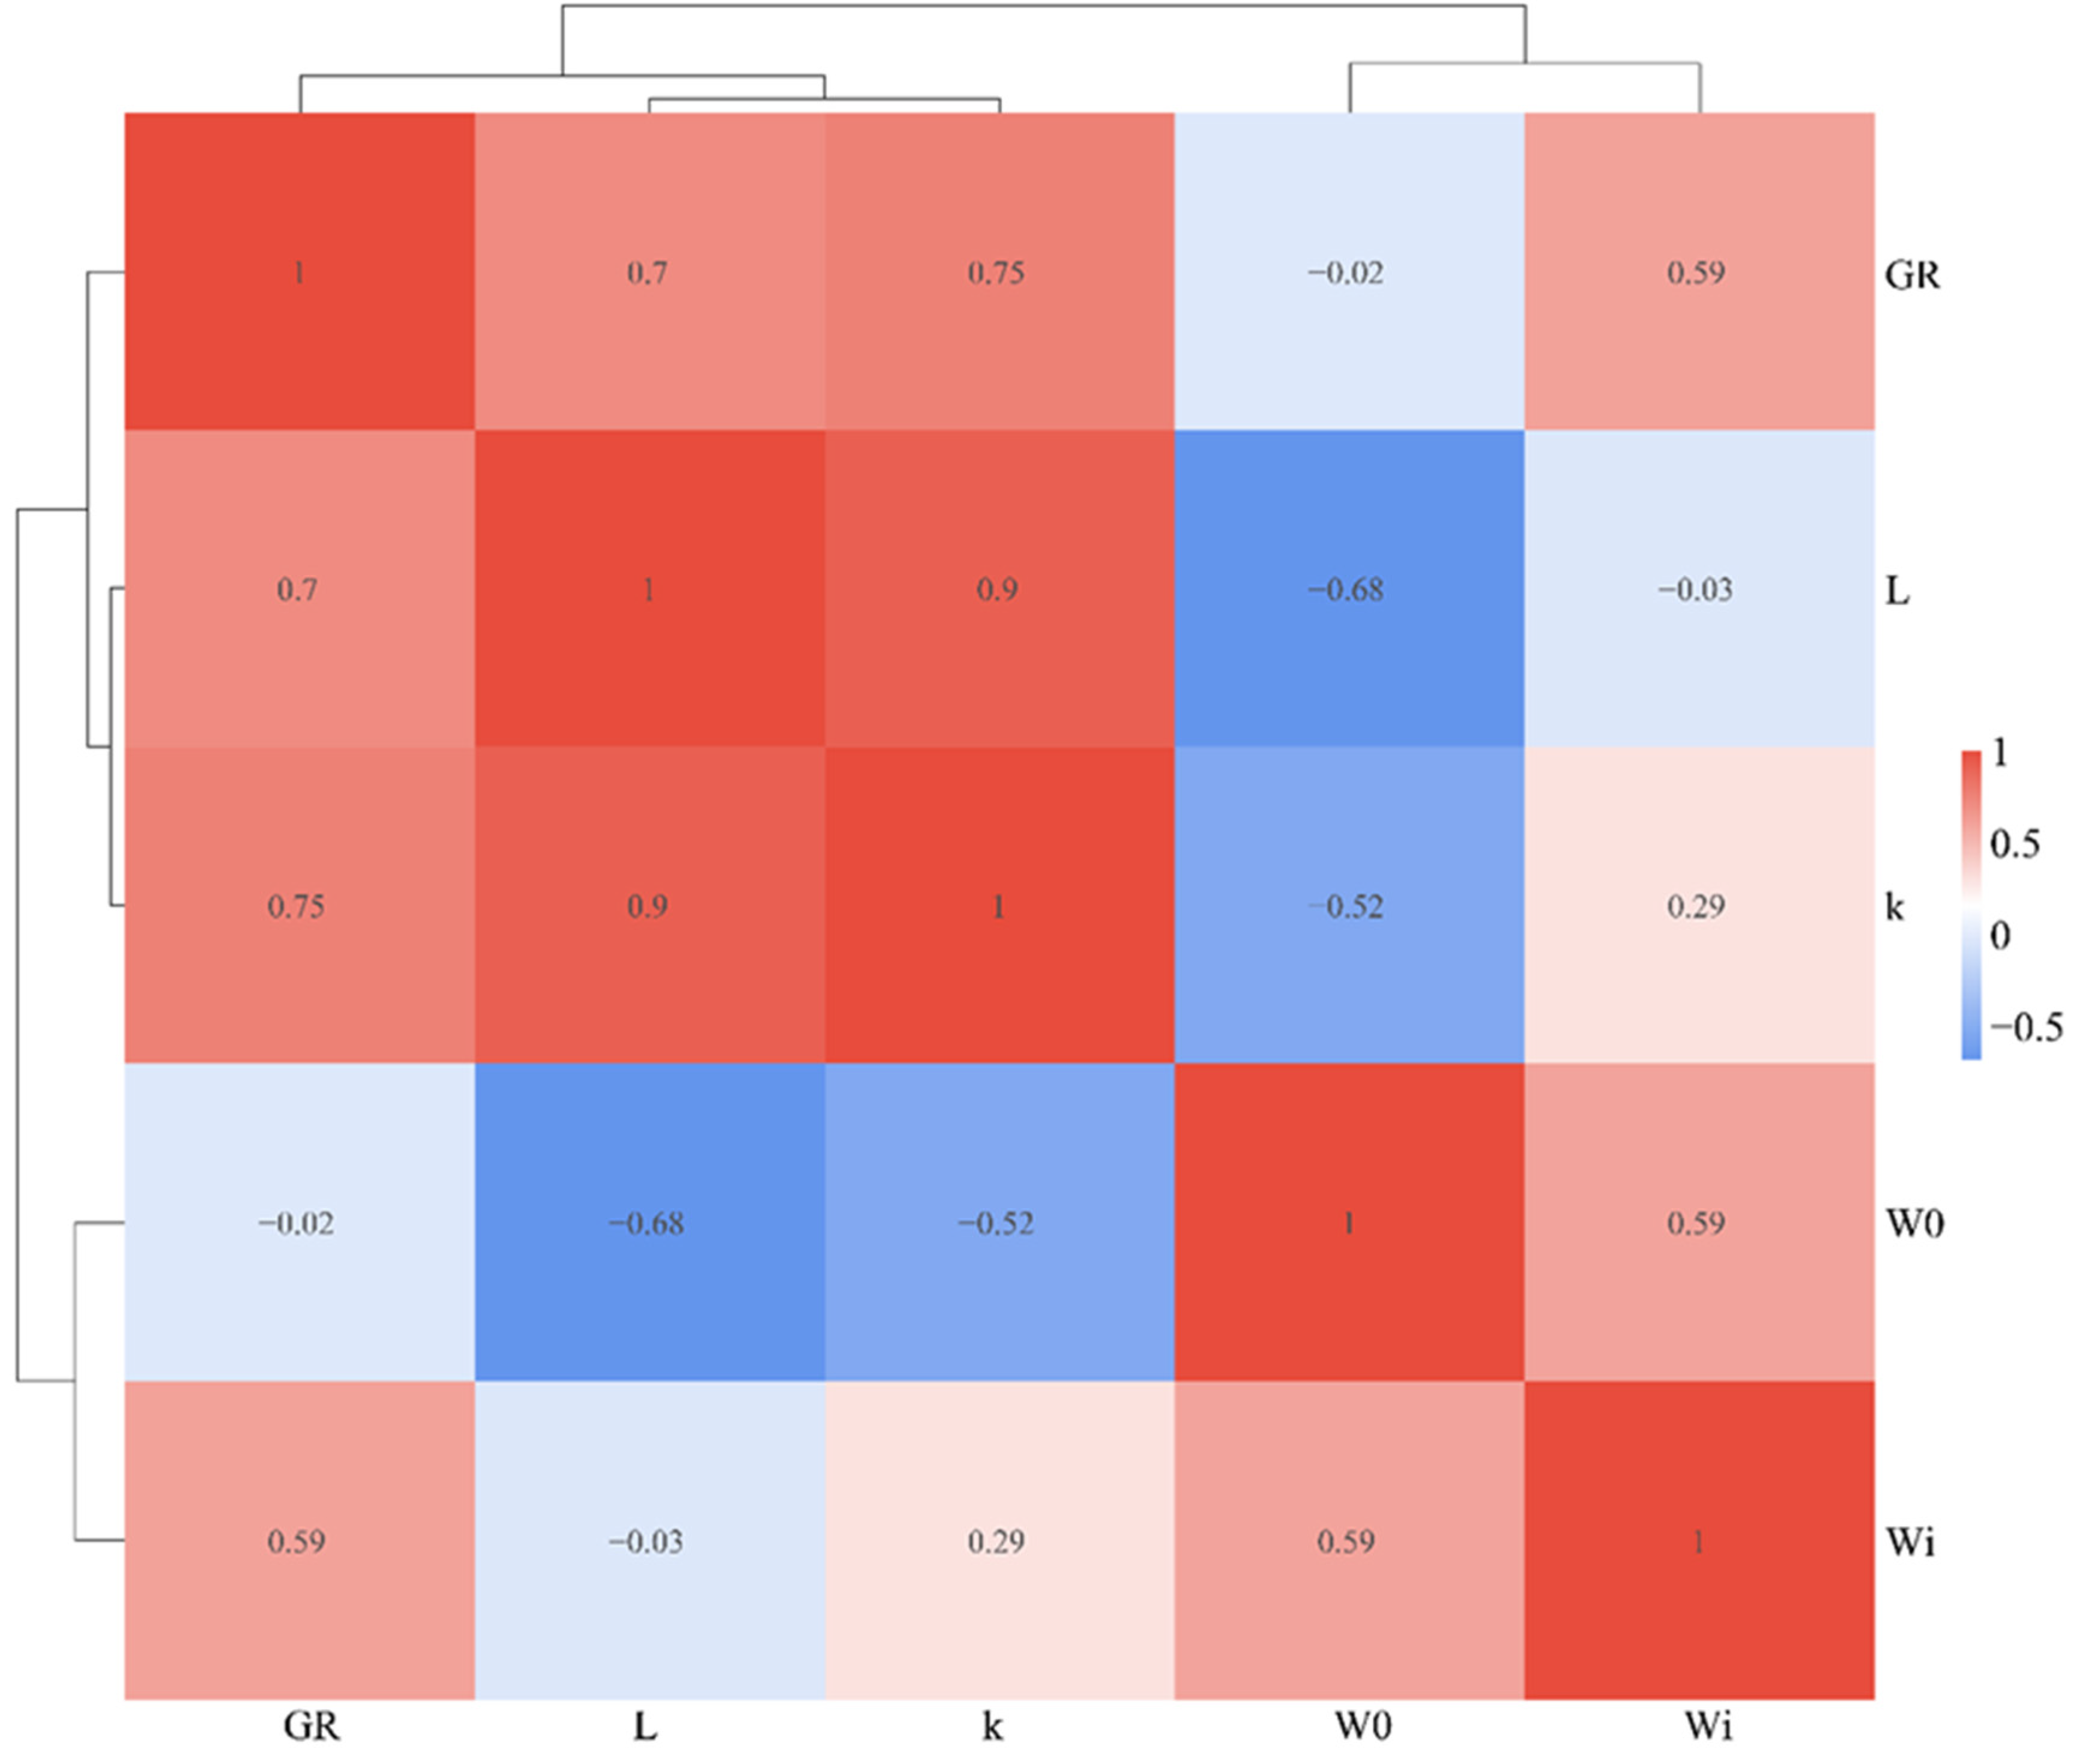
3.1. Growth Curve Fitting and Definition of Parameter Traits

The fitness indices ( R 2 and a d j   R 2 ) of the Gompertz–Laird model were higher than 0.99 (Table 1), indicating that these growth curves were properly fitted by this nonlinear growth curve model [40]. The descriptions of the growth curve parameter traits are presented in Table 2. Using the BGLR package, the heritability of the five parameter traits was estimated to range from 0.31 to 0.49 [41]. The histograms of five parameter traits are shown in Figure S1, and the data of five parameter traits conformed to normal distribution. Pearson correlations of growth curve parameters are shown in Figure 1. It has been reported that traits with a correlation coefficient > 0.8 are considered the same traits [42], while other researchers disagreed with this view [14], and thus, we further analyzed these five traits separately.

3.2. Significant SNPs and Nearby Genes Identified by GWAS

The significant SNPs associated with the five traits were identified using two GWAS models (FarmCPU and BLINK), respectively (Figure 2). To reduce false positives, the overlapped significant and suggestive SNPs identified by FarmCPU and BLINK were defined as putative SNPs. A total of five putative SNPs were obtained (INRA0056460 on chromosome X, DRGA0004151 on chromosome 3, INRA0056460 on chromosome X, H3GA0049324 on chromosome 17, and H3GA0037747 on chromosome 13). These five overlapped putative SNPs associated with growth curve parameters and their nearby 30 genes were identified by FarmCPU and BLINK (Table 3). For the parameter trait initial body weight ( W 0 ) , one genome-wide significant SNP (INRA0056460) was detected on chromosome X. The INRA0056460 was extremely significant in both FarmCPU and BLINK. For the parameter trait body weight at the inflection point ( W i ) , H3GA0037747 was detected on chromosome 13.
For the parameter trait instantaneous growth rate ( L ) , 3 genome-wide significant SNPs (DRGA0004151, H3GA0049324, and INRA0056460) were detected on chromosome 3, 17, and X, respectively. DRGA0004151 was significant in FarmCPU, but it was suggestive in BLINK. INRA0056460 was significant in FarmCPU and extremely significant in BLINK. Notably, H3GA0049324 was found to be associated with both parameter traits L and k , and it was extremely significant in both FarmCPU and BLINK, suggesting that H3GA0049324 might play an important role in the growth and development of Duroc × Erhualian F2 generation pigs. In addition, no key SNP was identified for parameter trait growth rate ( G R ) , which might be due to the small sample size.

3.3. WGCNA Candidate Genes and Differentially Expressed Genes Identified by Transcriptome Analysis

The 10,261 gene expression matrix for each parameter trait was obtained after data preprocessing. We used the hierarchical cluster method to cluster the samples and retained 27 samples. After removing outliers, a sample clustering tree was plotted (Figure 3A). The soft threshold was set as 6 according to the scale-free index (Figure 3B) and mean connectivity (Figure 3C) of various soft thresholds to construct a scale-free network. Subsequently, the adjacency matrix and the topological overlap matrix were constructed. Finally, 32 modules were identified based on average hierarchical clustering and dynamic tree clipping results (Figure 3D). One or two modules most relevant to each trait were selected for the identification of WGCNA candidate genes (WCGs) (Figure 4). The identified candidate genes were presented in Tables S1–S5.
All individuals were ranked according to the values of the trait, and the top ten and bottom ten individuals were separately selected for subsequent analysis. The selected individuals were divided into high-value and low-value groups for subsequent differential gene expression analysis. A total of 289, 109, 68, 128, and 46 DEGs in the comparison of the high-value group vs. low-value group were identified for W 0 , L , k , W i , and G R , respectively (Figure 5; Tables S6–S10).

3.4. Integrated Analysis of Genome and Transcriptome Data and Gene Function Annotation

Since a single omics analysis tends not to thoroughly reveal the genetic basis of a trait, we combined genomic and transcriptomic data to identify key genes influencing the parameter traits. Firstly, WGCNA candidate genes (WCGs), differentially expressed genes (DEGs), and significant GWAS genes (SGGs) were integrated as an overall gene set, and then GO enrichment analysis was performed based on this overall gene set (Tables S11–S15). In this study, the genes surrounding each of the key SNPs were defined as SGGs. Subsequently, GO terms containing SGGs were screened for the identification of candidate genes, and the GO terms hit by SGGs were named SGH-GO terms.
For traits W 0 , L , k , and W i , 6, 16, 4, and 2 SGH-GO terms were screened, respectively (Tables S16–S19). GO enrichment analysis results showed that the selected genes were involved in multiple biological processes related to growth and development such as cell division, osteoblast differentiation, protein transport, and immunological biological processes (mainly including adaptive immune response and leukemia-related biological processes) (Figure 6). We selected the top five genes with the highest enrichment frequency in the relevant biological processes (BP) SGH-GO terms as candidate genes, and the genes with the same enrichment frequency as the top 5 genes were also defined as candidate genes (Table 4). A total of 15 candidate genes were identified. Trait L and trait k were highly correlated (0.9), and the candidate genes related to trait k were contained in the SGH-GO term enrichment gene set related to trait L . However, the candidate genes related to these two traits were different, suggesting that the highly correlated traits may still have a different genetic basis. In addition, an interesting phenomenon is that candidate genes from DEGs are up-regulated in the high-value group, suggesting a positive role of these genes in pig growth and development (Table S20).

4. Discussion

Although GWAS has been widely used in the genetic anatomy of complex traits, false positive is a long-standing problem in GWAS, especially when the sample size is insufficient. Compared with a classical single-point GWAS method such as MLM, multi-site GWAS can control false positive variation [43,44,45]. In addition, previous research has indicated that when multiple GWAS methods are used to analyze the same dataset, putative SNPs jointly determined by multiple methods tend to be more reliable [46,47]. In this study, 31 and 16 significant SNPs were identified by FarmCPU and BLINK, respectively, of which five overlapped SNPs were determined as candidate markers (INRA0056460, DRGA0004151, INRA0056460, H3GA0049324, and H3GA0037747). W 0 and W i belong to body weight traits, and one SNP marker was identified to be associated with each of them. For trait L , three candidate SNP markers were identified. Notably, H3GA0049324 located on chromosome 17 was associated with both L and k , which were growth-rate traits, underscoring the potential of this marker. At present, a common method for identifying candidate genes is to select genes near significant SNPs in GWAS, and the distance threshold is usually set at 1 Mb [7,14,48,49]. Therefore, in the study, the genes around these five SNP markers (1 Mb upstream or downstream) were included in subsequent integrated analyses as significant GWAS genes (SGGs).
Based on transcriptome data, differential gene expression analysis and WGCNA were performed to identify DEGs and WCGs, respectively. Transcriptome analysis can identify the actively expressed genes related to the trait of interest [50]. Since the expression profile chip does not cover all the genes, it is difficult to directly overlap them with SGGs for the identification of candidate genes. In this study, a new combination analysis strategy was adopted to integrate SGGs, DEGs, and WCGs for GO enrichment analysis, and then the GO terms hit by SGGs (SGH-GO terms) were identified. The genes enriched in the SGH-GO terms were significantly related to growth, development, and immunobiological processes. Further, we screened the candidate genes according to the enrichment frequency of genes in the biological processes (BP) SGH-GO terms and finally obtained 15 candidate genes (VEGFD, PDGFA, CSPP1, EFHC1, PIK3C3, ZZZ3, MYNN, CTBP2, GCC2, MAPK14, ZPR1, ISG15, ANG, ZHX3, and CEBPD).
For trait W 0 , six candidate genes were identified, including VEGFD, PDGFA, CSPP1, EFHC1, PIK3C3, and ZZZ3, five of which were derived from DEGs and one from SGGs. The vascular endothelial growth factor (VEGF) family and platelet-derived growth factor (PDGF) family are two major families of tertiary vascular growth factors with close evolutionary relationships [51,52], and our identified two top candidate genes VEGFD and PDGFA (in terms of enrichment frequency) belonged to these two families, respectively. VEGFD has been reported to have both angiogenic and lymphangiogenic activity in porcine skeletal muscle [53]. PDGFA has been found to be involved in human testicular development [54], and in this study, PDGFA was identified to be associated with the initial body weight trait ( W 0 ) , suggesting the potential role of PDGFA in early growth and development of pigs. The two candidate genes (VEGFD and PDGFA) associated with W 0 were enriched in the entries related to cell division and fibroblast proliferation, which were consistent with gene functions, suggesting their important roles in the early growth and development of piglets.
Four other candidate genes associated with W 0 , although relatively infrequently enriched, also play potentially important roles in weight regulation. Two splice isoforms of CSPP1 have been identified, whose functions include cell division, cilia formation, cell cycle control, and other biological processes necessary for animal growth [55,56,57,58]. A study of rats has indicated that EFHC1 regulates cell division and cortical development [59]. PIK3C3 is involved in pig body weight regulation such as anti-lipolysis and glucose output in the liver and muscle systems [60]. A genome-wide meta-analysis has revealed that ZZZ3 is associated with human obesity, highlighting its importance for pig body weight [61]. Interestingly, EFHC1, as a specific duplicated gene in pigs, is associated with the differentiation of wild boar and domestic pig populations, but there have been limited reports on its function in pigs [62].
For parameter trait body weight at the inflection point ( W i ), two candidate genes MYNN and CTBP2 were identified. MYNN is highly expressed in porcine cerebellum, stomach, and longissimus dorsi, implying its important role in digestion, absorption, and skeletal muscle growth [63]. Another study has demonstrated that the depletion of MYNN reduces BMP signaling activity, in turn affecting bone formation, bone development, and other processes [64,65]. The bone is the scaffold of the body tissue and develops before muscle and fat. MYNN may be important for bone development in piglets. Bone development is bound to affect fattening efficiency, which suggests the potential role of MYNN in improving fattening efficiency. CTBP2 promotes adipogenesis and regulates body size and development [66,67]. In another study, CTBP2 is identified as a candidate gene related to pork quality improvement and multiple muscle pathological processes such as muscle atrophy and malnutrition [68]. These findings collectively suggest that CTBP2 might play an important role in the body weight and meat quality traits of pigs.
Among the growth parameter traits, L and k are two key traits. In this study, GCC2, MAPK14, ZPR1 and ANG were identified as candidate genes related to trait L , exerting important functions at the cellular level to maintain the life activities of the organism. In enrichment analysis, these genes were enriched into items such as phosphatase activity, protein transport, and osteoblast differentiation, suggesting their important role in piglet growth and immune processes. Of these identified candidate genes, GCC2 participates in Golgi structure maintenance [69]; MAPK14 is involved in cell survival, apoptosis, proliferation, differentiation and migration of different types of cells [70]; ZPR1 is associated with transcriptional defects and cell cycle progression [71]; and ANG encodes the ribonuclease 5 protein, which can regulate protein levels and inhibit cell apoptosis [72,73,74]. In this study, ISG15 was also identified as a candidate gene, and this gene has been reported to be an important regulatory factor in the immune pathway, playing an important role in regulating antiviral activity [75,76]. Before the growth period in pigs, they have experienced weaning, transport and other conditions that make them prone to stress and infection, so the growth process inevitably activates genes and immune genes that play necessary roles at the cellular level to resist external stimuli.
Maturity index k is a growth rate-related trait, which has important implications for animal production. In this study, CEBPD and ZHX3 were identified as candidate genes related to trait k . In pigs, the transcription factor beta (CEBPD) promotes the synthesis of triglycerides by inhibiting the expression of the FGF21 gene [77]. ZHX3 from the zinc-fingers and homeoboxes (ZHX) family is associated with human development, aging, and osteoblast differentiation, which is consistent with the results of enrichment analysis [78,79,80,81]. Considering its important functions in humans, ZHX3 is worthy of further study as a candidate gene in piglets.
In summary, previous studies have confirmed or implied the important roles of the above-mentioned candidate genes associated with the growth curve parameters of piglets in the growth and development process. Among them, the role of MYNN in bone formation and development suggests its important and unique role in piglets. In addition, several candidate genes, such as PDGFA, EFHC1 and ZZZ3, were found to be involved in growth and development in other species, suggesting a potential effect of these genes on growth and development in piglets. Pig growth is a complex and continuous process, and thus there is a high probability that numerous candidate genes associated with standard growth and development were identified. Although it is hard to clearly determine whether these candidate genes are stage-specific regulatory genes in piglets (or perform stage-specific functions), the findings of this study provide valuable insights into the revealed genetic basis of piglets and provide information for improving the fattening efficiency in practical production.

5. Conclusions

Our genetic analysis of growth curve parameters in piglets has successfully identified several SNPs and candidate genes associated with parametric traits. These findings offer valuable information regarding the revealing genetic mechanisms of pig growth patterns during the piglet period. Such knowledge can be utilized to support the formulation of pig-breeding strategies with high fattening efficiency and can also provide a preliminary foundation for exploring the genetic factors influencing the fattening efficiency of pigs.

Supplementary Materials

The following supporting information can be downloaded at: https://www.mdpi.com/article/10.3390/agriculture14101704/s1, Figure S1: Histogram of growth curve parameters traits; Figure S2: Integrated analysis process; Tables S1–S5: List of genes in the WGCNA important module and WGCNA candidate genes for parametric trait W0, L, k, Wi, GR; Tables S6–S10: Differentially expressed genes identified for parameter trait W0, L, k, Wi, GR; Tables S11–S15: GO enrichment terms based on the overall gene set for parameter trait W0, L, k, Wi, GR; Tables S16–S19: SGH-GO terms for parameter trait W0, L, k, Wi; Table S20: The candidate genes from DEGs.

Author Contributions

Conceptualization, M.Z., Y.Z. and Z.C.; methodology, Z.C. and J.Q.; software, Z.C., J.Q. and F.X.; formal analysis, Z.C. and Y.Z.; investigation, M.Z., Y.Z. and Z.C.; resources, Y.Z. and M.Z.; data curation, Z.C., J.Q. and F.X.; writing—original draft preparation, Z.C., J.Q., Y.Z. and M.Z.; writing—review and editing, Z.C. and M.Z.; visualization, Z.C. and J.Q.; supervision, M.Z. and Y.Z.; project administration, M.Z. and Y.Z.; funding acquisition, M.Z., Y.Z. and X.L. All authors have read and agreed to the published version of the manuscript.

Funding

This research was funded by the Natural Science Foundation of China grant number 31961143020, the National Key Research and Development Program of China grant number 2021YFD1301201, the Fundamental Research Funds for the Central Universities (2662022DKQD002), and the Earmarked Fund for China Agriculture Research System grant number CARS-35.

Institutional Review Board Statement

The study was conducted in accordance with the Declaration of Helsinki and approved by the Institutional Review Board of Huazhong Agricultural University (approval number: HZAUSW-2018-008).

Data Availability Statement

The genotype and gene expression data in this study are accessible on figshare (http://doi.org/10.6084/m9.figshare.26412913, accessed on 16 September 2024). The phenotype data are not publicly accessible due to their sourcing from Guangdong Wenshi Pig Breeding Technology Co., Ltd., but they can be obtained from the corresponding author upon reasonable request.

Conflicts of Interest

The authors declare no conflicts of interest.

References

  1. Fontanesi, L.; Schiavo, G.; Galimberti, G.; Calò, D.G.; Russo, V. A genomewide association study for average daily gain in Italian Large White pigs. J. Anim. Sci. 2014, 92, 1385–1394. [Google Scholar] [CrossRef] [PubMed]
  2. Hoque, M.; Suzuki, K.; Kadowaki, H.; Shibata, T.; Oikawa, T. Genetic parameters for feed efficiency traits and their relationships with growth and carcass traits in Duroc pigs. J. Anim. Breed. Genet. 2007, 124, 108–116. [Google Scholar] [CrossRef] [PubMed]
  3. Guan, R.; Zheng, Z.; Yu, H.; Wu, L.; Huang, H.; Jiang, P.; Li, X. Identification of factors affecting fattening efficiency of commercial pig herds and analysis of their impact at different performance levels. Sci. Rep. 2024, 14, 20105. [Google Scholar] [CrossRef] [PubMed]
  4. Dervishi, E.; Bai, X.; Dyck, M.K.; Harding, J.C.S.; Fortin, F.; Dekkers, J.C.M.; Plastow, G. GWAS and genetic and phenotypic correlations of plasma metabolites with complete blood count traits in healthy young pigs reveal implications for pig immune response. Front. Mol. Biosci. 2023, 10, 1140375. [Google Scholar] [CrossRef] [PubMed]
  5. Ibragimov, E.; Eriksen, E.; Nielsen, J.P.; Jørgensen, C.B.; Fredholm, M.; Karlskov-Mortensen, P. Towards identification of new genetic determinants for post-weaning diarrhea in piglets. Anim. Genet. 2024, 55, 387–395. [Google Scholar] [CrossRef] [PubMed]
  6. Lunney, J.K.; Steibel, J.P.; Reecy, J.M.; Fritz, E.; Rothschild, M.F.; Kerrigan, M.; Trible, B.; Rowland, R.R. Probing genetic control of swine responses to PRRSV infection: Current progress of the PRRS host genetics consortium. BMC Proc. 2011, 5 (Suppl. S4), S30. [Google Scholar] [CrossRef]
  7. Tang, Z.; Xu, J.; Yin, L.; Yin, D.; Zhu, M.; Yu, M.; Li, X.; Zhao, S.; Liu, X. Genome-wide association study reveals candidate genes for growth relevant traits in pigs. Front. Genet. 2019, 10, 302. [Google Scholar] [CrossRef]
  8. Yang, X.; Deng, F.; Wu, Z.; Chen, S.-Y.; Shi, Y.; Jia, X.; Hu, S.; Wang, J.; Cao, W.; Lai, S.-J. A genome-wide association study identifying genetic variants associated with growth, carcass and meat quality traits in rabbits. Animals 2020, 10, 1068. [Google Scholar] [CrossRef]
  9. Forni, S.; Piles, M.; Blasco, A.; Varona, L.; Oliveira, H.N.D.; Lôbo, R.B.; Albuquerque, L.G.D. Comparison of different nonlinear functions to describe Nelore cattle growth. J. Anim. Sci. 2009, 87, 496–506. [Google Scholar] [CrossRef]
  10. Duan, X.; An, B.; Du, L.; Chang, T.; Liang, M.; Yang, B.-G.; Xu, L.; Zhang, L.; Li, J.; E, G.; et al. Genome-wide association analysis of growth curve parameters in Chinese Simmental beef cattle. Animals 2021, 11, 192. [Google Scholar] [CrossRef]
  11. Tjørve, K.M.; Tjørve, E. The use of Gompertz models in growth analyses, and new Gompertz-model approach: An addition to the Unified-Richards family. PLoS ONE 2017, 12, e0178691. [Google Scholar] [CrossRef] [PubMed]
  12. Aggrey, S.E. Comparison of three nonlinear and spline regression models for describing chicken growth curves. Poult. Sci. 2002, 81, 1782–1788. [Google Scholar] [CrossRef] [PubMed]
  13. Starck, J.M.; Ricklefs, R.E. Avian Growth and Development: Evolution within the Altricial-Precocial Spectrum; Oxford University Press: New York, NY, USA, 1998. [Google Scholar]
  14. Seifi Moroudi, R.; Ansari Mahyari, S.; Vaez Torshizi, R.; Lanjanian, H.; Masoudi-Nejad, A.J.A.G. Identification of new genes and quantitative trait locis associated with growth curve parameters in F2 chicken population using genome-wide association study. Anim. Genet. 2021, 52, 171–184. [Google Scholar] [CrossRef] [PubMed]
  15. Marinho, K.N.D.S.; Freitas, A.R.D.; Falcão, A.J.D.S.; Dias, F.E.F. Nonlinear models for fitting growth curves of Nellore cows reared in the Amazon Biome. Rev. Bras. Zootec. 2013, 42, 645–650. [Google Scholar] [CrossRef]
  16. Danil, K.; Chivers, S.J. Growth and reproduction of female short-beaked common dolphins, Delphinus delphis, in the eastern tropical Pacific. Can. J. Zool. 2007, 85, 108–121. [Google Scholar] [CrossRef]
  17. Liao, Y.; Wang, Z.; Glória, L.S.; Zhang, K.; Zhang, C.; Yang, R.; Luo, X.; Jia, X.; Lai, S.-J.; Chen, S.-Y. Genome-wide association studies for growth curves in meat rabbits through the single-step nonlinear mixed model. Front. Genet. 2021, 12, 750939. [Google Scholar] [CrossRef]
  18. Silva, F.F.E.; Zambrano, M.F.B.; Varona, L.; Glória, L.S.; Lopes, P.S.; Silva, M.V.G.B.; Arbex, W.; Lázaro, S.F.; Resende, M.D.V.D.; Guimarães, S.E.F. Genome association study through nonlinear mixed models revealed new candidate genes for pig growth curves. Sci. Agric. 2017, 74, 1–7. [Google Scholar] [CrossRef]
  19. Ding, R.; Yang, M.; Wang, X.; Quan, J.; Zhuang, Z.; Zhou, S.; Li, S.; Xu, Z.; Zheng, E.; Cai, G.; et al. Genetic Architecture of Feeding Behavior and Feed Efficiency in a Duroc Pig Population. Front. Genet. 2018, 9, 220. [Google Scholar] [CrossRef]
  20. Liu, X.; Huang, M.; Fan, B.; Buckler, E.S.; Zhang, Z. Iterative usage of fixed and random effect models for powerful and efficient genome-wide association studies. PLoS Genet. 2016, 12, e1005767. [Google Scholar] [CrossRef]
  21. Meng, Q.; Wang, K.; Liu, X.; Zhou, H.; Xu, L.; Wang, Z.; Fang, M. Identification of growth trait related genes in a Yorkshire purebred pig population by genome-wide association studies. Asian-Australas. J. Anim. Sci. 2017, 30, 462–469. [Google Scholar] [CrossRef]
  22. Wang, Y.Y.; Li, Y.Q.; Wu, H.Y.; Hu, B.; Zheng, J.J.; Zhai, H.; Lv, S.X.; Liu, X.L.; Chen, X.; Qiu, H.M.; et al. Genotyping of Soybean Cultivars With Medium-Density Array Reveals the Population Structure and QTNs Underlying Maturity and Seed Traits. Front. Plant Sci. 2018, 9, 610. [Google Scholar] [CrossRef] [PubMed]
  23. Huang, M.; Liu, X.; Zhou, Y.; Summers, R.M.; Zhang, Z. BLINK: A package for the next level of genome-wide association studies with both individuals and markers in the millions. Gigascience 2019, 8, giy154. [Google Scholar] [CrossRef] [PubMed]
  24. Fan, Z.; Lin, S.; Jiang, J.; Zeng, Y.; Meng, Y.; Ren, J.; Wu, P. Dual-Model GWAS Analysis and Genomic Selection of Maize Flowering Time-Related Traits. Genes 2024, 15, 740. [Google Scholar] [CrossRef] [PubMed]
  25. Wu, Y.; Shi, H.; Yu, H.; Ma, Y.; Hu, H.; Han, Z.; Zhang, Y.; Zhen, Z.; Yi, L.; Hou, J. Combined GWAS and Transcriptome Analyses Provide New Insights Into the Response Mechanisms of Sunflower Against Drought Stress. Front. Plant Sci. 2022, 13, 847435. [Google Scholar] [CrossRef]
  26. Deng, T.; Liang, A.; Liang, S.; Ma, X.; Lu, X.; Duan, A.; Pang, C.; Hua, G.; Liu, S.; Campanile, G.; et al. Integrative Analysis of Transcriptome and GWAS Data to Identify the Hub Genes Associated With Milk Yield Trait in Buffalo. Front. Genet. 2019, 10, 36. [Google Scholar] [CrossRef]
  27. Liu, X.; Huang, J.; Yang, S.; Zhao, Y.; Xiang, A.; Cao, J.; Fan, B.; Wu, Z.; Zhao, J.; Zhao, S.; et al. Whole blood transcriptome comparison of pigs with extreme production of in vivo dsRNA-induced serum IFN-a. Dev. Comp. Immunol. 2014, 44, 35–43. [Google Scholar] [CrossRef]
  28. Chang, C.C.; Chow, C.C.; Tellier, L.C.; Vattikuti, S.; Purcell, S.M.; Lee, J.J. Second-generation PLINK: Rising to the challenge of larger and richer datasets. Gigascience 2015, 25, 4–7. [Google Scholar] [CrossRef]
  29. Browning, B.L.; Zhou, Y.; Browning, S.R. A one-penny imputed genome from next-generation reference panels. Am. J. Hum. Genet. 2018, 103, 338–348. [Google Scholar] [CrossRef]
  30. Han, P.; Wang, C.; Zhang, W.; Wu, Y.; Wang, D.; Zhao, S.; Zhu, M. Pleiotropic architectures of porcine immune and growth trait pairs revealed by a self-product-based transcriptome method. Anim. Genet. 2023, 54, 123–131. [Google Scholar] [CrossRef]
  31. Gregory Alvord, W.; Roayaei, J.A.; Quiñones, O.A.; Schneider, K.T. A microarray analysis for differential gene expression in the soybean genome using Bioconductor and R. Brief. Bioinform. 2007, 8, 415–431. [Google Scholar] [CrossRef]
  32. Gautier, L.; Cope, L.; Bolstad, B.M.; Irizarry, R.A. affy—Analysis of Affymetrix GeneChip data at the probe level. Bioinformatics 2004, 20, 307–315. [Google Scholar] [CrossRef] [PubMed]
  33. Langfelder, P.; Horvath, S. WGCNA: An R package for weighted correlation network analysis. BMC Bioinform. 2008, 9, 559. [Google Scholar] [CrossRef] [PubMed]
  34. Liang, W.; Sun, F.; Zhao, Y.; Shan, L.; Lou, H. Identification of susceptibility modules and genes for cardiovascular disease in diabetic patients using WGCNA analysis. J. Diabetes Res. 2020, 2020, 4178639. [Google Scholar] [CrossRef] [PubMed]
  35. Ritchie, M.E.; Phipson, B.; Wu, D.; Hu, Y.; Law, C.W.; Shi, W.; Smyth, G.K. limma powers differential expression analyses for RNA-sequencing and microarray studies. Nucleic Acids Res. 2015, 43, e47. [Google Scholar] [CrossRef]
  36. Yin, L.; Zhang, H.; Tang, Z.; Xu, J.; Yin, D.; Zhang, Z.; Yuan, X.; Zhu, M.; Zhao, S.; Li, X.; et al. rMVP: A memory-efficient, visualization-enhanced, and parallel-accelerated tool for genome-wide association study. Genom. Proteom. Bioinform. 2021, 19, 619–628. [Google Scholar] [CrossRef]
  37. Wang, J.; Zhang, Z. GAPIT version 3: Boosting power and accuracy for genomic association and prediction. Genom. Proteom. Bioinform. 2021, 19, 629–640. [Google Scholar] [CrossRef]
  38. Durinck, S.; Spellman, P.T.; Birney, E.; Huber, W. Mapping identifiers for the integration of genomic datasets with the R/Bioconductor package biomaRt. Nat. Protoc. 2009, 4, 1184–1191. [Google Scholar] [CrossRef]
  39. Wu, T.; Hu, E.; Xu, S.; Chen, M.; Guo, P.; Dai, Z.; Feng, T.; Zhou, L.; Tang, W.; Zhan, L.J.; et al. clusterProfiler 4.0: A universal enrichment tool for interpreting omics data. Innovation 2021, 2, 100141. [Google Scholar] [CrossRef]
  40. Rizzi, C.; Contiero, B.; Cassandro, M. Growth patterns of Italian local chicken populations. Poult. Sci. 2013, 92, 2226–2235. [Google Scholar] [CrossRef]
  41. Pérez, P.; de Los Campos, G. Genome-wide regression and prediction with the BGLR statistical package. Genetics 2014, 198, 483–495. [Google Scholar] [CrossRef]
  42. Conneely, K.N.; Boehnke, M. So many correlated tests, so little time! Rapid adjustment of P values for multiple correlated tests. Am. J. Hum. Genet. 2007, 81, 1158–1168. [Google Scholar] [CrossRef] [PubMed]
  43. Wang, S.-B.; Feng, J.-Y.; Ren, W.-L.; Huang, B.; Zhou, L.; Wen, Y.-J.; Zhang, J.; Dunwell, J.M.; Xu, S.; Zhang, Y.-M. Improving power and accuracy of genome-wide association studies via a multi-locus mixed linear model methodology. Sci. Rep. 2016, 6, 19444. [Google Scholar] [CrossRef] [PubMed]
  44. Fernando, R.; Toosi, A.; Wolc, A.; Garrick, D.; Dekkers, J. Application of whole-genome prediction methods for genome-wide association studies: A Bayesian approach. J. Agric. Biol. Environ. Stat. 2017, 22, 172–193. [Google Scholar] [CrossRef]
  45. Weller, J.I.; Shlezinger, M.; Ron, M. Correcting for bias in estimation of quantitative trait loci effects. Genet. Sel. Evol. 2005, 37, 501. [Google Scholar] [CrossRef]
  46. Misra, G.; Badoni, S.; Domingo, C.J.; Cuevas, R.P.O.; Llorente, C.; Mbanjo, E.G.N.; Sreenivasulu, N. Deciphering the genetic architecture of cooked rice texture. Front. Plant Sci. 2018, 9, 409256. [Google Scholar] [CrossRef]
  47. Yu, Z.; Chang, F.; Lv, W.; Sharmin, R.A.; Wang, Z.; Kong, J.; Bhat, J.A.; Zhao, T.J.G. Identification of QTN and candidate gene for seed-flooding tolerance in soybean [Glycine max (L.) Merr.] using genome-wide association study (GWAS). Genes 2019, 10, 957. [Google Scholar] [CrossRef]
  48. Gao, G.; Fiorica, P.N.; McClellan, J.; Barbeira, A.N.; Li, J.L.; Olopade, O.I.; Im, H.K.; Huo, D. A joint transcriptome-wide association study across multiple tissues identifies candidate breast cancer susceptibility genes. Am. J. Hum. Genet. 2023, 110, 950–962. [Google Scholar] [CrossRef]
  49. Page, R.; Huang, S.; Ronen, M.; Sela, H.; Sharon, A.; Shrestha, S.; Poland, J.; Steffenson, B.J. Genome-wide association mapping of rust resistance in Aegilops longissima. Front. Plant Sci. 2023, 14, 1196486. [Google Scholar] [CrossRef]
  50. Waiho, K.; Fazhan, H.; Shahreza, M.S.; Moh, J.H.Z.; Noorbaiduri, S.; Wong, L.L.; Sinnasamy, S.; Ikhwanuddin, M. Transcriptome Analysis and Differential Gene Expression on the Testis of Orange Mud Crab, Scylla olivacea, during Sexual Maturation. PLoS ONE 2017, 12, e0171095. [Google Scholar] [CrossRef]
  51. Fredriksson, L.; Li, H.; Eriksson, U. The PDGF family: Four gene products form five dimeric isoforms. Cytokine Growth Factor. Rev. 2004, 15, 197–204. [Google Scholar] [CrossRef]
  52. Shibuya, M. Structure and Function of VEGF/VEGF-receptor System Involved in Angiogenesis. Cell Struct. Funct. 2001, 26, 25–35. [Google Scholar] [CrossRef] [PubMed]
  53. Anisimov, A.; Alitalo, A.; Korpisalo, P.; Soronen, J.; Kaijalainen, S.; Leppanen, V.M.; Jeltsch, M.; Yla-Herttuala, S.; Alitalo, K. Activated forms of VEGF-C and VEGF-D provide improved vascular function in skeletal muscle. Circ. Res. 2009, 104, 1302–1312. [Google Scholar] [CrossRef] [PubMed]
  54. Basciani, S.; Mariani, S.; Arizzi, M.; Ulisse, S.; Rucci, N.; Jannini, E.A.; Rocca, C.D.; Manicone, A.; Carani, C.; Spera, G.; et al. Expression of Platelet-Derived Growth Factor-A (PDGF-A), PDGF-B, and PDGF Receptor-α and -β during Human Testicular Development and Disease. J. Clin. Endocrinol. Metab. 2002, 87, 2310–2319. [Google Scholar] [CrossRef] [PubMed]
  55. Asiedu, M.; Wu, D.; Matsumura, F.; Wei, Q. Centrosome/Spindle pole–associated protein regulates cytokinesis via promoting the recruitment of MyoGEF to the central spindle. Mol. Biol. Cell 2009, 20, 1428–1440. [Google Scholar] [CrossRef]
  56. Patzke, S.; Hauge, H.; Sioud, M.; Finne, E.F.; Sivertsen, E.A.; Delabie, J.; Stokke, T.; Aasheim, H.-C. Identification of a novel centrosome/microtubule-associated coiled-coil protein involved in cell-cycle progression and spindle organization. Oncogene 2005, 24, 1159–1173. [Google Scholar] [CrossRef]
  57. Patzke, S.; Redick, S.; Warsame, A.; Murga-Zamalloa, C.A.; Khanna, H.; Doxsey, S.; Stokke, T. CSPP is a ciliary protein interacting with Nephrocystin 8 and required for cilia formation. Mol. Biol. Cell 2010, 21, 2555–2567. [Google Scholar] [CrossRef]
  58. Patzke, S.; Stokke, T.; Aasheim, H.C. CSPP and CSPP-L associate with centrosomes and microtubules and differently affect microtubule organization. J. Cell. Physiol. 2006, 209, 199–210. [Google Scholar] [CrossRef]
  59. de Nijs, L.; Leon, C.; Nguyen, L.; Loturco, J.J.; Delgado-Escueta, A.V.; Grisar, T.; Lakaye, B. EFHC1 interacts with microtubules to regulate cell division and cortical development. Nat. Neurosci. 2009, 12, 1266–1274. [Google Scholar] [CrossRef]
  60. Kim, J.; Choi, B.; Lim, H.; Park, E.; Lee, S.; Seo, B.; Cho, I.; Lee, J.; Oh, S.; Jeon, J.T. Characterization of phosphoinositide-3-kinase, class 3 (PIK3C3) gene and association tests with quantitative traits in pigs. Asian-Australas. J. Anim. Sci. 2005, 18, 1701–1707. [Google Scholar] [CrossRef]
  61. Berndt, S.I.; Gustafsson, S.; Magi, R.; Ganna, A.; Wheeler, E.; Feitosa, M.F.; Justice, A.E.; Monda, K.L.; Croteau-Chonka, D.C.; Day, F.R.; et al. Genome-wide meta-analysis identifies 11 new loci for anthropometric traits and provides insights into genetic architecture. Nat. Genet. 2013, 45, 501–512. [Google Scholar] [CrossRef]
  62. Jang, J.; Kim, B.; Jhang, S.Y.; Ahn, B.; Kang, M.; Park, C.; Cho, E.S.; Kim, Y.S.; Park, W.; Kim, H. Population differentiated copy number variation between Eurasian wild boar and domesticated pig populations. Sci. Rep. 2023, 13, 1115. [Google Scholar] [CrossRef] [PubMed]
  63. Guo, X.; Li, M.; Gao, P.; Cao, G.; Cheng, Z.; Zhang, W.; Liu, J.; Liu, X.; Li, B. Novel splice isoforms of pig myoneurin and their diverse mRNA expression patterns. Asian-Australas. J. Anim. Sci. 2018, 31, 1581–1590. [Google Scholar] [CrossRef] [PubMed]
  64. Yang, S.; Ning, G.; Hou, Y.; Cao, Y.; Xu, J.; Wu, J.; Zhang, T.; Wang, Q. Myoneurin regulates BMP signaling by competing with Ppm1a for Smad binding. iScience 2022, 25, 104495. [Google Scholar] [CrossRef] [PubMed]
  65. Wu, M.; Chen, G.; Li, Y.-P. TGF-β and BMP signaling in osteoblast, skeletal development, and bone formation, homeostasis and disease. Bone Res. 2016, 4, 16009. [Google Scholar] [CrossRef]
  66. Hildebrand, J.D.; Soriano, P. Overlapping and unique roles for C-terminal binding protein 1 (CtBP1) and CtBP2 during mouse development. Mol. Cell Biol. 2002, 22, 5296–5307. [Google Scholar] [CrossRef]
  67. Shen, L.; Li, Q.; Wang, J.; Zhao, Y.; Niu, L.; Bai, L.; Shuai, S.; Li, X.; Zhang, S.; Zhu, L. miR-144-3p Promotes Adipogenesis Through Releasing C/EBPalpha From Klf3 and CtBP2. Front. Genet. 2018, 9, 677. [Google Scholar] [CrossRef]
  68. Ponsuksili, S.; Murani, E.; Phatsara, C.; Schwerin, M.; Schellander, K.; Wimmers, K. Porcine muscle sensory attributes associate with major changes in gene networks involving CAPZB, ANKRD1, and CTBP2. Funct. Integr. Genom. 2009, 9, 455–471. [Google Scholar] [CrossRef]
  69. Jeong, H.; Choi, B.H.; Park, J.; Jung, J.H.; Shin, H.; Kang, K.W.; Quan, Y.H.; Yu, J.; Park, J.H.; Park, Y.; et al. GCC2 as a New Early Diagnostic Biomarker for Non-Small Cell Lung Cancer. Cancers 2021, 13, 5482. [Google Scholar] [CrossRef]
  70. Young, P.R. Perspective on the discovery and scientific impact of p38 MAP kinase. J. Biomol. Screen. 2013, 18, 1156–1163. [Google Scholar] [CrossRef]
  71. Gangwani, L. Deficiency of the Zinc Finger Protein ZPR1 Causes Defects in Transcription and Cell Cycle Progression. J. Biol. Chem. 2006, 281, 40330–40340. [Google Scholar] [CrossRef]
  72. Li, S.; Yu, W.; Hu, G. Angiogenin inhibits nuclear translocation of apoptosis inducing factor in a Bcl-2-dependent manner. J. Cell. Physiol. 2012, 227, 1639–1644. [Google Scholar] [CrossRef] [PubMed]
  73. Tello-Montoliu, A.; Patel, J.; Lip, G.Y.H. Angiogenin: A review of the pathophysiology and potential clinical applications. J. Thromb. Haemost. 2006, 4, 1864–1874. [Google Scholar] [CrossRef] [PubMed]
  74. Xu, Z.-p.; Tsuji, T.; Riordan, J.F.; Hu, G.-F. Identification and characterization of an angiogenin-binding DNA sequence that stimulates luciferase reporter gene expression. Biochemistry 2003, 42, 121–128. [Google Scholar] [CrossRef] [PubMed]
  75. Sooryanarain, H.; Rogers, A.J.; Cao, D.; Haac, M.E.R.; Karpe, Y.A.; Meng, X.-J. ISG15 modulates type I interferon signaling and the antiviral response during hepatitis E virus replication. J. Virol. 2017, 91, e02185-18. [Google Scholar] [CrossRef]
  76. Speer, S.D.; Li, Z.; Buta, S.; Payelle-Brogard, B.; Qian, L.; Vigant, F.; Rubino, E.; Gardner, T.J.; Wedeking, T.; Hermann, M. ISG15 deficiency and increased viral resistance in humans but not mice. Nat. Commun. 2016, 7, 11496. [Google Scholar] [CrossRef]
  77. Wang, Y.; Liu, X.; Hou, L.; Wu, W.; Zhao, S.; Xiong, Y. Fibroblast Growth Factor 21 Suppresses Adipogenesis in Pig Intramuscular Fat Cells. Int. J. Mol. Sci. 2015, 17, 11. [Google Scholar] [CrossRef]
  78. Cui, W.; Igata, T.; Tanaka, H.; Etoh, K.; Hong, S.; Tani, N.; Koga, T.; Nakao, M. Loss of the transcription repressor ZHX3 induces senescence-associated gene expression and mitochondrial-nucleolar activation. PLoS ONE 2022, 17, e0262488. [Google Scholar] [CrossRef]
  79. Liu, Y.; Ma, D.; Ji, C. Zinc fingers and homeoboxes family in human diseases. Cancer Gene Ther. 2015, 22, 223–226. [Google Scholar] [CrossRef]
  80. Suehiro, F.; Nishimura, M.; Kawamoto, T.; Kanawa, M.; Yoshizawa, Y.; Murata, H.; Kato, Y. Impact of zinc fingers and homeoboxes 3 on the regulation of mesenchymal stem cell osteogenic differentiation. Stem Cells Dev. 2011, 20, 1539–1547. [Google Scholar] [CrossRef]
  81. Cai, Z.; Wang, S.; Zhou, H.; Cao, D. Low expression of ZHX3 is associated with progression and poor prognosis in colorectal cancer. Transl. Oncol. 2024, 39, 101829. [Google Scholar] [CrossRef]
Figure 1. Heatmap of Pearson correlation coefficient for growth curve parameters. W 0 , the initial body weight (kg); L , instantaneous growth rate (per day), which measures the rate of decline in the growth rate; k , coefficient of relative growth or maturing index (smaller k indicates later maturity, whereas larger k indicates earlier maturity) (per day); W i , body weight at the inflection point (kg); GR, growth rate (kg/day).
Agriculture 14 01704 g001
Figure 2. Manhattan plot of significance (p-values) of SNPs in FarmCPU model and BLINK model for parameter traits W0, L, k, Wi, and GR. The red dots represent significant SNPs that were detected by both FarmCPU and BLINK. The navy dots represent significant SNPs that were detected in only one model. The blue dots represent SNPs that are not significant in either model. The dashed line indicates the suggestive threshold [ log 10 2.53 × 10 5 = 4.5965 ]. The solid line denotes the significant threshold [ log 10 1.27 × 10 6 = 5.8976 ] .
Agriculture 14 01704 g002
Figure 3. Co-expression modules analysis of transcriptome data. (A) Clustering dendrogram of 27 individuals. The trait heatmap represents the numerical size of the trait in the corresponding sample, with white representing small and red representing large. (B) Relationship between scale-free fit index and various soft thresholds. (C). Relationship between the mean connectivity and various soft thresholds. (D) Clustering dendrogram of genes. Various colors represent different modules.
Agriculture 14 01704 g003
Figure 4. Relationship of five parameter traits and thirty-two modules. The module marked in red is the module most relevant to the corresponding trait.
Agriculture 14 01704 g004
Figure 5. Volcano map of differentially expressed genes (DEGs) associated with W0, L, k, Wi, GR parameter traits. Blue dots indicate significantly down-regulated DEGs; red dots denote significantly up-regulated DEGs; and gray dots represent no significant difference.
Agriculture 14 01704 g005
Figure 6. SGH-GO terms for W 0 , W i , L , k parameters traits.
Agriculture 14 01704 g006
Table 1. Functions for Gompertz–Laird model and its derivative parameters.
Gompertz–LairdFunctions R 2 / a d j R 2
Model W t = W 0 e x p [ ( L / k ) ( 1 e x p ( k t ) ) ] 0.9952 ± 0.0066/0.9950 ± 0.0068
Parameters
W 0 Base parameter
L Base parameter
k Base parameter
W i W i = W 0 e x p [ ( L / k ) 1 ]
G R G R = k W 0 l n ( e x p ( L / k ) )
Notes: t , time (days); W t , weight of pig at time t (kg); W 0 , initial body weight (kg); L , instantaneous growth rate (per day), which measures the rate of decline in the growth rate; k , coefficient of relative growth or maturing index (smaller k indicates later maturity, whereas larger k indicates earlier maturity) (per day); W i , body weight at the inflection point (kg); G R , growth rate (kg/day); R 2 / a d j   R 2 , R-square/adjusted R-square.
Table 2. Statistical descriptions of growth curve parameters estimated by the Gompertz–Laird model.
TraitsMeanSDMinimumMaximum h 2
W 0 1.46900.34520.52142.34290.4183 ± 0.0004
L0.05000.02090.01490.16830.4152 ± 0.0004
k0.01000.01090.01760.07160.4865 ± 0.0005
W i 1.71960.42730.37163.07140.3101 ± 0.0004
GR0.06920.01960.01810.13930.3600 ± 0.0004
Note: W 0 , the initial body weight (kg); L , instantaneous growth rate (per day), which measures the rate of decline in the growth rate; k , coefficient of relative growth or maturing index (smaller k indicates later maturity, whereas larger k indicates earlier maturity) (per day); W i , body weight at the inflection point (kg); G R , growth rate (kg/day); h 2 , heritability.
Table 3. Significant SNPs for growth curve parameters and the genes surrounding them.
SNPTraitsChromosomePositionFarmCPUBLINKNear Genes
INRA0056460 W 0 X12085635 2.02 × 10 7   *** 9.57 × 10 10   *** ACE2
AP1S2
ASB9
ASB11
BMX
CLTRN
PIGA
PIR
VEGFD
ZRSR2
DRGA0004151 L 348199203 8.41 × 10 7   ** 4.85 × 10 6   * GCC2
SLC5A7
ST6GAL2
SULT1C2
SULT1C3
SULT1C4
U6
INRA0056460 L X6388935 8.80 × 10 7   ** 8.48 × 10 9   *** SHROOM2
U6
WWC3
H3GA0049324 L 1744259688 1.16 × 10 10   *** 1.52 × 10 19   *** CHD6
k 9.79 × 10 16   *** 3.34 × 10 25   *** EMILIN3
LPIN3
PLCG1
PTPRT
ZHX3
H3GA0037747 W i 13108017340 7.87 × 10 6   * 1.61 × 10 5   * ACTRT3
LRRC34
LRRIQ4
MECOM
MYNN
Note: W 0 , the initial body weight (kg); L , instantaneous growth rate (per day), which measures the rate of decline in the growth rate; k , coefficient of relative growth or maturing index (smaller k indicates later maturity, whereas larger k indicates earlier maturity) (per day); W i , body weight at the inflection point (kg). FarmCPU, p-values from FarmCPU method; BLINK, p-values from BLINK method. * represents the suggestive threshold p-values for 1 [ 2.53 × 10 5 ]. ** represents the significance threshold p-values for 5% [ 1.27 × 10 6 ]. *** represents the significance threshold p-values for 1% [ 2.53 × 10 7 ].
Table 4. Candidate genes identified by integrated analysis and their source gene sets.
TraitsCandidate GenesTerm RatioSource
W 0 VEGFD4/5SGGs
PDGFA4/5DEGs
CSPP13/5DEGs
EFHC12/5DEGs
PIK3C32/5DEGs
ZZZ32/5DEGs
L GCC29/12SGGs
MAPK149/12DEGs
ZPR17/12WCGs
ISG155/12DEGs
ANG4/12DEGs
k ZHX32/2SGGs
CEBPD2/2DEGs
W i MYNN2/2SGGs
CTBP22/2WCGs
Note: Term ratio refers to the ratio of SGH-GO terms to which candidate genes are annotated to all biological process SGH-GO terms. Source refers to the source gene set of candidate genes (DEGs, differentially expressed genes; SGGs, significant GWAS genes; WCGs, WGCNA candidate genes). W 0 , the initial body weight (kg); L , instantaneous growth rate (per day), which measures the rate of decline in the growth rate; k , coefficient of relative growth or maturing index (smaller k indicates later maturity, whereas larger k indicates earlier maturity) (per day); W i , body weight at the inflection point (kg).
Disclaimer/Publisher’s Note: The statements, opinions and data contained in all publications are solely those of the individual author(s) and contributor(s) and not of MDPI and/or the editor(s). MDPI and/or the editor(s) disclaim responsibility for any injury to people or property resulting from any ideas, methods, instructions or products referred to in the content.

