Article

Growth and Productivity of Coffea arabica var. Esperanza L4A5 in Different Agroforestry Systems in the Caribbean Region of Costa Rica

by
Victor Hugo Morales Peña
1,*,
Argenis Mora Garcés
2,
Elias De Melo Virginio Filho
3 and
Mario Villatoro Sánchez
4
1
Universidad EARTH, Centro de Geomática y Detección Remota, Guácimo 70602, Costa Rica
2
Corporación Colombiana de Investigación Agropecuaria, AGROSAVIA, Villavicencio 250047, Colombia
3
CATIE—Centro Agronómico Tropical de Investigación y Enseñanza, Turrialba 30501, Costa Rica
4
UCR—Universidad de Costa Rica, Escuela de Agronomía, Centro de Investigaciones Agronómicas, San José 11501, Costa Rica
*
Author to whom correspondence should be addressed.
Agriculture 2024, 14(10), 1723; https://doi.org/10.3390/agriculture14101723
Submission received: 29 June 2024 / Revised: 10 September 2024 / Accepted: 23 September 2024 / Published: 1 October 2024
(This article belongs to the Special Issue Agroforestry Systems: Strategies for Mitigating Climate Change)

Abstract

:
This study focused on evaluating the growth and productivity of Coffea arabica var. Esperanza L4A5 in different agroforestry systems in the Caribbean region of Costa Rica, a non-traditional area for coffee cultivation due to its low altitude and challenging climatic conditions. Three tree coverages were investigated, in combination with two types of differentiated fertilization (physical and chemical), comparing the results with full sun coffee plots as a control: (1) Albizia saman, (2) Hymenaea courbaril + Erythrina poeppigiana, and (3) Anacardium excelsum + Erythrina poeppigiana. The results showed that tree associations significantly reduced the mortality of coffee plants and increased both the height and mature cherry production compared to full sun treatments. In particular, the tree coverages associated with chemical and physical fertilization achieved the highest growth and production rates, with A. excelsum + E. poeppigiana and H. courbaril + E. poeppigiana standing out with maximum mature cherry productions of 3.35 t/ha and 3.28 t/ha, respectively. Growth analysis revealed that rapid initial growth, especially under chemical fertilization, is crucial for maximizing productivity, although a rapid slowdown in growth was also observed after reaching the peak. These findings underscore the importance of combining tree coverages with appropriate fertilization strategies to optimize coffee production in agroforestry systems, particularly in low-altitude areas like the Costa Rican Caribbean. This study concludes that agroforestry systems not only improve the resilience of coffee crops to adverse environmental conditions but can also be a viable strategy for increasing productivity in non-conventional regions. This suggests the need for further research to assess the long-term impacts on soil health, biodiversity, and the economic viability of these systems.

1. Introduction

The cultivation of coffee (Coffea arabica) is a fundamental part of the economy and cultural identity of many tropical regions around the world. Areas, typically between 500 and 2100 m above sea level (m.s.l.), offer ideal climatic conditions for this crop, with moderate temperatures generally ranging from 17 to 23 °C, which are optimal for photosynthesis and the development of coffee plants [1]. Additionally, altitude provides greater variability in daytime and nighttime temperatures, which favors the development of compounds that enhance the flavor of coffee. These factors, combined with moderate relative humidity and adequate precipitation (1000–3000 mm annually), create an environment where C. arabica can thrive and produce high-quality beans [2,3].
C. arabica is a shade-tolerant species, native to the understory of Ethiopia’s tropical rainforests [4]. As such, it is adapted to low-light conditions and thrives in environments where it is shielded from direct sunlight by a canopy of trees. This natural adaptation presents both opportunities and challenges for coffee cultivation in agricultural systems. In its natural habitat, trees not only provide shade but also stabilize temperature and humidity levels, which are crucial for the physiological processes of the coffee plant. Shade helps reduce the risk of photoinhibition—a process in which high light intensity damages the photosynthetic apparatus—thus protecting coffee plants from physiological stress [5]. Additionally, shaded environments mitigate extreme temperature fluctuations and reduce evapotranspiration rates, allowing coffee plants to conserve moisture and maintain optimal hydration levels [1].
The transition of C. arabica from its natural habitat in tropical forests to commercial agriculture has led to the development of both monoculture and agroforestry systems. In monoculture, coffee is grown in full sun conditions, which can significantly increase yields in the short term due to higher photosynthetic rates. However, this system also exposes coffee plants to several risks, including greater vulnerability to pests and diseases, increased susceptibility to climatic extremes, and soil degradation due to the lack of organic matter replenishment and nutrient cycling normally provided by tree cover [6]. In contrast, agroforestry systems integrate coffee cultivation with various tree species, which can mitigate some of the negative effects observed in monoculture. The presence of trees in these systems helps maintain soil fertility by contributing organic matter, improving nutrient cycling, and reducing erosion [7]. Additionally, the microclimatic conditions created by the tree canopy, such as moderated temperatures and humidity levels, can reduce the incidence of pests and diseases, which are often more prevalent in monoculture systems due to the lack of biodiversity [8]. Although agroforestry systems sometimes produce lower yields than full sun monocultures, they offer more sustainable long-term production by enhancing the resilience of coffee plants to environmental stressors. The diversification provided by trees not only supports the ecological stability of the system but also offers additional economic benefits through the production of timber, fruits, or other non-coffee products [7,9]. It has been recognized that agroforestry systems, whether of low or high diversity, have a greater capacity to provide ecosystem services compared to coffee monocultures fully exposed to the sun [10].
One of the significant challenges associated with cultivating shade-tolerant species like C. arabica is balancing the amount of shade sufficient to protect the plants while ensuring adequate light penetration to support photosynthesis and fruit production. Light is crucial for the growth and development of coffee, as it provides the necessary energy for photosynthesis, which are essential for their metabolism and development [11,12]. On the other hand, excessive shade can lead to reduced photosynthetic activity, slower growth rates, and lower yields; therefore, shade management becomes crucial in agroforestry systems, where the goal is to optimize the benefits of shade without compromising productivity. The shade percentage is a way of measuring light entry, as it determines how much sunlight reaches the plants under the canopy [13]. The ideal shade percentages for coffee in agroforestry systems in traditional high-altitude areas can vary depending on the specific climatic conditions of the area, the terrain, crop management, and the coffee varieties used. A shade range of 30% to 50% is generally considered optimal to maximize coffee productivity and quality while protecting the plants from the negative effects of direct sun exposure [2,14]. Little is known about the behavior of C. arabica in areas below 100 m above sea level, but it is generally stated that productivity and quality may be negatively affected due to high temperatures and lower thermal amplitude [15,16].
Among the strategies developed to achieve sustainable coffee production, genetic improvements have gained prominence, leading to the development of new varieties that have sparked significant interest in recent years. One such variety is the hybrid Esperanza L4A5, which stands out for its unique flavor and aroma characteristics, as well as its potential adaptability to unusual growing environments, particularly at altitudes ranging from 500 to 1000 m above sea level [17]. The Esperanza L4A5 hybrid originates from a breeding program led by the French Agricultural Research Centre for International Development (CIRAD), the Regional Cooperative Program for the Technological Development and Modernization of Coffee Production (PROMECAFE), and the Tropical Agricultural Research and Higher Education Center (CATIE). This program aimed to develop coffee varieties with high productive capacity and resistance to diseases and pests [18]. In Costa Rica, new varieties and hybrids, including Esperanza L4A5, have been specifically evaluated to combat coffee leaf rust, a disease that has severely impacted traditional varieties such as Caturra and Catuai. The Esperanza L4A5 hybrid, which results from a cross between Sarchimor T5296 and Ethiopian 25, was developed to enhance both disease resistance and cup quality. While Sarchimor T5296 is known for its tolerance to rust and anthracnose, Ethiopian 25 offers high cup quality but is susceptible to diseases [17]. Initial evaluations of Esperanza L4A5 showed good performance under conditions of high precipitation and humidity, displaying average morphological characteristics compared to other clones [19]. However, its comprehensive evaluation in terms of productive potential and adaptability across various environmental conditions was not continued.
Considering the opportunities offered by the development of resistant coffee varieties and the promotion of sustainable agricultural practices, such as agroforestry, coffee cultivation faces a global challenge: a reduction in cultivated areas in some tropical regions. This trend has been driven by the impacts of climate change, including the increase in pests and diseases, as well as the growing economic pressure on farmers [1,6]. Although Costa Rica remains a prominent producer of high-quality coffee, the country has not been immune to this trend, registering a decrease in areas cultivated with C. arabica in recent decades [20]. In response to these challenges, this study proposes that the Esperanza L4A5 hybrid could offer a viable option in agroforestry systems in the lowland regions of the Costa Rican Caribbean. It is expected that agroforestry associations, combined with differentiated fertilization strategies (physical and chemical), will have a significant effect on basal diameter growth, height, and mature cherry production, compared to the cultivation of the hybrid in full sun without fertilization. Specifically, it is anticipated that coffee plants associated with trees and subjected to either physical or chemical fertilization will show superior growth and production compared to those exposed to full sun, regardless of whether they receive fertilization. Based on these premises, an agroforestry trial was established using Esperanza L4A5 hybrids, following a split-plot design with a completely randomized block structure.
The selection of tree species, such as Albizia saman, Hymenaea courbaril, Anacardium excelsum, and Erythrina poeppigiana, was intentional in this study to explore their potential in improving the growth and productivity of coffee in agroforestry association conditions. These species were chosen for being native, for their regional commercial value, and for their ability to provide shade, improve soil fertility, and create a favorable microclimate for the hybrids. The fertilization approach is based on the physiological minimum [21], which is focused on providing the coffee hybrids with the necessary amount of nutrients to meet their physiological demands and maintain optimal growth and development, especially in alluvial soils that often have nutritional limitations and may require supplementation to maintain soil quality and promote healthy plant growth [9,22,23]. The physiological minimum approach is based on the idea that plants require certain nutrients in minimal quantities to perform vital functions such as photosynthesis, tissue growth, and reproduction. Providing nutrients above these minimal amounts offers no additional benefits and can result in resource waste and potentially negative environmental impacts, such as water and soil contamination [21].
From the perspective of growth variables, we will focus on basal diameter and height, which are indicators of plant development, allowing us to monitor individual and general progress and detect any significant changes [24]. Additionally, the production of mature coffee cherries will be recorded, after discarding empty, green, and dry cherries. The variables measured and recorded in this study will allow for an understanding of the overall growth and production of coffee plants, with special attention given to the different agroforestry arrangements and differentiated fertilizations. The design of this study facilitates a comprehensive investigation into the potential benefits of agroforestry systems and fertilization strategies in optimizing coffee production, particularly in low-altitude regions such as the Caribbean area of Costa Rica.
This pioneering research on C. arabica in an agroforestry trial context in lowlands provides a baseline for coffee cultivation in regions traditionally considered suboptimal for coffee production. The findings are expected to contribute to the socioeconomic development of the Caribbean region of Costa Rica and offer valuable insights for the coffee-growing community, both globally and in Costa Rica.

2. Materials and Methods

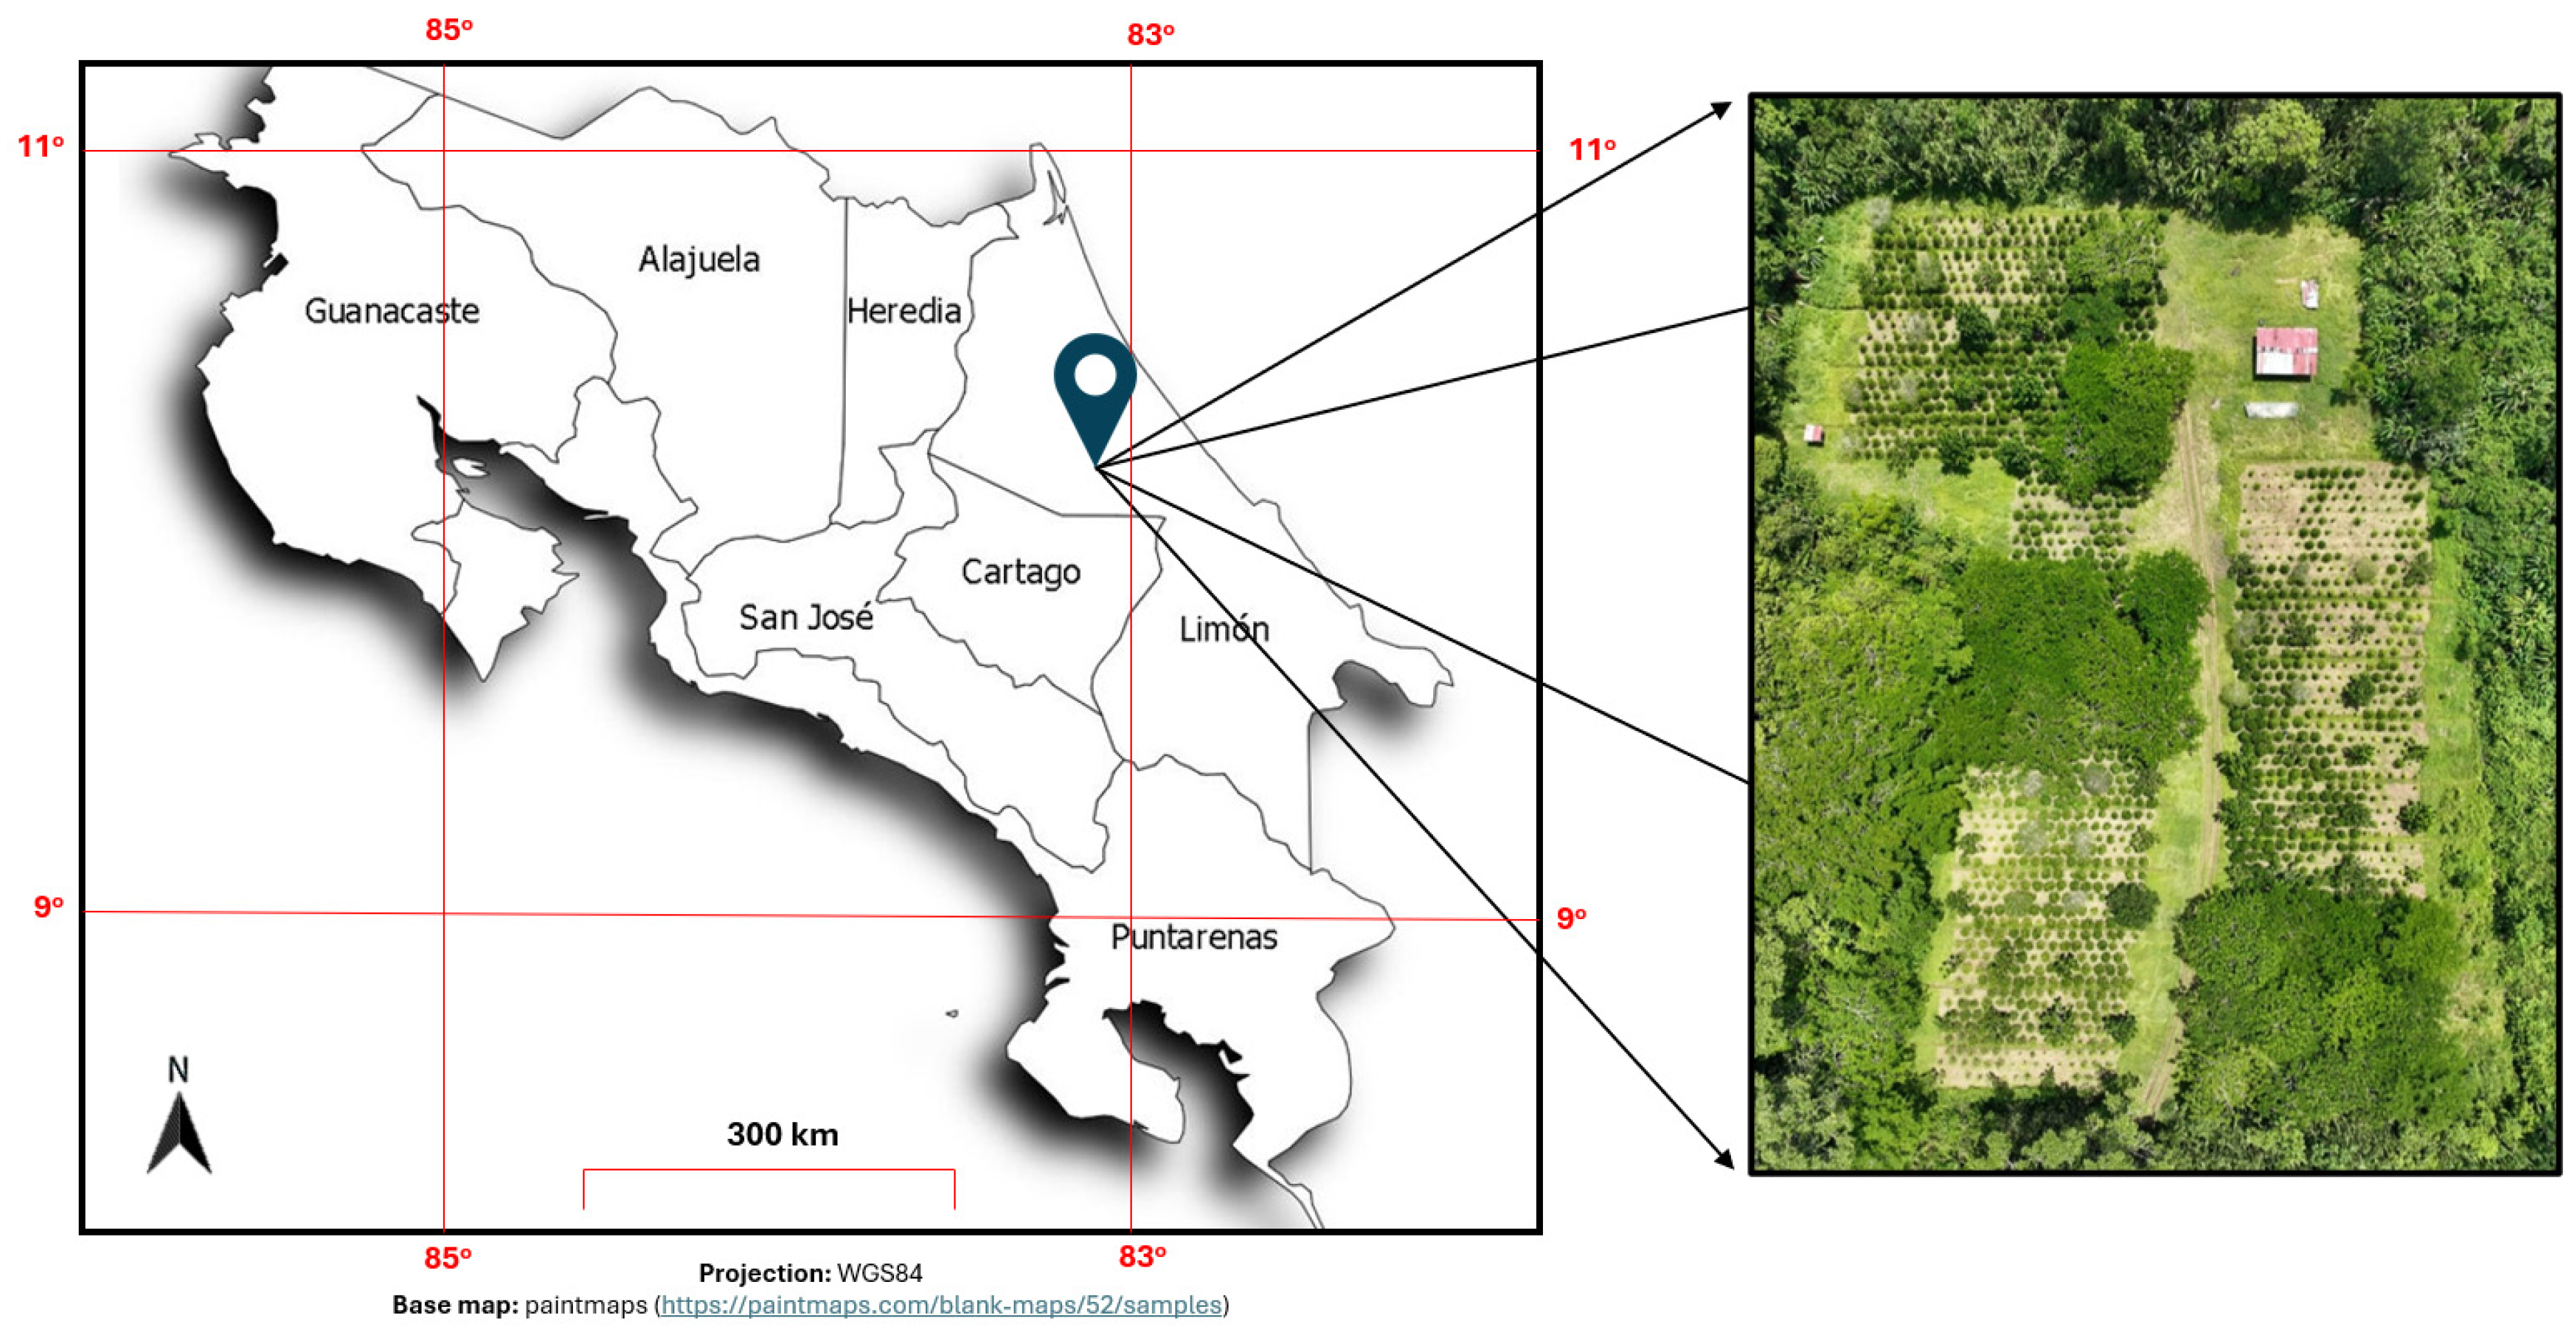
2.1. Location of the Project Area

The agroforestry trial, based on hybrids of Coffea arabica var. Esperanza L4A5, is in the province of Limón, Costa Rica, on the grounds of the Forestry Farm at EARTH University, in the canton of Guácimo, Limón province, Costa Rica, at an altitude of 43 m above sea level, and at coordinates 10°13′00.0″ 83°35′27.0″ W [25] (Figure 1). The average temperature of the experimental area is 25 °C, ranging between 20 °C and 33 °C (the temperature fluctuates between 20 °C and 33 °C over the course of 24 h). Additionally, the annual rainfall is 3701.99 mm, with an average relative humidity of 86% and a maximum solar radiation of 0.85 MJ/m2-day [26].

2.2. Life Zone and Geomorphology

According to historical meteorological data and the Holdridge life zone classification system, the project is situated in the heart of the Tropical Very Humid Forest (bmh-T) of the Caribbean region of Costa Rica [27]. From a geomorphological standpoint, the land where EARTH University is located lies in the alluvial plain between the Central Valley Mountain ranges and the Caribbean Sea, extending from the Colorado River to the border with Panama [28].

2.3. Soils

The soils present in the Guácimo region are classified as Inceptisols, specifically of the Udepts suborder. These soils form from the weathering of alluvial and colluvial sediments when they do not receive sediment inputs for extended periods. Some properties of the Inceptisols in this region often include acidic pH, potential presence of amorphous clays, high organic matter content, and evident subsurface horizon differentiation by changes in structure, color, or clay content [29]. The slopes are below 2%. The Inceptisols of the Parismina River valley are recognized for their significant agricultural potential in Costa Rica [30].

2.3.1. Physical Analysis

This was conducted by taking 11 sampling points in the trial area prior to the introduction of the components (Appendix A Figure A1). The profiles were characterized by evaluating texture, color, and structure following the USDA-NRC guide and the Munsell Soil Color Chart [31,32] (Appendix A Table A1).

2.3.2. Chemical Analysis

Alongside the extraction of samples for physical analysis, chemical analysis was conducted. The soil quality was assessed at different points and depths, providing information on its ability to support plant growth and to design fertilization strategies (Appendix A Table A2).

2.4. Experimental Design of the Agroforestry Trial Based on Esperanza L4A5

The experimental design considered two fundamental aspects:
(1)
The spatial arrangement of timber and service trees associated with the coffee hybrids: The trees were selected for being native and for their commercial potential. It was decided to associate Hymenaea courbaril and Anacardium excelsum, which have timber potential, with Erythrina poeppigiana, which, in addition to providing shade, contributes organic matter. Albizia saman, being a multipurpose tree, was established without association with other trees. The coffee plants were obtained from a supplier who reproduced them through somatic embryogenesis.
(2)
Fertilizations considering a minimal nutrient load in two differentiated presentations: physical and chemical fertilization. Both fertilization approaches are considered complementary; however, in the context of this research, the key difference lies in that physical fertilization provides nutrients gradually, while chemical fertilization delivers them quickly and directly [33]. Both approaches, along with the experimental control (liming only), allowed for the evaluation of the specific impact of each on plant growth and productivity. Based on these aspects, the arrangement of the components was carried out according to a split-plot design with a completely randomized block structure [34]. The linear model is shown in Equation (1):
Yijk = μ + Yk + τi + (Yτ)ki + βj + (τβ)ij + εijk
where Yijk = observations of the experimental unit; μ = overall mean of the trial; Yk = effect of the blocks (block 1, 2, 3, full sun 1 and full sun 2); τi = effect of coverage τ of the plot (treatments); (Yτ)ki = error of the plot; βj = effect of physical and chemical fertilization β of the subplot (sub-treatments); (τβ)ij = combined effect between coverages and fertilization approaches; and εijk = error of the subplot. The split-plot design allowed for the evaluation of the effect of coverages (Figure 2a), fertilization approaches (Figure 2b), and the interactions between them.
The selection of tree species considered their origin, autecological characteristics, and commercial value. The selected species were Cenízaro (A. saman), Guapinol (H. courbaril), Espavel (A. excelsum), and as a service tree, Poró (E. poeppigiana). They were planted in a square spacing of 10 × 10 m, in an area of 8.500 m2. The coffee plants were planted in an equilateral triangle spacing known as tresbolillo at 2.2 × 2.2 m. The total density was 1.936 coffee trees (2.386 plants/ha) and 96 trees (100 trees/ha) (Appendix A Table A3).

2.5. Differentiated Fertilizations

“Formulation 1, termed physical fertilization (F1), consisted of the application of potassium chloride (KCl), which is the most common source of potassium in commercially available fertilizers in Costa Rica. This formulation, which includes chlorine as an accompanying ion, was applied at a dose of 13 g per plant. Additionally, MKP (0-52-34) was applied at 5 g per plant as the main source of phosphorus in the form of P2O5, providing 34% potassium (KCl). Finally, ammonium nitrate (33.5-0-0), a source of nitrogen NH4NO3, was used to meet the nitrogen needs of the plant, applied at a dose of 20 g per plant. The total dose per plant was calculated at 30.74 g/plant. Formulation 2, termed chemical (F2), comprised NPK (9-23-30) as the main source of phosphorus (P2O5) and potassium (KCl), applied at a dose of 57 g, copper sulfate at 0.12 g, and zinc sulfate at 0.29 g, all per plant. Urea (46-0-0) was used as a nitrogen source, applied at 42 g per plant. The total mixture was 79.53 g/plant. An area of 0.3 m2 per plant was considered for the application of the nutritional amendment (Lime). This allowed for a reduction in the fertilization area and provided localized application, converting the need per hectare of 10.000 m2 into a need per area/plant of 0.3 m2 [35]” (Appendix A Table A4). Soil and vegetative sampling were conducted annually to adjust the formulations accordingly.

2.6. Management Practices

The management practices conducted included weed control, drainage maintenance, pest control, and pruning. Weed control was carried out manually using brush cutters and machetes. At the beginning of the project, generalized cutting was performed with brush cutters and machetes, but, over time and with the growth of the coffee plants, the cutting was localized to a radius of 2 m from the plant. Pest and disease control was not considered.

2.7. Study Variables

Measurements were conducted from 2020 to 2023, with a total of 12 observations. The first measurement was taken in week 24 after the establishment of the trial in 2019, and the final measurement was recorded in week 218 at the end of 2023.

2.7.1. Base Diameter (cm) and Height (m)

The measurement period spanned from week 24 (2020) to week 218 (2023). Data were collected on the base diameter and height of the coffee plants. Base diameter measurements were taken using an analog caliper, ensuring it was positioned flush with the ground but sufficiently distanced to avoid any irregularities that might affect measurement accuracy. Height was measured with a hypsometer rod.

2.7.2. Cherry Production

The production of ripe coffee cherries was recorded considering the areas under differentiated fertilization (see Figure 2b). It was established that the harvests should only include ripe cherries at levels 4 and 5, according to a pre-established ripening scale (Appendix A, Table A5). Once the cherries were harvested, a classification process was carried out with the purpose of eliminating irregular, green, empty, or hollow cherries. Only viable ripe cherries were counted.

2.7.3. Spatiotemporal Recording of Shade Percentage

To understand the spatiotemporal evolution of the shade percentage under the different agroforestry associations in the experiment, 11 data collection points were established at the tree–coffee interaction level (Figure 3a). Image capture was carried out annually using the Canopeo smartphone application [36]. The procedure involved using a cellphone to capture images of the canopy from a perpendicular position to the ground to ensure a good focus that accurately represented the coverage (always at the same height of 2 m) (Figure 3b). In addition to the developer’s recommendations regarding ground-based image capture, aerial images taken with a drone at a flight height of 120 m were incorporated into the analysis (Figure 3c).
The application analyzes the images using vegetation indices such as ExG, which separates green pixels from non-green ones, automatically calculating the green coverage fraction as a percentage [37]. The aerial drone images allowed for the measurement of green coverage by Canopeo, which approximates the percentage of shade. In this context, the green coverage captured from above reflects the amount of soil surface covered by the vegetative canopy, which is correlated with the amount of shade projected onto the ground. In the previous process, factors such as canopy height, leaf distribution, and the time of year were considered. Both analyses were contrasted, which generated the shade percentage. Annually, shade percentages were generated for the Cenízaro, Espavel-Poró, Guapinol-Poró coverages, and full sun areas 1 and 2.
Cenízaro was introduced in 2017, followed by Guapinol, Espavel, and Poró in 2018–2019.

2.8. Data Analysis

To understand the effects of tree coverages and differentiated fertilization on the growth of coffee plants, a two-factor analysis of variance (ANOVA) was performed. The response variables were the diameter and height of the coffee plants, with coverages and fertilization as predictor variables, considering their interactions. The experimental block was included as a random factor to control unexplained variability. After finding significant effects of treatments and sub-treatments using ANOVA (p < 0.05), Tukey’s mean comparison test was conducted to identify significant differences between treatments. The statistical analyses were performed using R software 4.2.2 [38].

2.8.1. Cumulative Mortality

Cumulative mortality was calculated using the formula in Equation (2):
Cumulative mortality (%) = (1 − (Surviving Plants)/(Established Coffee Plants)) × 100
The formula allowed for a comparison of the number of surviving plants in 2023 with the number of plants initially established in 2019. Subtracting the initial total value of coffee plants, divided by the initial total number of plants, facilitated calculating the proportion of plants that have died to the initial total number, expressed as a percentage. Cumulative mortality provides an idea of the loss of coffee plants in the specific context of treatments and sub-treatments.

2.8.2. Growth Analysis

To understand the growth of the base diameter and height, a logistic growth function was fitted to identify the general growth pattern over time. Additionally, the absolute growth rate was calculated to measure the growth speed in absolute terms [39].

Fitting the Logistic Growth Model for Diameter and Height Variables

The logistic growth function was fitted to understand the growth stages of the coffee plants, the exponential stage and the asymptotic stage, describing how the coffee plants grow [39,40]. The equation was as follows in Equation (3):
y = φ1/{1 + exp[−(T−φ2)/φ3]}
where y represents the studied variable (base diameter or height); T refers to the weeks of observation after the coffee plants were established in the field; φ1 refers to the asymptote value or the maximum value of y reached; φ2 refers to the time at which half of the asymptote value is reached; and φ3 refers to the time elapsed between reaching half of the asymptote and reaching three-quarters of it. This logistic model helps in understanding the growth phases of coffee plants and provides insights into the dynamics of their development under different treatments.

Calculation of Absolute Growth Rate

The absolute growth rate of the variables, including the base diameter and height of the coffee plants over time, enabled the identification of growth patterns and provided insights into the effects of different coverages, differentiated fertilizations (both physical and chemical), and their interactions on the rate of absolute growth or decline. The absolute growth rate (AGR) equations were derived by applying the first derivative to each of the fitted logistic equations (see Equation (3)) [41]. The adjusted equation used to calculate the absolute growth rate is in Equation (4):
A.G.R = (φ13 × ⅇ2−T)/φ3)/(1+ⅇ((φ2−T)/φ3))2
where A.G.R represents the absolute growth rate; φ1 represents the asymptote or maximum value reached by the diameter and height; φ2 refers to the week in which the variable, either diameter or height, reaches its maximum value; φ3 is a parameter representing a scaling constant that affects the magnitude of the growth rate; T is the independent variable in the equation that represents the weeks of measurement; and ⅇ is Euler number.
The absolute growth rate was calculated from the first derivative of the logistic growth model [42,43], providing the rate at which coffee plants grow at the base diameter and height levels. For the analyses in this study, the three measurements taken annually were considered and cataloged at the measurement week level, resulting in 12 measurement weeks. The first week of data corresponded to week 24 after the establishment of the coffee plants, and the last week was week 218, which was the measurement taken at the end of 2023. The absolute growth rate provided a measure of the speed at which the studied variables experienced changes in absolute units (in centimeters for the base diameter and meters for the height) during the period between week 24 and week 218.

3. Results

3.1. Evolution of Shade Percentage

Throughout the years of photographic recording, the evolution of the different agroforestry associations within the experimental design was observed. Cenízaro showed the greatest canopy development across all years, followed by Guapinol-Poró, Espavel-Poró, and full sun 1, which, due to its location, was influenced by the Cenízaro canopy (Figure 4).
The analysis of variance (ANOVA) followed by Duncan’s multiple comparison test showed significant differences between the coverages (p < 0.05) (Appendix B, Table A6). Cenízaro coverage recorded the highest percentage of shade in all evaluated years, reaching an average of 75.7% in 2023 (Duncan test: “a”, p < 0.001). Full sun 1 and Guapinol-Poró showed intermediate shade percentages, ranging between 18% and 32% (“b”). Full sun 1 experienced an increase due to the proximity of nearby Cenízaro trees, explaining its classification in group “b.” Finally, Espavel-Poró (“bc”) and full sun 2 (“c”) displayed the lowest shade percentages throughout all years of measurement, registering 18% and 4%, respectively, in 2023 (Figure 5).

3.2. Effect of Coverages and Differentiated Fertilizations on Growth

The analysis of variance (p < 0.05) showed that at least one of the coverages (treatments) had a significant effect on the basal diameter (F = 84.56, p < 0.001) and height (F = 84.56, p < 0.001) of the coffee plants, as well as differentiated fertilization, which also showed high significance for the basal diameter (F = 52.56, p < 0.001) and height (F = 52.56, p < 0.001). No significant differences were found in the interaction between coverages and differentiated fertilization, but there were significant differences in the interactions of the coverages block (basal diameter F = 2711.00, p = 0.028548; height F = 2711.00, p < 0.001), differentiated fertilizations block (basal diameter F = 5810.00, p < 0.000117; height F = 5810.00, p = 0.00516), and their combination (basal diameter F = 3182.00, p < 0.001335; height F = 3182.00, p = 0.002006), indicating a significant combined effect on the growth of the studied variables, varying according to agroforestry associations, differentiated fertilizations, and block (Appendix B, Table A7).
According to Tukey’s test (Appendix B, Table A8), significant differences in basal diameter were found between the Espavel-Poró and Cenízaro coverages (0.3906, p = 0.0001), Guapinol-Poró and Cenízaro (0.2561, p = 0.0307), and between Cenízaro and both the full sun 1 control (0.6001, p < 0.0001) and full sun 2 control (−0.8756, p < 0.0001). However, no significant differences were observed between the Guapinol-Poró and Espavel-Poró coverages (p > 0.5465) or between the full sun 1 control and Espavel-Poró (p > 0.123). Regarding plant height, significant differences were found between the Espavel-Poró and Cenízaro coverages (−0.1082, p = 0.0091), Guapinol-Poró and Cenízaro (−0.2134, p < 0.0001), the full sun 2 control and Cenízaro (−0.6679, p < 0.0001), Guapinol-Poró and Espavel-Poró (−0.1052, p = 0.0124), and between full sun 2 and Espavel-Poró (−0.5597, p < 0.0001). However, no significant differences were found between the full sun 1 control and Espavel-Poró (p = 0.9674). In the comparison between full sun 2 and Cenízaro for the basal diameter, the mean difference is negative (−0.8756), and its confidence interval is entirely negative (−1.1165 to −0.6348), suggesting that full sun 2 consistently has a smaller basal diameter than Cenízaro.
For the differentiated fertilizations (physical fertilization (F1), chemical fertilization (F2), and the Lime control), significant differences were observed in basal diameter between F1 and Lime (0.6075, p < 0.0001) and F2 and Lime (0.6067, p < 0.0001) but not between F2 and F1 (−0.0008, p = 0.9999). Regarding plant height, significant differences were found between F1 and Lime (0.1974, p < 0.0001) and F2 and Lime (0.1544, p < 0.0001) but not between F2 and F1 (−0.043, p = 0.2114) (Appendix B, Table A9).

3.3. Cumulative Mortality

The overall cumulative mortality for the period 2019–2023 was 6.92%. The treatments without tree association, named full sun 1 and full sun 2, recorded the highest mortality rates with 19.17% and 39.23%, respectively. Cenízaro and coffee association registered less mortality than the rest of the associations with 2.22% (only 12 dead coffee plants), considering it is the treatment with 75.7% shade percentage (significantly higher than the rest) (Appendix B, Table A10). In plots under differentiated fertilizations (sub-treatments), the cumulative mortality rates were 6.43% (physical fertilization), 6.40% (chemical fertilization), and 7.94% (Lime). Both in treatments and sub-treatments, the highest mortality was found in sites where the coffee plants were not associated with trees and did not receive fertilization (Lime) (Appendix B, Table A11).

3.4. Growth Analysis

Growth was analyzed by considering the different combinations of agroforestry associations, full sun coffee areas, and differentiated fertilizations. From the perspective of basal diameter growth, the fertilization combinations (F1 and F2) with Cenízaro, Espavel-Poró, Guapinol-Poró, and full sun (Full Sun 1) showed a notable increase over the course of 218 weeks. In general, plants that received chemical fertilization (F2) achieved larger basal diameters compared to those with physical fertilization (F1). In particular, the combinations Espavel-Poró/F2, Guapinol-Poró/F2, and full sun 1/F2 reached diameters between 6.8 cm and 7.9 cm, standing out above the rest. Similarly, the Espavel-Poró combination, both with F1 and F2, showed solid growth, with diameters between 6.8 cm and 7.6 cm. On the other hand, the combinations without fertilization (Lime) recorded the lowest diameters, between 4 cm and 6 cm, reflecting the lower effectiveness of this option compared to the fertilized treatments (Figure 6a).
Regarding height growth, the plants that received chemical fertilization (F2) showed slightly higher height growth compared to those under physical fertilization (F1). However, coffee plants associated with Cenízaro, under physical, chemical, and Lime fertilization, achieved the greatest height growth, ranging from 2.5 m to 3.5 m. Compared to the other combinations, the covers with Espavel-Poró showed more moderate growth, while Guapinol-Poró with chemical fertilization (F2) reached maximum heights of around 3 m. On the other hand, full sun 2, in none of its combinations, exceeded 2.2 m in height (Figure 6b).

3.4.1. Fitting the Logistic Growth Model

The logistic growth model was fitted considering different combinations, allowing for the determination of growth coefficients based on (1) the maximum value reached by the base diameter and height variables (φ1); (2) the exponential growth rate of these variables (φ2); and (3) the time at which the variables reach their maximum growth value (φ3) [44].
The data demonstrate that different agroforestry associations and fertilization treatments significantly impact the growth of coffee plants, specifically in terms of their base diameter. Physical fertilization (F1) generally influences the largest maximum base diameters and faster growth to reach half of the maximum diameter, as observed in combinations like Espavel-Poró/F1 with a φ1 of 7.74 cm and a φ2 of 78.81 weeks. In contrast, the Lime combinations show greater variability, with full sun 2/Lime taking the longest time (106.11 weeks) to reach half of its maximum base diameter, indicating a slower initial growth phase. The time between reaching half and three-quarters of the maximum diameter (φ3) also varies, with some combinations like Guapinol-Poró/Lime showing a rapid transition during this phase, while others like full sun 2/Lime exhibit a more prolonged growth period. Overall, physical fertilization seems to promote more robust and faster growth compared to Lime, influencing both the speed and pattern of coffee plant development across the different treatment combinations (Table 1).
The height growth of coffee plants under different agroforestry associations and fertilization treatments shows significant variability. Chemical fertilization (F2) generally promotes greater heights in coffee plants, as seen in the Cenízaro/F2 combination, which recorded the highest value at 3.49 m. In contrast, full sun 2/F1 registered the lowest maximum height at 2.30 m, highlighting the influence of both tree cover and fertilization type on plant growth. The time to reach half of the maximum height (φ2) varies widely, with full sun 2/Lime and full sun 2/F2 showing prolonged growth periods, indicating slower initial growth phases. On the other hand, Espavel-Poró/F1 and Guapinol-Poró/F1 achieve quicker growth, reaching half of their maximum height in just over 60 weeks. The transition from half to three-quarters of the maximum height (φ3) also differs, with Cenízaro/F1 and Espavel-Poró/F1 exhibiting rapid growth, while full sun 2/F2 shows a much slower progression (Table 2). Overall, F2 fertilization seems to stimulate greater height but with more variability in growth timing, while F1 fertilization favors faster and more consistent growth. Lime combinations, particularly under full sun conditions, are associated with slower growth, underscoring the importance of fertilization type and tree cover in the height development of coffee plants in the study area.

3.4.2. Absolute Growth Rate (AGR)

It was observed that the base diameter of coffee plants under the Cenízaro-Lime (CCal) and Espavel-Poró-Lime (EPCal) combinations, without any associated fertilization, reached maximum rates between weeks 25 and 75, with values of 0.046 cm and 0.034 cm, respectively. In the case of physical fertilization, the maximum rates were balanced among the Espavel-Poró-F1 (EPF1), full sun 1-F1 (PS1F1), Cenízaro-F1 (CF1), and Guapinol-Poró-F1 (GPF1) combinations, with values of 0.039 cm, 0.037 cm, 0.035 cm, and 0.030 cm, reached in weeks 65, 160, 100, and 80, respectively. Under chemical fertilization, the Espavel-Poró-F2 (EPF2) and full sun 1-F2 (PS1F2) combinations recorded higher values of 0.051 cm and 0.038 cm, reached in weeks 75 and 85, respectively (Table 3).
Regarding the height variable of coffee plants, in sectors without associated fertilization, the maximum growth rate was recorded in the combinations Cenízaro-Lime (CCal) and Espavel-Poró-Lime (EPCal), reaching values of 0.0125 and 0.0110 m, respectively, during weeks 60 and 100. In contrast, in combinations with physical fertilization (CF1, EPF1, GPF1), similar maximum rates were observed between weeks 40 and 50, with heights of 0.0114 m for Cenízaro-F1 (CF1) and 0.0110 m for Espavel-Poró-F1 (EPF1) and Guapinol-Poró-F1 (GPF1). Finally, the combinations associated with chemical fertilization (CF2, EPF2, GPF2) showed height values of 0.0147 m, 0.0119 m, and 0.0118 m, respectively, reached in weeks 65, 60, and 50 (Table 4).
In general terms, it was observed that the combinations that showed the highest average values in diameter and height were those that reached the maximum growth rates in fewer weeks. However, once this maximum rate was reached, growth decelerated at a faster pace compared to combinations that took longer to reach their maximum rate.
Regarding diameter, the combinations of Espavel-Poró-F2 (EPF2) and Cenízaro-Lime (CCal) reached their maximum growth rate in week 50, showing significantly higher values than the rest of the combinations but experiencing a more pronounced deceleration in their growth compared to the others (Figure 7).
Regarding height growth, the combination of Cenízaro under chemical fertilization showed the maximum growth rate in week 65 (0.0147 m) (CF2). The deceleration pattern after recording the maximum rate was repeated, as in the Espavel-Poró (EPF2) and Guapinol-Poró-F2 (GPF2) under the same chemical fertilization, with values of 0.0119 m (MRA = 60) and 0.0118 m (MRA = 50). Full sun 2 under physical fertilization (PS2F1) recorded its maximum growth rate in week 75 with 0.0070 m, differing from the growth in areas fertilized with a chemical mixture and without fertilization, where it seems the maximum growth rate has not yet been reached (Figure 8).

3.4.3. Cherry Production

In the analysis of variance (ANOVA) and Duncan’s multiple range test, significant differences were found in the production of mature coffee cherries between the different agroforestry associations, full sun areas, and types of fertilization during the study period (p < 0.05). In 2023, the highest production of mature cherries was recorded in coffee plants under Espavel-Poró and Guapinol-Poró cover, fertilized with physical fertilization (F1), reaching 3.35 t/ha and 3.28 t/ha, respectively (Duncan test: “a”, p < 0.001). These yields were statistically higher compared to coffee plants in full sun areas, which showed significantly lower production levels. In the agroforestry system with Cenízaro, production in 2023 reached 2.65 t/ha but under chemical fertilization (F2) (Duncan test: “ab”, p < 0.001). Coffee plants in the full sun 1 and full sun 2 areas did not exceed 0.8 t/ha and 0.25 t/ha, respectively. However, in full sun 1, coffee plants fertilized with chemical fertilization (F2) showed higher production compared to other full sun treatments (Figure 9).

4. Discussion

4.1. Effect of Shade on Coffee Growth and Productivity

In this study, the importance of tree canopy coverage in creating a favorable microclimate for coffee growth is confirmed. The shade levels recorded varied significantly among the different agroforestry associations, with Cenízaro (A. saman) providing the densest canopy, leading to an average shade percentage of 75.7% in 2023. This finding supports existing studies that emphasize the benefits of shade for coffee plants, particularly in reducing the risks associated with excessive solar radiation, photoinhibition, and water stress [13,45]. Coffee grown in the shade has been associated with greater resilience to climate variability and better microclimatic conditions, which promote greater ecosystem sustainability [46]. The dense canopy created by Cenízaro likely moderated temperature fluctuations and reduced water loss through evapotranspiration, promoting healthier plant development. However, the results also suggest that excessively dense shade may have limited coffee productivity. While the Cenízaro system achieved significant growth in terms of basal diameter and height, its yield of mature coffee cherries was lower than that of the Espavel-Poró and Guapinol-Poró agroforestry combinations, which had intermediate (and significantly lower) shade levels.
The results align with research indicating that while shade protects coffee plants from environmental stress, too much shade can limit photosynthesis, reducing yields [13,14]. Studies also suggest that an optimal shade level of 30–50% maximizes coffee production while preventing stress from excessive sunlight [2,12]. In contrast, full sun areas, particularly full sun 2, exhibited the lowest shade levels (4% in 2023) and the least desirable performance in terms of growth and productivity. The high exposure to sunlight in these areas likely caused greater plant stress and lower moisture retention, factors commonly associated with coffee monoculture systems [8]. This underscores the importance of proper shade management in lowland coffee systems, where full sun exposure can exacerbate already challenging environmental conditions. While conventional fertilization offers a productive pathway in full sun coffee cultivation, it could lead to the long-term degradation of soil fertility and plant health [47].

4.2. Differentiated Fertilization and Its Effects on Growth and Productivity

In terms of fertilization, both physical (F1) and chemical (F2) fertilization had a significant effect on coffee plant growth, as demonstrated by the results of the analysis of variance (ANOVA). Although no significant differences were observed between F1 and F2 in basal diameter and height growth in most cases, chemical fertilization tended to result in slightly higher overall growth rates. This suggests that while both types of fertilization are effective, chemical fertilization may offer faster nutrient uptake and more immediate benefits for the plants, especially in nutrient-deficient alluvial soils like those present in the study area [48]. Chemical fertilizers are often designed to provide immediate nutrient availability, which can lead to rapid growth, but over time, organic matter depletion and soil health may become limiting factors [49].
Despite the potential of chemical fertilization to stimulate growth, the highest coffee cherry production was recorded in the agroforestry systems with Espavel-Poró and Guapinol-Poró coverages, fertilized with physical fertilization (F1). These systems produced 3.35 t/ha and 3.28 t/ha of mature coffee cherries, respectively, outperforming the other combinations. Physical fertilization, which provides a more gradual nutrient release, promotes sustained growth and improves soil fertility over time [50]. Organic-based fertilizers, such as those used in physical fertilization strategies, often support soil health through enhanced microbial activity and organic matter replenishment [51].
While chemical fertilization may offer short-term advantages in terms of growth, physical fertilization may be more effective in supporting consistent production, especially when combined with agroforestry associations that contribute organic matter and improve soil structure [14]. The positive impact of tree cover, particularly nitrogen-fixing Erythrina poeppigiana (Poró) in combination with Guapinol and Espavel, likely contributed to this outcome by enhancing soil fertility and providing additional ecosystem services, such as nutrient cycling and erosion control [7]. In lowland areas where soils may be more susceptible to surface erosion due to excessive rainfall, agroforestry associations play a crucial role in maintaining soil integrity and promoting long-term sustainability [52].

4.3. Cumulative Mortality and Resilience of Agroforestry Systems

The cumulative mortality observed in this study highlights the benefits of agroforestry systems in improving the resilience of coffee plants to environmental stress factors in lowland areas. The highest mortality rates were recorded in full sun areas, where mortality reached 39.23% during the study period. In contrast, the Cenízaro–coffee association had the lowest mortality rate, with only 2.22%, emphasizing the protective effects of tree cover in mitigating the stress from high temperatures and sunlight [45]. It has been demonstrated that shade-grown coffee systems reduce pest pressure by enhancing the diversity of beneficial insect populations, which help control pest species [53]. The results are consistent with previous research that underscores the importance of shade in improving the long-term survival of coffee plants. Shade not only reduces the risk of heat stress but also helps maintain soil moisture levels, reduces wind damage, and provides a habitat for natural pest predators, all of which contribute to lower mortality rates [6].

4.4. Growth Dynamics and the Logistic Growth Model

The logistic growth model applied in this study provided insights into the growth patterns of coffee plants under different agroforestry associations and fertilization treatments. Coffee plants associated with shade trees generally resulted in better growth compared to those in full sun conditions. For example, combinations like Espavel-Poró with physical fertilization (F1) achieved larger basal diameters and faster growth rates, highlighting the positive interaction between tree cover and sustained nutrient availability.
The analysis of absolute growth rates (AGRs) further supported these findings, showing that coffee plants under tree cover reached their peak growth rates earlier and exhibited faster initial growth compared to plants in full sun areas. The rapid early growth observed in systems such as Espavel-Poró/F1 and Guapinol-Poró/F1 emphasizes the importance of early canopy establishment to provide shade and reduce plant stress during the critical early stages of growth [14]. However, it is important to note that growth slowed down more quickly after reaching the maximum rate, particularly in systems with chemical fertilization, suggesting that a more gradual nutrient release, as seen with physical fertilization, may favor more consistent growth over time [2].

4.5. Implications for Sustainable Coffee Production in Lowland Areas

The results of this study provide important insights for the future of coffee production in lowland areas, particularly in the context of climate change. As global temperatures continue to rise, traditional high-altitude coffee-growing regions may become less suitable for coffee cultivation, forcing producers to explore alternative strategies to maintain yields and quality. Agroforestry systems, as demonstrated in this study, offer a viable solution by creating agricultural systems that are more resilient to environmental stress while promoting biodiversity and ecosystem services [51].
The agroforestry associations in this research, involving species such as Espavel, Guapinol, and Poró, suggest they can help mitigate some of the challenges associated with lowland coffee production, such as high temperatures and soil degradation. By providing shade, improving soil fertility, and enhancing water retention, these systems can help stabilize coffee production and ensure long-term sustainability. Additionally, the reduced mortality rates observed in agroforestry systems highlight their potential to improve the overall resilience of coffee crops to environmental challenges, making them a key strategy for climate change adaptation [6].
When analyzing coffee production in various coffee-growing regions of Costa Rica [20], traditional areas such as Los Santos, Valle Occidental, and Valle Central register the highest yields per hectare, reaching 27.73, 17.65, and 21.09 fanegas/ha, respectively, equivalent to 6.93, 4.41, and 5.27 t/ha. In contrast, the Espavel-Poró and Guapinol-Poró associations recorded yields of 3.35 t/ha and 3.28 t/ha, equivalent to 13.40 fanegas/ha and 13.12 fanegas/ha. Although the yields are lower than in traditional regions, they are higher than in areas such as Pérez Zeledón (11.63 fanegas/ha, 2.91 t/ha), Coto Brus (11.05 fanegas/ha, 2.76 t/ha), and the Zona Norte (8.64 fanegas/ha, 2.16 t/ha).

5. Conclusions

In conclusion, this study demonstrates the potential of agroforestry systems, combined with differentiated fertilization strategies, to enhance the growth, productivity, and resilience of Coffea arabica var. Esperanza L4A5 in lowland regions. The findings underscore the importance of shade management, with intermediate levels of shade (such as those provided by Espavel-Poró and Guapinol-Poró) proving to be particularly effective in promoting coffee growth and yield. Additionally, physical fertilization, with its gradual nutrient release, appears to offer long-term benefits for both productivity and soil health, making it a valuable tool for sustainable coffee production. As climate change continues to challenge traditional coffee-growing regions, agroforestry systems offer a promising solution for maintaining coffee production in non-conventional areas, such as the lowlands of Costa Rica’s Caribbean region.

Author Contributions

Conceptualization, V.H.M.P.; Methodology, V.H.M.P.; Investigation, V.H.M.P.; Data curation, V.H.M.P.; Writing—original draft, V.H.M.P.; Writing—review & editing, A.M.G., E.D.M.V.F. and M.V.S.; Project administration, V.H.M.P. All authors have read and agreed to the published version of the manuscript.

Funding

This research was funded by EARTH University within the framework of the academic program.

Institutional Review Board Statement

Not applicable.

Data Availability Statement

Data is contained within the article.

Acknowledgments

Thanks go to EARTH University for the support provided throughout the entire research process, for believing in this idea, and for making what is now and in the future possible. We also extend our gratitude to Fernando Altmann of Gaia Artisan Coffee, as well as to the alumni, students, and staff of the institution who collectively supported and continue to support the activities with their tremendous effort and willingness to work.

Conflicts of Interest

Author Argenis Mora Garcés was employed by the company Corporación Colombiana de Investigación Agropecuaria, AGROSAVIA. The remaining authors declare that the research was conducted in the absence of any commercial or financial relationships that could be construed as a potential conflict of interest.

Appendix A

Figure A1. Sampling for the physical characterization of soil profiles following the USDA-NRC guide and the Munsell Soil Color Chart.
Agriculture 14 01723 g0a1
Table A1. Physical characterization of soil profiles following the USDA-NRC guide and the Munsell soil color chart [54].
LocationHorizonsDepth (cm)TextureColorStructure
Blocks 1, 2 y 3O0–20F7.5 YR 4/3Angular and subangular blocks
A20–80FA7.5 YR 6/6Angular and subangular blocks
B80–140FAr10 YR 6/2Subangular blocks (water at 100 cm)
C140–200Ar2.5 Y 8/3Massive
Table A2. Chemical analysis of the project area considering depths of 0–25 and 25–50 cm [54].
PointDepthpHEAKCaMgPFeCuZnMnCNTOM
------cmol+/kg------------mg/kg------------%------
010–25 cm4.673.200.283.972.171.91142.80.81891.030.311.78
024.862.500.223.882.031.61222.40.71682.000.483.45
034.762.700.262.591.471.7911.70.31042.080.633.59
044.162.300.313.062.591.4961.90.7105---
054.851.800.172.511.141.7831.20.2962.000.333.45
064.972.900.262.971.472.3961.40.2652.670.504.60
074.852.900.183.151.761.3861.40.1802.330.404.02
084.034.000.162.010.971.2701.00.148---
094.922.200.183.622.412.11152.90.62531.920.663.31
104.783.100.152.561.601.61062.20.51662.120.583.65
114.763.200.172.401.441.81082.10.51792.510.594.33
Avg. 4.692.800.212.981.731.7991.90.41322.070.503.57
0125–50 cm 5.150.900.166.044.842.9841.60.1512.130.513.67
025.061.100.133.662.401.3731.10.2390.960.381.66
035.061.900.243.081.431.2851.00.1671.390.482.40
044.532.700.192.492.001.1660.90.138---
055.550.400.163.371.610.7740.70.1280.810.181.40
065.110.600.153.291.170.8590.60.0151.190.362.05
075.321.100.112.641.830.9490.5-161.160.312.00
083.994.500.111.770.721.1500.5-16---
095.410.800.124.023.432.2831.4-961.000.511.72
105.311.700.092.631.831.0700.7-550.800.491.38
115.231.700.102.671.200.8710.7-521.300.552.24
Avg. 5.071.580.143.242.041.3690.90.1431.190.422.06
EA = extractable acidity; TOM = total organic matter.
Table A3. General information on the components of the agroforestry trial.
ComponentMain Uses *Planting MethodSpacing (m) **Number of Trees
C. arabica Esperanza (L4A5)CPTriangular distribution (tresbolillo)2.2 × 2.21.936
A. saman (Cenízaro)T. OM. SSquare10 × 1030
H. courbaril (Guapinol)T. S10 × 1019
A. excelsum (Espavel)T. S10 × 1019
E. poeppigiana (Poró)OM. S10 × 1028
Total2.032
* CP = coffee production; T = timber; OM = organic matter; S = shade. ** Density of coffee plants and trees: 2.386 plants/ha and 100 trees/ha.
Table A4. Fertilization program design based on soil chemical information before coffee plant establishment.
FormulaTypeCompositionQuantity (g/Plant)Total (g/Plant) *
F1 (Physical)SimplePotassium chloride (KCl)10.430.74
Monopotassium Phosphate (MKP) (0-52-34)4.0
Ammonium nitrate (33.5-0-0)16.0
Zinc sulfate (0-0-0-35.5 (Zn)/17.5 (S))0.24
Copper sulfate (0-0-0-25.2 (Cu)/12.8 (S))0.096
F2 (Chemical)CompoundNPK (9-23-30)45.679.53
Copper sulfate (0-0-0-35.5 (Zn)/17.5 (S))0.096
Zinc sulfate (0-0-0-25.2 (Cu)/12.8 (S))0.232
Urea (46-0-0 (N))33.6
Lime Amendment aloneCalcium carbonate (CaCO3)-41.32
Acidity control for 1.936 plants
* Values are calculated based on a single fertilization.
Table A5. Ripening Scale for Grain Selection in Harvests.
Ripening LevelDescriptionColor
1greenAgriculture 14 01723 i001
2green yellowAgriculture 14 01723 i002
3TurningAgriculture 14 01723 i003
4redAgriculture 14 01723 i004
5overripeAgriculture 14 01723 i005
6dryAgriculture 14 01723 i006

Appendix B

Table A6. ANOVA for the effect of coverages on the percentage of shade.
FactorDegrees of FreedomSum of SquaresMean SquareF ValuePr (>F)
Coverages4101192529.739.86*** 0.001
Residuals1595263.5
Significance Levels: 0 (***).
Table A7. Two-factor ANOVA for basal diameter and height variables.
Basal Diameter
FactorDegrees of FreedomSum of SquaresMean SquareF ValuePr (>F)
Agroforestry associations4949237.1384.56*** 0.001
Differential fertilization2295147.4052.56*** 0.001
Block24020.037.14*** 0.000803
Agroforestry associations—Differential fertilization4374.581633.000.110059
Coverages—Block4307.602711.00* 0.028548
Differential fertilization—Block46516.295810.00*** 0.000117
Agroforestry associations—Differential fertilization—Block4718.923182.00* 0.001335
Residuals3567100042.80
Height
FactorDegrees of FreedomSum of SquaresMean SquareF ValuePr (>F)
Agroforestry associations420150.2584.56*** 0.001
Differential fertilization22612.9352.56*** 0.001
Block23416.817.14*** 0.001
Agroforestry associations—Differential fertilization850.661633.000.09557
Coverages—Block492.312711.00*** 0.001
Differential fertilization—Block461.545810.00** 0.00516
Agroforestry associations—Differential fertilization—Block8101.193182.00** 0.002006
Residuals35671394.200.39
Significance Levels: 0 (***); 0.001 (**) 0.01 (*) 0.05 (.) 0.1 ( ) 1.
Table A8. Comparison of mean differences in basal diameter and height of coffee plants under different agroforestry associations (Tukey HSD).
VariableComparisonDifference95% Confidence IntervalAdjusted p-Value
Basal DiameterEspavel-Poró vs. Cenízaro0.39060.1497; 0.6315*** 0.0001
Guapinol-Poró vs. Cenízaro0.25610.0152; 0.4970* 0.0307
Full sun 1 vs. Cenízaro0.60010.3592; 0.8410*** 0.0001
Full sun 2 vs. Cenízaro−0.8756−1.1165; −0.6348*** 0.0001
Guapinol-Poró vs. Espavel−0.1346−0.3754; 0.1063>0.5465
Full sun 1 vs. Espavel0.2094−0.0314; 0.4503>0.1230
Full sun 2 vs. Espavel−12663−1.5071; −1.0254*** 0.0001
Full sun 1 vs. Guapinol0.3440.1031; 0.5849*** 0.0009
Full sun 2 vs. Guapinol−11317−1.3726; −0.8908*** 0.0001
Full sun 2 vs. Full sun 1−14757−1.7166; −1.2348*** 0.0001
HeightEspavel-Poró vs. Cenízaro−0.1082−0.1982; −0.0183** 0.0091
Guapinol-Poró vs. Cenízaro−0.2134−0.3033; −0.1235*** 0.0001
Full sun 1 vs. Cenízaro−0.0869−0.1769; 0.00300.0638
Full sun 2 vs. Cenízaro−0.6679−0.7578; −0.5780*** 0.0001
Guapinol-Poró vs. Espavel−0.1052−0.1951; −0.0152* 0.0124
Full sun 1 vs. Espavel0.0213−0.0686; 0.1112>0.9674
Full sun 2 vs. Espavel−0.5597−0.6496; −0.4697*** 0.0001
Full sun 1 vs. Guapinol0.12640.0365; 0.2164** 0.0012
Full sun 2 vs. Guapinol−0.4545−0.5444; −0.3646*** 0.0001
Full sun 2 vs. Full sun 1−0.581−0.6709; −0.4910*** 0.0001
p < 0.05 (*); p < 0.01 (**); p < 0.001 (***).
Table A9. Comparison of mean differences in basal diameter and height under different fertilization treatments (Tukey HSD).
VariableComparisonDifference95% Confidence IntervalAdjusted p-Value
Basal DiameterF1 vs. Lime0.60750.4472; 0.7678*** 0.0001
F2 vs. Lime0.60670.4464; 0.7670*** 0.0001
F2 vs. F1−0.0008−0.1611; 0.15950.9999
HeightF1 vs. Lime0.19740.1376; 0.2573*** 0.0001
F2 vs. Lime0.15440.0946; 0.2143*** 0.0001
F2 vs. F1−0.043−0.1028; 0.01690.2114
p < 0.001 (***).
Table A10. Accumulated mortality of coffee plants under tree cover and in full sun.
Covers and Full SunEstablished Coffee PlantsCoffee Plants (2023)Dead Coffee PlantsCumulative Mortality (%)
Cenízaro540528122.22
Espavel-Poró616586304.87
Guapinol-Poró530512183.40
Full sun 1120972319.17
Full sun 2130795139.23
Total193618021346.92
Table A11. Cumulative mortality of coffee plants under differentiated fertilizations.
Fertilizations and
Lime
Established Coffee PlantsCoffee Plants (2023)Dead Coffee PlantsCumulative Mortality (%)
Physical fertilization (F1)638597416.43
Chemical fertilization (F2)656614426.40
Lime642591517.94
Total193618021346.92

References

  1. Montagnini, F.; Nair, P.K.R.; Follis, E.; Nair, V.D. Agroforestry Systems and Practices: Contributions to Sustainability, Conservation, and Climate Change Mitigation; Springer: Berlin/Heidelberg, Germany, 2015. [Google Scholar]
  2. Muschler, R.G. Shade improves coffee quality in a sub-optimal coffee-zone of Costa Rica. Agrofor. Syst. 2001, 51, 131–139. [Google Scholar] [CrossRef]
  3. Instituto del Café de Costa Rica (ICAFE). Guía Técnica del Cultivo del Café; ICAFE-CICAFE: Barva, Costa Rica, 2011; Available online: http://www.icafe.cr/wp-content/uploads/cicafe/documentos/GUIA-TECNICA-V10.pdf (accessed on 11 December 2021).
  4. Kufa, T. Recent Coffee Research Development in Ethiopia. In Proceedings of the 24th International Conference on Coffee Science, San José, Costa Rica, 12–16 November 2012; pp. 1070–1080. [Google Scholar]
  5. Chaves, M.M.; Flexas, J.; Pinheiro, C. Photosynthesis under Drought and Salt Stress: Regulation Mechanisms from Whole Plant to Cell. Ann. Bot. 2008, 103, 551–560. [Google Scholar] [CrossRef] [PubMed]
  6. Perfecto, I.; Vandermeer, J. Coffee Agroecology: A New Approach to Understanding Agricultural Biodiversity, Ecosystem Services and Sustainable Development; Routledge: Nueva York, NY, USA, 2008. [Google Scholar]
  7. Somarriba, E.; Kass, D.; Cornelius, J.; Montagnini, F. Agroforestry Systems in the Tropics: A Global Perspective; Springer: Berlin/Heidelberg, Germany, 2017. [Google Scholar]
  8. Vaast, P.; Bertrand, B. Agroforestry Systems and Coffee Productivity: A Review of Results and Research Priorities. In Agroforestry Systems for Sustainable Land Use; Springer: Dordrecht, The Netherlands, 2003; pp. 113–136. [Google Scholar]
  9. Buresh, R.; Witt, C. Fertilizer Best Management Practices: Site-Specific Nutrient Management; International Fertilizer Industry Association: Brussels, Belgium, 2007. [Google Scholar]
  10. Cerda, R.; Allinne, C.; Gary, C.; Tixier, P.; Harvey, C.A.; Krolczyk, L.; Mathiot, C.; Clément, E.; Aubertoti, J.N.; Avelino, J. Effects of shade, altitude and management on multiple ecosystem services in coffee agroecosystems. Eur. J. Agron. 2017, 82, 308–319. [Google Scholar] [CrossRef]
  11. Ovalle-Rivera, O.; Gómez-Arias, A.; Ariza, M.; Prinsen, E.; Medina, J. Shade management in coffee and cacao plantations for plant performance and environmental conservation. J. Environ. Manag. 2016, 183, 395–405. [Google Scholar]
  12. DaMatta, F. Ecophysiological constraints on the production of shaded and unshaded coffee: A review. Field Crops Res. 2004, 86, 99–114. [Google Scholar] [CrossRef]
  13. Lin, B.B. Agroforestry management as an adaptive strategy against potential microclimate extremes in coffee agriculture. Agric. For. Meteorol. 2007, 144, 85–94. [Google Scholar] [CrossRef]
  14. Beer, J.; Muschler, R.; Kass, D.; Somarriba, E. Shade Management in Coffee and Cacao Plantations. Agrofor. Syst. 1998, 38, 139–164. [Google Scholar] [CrossRef]
  15. DaMatta, F.M.; Ramalho, J.D.C. Impacts of Drought and Temperature Stress on Coffee Physiology and Production: A Review. Braz. J. Plant Physiol. 2006, 18, 55–81. [Google Scholar] [CrossRef]
  16. Worku, M.; Astatkie, T.; Tesfaye, K.; Van Keulen, H. The Effect of Altitude on Quality of Arabica Coffee (Coffea arabica L.) along the Great Rift Valley of Ethiopia. J. Sci. Food Agric. 2017, 97, 2841–2847. [Google Scholar]
  17. Word Coffee Research (WCR). Hybrid Coffea arabica var. Esperanza L4A5. Available online: https://varieties.worldcoffeeresearch.org/es/variedades/t5296 (accessed on 20 June 2024).
  18. Virginio Filho, E.D.M.; Astorga Domian, C. State of the Art and Management of F1 Hybrids (Coffea arabica L.) from the PROMECAFE Breeding Program (No. 112). Turrialba. Costa Rica: CATIE. 2021. Available online: https://repositorio.catie.ac.cr/handle/11554/11022 (accessed on 20 June 2024).
  19. FONTAGRO (United States of America). Regional Cooperative Program for the Technological Development and Modernization of Coffee Production. Guatemala (PROMECAFE) and Inter-American Institute for Cooperation on Agriculture. Costa Rica (IICA). 2005. Genetic Improvement of Coffee in Central America. Selection of Clones of Coffea arabica Hybrids. June 2001–June 2005. San José. pp. 1–15, Final Report. ATN-SF-7382-RG IICA-IDB. Available online: https://agritrop.cirad.fr/531174/1/document_531174.pdf (accessed on 20 June 2024).
  20. Instituto del Café de Costa Rica (ICAFE). Annual Report on Coffee Production in Costa Rica; ICAFE: San José, Costa Rica, 2023; Available online: https://www.icafe.cr/wp-content/uploads/informes_gestion/actividad_cafetalera/Informe%20Actividad%20Cafetalera%20de%20Costa%20Rica%202023.pdf (accessed on 19 August 2024).
  21. Engels, C.; Kirkby, E.; White, P. Chapter 5—Mineral Nutrition. Yield and Source–Sink Relationships. In Mineral Nutrition of Higher Plants, 3rd ed.; Marschner, P., Ed.; Academic Press: San Diego, CA, USA, 2012; pp. 85–133. [Google Scholar]
  22. Sancho, F.; Mata, R.; Molina, E.; Salas, R. Estudio de Suelos. Finca de la Escuela de Agricultura de la Región Tropical Húmeda. Documento Interno; Universidad EARTH: Guácimo, Costa Rica, 1989. [Google Scholar]
  23. Arcila, J.; Farfán, F.; Moreno, A.; Salazar, L.; Hincapié, E. Crecimiento y desarrollo de la planta de café. In Sistemas de Producción de Café en Colombia; Arcila, J., Farfán, F., Moreno, A., Salazar, L., Hincapié, E., Eds.; Cenicafé: Chinchiná, Colombia, 2007; Available online: https://biblioteca.cenicafe.org/handle/10778/720 (accessed on 18 February 2020).
  24. Salisbury, F.; Ross, C. Plant Physiology Hormones and Plant Regulators: Auxins and Gibberellins, 4th ed.; Wadsworth Publishing: Belmont, CA, USA, 1992; pp. 357–381. [Google Scholar]
  25. Google EARTH. Campus de la Universidad EARTH. Available online: https://maps.app.goo.gl/ecMMzoe47Wf4cPkV6 (accessed on 31 January 2024).
  26. Universidad EARTH. Base de Datos Climáticos de la Estación Meteorológica Institucional; Correspondencia: Guácimo, Costa Rica, 2024. [Google Scholar]
  27. Holdridge, L.R. Life Zone Ecology; Tropical Science Center: San José. Costa Rica. 1967. Available online: https://app.ingemmet.gob.pe/biblioteca/pdf/Amb-56.pdf (accessed on 25 January 2019).
  28. Centro de Investigaciones en Ciencias Geológicas (CICG). Visor de Mapas Geológicos de Costa Rica. Available online: https://cicg.ucr.ac.cr/interactivo/visor-de-mapas-geologicos-de-costa-rica/ (accessed on 20 June 2024).
  29. Instituto Nacional de Innovación y Transferencia en Tecnología Agropecuaria de Costa Rica (INTA). Suelos de Costa Rica: Orden Inceptisol (Boletín Técnico No. 5). Available online: http://www.mag.go.cr/bibliotecavirtual/Av-1825.PDF (accessed on 20 June 2024).
  30. Henríquez, C.; Cabalceta, G.; Bertsch, F.; Alvarado, A. Principales Suelos de Costa Rica: Orígenes, Características y Manejo [En Línea]; MAG: San José, Costa Rica, 2006; Available online: https://www.infoagro.go.cr/Inforegiones/RegionCentralOriental/Documents/Suelos/tipos%20de%20suelos%20CR.pdf (accessed on 22 September 2024).
  31. Munsell® Color. Munsell® Soil Color Charts; Munsell Color: New York, NY, USA, 1994; 29p, Available online: https://nishat2013.files.wordpress.com/2013/11/munsell-soil-color-charts-book.pdf (accessed on 5 April 2017).
  32. Schoeneberger, P.J.; Wysocki, D.A.; Benham, E.C.; Broderson, W.D. Field Book for Describing and Sampling Soils, Version 2.0; García, S.E.; Gil, A.J.; Rodríguez, F.A., Translators; Natural Resources Conservation Services: Lincoln, NE, USA, 2002; 251p.
  33. Havlin, J.L.; Beaton, J.D.; Tisdale, S.L.; Nelson, W.L. Soil Fertility and Fertilizers: An Introduction to Nutrient Management, 8th ed.; Pearson: London, UK, 2013. [Google Scholar]
  34. Montgomery, D. Diseño y Análisis de Experimentos, 6th ed.; Wiley: Hoboken, NJ, USA, 2005. [Google Scholar]
  35. Martins, E.; Guzmán, M. Respuesta Inicial de Coffea arabica var. Esperanza L4A5 a la Fertilización Diferenciada en Suelos de Origen Aluvial del Caribe de Costa Rica; Proyecto de Graduación. Licenciatura en Ciencias Agrícolas; Universidad EARTH: Guácimo, Costa Rica, 2019. [Google Scholar]
  36. Patrignani, A.; Ochsner, T. Canopeo: A powerful new tool for measuring fractional green canopy cover. Agron. J. 2015, 107, 2312–2320. [Google Scholar] [CrossRef]
  37. Chung, Y.; Choi, S.; Silva, R.; Kang, J.; Eom, J.H.; Kim, C. Case study: Estimation of sorghum biomass using digital image analysis with Canopeo. Biomass Bioenergy 2017, 105, 207–210. [Google Scholar] [CrossRef]
  38. R Core Team. R: A Language and Environment for Statistical Computing (Version: 4.3.1) [Software]; R Foundation for Statistical Computing: Vienna, Austria, 1991; Available online: https://www.R-project.org/ (accessed on 20 June 2024).
  39. Macher, R.; Mackey, B.; Davis, K. Heteroscedasticity in whole plant growth curves developed from nonreplicated data. Agron. J. 1991, 83, 417–424. [Google Scholar] [CrossRef]
  40. Tsoulakis, A. Analysis of logistic growth models. Res. Lett. Inf. Math. Sci. 2001, 2, 23–46. [Google Scholar]
  41. Paine, C.E.T.; Marthews, T.R.; Vogt, D.R.; Purves, D.; Rees, M.; Hector, A.; Turnbull, L.A. How to Fit Nonlinear Plant Growth Models and Calculate Growth Rates: An Update for Ecologists. Methods Ecol. Evol. 2012, 3, 245–256. [Google Scholar] [CrossRef]
  42. Sokal, R.; Rohlf, F. Biometry: The Principles and Practice of Statistics in Biological Research, 4th ed.; W.H. Freeman and Company: New York, NY, USA, 2012. [Google Scholar]
  43. Miguez, F.; Archontoulis, S.; Dokoohaki, H. Nonlinear regression models and applications. In Applied Statistics in Agricultural, Biological, and Environmental Sciences; Glaz, B., Yeater, K.M., Eds.; ASA, CSSA, SSSA: Madison, WI, USA, 2018. [Google Scholar]
  44. Lieth, J.; Fisher, P.R.; Heins, R. A phasic model for the analysis of sigmoid patterns of growth. Acta Hortic. 1996, 417, 113–118. [Google Scholar] [CrossRef]
  45. Vaast, P.; Somarriba, E. Trade-Offs between Crop Intensification and Ecosystem Services: The Role of Agroforestry in Cocoa Cultivation. Agrofor. Syst. 2014, 88, 947–956. [Google Scholar] [CrossRef]
  46. Soto-Pinto, L.; Perfecto, I.; Castillo-Hernandez, J.; Caballero, J. Shade Effect on Coffee Production at the Northern Tzeltal Zone of the State of Chiapas, Mexico. Agric. Ecosyst. Environ. 2000, 80, 61–69. [Google Scholar] [CrossRef]
  47. Perfecto, I.; Rice, R.A.; Greenberg, R.; Van der Voort, M.E. Shade Coffee: A Disappearing Refuge for Biodiversity. Bioscience 1996, 46, 598–608. [Google Scholar] [CrossRef]
  48. Marschner, P. Marschner’s Mineral Nutrition of Higher Plants, 3rd ed.; Academic Press: San Diego, CA, USA, 2012; p. vii. ISBN 9780123849052. [Google Scholar] [CrossRef]
  49. Millard, P.; Schroth, G.; Sinclair, F.L. Trees, Crops and Soil Fertility: Concepts and Research Methods; CABI Publishing: Wallingford, UK, 2003; pp. 637–638. Eur. J. Soil Sci. 2004, 55, 637–638. [Google Scholar] [CrossRef]
  50. Schroth, G.; Fonseca, G.; Harvey, C.; Gascon, C.; Vasconcelos, H.; Izac, A.-M. Agroforestry and Biodiversity Conservation in Tropical Landscapes; Bibliovault OAI Repository, The University of Chicago Press: Chicago, IL, USA, 2004. [Google Scholar]
  51. Altieri, M. Agroecology, Small Farms, and Food Sovereignty. Mon. Rev. 2009, 61, 102. [Google Scholar] [CrossRef]
  52. Nair, P.K.R. Agroforestry Systems and Environmental Quality: Introduction. J. Environ. Qual. 2011, 40, 784–790. [Google Scholar] [CrossRef] [PubMed]
  53. Philpott, S.M.; Arendt, W.J.; Armbrecht, I.; Bichier, P.; Diestch, T.V.; Gordon, C.; Greenberg, R.; Perfecto, I.; Reynoso-Santos, R.; Soto-Pinto, L.; et al. Biodiversity Loss in Latin American Coffee Landscapes: Review of the Evidence on Ants, Birds, and Trees. Conserv. Biol. 2008, 22, 1093–1105. [Google Scholar] [CrossRef] [PubMed]
  54. Chanto Ares, E. Diseño y Establecimiento de un Ensayo Agroforestal Basado en Coffea arabica var. Esperanza (L4A5) con Tres Coberturas Maderables; Proyecto de Graduación. Licenciatura en Ciencias Agrícolas; Universidad EARTH: Guácimo, Costa Rica, 2017. [Google Scholar]
Figure 1. Location of the agroforestry trial area based on hybrids of Coffea arabica var. Esperanza L4A5 established in September 2019.
Agriculture 14 01723 g001
Figure 2. Split-plot design with a completely randomized block structure. (a) Distribution of blocks and treatments (trees-coffee interaction/agroforestry associations): C = A. saman, G + P = H. courbaril + E. poeppigiana, E + P = A. excelsum + E. poeppigiana, Full sun 1 and Full sun 2 (experimental controls). (b) Distribution of sub-treatments (differentiated fertilization): F1 = physical fertilization, F2 = chemical fertilization, and L = plots with only liming (controls).
Agriculture 14 01723 g002
Figure 3. Methodology for recording canopy cover percentage (shade) using the Canopeo application. (a) Data collection points at the tree–coffee interaction level and Full sun experimental controls 1 and 2. (b) Smartphone image capture at 2 m height. (c) Determination of shade percentage using the Canopeo application on a drone-captured image.
Agriculture 14 01723 g003
Figure 4. Annual evolution of the different agroforestry associations and full sun areas in the trial (2020–2023).
Agriculture 14 01723 g004
Figure 5. Evolution of shade percentage from 2020 to 2023 for different agroforestry systems and full sun treatments. Cenízaro provides the highest shade, around 70% by 2023, while full sun treatments show the lowest. The letters from Duncan’s test indicate statistical differences, with "a" showing the highest shade and "c" the lowest.
Agriculture 14 01723 g005
Figure 6. (a) Growth curves of the base diameter of coffee plants under different combinations. (b) Growth curves of coffee plant height under different combinations.
Agriculture 14 01723 g006
Figure 7. Absolute diameter growth rate curves (cm/week) of Coffea arabica var. Esperanza L4A5 under different coverages and fertilizations over 218 weeks.
Agriculture 14 01723 g007
Figure 8. Absolute height growth rate curves (m/week) of Coffea arabica var. Esperanza L4A5 under different coverages and fertilizations over 218 weeks.
Agriculture 14 01723 g008
Figure 9. Production of mature coffee cherries (t/ha) from 2020 to 2023 under agroforestry associations and full sun treatments, with two types of fertilization and liming (F1, F2, and lime). In 2023, the highest yields were seen under Espavel-Poró and Guapinol-Poró with physical fertilization (F1), producing 3.35 t/ha and 3.28 t/ha, respectively (Duncan test: “a”, p < 0.001). Under Cenízaro, chemical fertilization (F2) reached 2.65 t/ha (Duncan test: “ab”, p < 0.001). Full sun 1 and 2 produced lower yields, not exceeding 0.8 t/ha and 0.25 t/ha, though full sun 1 with F2 outperformed other full sun treatments (Duncan test: “b”, p < 0.001).
Agriculture 14 01723 g009
Table 1. Parameters of the fitted logistic growth models for the base diameter variable recorded in Esperanza L4A5 plants under different agroforestry associations and in full sun (φ1: maximum base diameter value achieved; φ2: time to reach half of the maximum base diameter; and φ3: time between half and three-quarters of the maximum base diameter).
Combinationφ1φ2φ3
Cenízaro/Lime5.94 ± 0.2867.44 ± 6.6654.07 ± 7.35
Espavel-Poró/Lime6.12 ± 0.2765.31 ± 5.9952.66 ± 6.82
Guapinol-Poró/Lime5.84 ± 0.1962.79 ± 4.4244.14 ± 5.16
Full sun 1/Lime6.85 ± 0.3378.31 ± 6.9355.78 ± 6.57
Full sun 2/Lime4.26 ± 0.160.19 ± 10.2458.38 ± 12.38
Cenízaro/F16.04 ± 0.1755.95 ± 3.8942.61 ± 4.87
Espavel-Poró/F17.74 ± 0.3378.81 ± 6.1355.66 ± 5.78
Guapinol-Poró/F16.99± 0.2566.79 ± 4.950.62 ± 5.49
Full sun 1/F17.57 ± 0.3167.79 ± 5.856.58 ± 6.33
Full sun 2/F15.91 ± 0.5391.55 ± 14.4466.75 ± 11.08
Cenízaro/F26.85 ± 0.4576.24 ± 10.366.11 ± 9.61
Espavel-Poró/F27.21 ± 0.2571.50 ± 4.7149.30 ± 4.96
Guapinol-Poró/F27.24 ± 0.3179.72 ± 6.0453.50 ± 5.67
Full sun 1/F27.59 ± 0.2867.65 ± 5.2153.96 ± 5.73
Full sun 2/F27.07 ± 0.69106.11 ± 16.3470.62 ± 10.5
±standard error
Table 2. Parameters of the fitted logistic growth models for the height variable recorded in Esperanza L4A5 plants under different agroforestry associations and in full sun (φ1: maximum height value achieved; φ2: time to reach half of the maximum base diameter; and φ3: time between half and three-quarters of the maximum base diameter).
Combinationφ1φ2φ3
Cenízaro/Lime3.08 ± 0.1787.78 ± 8.6264.22 ± 7.02
Espavel-Poró/Lime2.69 ± 0.1472.26 ± 8.0163.26 ± 7.99
Guapinol-Poró/Lime2.58 ± 0.274.07 ± 12.973.89 ± 11.91
Full sun 1/Lime2.65 ± 0.1269.42 ± 6.7159.39 ± 7.08
Full sun 2/Lime2.59 ± 1.36164.49 ± 143.41133.22 ± 55.84
Cenízaro/F13.07 ± 0.176.46 ± 4.852.89 ± 4.71
Espavel-Poró/F12.71 ± 0.0864.23 ± 4.1248.80 ± 4.77
Guapinol-Poró/F12.66 ± 0.0862.56 ± 4.4450.68 ± 5.26
Full sun 1/F12.91 ± 0.1471.99 ± 7.663.94 ± 7.59
Full sun 2/F12.30 ± 0.2181.77 ± 15.2373.14 ± 12.79
Cenízaro/F23.49 ± 0.297.29 ± 9.6167.61 ± 6.88
Espavel-Poró/F22.83 ± 0.1170.73 ± 5.9457.43 ± 6.21
Guapinol-Poró/F22.62 ± 0.1470.43 ± 8.1763.51 ± 8.35
Full sun 1/F23.01 ± 0.1575.43 ± 8.0465.18 ± 7.58
Full sun 2/F23.42 ± 0.94166.39 ± 59.24103.79 ± 21.99
±standard error
Table 3. Maximum growth rates achieved at weekly levels for the base diameter variable.
CombinationAbbreviationDiameter
WeekMRA (cm/Week)
Cenízaro/LimeCCal750.046
Espavel-Poró/LimeEPCal650.028
Guapinol-Poró/LimeGPCal250.034
Full sun 1/LimePS1Cal1750.030
Full sun 2/LimePS2Cal2200.018
Cenízaro/F1CF11000.035
Espavel-Poró/F1EPF1650.039
Guapinol-Poró/F1GPF1800.030
Full sun 1/F1PS1F11600.037
Full sun 2/F1PS2F1800.019
Cenízaro/F2CF2650.028
Espavel-Poró/F2EPF2750.051
Guapinol-Poró/F2GPF2650.033
Full sun 1/F2PS1F2850.038
Full sun 2/F2PS2F22200.029
MRA = maximum rate achieved.
Table 4. Maximum growth rates achieved at weekly levels for the height variable.
CombinationAbbreviationHeight
WeekMRA (m/Week)
Cenízaro/LimeCCal600.0125
Espavel-Poró/LimeEPCal1100.0110
Guapinol-Poró/LimeGPCal500.0099
Full sun 1/LimePS1Cal500.0068
Full sun 2/LimePS2Cal500.0061
Cenízaro/F1CF1400.0114
Espavel-Poró/F1EPF1700.0085
Guapinol-Poró/F1GPF1500.0111
Full sun 1/F1PS1F1500.0111
Full sun 2/F1PS2F1750.0070
Cenízaro/F2CF2650.0147
Espavel-Poró/F2EPF2600.0119
Guapinol-Poró/F2GPF2500.0118
Full sun 1/F2PS1F2750.0102
Full sun 2/F2PS2F21120.0092
MRA = maximum rate achieved.
Disclaimer/Publisher’s Note: The statements, opinions and data contained in all publications are solely those of the individual author(s) and contributor(s) and not of MDPI and/or the editor(s). MDPI and/or the editor(s) disclaim responsibility for any injury to people or property resulting from any ideas, methods, instructions or products referred to in the content.

