Abstract
Cropland acidification seriously restricts sustainable agricultural development. The main purpose of this study was to determine whether deeper tilling could alleviate topsoil acidification to improve the quality of arable land. A soil column incubation experiment simulating tillage depths (10 cm, 30 cm and 50 cm) and lime addition was conducted to determine their effects on soil acidification improvement. The changes in soil pH, exchangeable acidity, ammonium nitrogen (NH4+-N), nitrate nitrogen (NO3−-N), available phosphorus (AP), and microbial phospholipid fatty acids (PLFA) were analyzed. Tillage depth, lime application, and their interaction all had significant impacts on soil pH. T50 (simulated tillage depth of 50 cm) and T50+Lime (simulated tillage depth of 50 cm plus lime) treatments significantly increased the topsoil pH from 5.41 to 6.35 and 7.12, respectively. T50 treatment significantly reduced the soil exchangeable acid content compared to the T10 treatment. The nutrient accumulation along soil column indicated that the T50 and T50+Lime treatments significantly increased NO3−-N and AP content in the >30–50 cm soil layer. Compared with T30, NO3−-N accumulation in the >30–50 cm soil layers of T50 and T50+Lime treatments was 6.62 and 7.93 times higher, respectively. The accumulation of AP in the >30–50 cm soil layers of the T50 and T50+Lime treatments was 1.33 and 1.54 times higher than in the T30 treatment, respectively. These findings imply tillage up to 50 cm without exogenous materials could be a potential measure to reduce topsoil acidification and increase nutrition availability of >30–50 cm soil layers. Tillage of up to 30 cm combined with lime application confers greater benefits, which would particularly impact crops with shallow root systems. Subsequent field experiments will be conducted to further investigate the efficacy of these strategies in enhancing crop yield.
1. Introduction
Approximately 40% of global agricultural soils show some level of acidification [1]. In China, soil pH declined significantly from the 1980s to the 2010s [2]. Among the many factors that can lead to soil acidification, the application of high-N fertilizers and the removal of base cations by crops have been highlighted [3,4,5]. Inadequate agricultural management measures and acid deposition have also been identified as factors of agricultural soil acidification [6,7]. Soil acidification not only changes the physicochemical properties of the soil, but also affects nutrient availability [8], which in turn has been shown to negatively impact crop growth and yield [9]. Furthermore, soil acidification can significantly impact the diversity of soil microorganisms and alter the morphology and activity of heavy metals in the soil [10,11], threatening food security and human health.
Central China is a major grain-producing area, mainly characterized by vertisol soil. This soil type has a clay texture with poor structure [12], and can easily undergo soil acidification and become nutrient-imbalanced due to long-term shallow plowing and unreasonable fertilization, seriously affecting crop growth and yield [5]. According to the results of a multi-point sampling study at the county level, vertisol soil exhibited significant acidic stratification, with a significantly higher soil pH (on average by 0.8) at 20–30 cm depth than at 0–10 cm layer [13]. Sampling at different sites, the pH of the 41–50 cm layer was higher by 2 pH units compared to that at 0–10 cm. In that case, we hypothesis that fully mixed soils at different soil depths may be an effective way to solve the vertisol soil surface acidification.
Tillage improves soil physical structure and fertility. Some studies reported improved soil productivity by adjusting tillage, which significantly affected soil pH, physical structure, and nutrient availability, consequently increasing crop yield [14]. Deep tillage can help fully mix upper and lower soil layers, which may be an effective way to alleviate stratified acidification and poor structure of vertisol. For vertisol soils with heavy clay texture, completing deep plowing during field management was challenging. In addition, the input cost of deep tillage was higher than that of conventional rotary tillage. As an easily obtainable and widely used soil amendment, lime can effectively increase the soil pH in the short term and increase crop yields [15]. Combined with other amendments, it can improve the physicochemical properties of the soil and increase soil fertility [16,17]. Despite these advantages, exogenous additives have been shown to not only increase operational costs but also cause side effects, such as soil compaction [18,19]. In addition, the improvement effect of lime on soil pH was more significant in sandy soil than in clay soil [20]. The relevant studies have found that the poor mobility of lime in soil leads to a weaker impact on the subsoil [21,22]. Applying lime to the soil surface without conventional deep tillage was not considered an effective solution to soil acidification [23].
However, the optimum tillage depth for alleviating soil acidification, and the combined effect of tillage depth and lime in this clay vertisol are not clear. Hence, to alleviate the surface soil acidification problem of vertisol and improve the quality of cultivated land, a column incubation experiment was conducted by simulating different tillage depths. Control treatments with and without lime addition were also performed to investigate and compare the effects of deep tillage with/without lime application on soil stratified acidification and N and P availability. Phospholipid fatty acids (PLFAs) are specific structural components of cell membranes, found only in living cell [24]. Phospholipid fatty acid (PLFA) analysis can quantify specific microbial communities, e.g., fungi, bacteria, and actinomycetes [25]. In this study, the biomass of each microbial group and the total amount of microbial phospholipid fatty acids (PLFAs) were analyzed to investigate the effects of tillage depth and lime addition on soil microbial community structure and diversity. It was hypothesized that deep tillage or its combination with lime could increase the topsoil pH, alleviate stratified soil acidification, increase N and P availability to different degrees in different soil layers, and influence the microbial biomass and community structure. The results provide additional information for alleviating soil acidification and promoting the sustainable use of vertisol.
2. Materials and Methods
2.1. Site and Sampling Description
The soil samples used in this experiment were collected from a long-term rotational fertilized field in Xiping County, Henan Province, central China (33°25′39″ N, 113°49′23″ E). The area had a humid continental monsoon climate with an annual mean precipitation of 852 mm and a mean air temperature of 14.8 °C. The region is predominantly plains, with the topography high in the west and low in the east, and an average altitude of 77 m. According to the World Reference Base for Soil Resources (WRB), the soils in the study area are classified as vertisol [26], covering an area of about 4.0 million hectares in central China. The soil texture of the 0–20 cm soil layer of the study was mainly clay (50%), silt (37%), and sand (13%). The soil particle size distribution was determined by Mastersizer 2000 Type Laser Particle Analyzer (Malvern Instruments Ltd., Worcestershire, UK) [27]. Rotation between summer maize (June to October) and winter wheat (October to the following June) is the prevailing double-cropping system of the area. According to local agricultural planting habits, rotary tillage is conducted only during the wheat season, with a tillage depth of 15 cm. Fertilization consists of adding urea (46% N) (180 kg ha−1), (Xinlianxin, Xinxiang, China), superphosphate (14% P2O5) (kg ha−1), (Deyi fertilizer, Hubei, China), and potassium chloride (60% K2O) (kg ha−1), (Sinofert, Beijing, China), and all fertilizers are applied during sowing. A typical family farm of approximately 10 hectares, which has undergone the long-term fertilization and rotary tillage noted above, was chosen as the sampling area due to its evident stratified acidification according to a previous study [13].
After the maize was harvested in October 2020, soil column samples were randomly collected using an undisturbed soil drill with an internal diameter of 10 cm and a height of 50 cm. A total of ninety soil columns were collected for an incubation experiment, which consisted of six treatments, three replications, and five sampling times. Following the collection of soil columns, soil samples from each soil layer (0–10 cm, >10–20 cm, >20–30 cm, >30–40 cm, and >40–50 cm) were obtained for basic analysis of soil physicochemical properties. Three replicates were collected for each soil layer. Table 1 shows the initial soil properties of the different soil layers. The initial pH and nutrient availability of the different soil layers was set up as a control (CK).

Table 1.
Basic chemical properties of each soil layer of the experimental soil.
2.2. Experimental Design
The following six treatments were established: (1) The crushed and mixed soil column of 0–10 cm was placed in the upper 0–10 cm, connected to original soil columns of >10–50 cm soil layer below, which simulated a tillage depth of 10 cm (T10), (2) the crushed and mixed soil column of 0–30 cm was placed in the upper 0–30 cm, connected to original soil columns of >30–50 cm soil layer below, which simulated a tillage depth of 30 cm (T30) (3) the crushed and mixed 0–50 cm soil column was placed in the 0–50 cm soil layer, which simulated a tillage depth of 50 cm (T50), (4) the crushed 0–10 cm soil column was mixed with lime and placed in the upper 0–10 cm, connected to original soil columns of >10–50 cm soil layer below, which simulated tillage depth of 10 cm with lime application (T10+Lime), (5) the crushed 0–30 cm soil column was mixed with lime and placed in the upper 0–30 cm, connected to original soil columns of >30–50 cm soil layer below, which simulated tillage depth of 30 cm with lime application (T30+Lime), and (6) the crushed 0–50 cm soil column was mixed with lime and placed in the 0–50 cm, which simulated tillage depth of 50 cm with lime application (T50+Lime).
In present study, soil acidification mainly occurred at topsoil (0–20 cm), and the subsoil pH approached neutral 7, so lime was mainly considered to neutralize topsoil acidification. Soil cation exchange capacity (CEC) and base saturation (BS) were determined in this study’s 0–20 cm soil layer and were 22.0 cmol kg−1 and 62%, respectively. The amount of lime applied was calculated by multiplying the topsoil (0–20 cm) weight, CEC, and (1-BS). Therefore, the amount of lime used in the three treatments of adding lime in this study was the same, and the amount of lime added to the soil was 2 g kg−1 (5 t ha−1) in this experiment. The lime used was calcium carbonate (CaCO3) in the form of powder (Sinopharm Chemical Reagent Co., Ltd., Shanghai, China), with a purity of 99.0%, and the content of Sr, Ba, Fe, K, Mg, Na, and other nutrients in lime was less than 0.05%. Soil column samples were preserved and incubated by using PVC pipes with an internal diameter of 10 cm (Figure 1). Each pipe was sealed at the bottom using a plastic plate. The crushed and mixed soil was placed in PVC pipes, compacted with a bulk density of 1.3 g cm−3 and placed in the corresponding soil layer. The PVC pipes were incubated in the dark at 25 °C for 35 days, and soil moisture was controlled at 60% field moisture capacity by weight. The initial weight of each sample was recorded, and the soil was watered every 3 days to keep it at nearly constant moisture content.
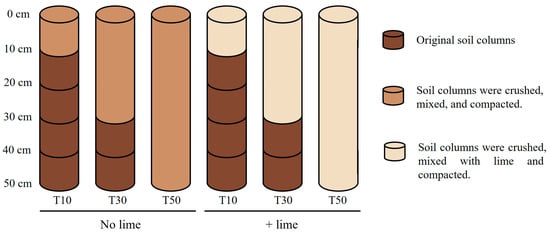
Figure 1.
Schematic depiction of the experimental design.
2.3. Soil Sample Collection
Destructive sampling was conducted on days 7, 14, 21, 28, and 35 of the incubations in three replicates for each treatment. The samples from each layer were sieved through a 2 mm sieve and divided into two parts: one was stored at 4 °C for NH4+/NO3−-N (ammonium/nitrate) extraction and PLFA determination, and the other was air-dried for soil pH and AP (available phosphorus) determination.
2.4. Measurement of Soil Parameters
The soil pH was determined at a water-to-soil ratio of 2.5:1 using a pH meter (PB-10, Sartorius, Germany). The content of soil exchangeable acids was determined by potassium chloride extraction–titration method [28]. The AP was extracted with NaHCO3 at 0.5 mol dm−3 and measured using the Olsen method [29]. NH4+-N and NO3−-N were extracted with 2 mol dm−3 KCl and measured using a flow injection analyzer SAN++® Classic (HQ—Skalar Analytical B.V., Breda, The Netherlands).
2.5. PLFA Extraction and Analysis
PLFA analysis characterizes the biomass and composition of soil microbial communities by identifying specific biomarkers for each microbial group [30]. At the end of the incubation period (35th day), soil microbial PLFAs of the topsoil (0–20 cm) were determined using a modified version of the Bligh-Dyer methods [31]. Methyl nonadecanoate (19:0) was employed as an internal standard. The abundance of individual fatty acid methyl esters was expressed as nmol g−1 dry soil. The identified PLFAs were classified into groups for specific microbiota: fungi (16:1ω5c, 18:1ω9c, and 18:2ω6,9c), actinomycetes (10Me16:0, 10Me17:0, and 10Me18:0), bacteria (i14:0, i15:0, a15:0, i16:0, a16:0, i17:0, a17:0, 16:1ω7c, 16:1ω9c, cy17:0, 17:1ω8c, 18:1ω5c, 18:1ω7c, 18:1ω9c, and cy19:0), Gram-positive bacteria (G+) (i14:0, i15:0, a15:0, i16:0, a16:0, i17:0, and a17:0), and Gram-negative bacteria (G−) (16:1ω7c, 16:1ω9c, cy17:0, 17:1ω8c, 18:1ω5c, 18:1ω7c, 18:1ω9c, and cy19:0). The fungi:bacterial (F/B) and the Gram-positive:Gram-negative bacterial (G+/G−) ratio were calculated as composite indicators of soil microbial community structure [32]. The Shannon–Wiener (H), Pielou (J), and Simpson’s indices (D) were used to evaluate microbial diversity [33].
2.6. Data Analysis
Statistical data analyses were performed using Excel 2022 and SPSS 25.0 software (IBM Co., Armonk, NY, USA). The Kolmogorov–Smirnov test was used to check data normality. To explore the effects of tillage depths and lime on topsoil acidification, nutrient availability, and soil microbial biomass, the differences in soil pH, exchangeable acidity, NH4+-N, NO3−-N, AP, and PLFAs among the different treatments were analyzed using one-way analysis of variance (ANOVA) with the Duncan test, where p < 0.05 was considered significant. Three-way ANOVA was employed to analyze the effects of time, tillage depth, lime application, and their interactions on topsoil (0–20 cm) pH, NH4+-N, NO3−-N, and AP. Two-way ANOVA was employed to analyze the effects of tillage depth, lime application, and their interactions on topsoil (0–20 cm) soil microbial community structures and diversity. Based on the nutrient content and mass of each soil layer, the accumulation of available N and P in 0–50 cm was calculated. Linear regression analysis was conducted to investigate the relationships between soil pH and nutrient availability. The graphs were generated using Origin Pro 2022 (OriginLab Co., Northampton, MA, USA) and GraphPad Prism 9 (GraphPad Software, Boston, MA, USA).
3. Results
3.1. Effects of Tillage and Lime Addition on the pH and Soil Exchangeable Acidity of the Topsoil (0–20 cm)
As shown in Table 2, the pH of mixed soil in each treatment reached its maximum at day 28 of the incubation and remained stable to the end of the incubation. The pH of the T50+Lime treatment was higher than that of the other treatments, reaching 7.17 on day 28. Compared with T10, the pH values of T50, T10+Lime, T30+Lime, and T50+Lime were significantly higher by 0.42, 0.89, 0.9, and 1.19, respectively, after 35 days of incubation. No significant difference was observed between T10 and T30 from days 21 to 35. In addition, the pH of T50 treatment was significantly higher than that of T10 and T30. Similar changes were observed after adding lime. In general, tillage depth and lime significantly affected soil pH (p < 0.001). The interaction results showed that there was significant interaction between the factors of incubation time, lime application, and tillage depth on the influence of soil surface pH (p < 0.05).
Table 2.
Dynamics of the topsoil (0–20 cm) pH under different treatments at various incubation times.
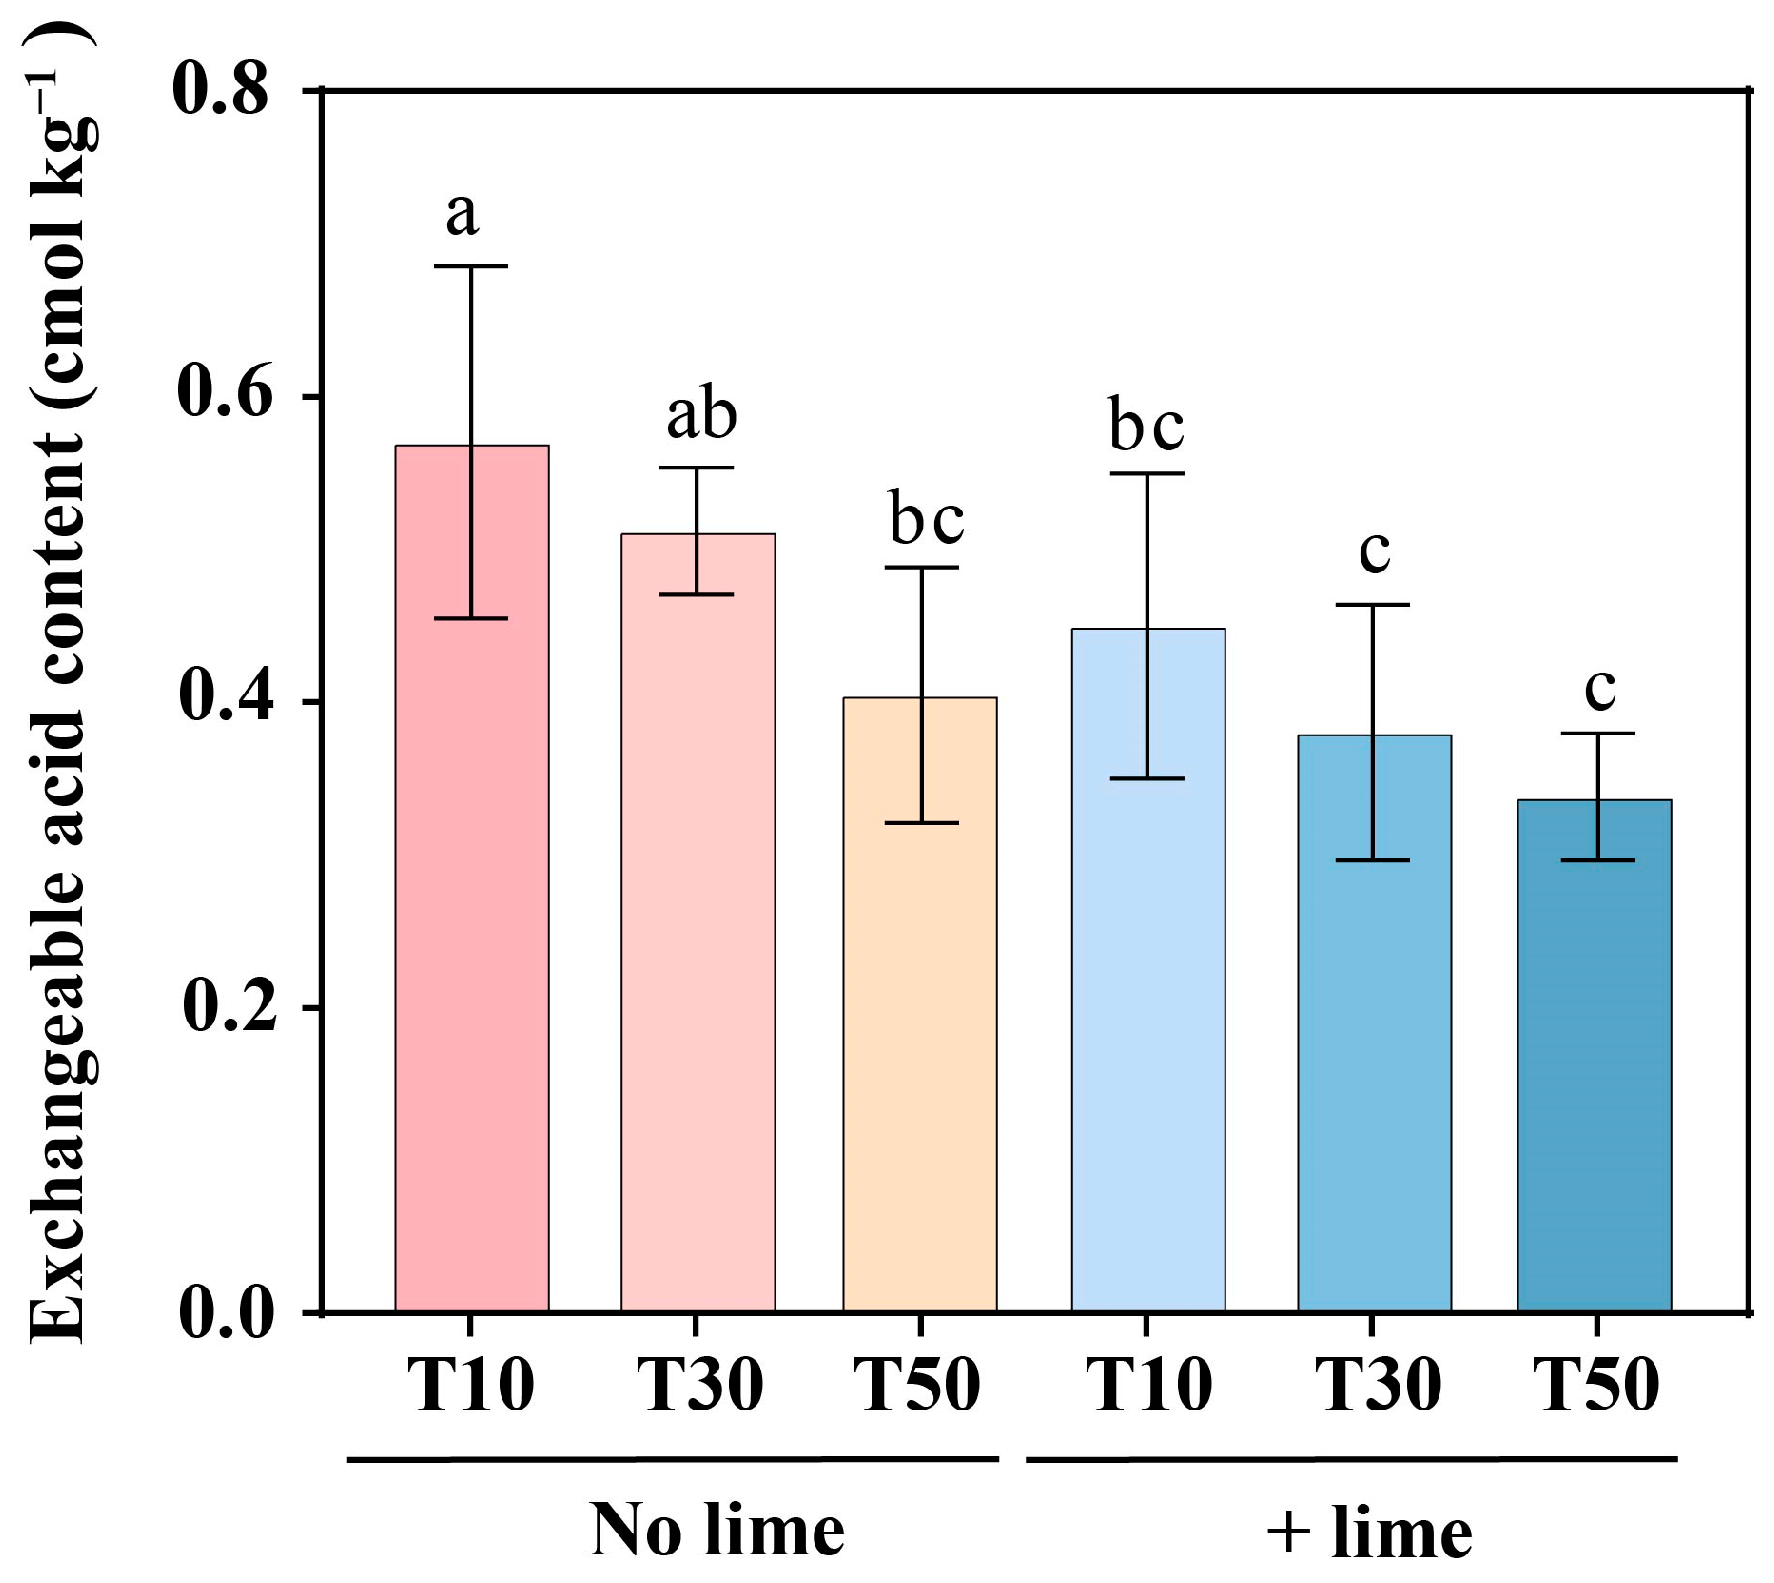
On the 35th day of cultivation, significant differences were observed in the exchangeable acid content in the 0–20 cm soil layer between the different treatments. The highest soil exchangeable acid content was found in the T10 treatment (0.57 cmol kg−1), which was significantly higher than in the T50 and T10+Lime treatments (p < 0.05). The exchangeable acid content of the T30+lime and T50+lime treatments decreased by 12.28% and 19.65%, respectively, compared to the T10+lime treatment. For the same tillage depth, lime addition decreased the soil exchangeable acid content, which was 0.12, 0.13, and 0.07 cmol kg−1 lower in T10+Lime, T30+Lime, and T50+Lime, respectively, compared to the corresponding treatments without lime (Figure 2).
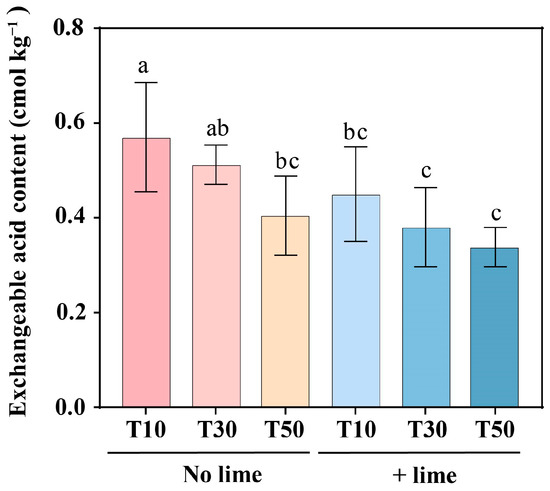
Figure 2.
The soil exchangeable acid content of 0–20 cm soil depth at the end of the incubation period. The differences in soil exchangeable acid content among the different treatments were determined by Duncan’s test. Different small letters indicate significant differences at the level of p < 0.05. T10, tillage depth 10 cm; T30, tillage depth 30 cm; T50, tillage depth 50 cm; T10+Lime, T10 plus lime; T30+Lime, T30 plus lime; T50+Lime, T50 plus lime.
3.2. Effects of Tillage and Lime Addition on the Soil Available N and P
3.2.1. Effects of Tillage and Lime Addition on NH4+-N Content (0–20 cm) and Accumulation (0–50 cm)
The topsoil (0–20 cm) NH4+-N content in each treatment reached its maximum after 14 days of incubation, with the T50 treatment having the highest value at 4.52 mg kg−1 (Table 3). The NH4+-N levels in the T30 and T50 treatments were higher than those in T10, although this difference was statistically insignificant. For the same tillage depth, the NH4+-N in T10+Lime, T30+Lime, and T50+Lime was 1.19, 1.33, and 1.46 mg kg−1, respectively, higher than those of the corresponding treatments without lime addition (1.06, 0.76, and 0.81 mg kg−1, respectively) on the 35th day. The interaction results showed that the incubation time had a significant effect on NH4+-N content of the topsoil (p < 0.001).
Table 3.
Dynamics of the topsoil (0–20 cm) NH4+-N content under different treatments at various incubation times.
After 35 days of cultivation, the total NH4+-N accumulation decreased significantly with increasing tillage depth. After adding lime, the total NH4+-N accumulation increased, but not significantly (Figure 3). The highest total accumulation of NH4+-N (22 mg) was found in the original soil column (CK), followed by the T10 and T10+Lime treatments. Compared with the T10 and T10+Lime treatments, the total NH4+-N accumulation in T30, T30+Lime, T50, and T50+Lime was lower by different degrees. The lowest total NH4+-N accumulation (4.07 mg) was found in the T50 treatment, which was reduced by 17.93 mg compared with that in the CK treatment. The contribution of the NH4+-N in the >30–50 cm soil layer of the T50 treatment to the total NH4+-N accumulation was reduced compared with that in the CK treatments. For the same tillage depth, lime addition increased the accumulation of NH4+-N, which was 0.27, 1.70, and 3.22 mg higher in T10+Lime, T30+Lime, and T50+Lime, respectively, compared to the corresponding treatments without lime.
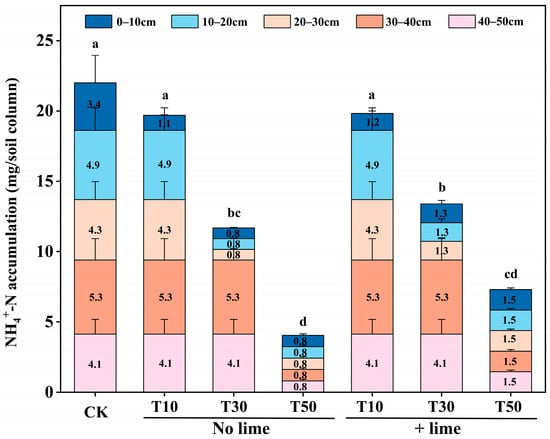
Figure 3.
The accumulated levels of NH4+-N across 0–50 cm soil depth at the end of the incubation period. The differences of accumulation levels among the different treatments were determined by Duncan’s test. Different small letters indicate significant differences at the level of p < 0.05. CK, initial content; T10, tillage depth 10 cm; T30, tillage depth 30 cm; T50, tillage depth 50 cm; T10+Lime, T10 plus lime; T30+Lime, T30 plus lime; T50+Lime, T50 plus lime.
3.2.2. Effects of Tillage and Lime Addition on NO3−-N Content (0–20 cm) and Accumulation (0–50 cm)
Compared with the initial NO3−-N content, the topsoil (0–20 cm) NO3−-N in each treatment increased by varying degrees (Table 4). The topsoil NO3−-N content in the T50 treatment was significantly lower than that in the T10 and T30 treatments. The NO3−-N concentration in treatment T50 was significantly lower than those in T10 and T30 by day 35, but the concentration in the T30 treatment was higher than in T10, though no significant difference was found between the two. Similar trends were observed in the lime addition treatments. At the same tillage depth, the NO3−-N in T10+Lime, T30+Lime, and T50+Lime was higher than in the corresponding treatments without lime addition. The interaction results revealed significant interaction effects between culture time and lime application (p < 0.01), as well as between culture time and tillage depth (p < 0.05).
Table 4.
Dynamics of the topsoil (0–20 cm) NO3--N content under different treatments at various incubation times.
After 35 days of incubation, compared with the CK, the total accumulation of NO3−-N in 0–50 cm soil layer increased significantly with increasing tillage depth and lime addition (Figure 4). The highest NO3−-N accumulation in the entire soil column (0–50 cm) was observed in T50+Lime (96.65 mg), followed by T50 (82.55 mg). Compared with T10 and T30, the total accumulation in T50 was significantly increased by 33.64 mg and 12.07 mg, respectively. The total NO3−-N accumulation in the T50+Lime treatment was significantly increased by 41.01 mg and 16.75 mg compared with the T10+Lime and T30+Lime treatments, respectively. At the end of the incubation period, the accumulation of NO3−-N in the topsoil (0–20 cm) of the T50 and T50+Lime treatments was 1.81- and 2.29-fold higher than that of the CK treatment, respectively. Similarly, NO3−-N accumulation in the >30–50 cm soil layer of T50 and T50+Lime treatments was 6.62- and 7.93-fold higher than in CK treatment, respectively. The contribution of NO3−-N in the >30–50 cm soil layers of T50 and T50+Lime to the total NO3−-N accumulation was approximately 40% higher than that in the other treatments.
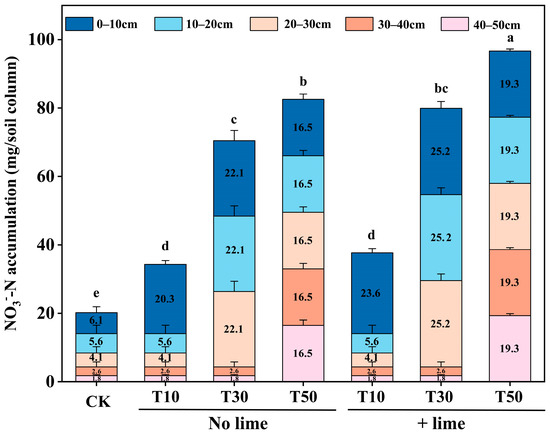
Figure 4.
The accumulated levels of NO3--N across 0–50 cm soil depth at the end of the incubation period. The differences of accumulation levels among the different treatments were determined by Duncan’s test. Different small letters indicate significant differences at the level of p < 0.05. CK, initial content; T10, tillage depth 10 cm; T30, tillage depth 30 cm; T50, tillage depth 50 cm; T10+Lime, T10 plus lime; T30+Lime, T30 plus lime; T50+Lime, T50 plus lime.
3.2.3. Effects of Tillage and Lime Addition on AP Content (0–20 cm) and Accumulation (0–50 cm)
The topsoil (0–20 cm) AP content fluctuated greatly during the first 21 days of incubation before becoming stable from 28 days of incubation onward (Table 5). The AP concentration in the T50 treatment was 15.27 mg kg−1 by day 35, which was significantly lower than that in T10 and T30. The AP concentration in the T30 treatment was similar to that in T10, and no significant difference was found between the two. Similar trends were observed in the lime addition treatments. At the same tillage depth, T30+Lime and T50+Lime had higher AP concentrations than T30 and T50 on day 35. Based on the results of the three-way ANOVA, there were significant interactions among the incubation time, lime application, and tillage depth on the topsoil AP content (p < 0.001).
Table 5.
Dynamics of the topsoil (0–20 cm) AP content under different treatments at various incubation times.
After 35 days of incubation, deep tillage increased the total accumulation in 0–50 cm soil of AP, especially in the >30–50 cm soil layer (Figure 5). Compared with CK, the total AP accumulation in T10, T30, T50, T10+Lime, T30+Lime, and T50+Lime increased by different degrees. The highest AP accumulation was observed in the T50+Lime treatment (83.11 mg), which was significantly higher than that in the CK treatment. The total AP accumulation in the T50 treatment was 76.35 mg, which was higher than that in the T10 and T30 treatments. The total AP accumulation in the T50+Lime treatment increased by 12.28 and 6.81 mg compared with the T10+Lime and T30+Lime treatments, respectively. Compared with the other treatments, T50 and T50+Lime showed the most increased AP accumulation in the >30–50 cm soil layer. The accumulation of AP in the >30–50 cm soil layers of the T50 and T50+Lime treatments was 1.33 and 1.54 times higher than in the T30 treatment, respectively.
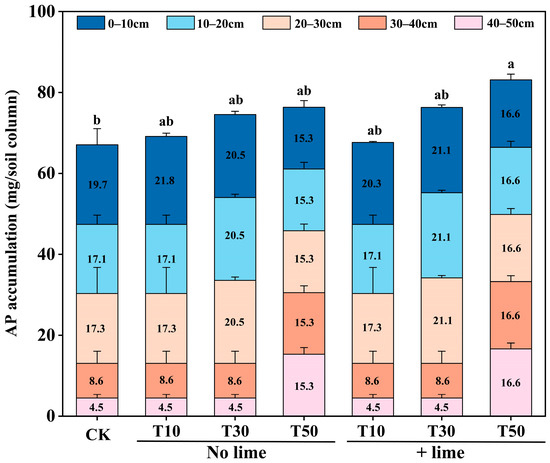
Figure 5.
The accumulated levels of AP across 0–50 cm soil depth at the end of the incubation period. The differences of accumulation levels among the different treatments were determined by Duncan’s test. Different small letters indicate significant differences at the level of p < 0.05. CK, initial content; T10, tillage depth 10 cm; T30, tillage depth 30 cm; T50, tillage depth 50 cm; T10+Lime, T10 plus lime; T30+Lime, T30 plus lime; T50+Lime, T50 plus lime.
3.3. The Relationship between Available Soil N and P and Soil pH
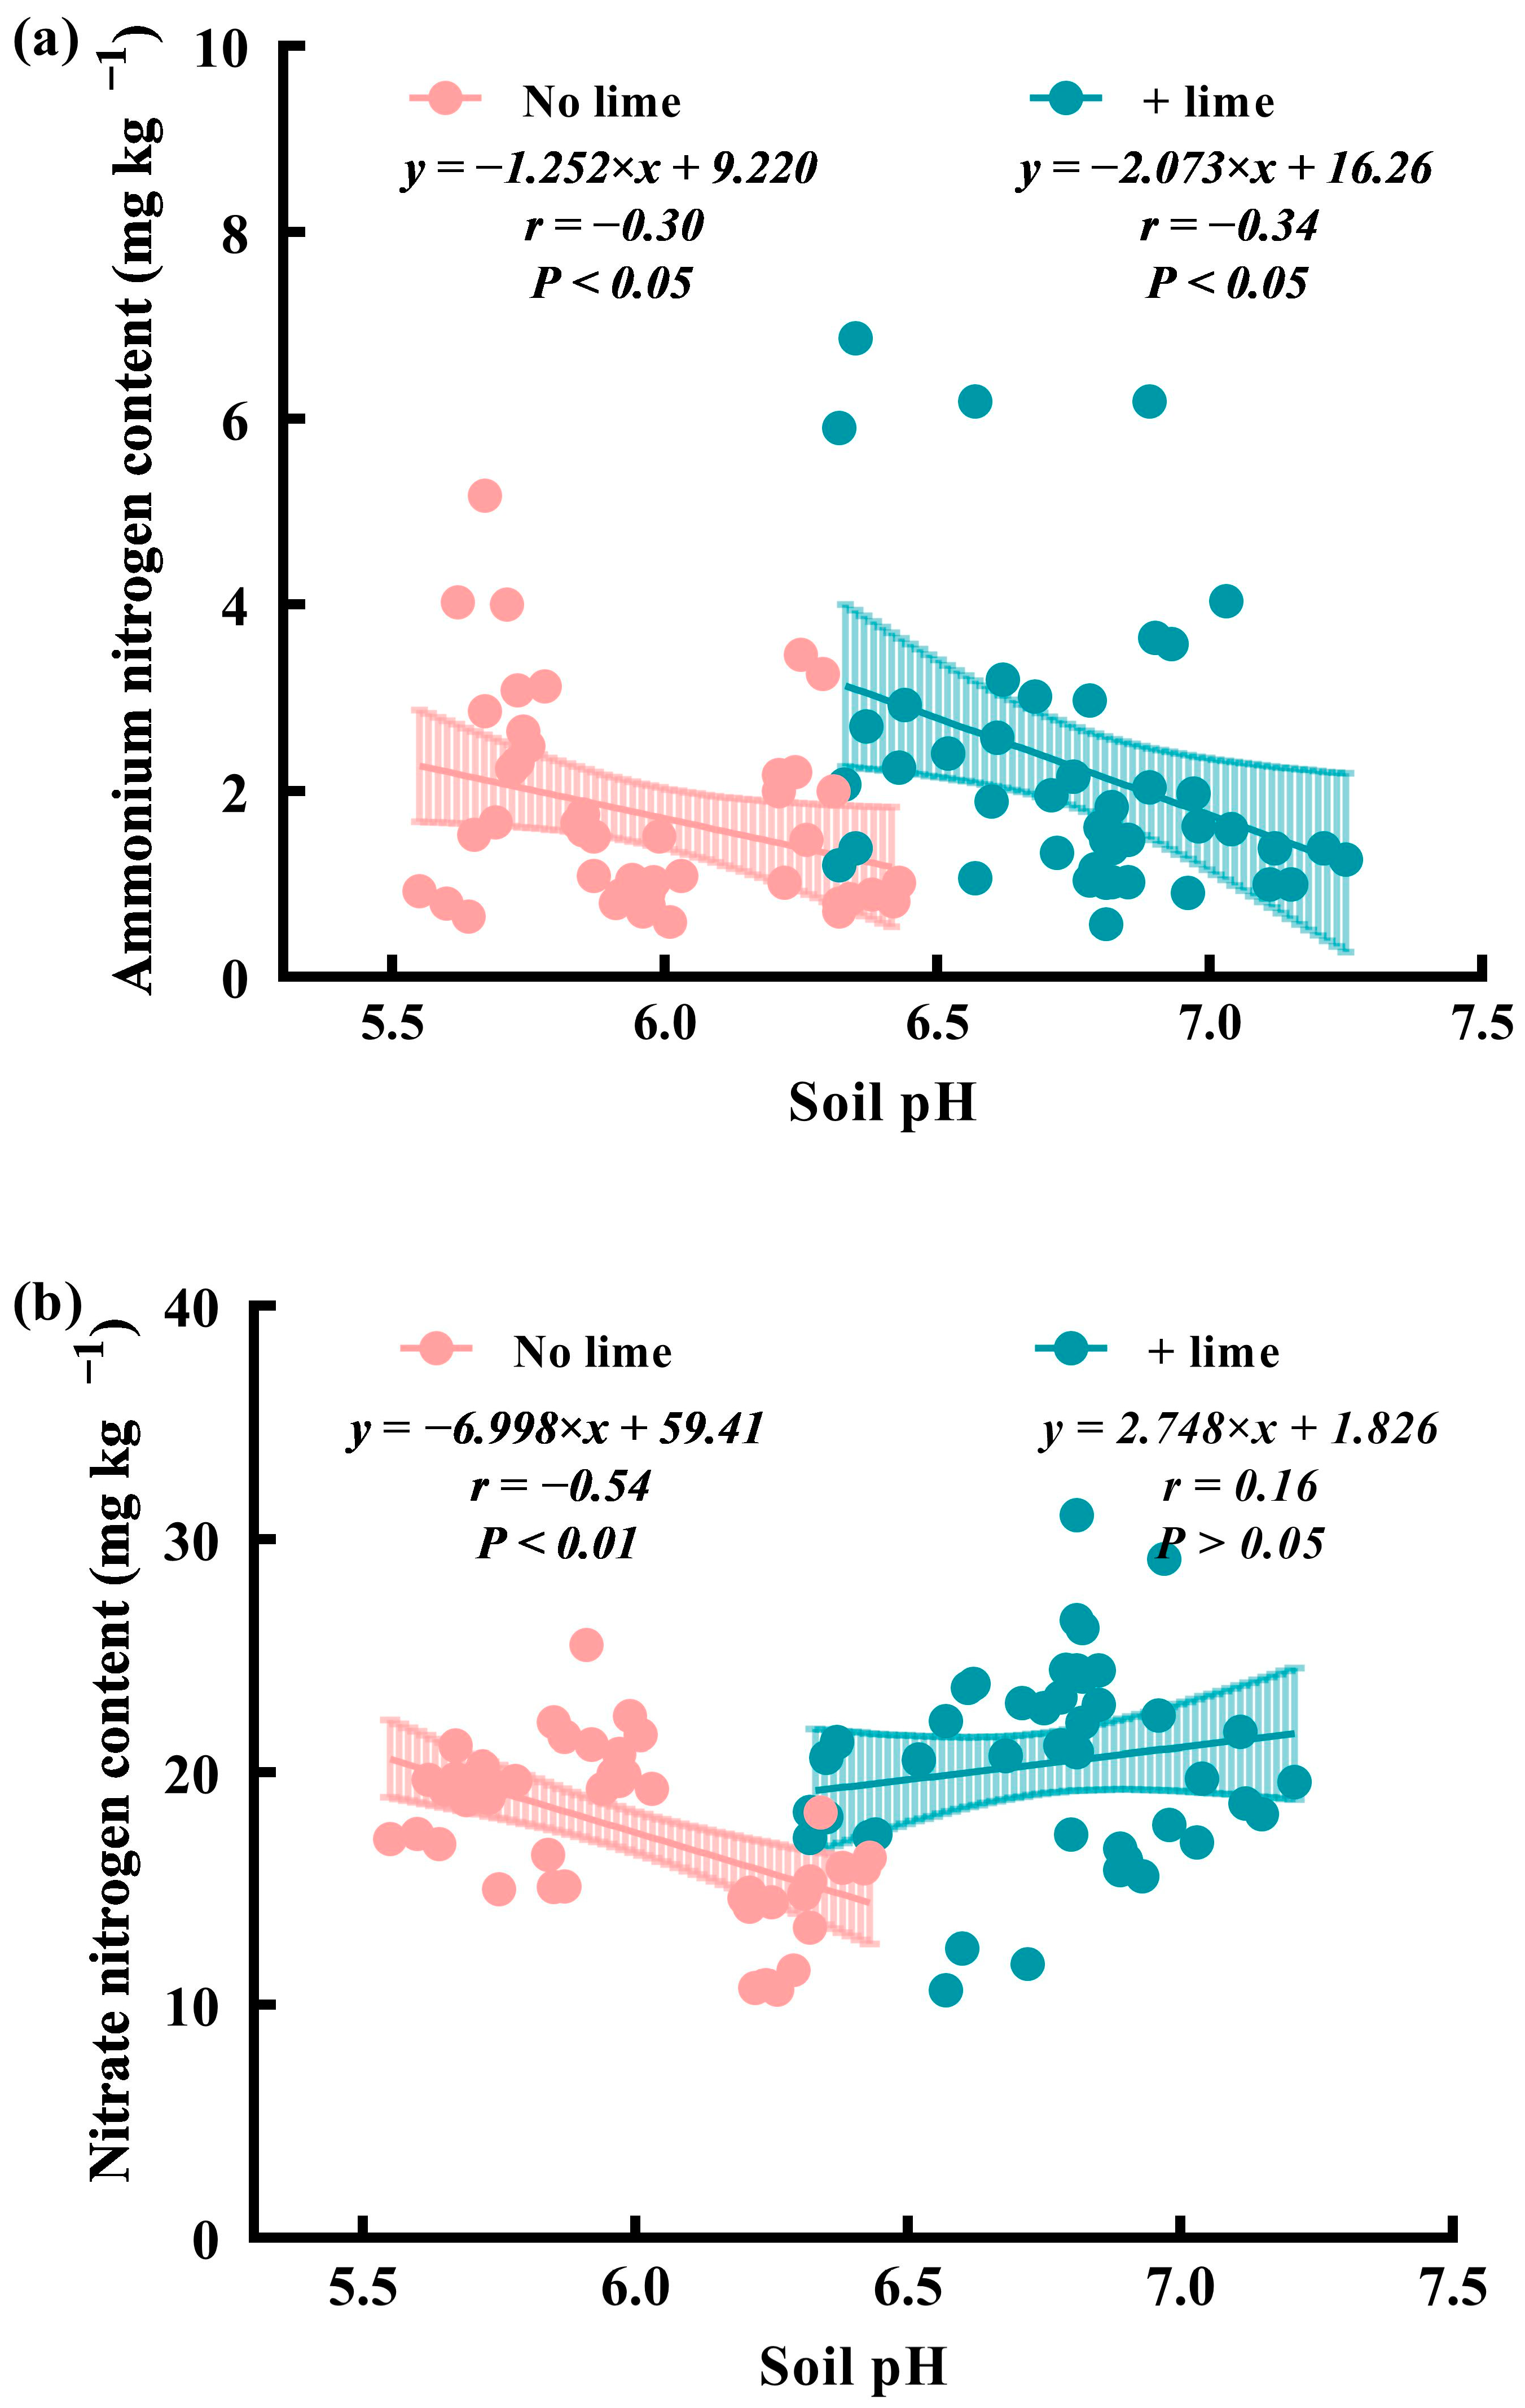
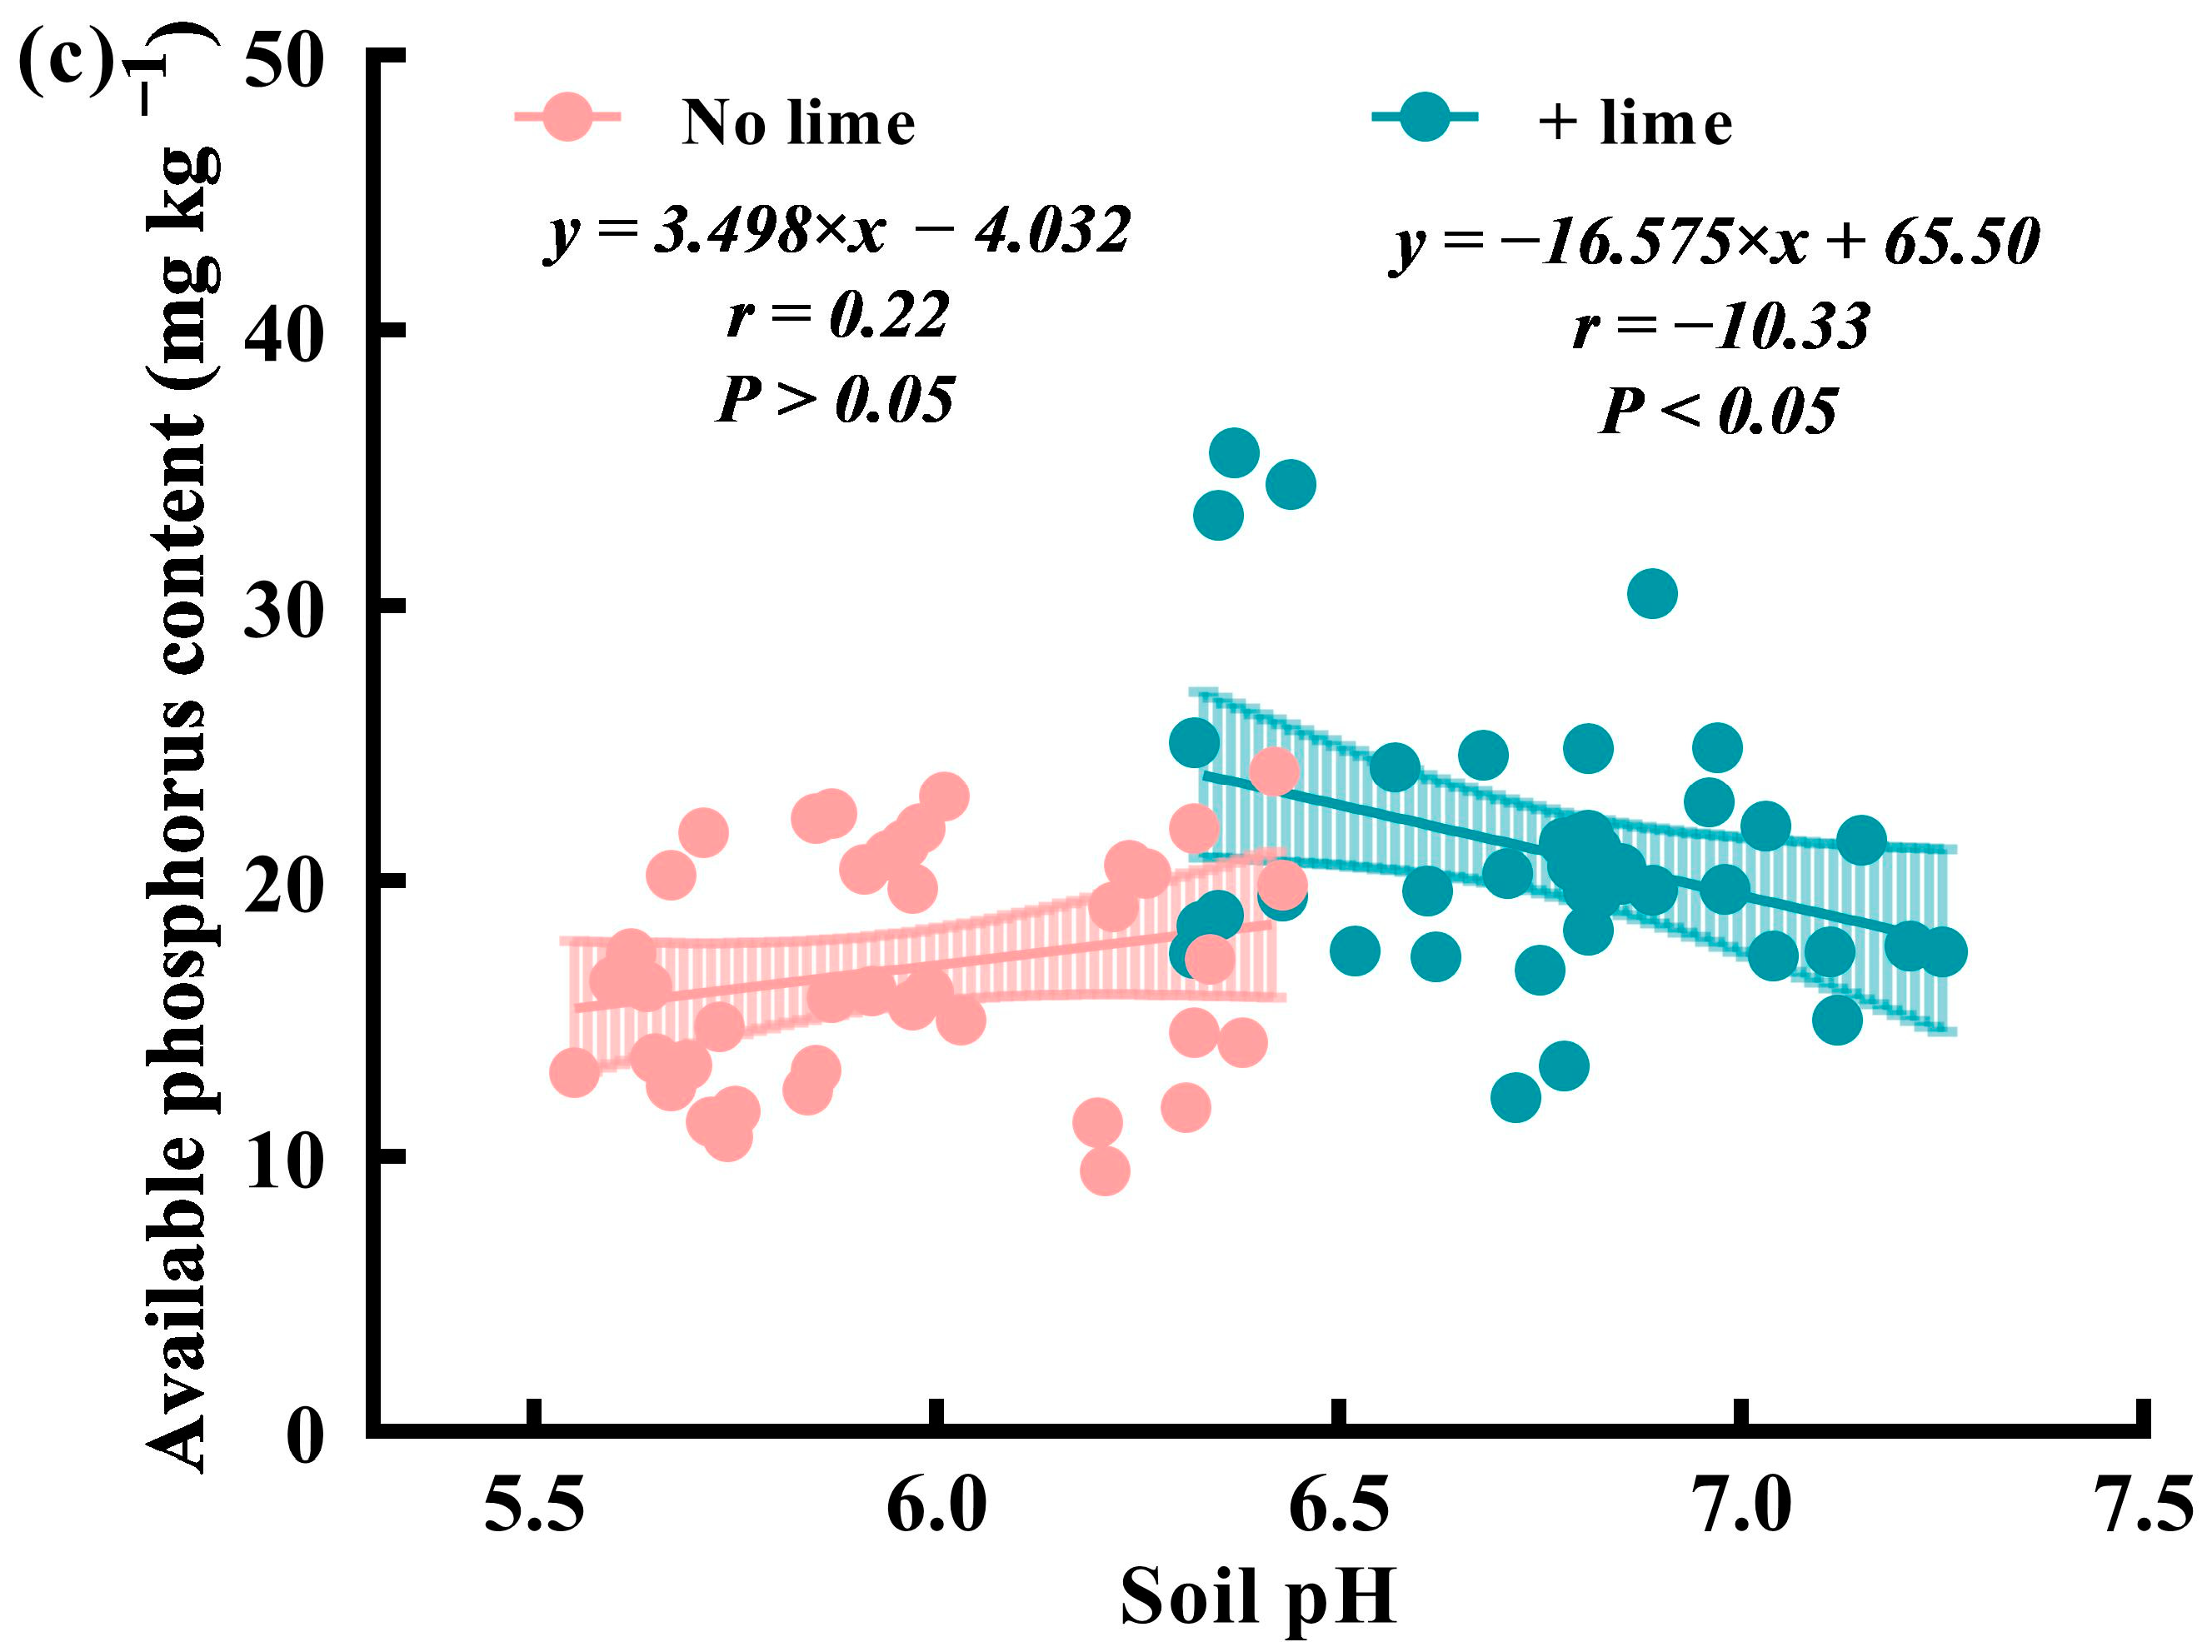
There was a correlation between soil NH4+-N, NO3−-N, and AP levels and soil pH (Figure 6). In treatments without lime, the soil pH ranged from 5.60 to 6.39, and NH4+-N and NO3−-N levels were negatively related to soil pH (p < 0.05); in contrast, the AP was positively correlated with soil pH (p > 0.05). NO3−-N had the highest correlation with the soil pH, with a correlation coefficient of −0.54 (p < 0.01; n = 45). The correlation between soil AP and pH was the lowest, with a correlation coefficient of 0.22 (p < 0.05; n = 45).
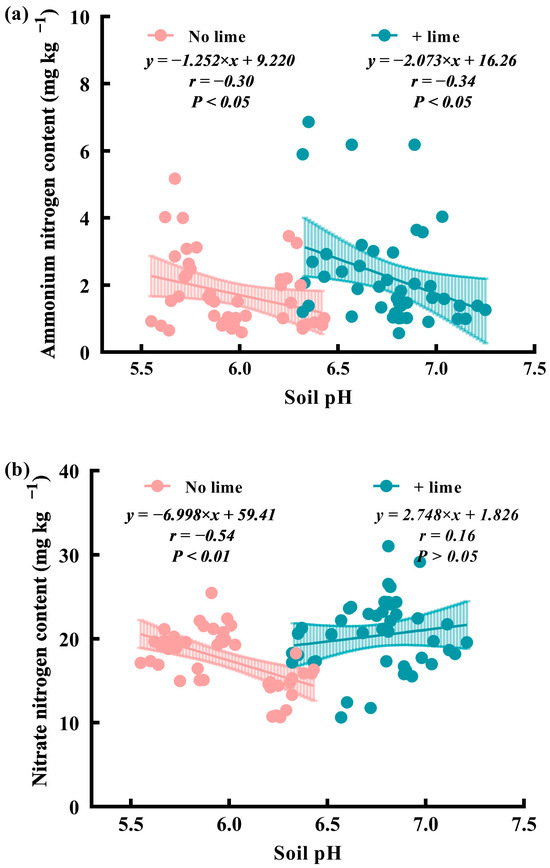

Figure 6.
Scatter plots showing the levels of available N, P and the soil pH levels. (a) Soil NH4+-N and pH; (b) soil NO3−-N and pH; (c) soil AP and pH.
When lime was applied, the soil pH ranged from 6.33 to 7.17, and soil NH4+-N and AP levels were negatively related to soil pH (p < 0.05). Soil NO3−-N was positively related to soil pH, although the correlation was statistically insignificant (p > 0.05). Soil NH4+-N showed the highest correlation with soil pH, with a correlation coefficient of −0.34 (p < 0.05; n = 45). A weak correlation was observed between the soil pH and NO3−-N, with a correlation coefficient of 0.16 (p > 0.05; n = 45).
3.4. Effects of Tillage and Lime Addition on Topsoil (0–20 cm) Microbial Community Structure and Diversity
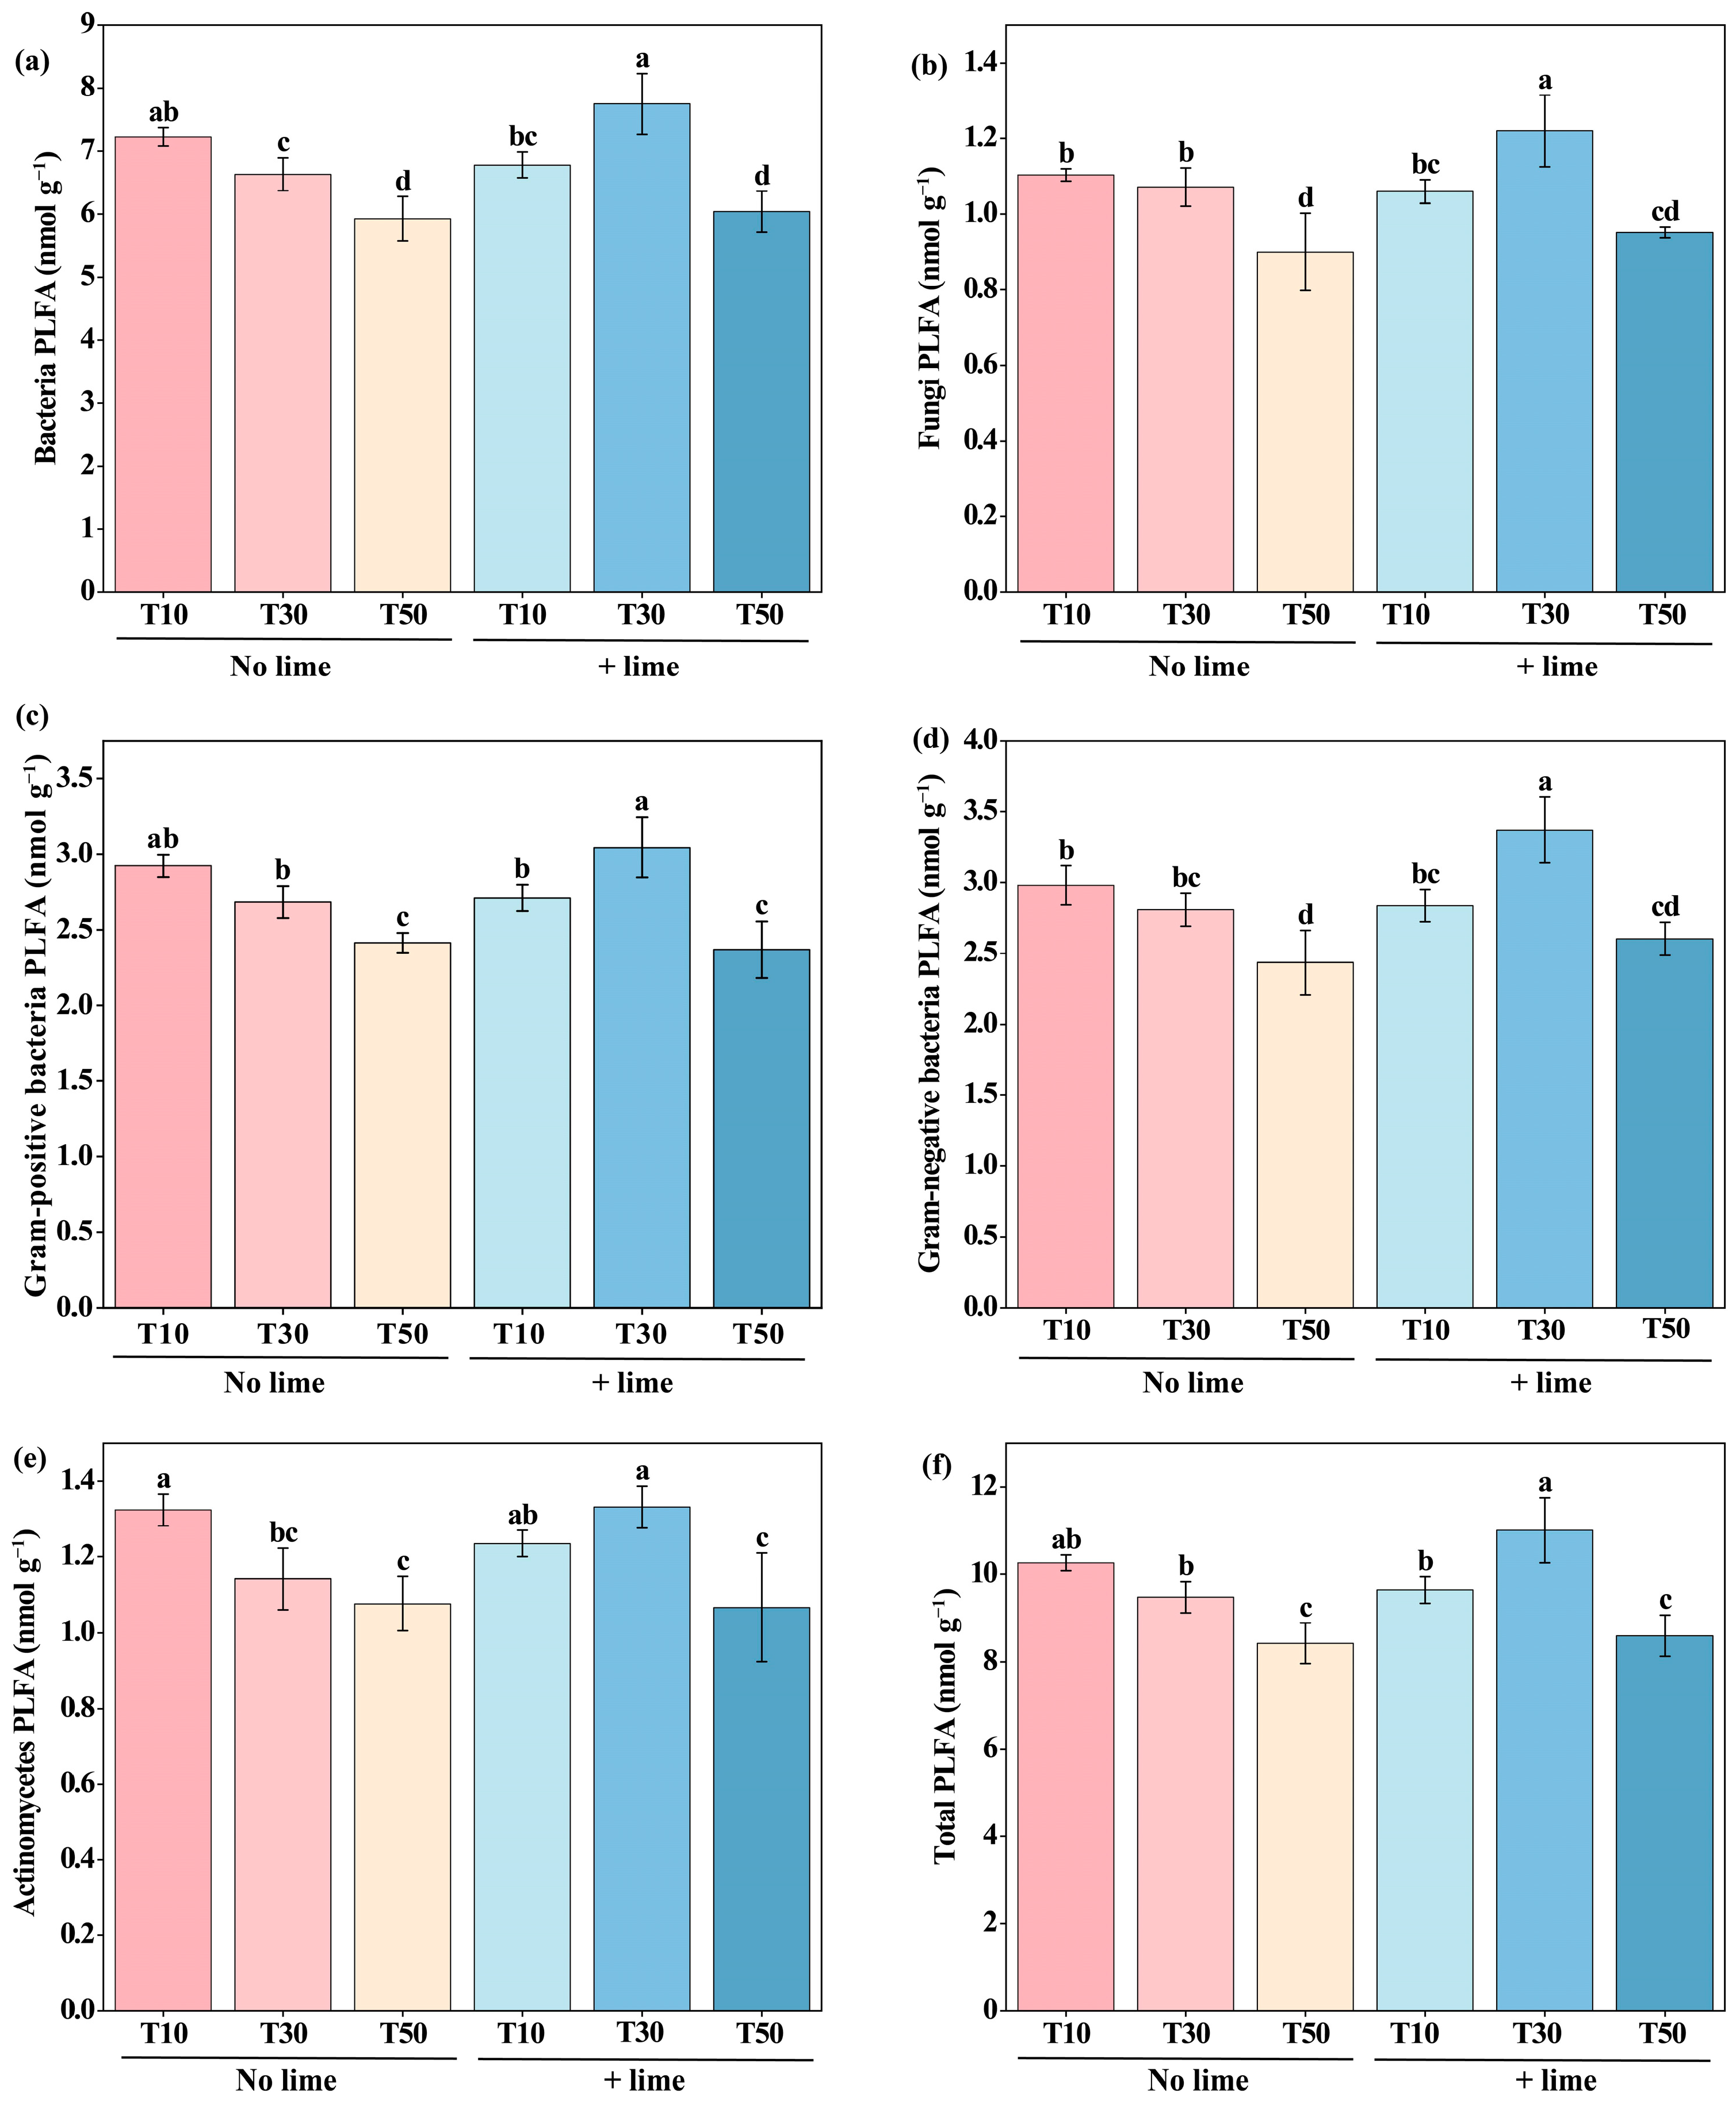
Tillage depth and lime addition significantly affected the soil microbial biomass and microbial community (Figure 7). The PLFA content of bacteria, fungi, G+, G−, and actinomycetes in the T50 treatment were significantly lower than that in the T10 and T30 treatments. The highest biomass of each microbial group and total microbial PLFAs were found in the T30+Lime treatment. The PLFA contents of bacteria, fungi, G+, and G− in the T30+Lime treatment were significantly higher than in the T10+Lime and T50+Lime treatments. At the same tillage depth, the biomass of each microbial group and the total microbial PLFAs in the T30+Lime treatment were significantly higher compared with the T30 treatment.

Figure 7.
Soil bacteria PLFA (a), fungi PLFA (b), Gram-positive bacteria PLFA (c), Gram-negative bacteria PLFA (d), actinomycetes PLFA (e), and total PLFA (f) contents of the topsoil (0–20 cm) under different treatments at the end of the incubation period. T10, tillage depth 10 cm; T30, tillage depth 30 cm; T50, tillage depth 50 cm; T10+Lime, T10 plus lime; T30+Lime, T30 plus lime; T50+Lime, T50 plus lime. Different lowercase letters on the bars indicate significant difference among treatments (p < 0.05).
The G+/G− ratio was significantly influenced by lime application (Table 6). At the same tillage depth, the G+/G− in T10+Lime, T30+Lime, and T50+Lime was lower than in the corresponding treatments without lime addition. The lowest G+/G− ratio was found in the T30+Lime treatment at 0.90, followed by the T50+Lime treatment (0.91). The G+/G− ratio of the T30+Lime and T50+Lime treatments was significantly lower than that of T50 treatment. The F/B ratio, H, J, and D were not significantly different among treatments. Based on the results of the two-way ANOVA, adding lime significantly affected the G+/G− ratio (p < 0.01).
Table 6.
Soil microbial community structures and diversity of the topsoil (0–20 cm) under different treatments at the end of the incubation period.
4. Discussion
4.1. Effects of Tillage and Lime Addition on the Soil Acidity
Tillage depth is a critical factor affecting soil physicochemical properties [34,35]. Soil pH and exchangeable acidity are critical indicators for assessing soil acidity characteristics. In this study, the topsoil pH increased significantly with increasing tillage depth. The soil pH in the T50 treatment was significantly higher than that in the T10 treatment. Deep tillage reduced the soil exchangeable acid content. The soil exchangeable acid content in the T50 treatment was significantly lower than that in T10 treatment. This result was consistent with the assumption that increasing tillage depth can effectively alleviate acidic stratification and mitigate topsoil acidification. Deep tillage improved the physical structure of the clay vertisol and mixed the acidified surface soil with unacidified deeper soil, increasing the pH of the surface soil and improving the stratified acidification, the deeper, the better. Lime is a commonly used soil amendment for acidification that is usually applied to the soil surface with either no or shallow tillage [36]. The results in this study also indicated that application of lime reduced the soil exchangeable acidity. The alkalinity of lime can neutralize the active and potential acidity in the soil, thus increasing the soil pH and reducing the soil exchangeable acid content [37].
4.2. Effects of Tillage and Lime on the Available N and P
When the tillage depth is shallow, nutrients are distributed unevenly in the soil layers, with higher levels in the topsoil compared to the subsoil [14,38,39]. This was also observed in the present study, where NO3−-N and AP in the topsoil of the T10 treatment were higher than those in the subsoil. This may be because the poor soil structure caused nutrients to accumulate in the topsoil, although the applied nutrients should be transported from the topsoil to the deeper layers [40].
Deep tillage and lime effectively improved soil acidification, which in turn enhanced nutrient availability. In this study, topsoil NH4+-N, NO3−-N and AP all changed dynamically during incubation. The incubation time had significant effects on them. In addition, NH4+-N and NO3−-N were the main forms of inorganic N in soil, and their content was influenced by organic N mineralization and inorganic N conversion process [41]. The pH was the key factor affecting available phosphorus. The relevant research found that in acidic or neutral soils, the increase in pH reduced the content of active Fe and Al, leading to reduced adsorption, fixation, and deposition of phosphorus by Fe and Al, and enhanced the availability of soil P [42]. This explained why the content of AP in the topsoil changes dynamically during incubation and why the soil AP after incubation was higher than control. Generally, AP content is highest at pH levels from neutral to slightly acidic [13,43]. Based on the relationship between pH and AP content (Figure 6c), the appropriate pH for the highest AP content was around 6.4–6.5. This might be one of the reasons why the T50+Lime treatment, with a pH of 7.12, had a lower AP when compared to the other lime addition treatment. In addition, the NO3−-N and AP content of the T50 and T50+Lime treatments were lower than that in the other treatments on the 35th day. This was probably because the deep tillage of 50 cm mixed the 0–50 cm soil, while the initial nutrient content in the >30–50 cm soil was lower.
An adequate tillage depth can adjust the soil structure and affect the amounts and distribution of N and P in the soil [44,45]. In this study, the NO3−-N and AP accumulation in the T50 treatment were higher than that in the T30 and T10 treatments, with or without lime addition. T50 and T50+L treatments mainly increased NO3−-N and AP levels in the >30–50 cm soil layer, resulting in nutrient accumulation in the deeper soil layers. These results were similar to related research findings that deep tillage promoted nitrogen transformation and partitioning at different soil depths [41], increased soil content of AP [46], and increased the availability of nutrients in the subsoil [35]. The NH4+-N in each soil layer decreased to some extent with the increasing tillage depth. Ammonia nitrogen is an alkaline substance with greater solubility in acidic environments. Deep tillage and lime addition could have increased the soil pH, affecting NH4+-N solubility and consequently reducing the accumulation of NH4+-N.
4.3. Effects of Tillage and Lime on Soil Microbial Community
Tillage depth and lime application affect the soil environment [47,48], changing in the abundance and composition of soil microorganisms [19,49]. In this study, the biomass of each microbial group and the microbial total PLFAs in T50 treatment were lower compared with the T10 and T30 treatments. According to Ji et al.’s research, topsoil contains more soil microorganisms than deep soil. The amount of soil actinomycetes, bacteria, and fungi decreased with increasing soil sampling depth [50]. Therefore, we suggest that the lower microbial content of the subsoil was one of the main reasons why deep tillage reduced the biomass of various microorganisms total microbial PLFAs in the topsoil. In addition, SOM and TN content varied with soil depth (Table 1). Deep tillage mixed subsoil with low nutrient content (e.g., SOM and TN) into the topsoil, which may contribute to affecting the microbial biomass. G+ bacteria prefer to utilize recalcitrant organic matter, while G− bacteria preferentially utilize readily degradable labile C sources [51,52]. The G+/G− ratio was often used as an important indicator of soil nutrient stress [53]. Here, the lowest G+/G− ratio and highest microbial biomass were found in the T30+Lime treatment, potentially attributed to the high availability of N and P in the topsoil.
5. Conclusions
This study demonstrated that the pH of the vertisol topsoil significantly increased with increasing tillage depth. Tillage depth and lime application also affected the NO3−-N, NH4+-N, and AP in the soil. Deep tillage (T50: 50 cm tillage depth) can effectively increase the topsoil pH of vertisol, reduce soil exchangeable acid content, and increase the accumulation of AP and NO3−-N in >30–50 cm soil layer. Tillage up to 50 cm without exogenous materials is one of the potential measures to improve soil acidification and increase subsoil nutrition availability, but the large soil disturbance and high input costs are unavoidable problems with deep tillage in the field. However, proper depth of tillage combined with lime (T30+Lime) also can alleviate the topsoil acidification, improving topsoil-available N and P content, as well as increase soil microbial biomass. From a crop growth perspective, T30+Lime treatment would be more advantageous for crops with shallower roots. It is important to emphasize that this study only explored improvements based on tillage depth and its combination with lime on stratified soil acidification through incubation experiments. Further field experiments are needed to provide a reliable base for the sustainable use of acidified soils.
Author Contributions
Conceptualization, P.L. and W.C.; methodology, P.L.; software, Y.S.; validation, Y.S., P.L. and S.L.; formal analysis, W.C.; investigation, F.L.; resources, P.L.; data curation, Y.S.; writing—original draft preparation, Y.S.; writing—review and editing, P.L.; visualization, Y.S.; supervision, Y.H.; project administration, P.L.; funding acquisition, Y.H. All authors have read and agreed to the published version of the manuscript.
Funding
This research was funded by the National Key Research and Development Program of China (2018YFD0200606, 2023YFD1901004).
Institutional Review Board Statement
Not applicable.
Data Availability Statement
All the data that support the findings of this study are included in this article.
Conflicts of Interest
The authors declare no conflicts of interest.
References
- Yadav, D.S.; Jaiswal, B.; Gautam, M.; Agrawal, M. Soil Acidification and Its Impact on Plants. In Plant Responses to Soil Pollution; Springer: Singapore, 2020; pp. 1–26. [Google Scholar]
- Guo, J.H.; Liu, X.J.; Zhang, Y.; Shen, J.L.; Han, W.X.; Zhang, W.F.; Christie, P.; Goulding, K.W.T.; Vitousek, P.M.; Zhang, F.S. Significant Acidification in Major Chinese Croplands. Science 2010, 327, 1008–1010. [Google Scholar] [CrossRef]
- Hao, T.; Zhu, Q.; Zeng, M.; Shen, J.; Shi, X.; Liu, X.; Zhang, F.; de Vries, W. Quantification of the Contribution of Nitrogen Fertilization and Crop Harvesting to Soil Acidification in a Wheat-Maize Double Cropping System. Plant Soil 2019, 434, 167–184. [Google Scholar] [CrossRef]
- Hao, T.; Liu, X.; Zhu, Q.; Zeng, M.; Chen, X.; Yang, L.; Shen, J.; Shi, X.; Zhang, F.; de Vries, W. Quantifying Drivers of Soil Acidification in Three Chinese Cropping Systems. Soil Tillage Res. 2022, 215, 105230. [Google Scholar] [CrossRef]
- Wu, Z.; Sun, X.; Sun, Y.; Yan, J.; Zhao, Y.; Chen, J. Soil Acidification and Factors Controlling Topsoil PH Shift of Cropland in Central China from 2008 to 2018. Geoderma 2022, 408, 115586. [Google Scholar] [CrossRef]
- Zhu, Q.; de Vries, W.; Liu, X.; Hao, T.; Zeng, M.; Shen, J.; Zhang, F. Enhanced Acidification in Chinese Croplands as Derived from Element Budgets in the Period 1980–2010. Sci. Total Environ. 2018, 618, 1497–1505. [Google Scholar] [CrossRef] [PubMed]
- Li, A.; Li, C.; Zhang, Y.; Deng, Q.; Fang, H.; Zhao, B.; Ran, M.; Song, L.; Xue, J.; Tao, Q.; et al. The Driving Factors and Buffering Mechanism Regulating Cropland Soil Acidification across the Sichuan Basin of China. CATENA 2023, 220, 106688. [Google Scholar] [CrossRef]
- Pan, X.; Baquy, M.A.-A.; Guan, P.; Yan, J.; Wang, R.; Xu, R.; Xie, L. Effect of Soil Acidification on the Growth and Nitrogen Use Efficiency of Maize in Ultisols. J. Soils Sediments 2020, 20, 1435–1445. [Google Scholar] [CrossRef]
- Qaswar, M.; Dongchu, L.; Jing, H.; Tianfu, H.; Ahmed, W.; Abbas, M.; Lu, Z.; Jiangxue, D.; Khan, Z.H.; Ullah, S.; et al. Interaction of Liming and Long-Term Fertilization Increased Crop Yield and Phosphorus Use Efficiency (PUE) through Mediating Exchangeable Cations in Acidic Soil under Wheat–Maize Cropping System. Sci. Rep. 2020, 10, 19828. [Google Scholar] [CrossRef]
- Wan, W.; Tan, J.; Wang, Y.; Qin, Y.; He, H.; Wu, H.; Zuo, W.; He, D. Responses of the Rhizosphere Bacterial Community in Acidic Crop Soil to PH: Changes in Diversity, Composition, Interaction, and Function. Sci. Total Environ. 2020, 700, 134418. [Google Scholar] [CrossRef]
- Li, K.; Lu, H.; Nkoh, J.N.; Hong, Z.; Xu, R. Aluminum Mobilization as Influenced by Soil Organic Matter during Soil and Mineral Acidification: A Constant PH Study. Geoderma 2022, 418, 115853. [Google Scholar] [CrossRef]
- Wang, Y.K.; Zhang, Z.B.; Jiang, F.H.; Guo, Z.C.; Peng, X.H. Evaluating Soil Physical Quality Indicators of a Vertisol as Affected by Different Tillage Practices under Wheat-Maize System in the North China Plain. Soil Tillage Res. 2021, 209, 104970. [Google Scholar] [CrossRef]
- Chen, W.J.; Li, P.P.; Wen, Q.; Huang, K.M.; Wang, M.Y.; Xu, H.; Hua, D.L.; Han, Y.L. Characteristics of Acidification and the Distribution of Available Phosphorus along Soil Depths in Heavy Clay Soils in Southern Henan Province, China. Chin. J. Appl. Ecol. 2022, 33, 126–132. [Google Scholar] [CrossRef]
- Wang, L.; Guo, H.; Wang, L.; Cheng, D. Suitable Tillage Depth Promotes Maize Yields by Changing Soil Physical and Chemical Properties in A 3-Year Experiment in the North China Plain. Sustainability 2022, 14, 15134. [Google Scholar] [CrossRef]
- Holland, J.E.; Bennett, A.E.; Newton, A.C.; White, P.J.; McKenzie, B.M.; George, T.S.; Pakeman, R.J.; Bailey, J.S.; Fornara, D.A.; Hayes, R.C. Liming Impacts on Soils, Crops and Biodiversity in the UK: A Review. Sci. Total Environ. 2018, 610–611, 316–332. [Google Scholar] [CrossRef]
- Zheng, J.; Luan, L.; Luo, Y.; Fan, J.; Xu, Q.; Sun, B.; Jiang, Y. Biochar and Lime Amendments Promote Soil Nitrification and Nitrogen Use Efficiency by Differentially Mediating Ammonia-Oxidizer Community in an Acidic Soil. Appl. Soil Ecol. 2022, 180, 104619. [Google Scholar] [CrossRef]
- Islam, M.R.; Talukder, M.M.H.; Hoque, M.A.; Uddin, S.; Hoque, T.S.; Rea, R.S.; Alorabi, M.; Gaber, A.; Kasim, S. Lime and Manure Amendment Improve Soil Fertility, Productivity and Nutrient Uptake of Rice-Mustard-Rice Cropping Pattern in an Acidic Terrace Soil. Agriculture 2021, 11, 1070. [Google Scholar] [CrossRef]
- Guo, A.; Ding, L.; Tang, Z.; Zhao, Z.; Duan, G. Microbial Response to CaCO3 Application in an Acid Soil in Southern China. J. Environ. Sci. 2019, 79, 321–329. [Google Scholar] [CrossRef] [PubMed]
- Li, S.; Ji, X.; Chao, C.; Liu, Z.; Zhu, J.; Peng, H. Effects of Increasing Lime Application Rates on Microbial Diversity and Community Structure in Paddy Soils. Appl. Soil Ecol. 2021, 161, 103837. [Google Scholar] [CrossRef]
- Li, Y.; Cui, S.; Chang, S.X.; Zhang, Q. Liming Effects on Soil PH and Crop Yield Depend on Lime Material Type, Application Method and Rate, and Crop Species: A Global Meta-Analysis. J. Soils Sediments 2019, 19, 1393–1406. [Google Scholar] [CrossRef]
- Gascho, G.J.; Parker, M.B. Long-Term Liming Effects on Coastal Plain Soils and Crops. Agron. J. 2001, 93, 1305–1315. [Google Scholar] [CrossRef]
- Tao, H.; Pan, W.L.; Carter, P.; Wang, K. Addition of Lignin to Lime Materials for Expedited PH Increase and Improved Vertical Mobility of Lime in No-till Soils. Soil Use Manag. 2019, 35, 314–322. [Google Scholar] [CrossRef]
- Pellissier, J.P.; Swanepoel, P.A.; Hardie, A.G.; Labuschagne, J. Strategies to Alleviate PH Stratification and Subsurface Acidity in a No-Tillage System. Agron. J. 2024, 116, 777–789. [Google Scholar] [CrossRef]
- Frostegård, Å.; Bååth, E.; Tunlio, A. Shifts in the Structure of Soil Microbial Communities in Limed Forests as Revealed by Phospholipid Fatty Acid Analysis. Soil Biol. Biochem. 1993, 25, 723–730. [Google Scholar] [CrossRef]
- Li, X.; Sun, J.; Wang, H.; Li, X.; Wang, J.; Zhang, H. Changes in the soil microbial Phospholipid Fatty Acid Profile with depth in three soil types of paddy fields in China. Geoderma 2017, 290, 69–74. [Google Scholar] [CrossRef]
- IUSS Working Group WRB. World Reference Base for Soil Resources. In International Soil Classification System for Naming Soils and Creating Legends for Soil Maps, 4th ed.; International Union of Soil Sciences (IUSS): Vienna, Austria, 2022. [Google Scholar]
- Wan, Q.; Wang, J.; Wang, S.X.; Liu, G.B.; Zhang, C. Effects of different meadow use types on the fractal characteristics of soil particle in the Qinghai-Tibet Plateau. Acta Ecol. Sin. 2022, 42, 1716–1726. [Google Scholar] [CrossRef]
- Zaffar, M.; Zong, Y.; Lu, S.; Ghulam, H.A.; Shafaqat, A.; Muhammad, I.K.; Muhammad, K.; Moazzam, J.; Mohammad, A.W.; Muhammad, R. Effect of Biochar and Quicklime on Growth of Wheat and Physicochemical Properties of Ultisols. Arab. J. Geosci. 2018, 11, 1–12. [Google Scholar] [CrossRef]
- Olsen, S.R.; Sommers, L.E. Phosphorus. In Methods of Soil Analysis. Part 2. Chemical and Microbiological Properties; SSSA: Madison, MI, USA, 1982; Volume 9, pp. 403–430. [Google Scholar]
- Han, C.; Chen, L.; Xin, X.; Zhou, G.; Zhang, C.; Ma, D.; Li, Y.; Ma, L.; Zhang, J. Long-Term Fertilization Affects Microbial Necromass Accumulation by Regulating Nutrient and Enzymatic Stoichiometry in a Calcareous Fluvisol. Appl. Soil Ecol. 2024, 194, 105169. [Google Scholar] [CrossRef]
- Bossio, D.A.; Scow, K.M.; Gunapala, N.; Graham, K.J. Determinants of Soil Microbial Communities: Effects of Agricultural Management, Season, and Soil Type on Phospholipid Fatty Acid Profiles. Microb. Ecol. 1998, 36, 1–12. [Google Scholar] [CrossRef]
- Niroshika, K.; Zhou, Y.; An, Z.; Cai, Y.; Chang, X. Science of the Total Environment Microplastics Affect the Ecological Stoichiometry of Plant, Soil and Microbes in a Greenhouse Vegetable System. Sci. Total Environ. 2024, 924, 171602. [Google Scholar] [CrossRef]
- Gao, Y.; Sun, S.; Xing, F.; Mu, X.; Bai, Y. Nitrogen Addition Interacted with Salinity-Alkalinity to Modify Plant Diversity, Microbial PLFAs and Soil Coupled Elements: A 5-Year Experiment. Appl. Soil Ecol. 2019, 137, 78–86. [Google Scholar] [CrossRef]
- Gómez, J. Effects of Tillage Method on Soil Physical Properties, Infiltration and Yield in an Olive Orchard. Soil Tillage Res. 1999, 52, 167–175. [Google Scholar] [CrossRef]
- Schneider, F.; Don, A.; Hennings, I.; Schmittmann, O.; Seidel, S.J. The Effect of Deep Tillage on Crop Yield—What Do We Really Know? Soil Tillage Res. 2017, 174, 193–204. [Google Scholar] [CrossRef]
- Auler, A.C.; Pires, L.F.; dos Santos, J.A.B.; Caires, E.F.; Borges, J.A.R.; Giarola, N.F.B. Effects of Surface-Applied and Soil-Incorporated Lime on Some Physical Attributes of a Dystrudept Soil. Soil Use Manag. 2017, 33, 129–140. [Google Scholar] [CrossRef]
- Wakwoya, M.B.; Woldeyohannis, W.H.; Yimamu, F.K. Effects of Minimum Tillage and Liming on Maize (Zea mays L.) Yield Components and Selected Properties of Acid Soils in Assosa Zone, West Ethiopia. J. Agric. Food Res. 2022, 8, 100301. [Google Scholar] [CrossRef]
- Franzluebbers, A.J.; Schomberg, H.H.; Endale, D.M. Surface-Soil Responses to Paraplowing of Long-Term No-Tillage Cropland in the Southern Piedmont USA. Soil Tillage Res. 2007, 96, 303–315. [Google Scholar] [CrossRef]
- Zhang, Y.; Tan, C.; Wang, R.; Li, J.; Wang, X. Conservation Tillage Rotation Enhanced Soil Structure and Soil Nutrients in Long-Term Dryland Agriculture. Eur. J. Agron. 2021, 131, 126379. [Google Scholar] [CrossRef]
- Jiang, W.; Gong, L.; Yang, L.; He, S.; Liu, X. Dynamics in C, N, and P Stoichiometry and Microbial Biomass Following Soil Depth and Vegetation Types in Low Mountain and Hill Region of China. Sci. Rep. 2021, 11, 19631. [Google Scholar] [CrossRef]
- Shen, F.; Zhu, C.; Jiang, G.; Yang, J.; Zhu, X.; Wang, S.; Wang, R.; Liu, F.; Jie, X.; Liu, S. Differentiation in Nitrogen Transformations and Crop Yield as Affected by Tillage Modes in a Fluvo-Aquic Soil. Plants 2023, 12, 783. [Google Scholar] [CrossRef]
- Cai, G.; Hu, Y.; Wang, T.; Yuan, H.; Wang, J.; Liu, Q.; Ge, T.; Wu, J. Characteristics and Influencing Factors of Biologically-based Phosphorus Fractions in the Farmland Soil. Environ. Sci. 2017, 38, 1606–1612. [Google Scholar] [CrossRef]
- da Silva Cerozi, B.; Fitzsimmons, K. The Effect of PH on Phosphorus Availability and Speciation in an Aquaponics Nutrient Solution. Bioresour. Technol. 2016, 219, 778–781. [Google Scholar] [CrossRef]
- Cai, H.; Ma, W.; Zhang, X.; Ping, J.; Yan, X.; Liu, J.; Yuan, J.; Wang, L.; Ren, J. Effect of Subsoil Tillage Depth on Nutrient Accumulation, Root Distribution, and Grain Yield in Spring Maize. Crop J. 2014, 2, 297–307. [Google Scholar] [CrossRef]
- Huang, S.; Islam, M.U.; Jiang, F. The Effect of Deep-Tillage Depths on Crop Yield: A Global Meta-Analysis. Plant Soil Environ. 2023, 69, 105–117. [Google Scholar] [CrossRef]
- Niu, R.; Zhu, C.; Jiang, G.; Yang, J.; Zhu, X.; Li, L.; Shen, F.; Jie, X.; Liu, S. Variations in Soil Nitrogen Availability and Crop Yields under a Three-Year Annual Wheat and Maize Rotation in a Fluvo-Aquic Soil. Plants 2023, 12, 808. [Google Scholar] [CrossRef]
- Ejigu, W.; Selassie, Y.G.; Elias, E.; Molla, E. Effect of Lime Rates and Method of Application on Soil Properties of Acidic Luvisols and Wheat (Triticum aestivum, L.) Yields in Northwest Ethiopia. Heliyon 2023, 9, e13988. [Google Scholar] [CrossRef] [PubMed]
- Li, Z.; Liu, H.; Wang, T.; Gong, P.; Li, P.; Li, L.; Bai, Z. Deep Vertical Rotary Tillage Depths Improved Soil Conditions and Cotton Yield for Saline Farmland in South Xinjiang. Eur. J. Agron. 2024, 156, 127166. [Google Scholar] [CrossRef]
- Hu, R.; Zheng, B.; Liu, Y.; Peng, S.; Gong, J.; Li, J.; Qin, T.; Liang, J.; Xiong, K.; Shao, L.; et al. Deep Tillage Enhances the Spatial Homogenization of Bacterial Communities by Reducing Deep Soil Compaction. Soil Tillage Res. 2024, 239, 106062. [Google Scholar] [CrossRef]
- Ji, B.; Hu, H.; Zhao, Y.; Mu, X.; Liu, K.; Li, C. Effects of Deep Tillage and Straw Returning on Soil Microorganism and Enzyme Activities. Sci. World J. 2014, 2014, 451493. [Google Scholar] [CrossRef]
- Kang, H.; Yu, W.; Dutta, S.; Gao, H. Geoderma Soil Microbial Community Composition and Function Are Closely Associated with Soil Organic Matter Chemistry along a Latitudinal Gradient. Geoderma 2021, 383, 114744. [Google Scholar] [CrossRef]
- Kohl, L.; Kate, A.M.; Sharon, A.E.; Warren, J.; Podrebarac, F.A.; Ziegler, S.E. Microbial Inputs at the Litter Layer Translate Climate into Altered Organic Matter Properties. Glob. Chang. Biol. 2021, 27, 435–453. [Google Scholar] [CrossRef]
- Wang, X.; Wang, X.; Zhang, W.; Shao, Y.; Zou, X.; Liu, T.; Zhou, L.; Wan, S.; Rao, X.; Li, Z.; et al. Invariant Community Structure of Soil Bacteria in Subtropical Coniferous and Broadleaved Forests. Sci. Rep. 2016, 6, 19071. [Google Scholar] [CrossRef]


Disclaimer/Publisher’s Note: The statements, opinions and data contained in all publications are solely those of the individual author(s) and contributor(s) and not of MDPI and/or the editor(s). MDPI and/or the editor(s) disclaim responsibility for any injury to people or property resulting from any ideas, methods, instructions or products referred to in the content. |
© 2024 by the authors. Licensee MDPI, Basel, Switzerland. This article is an open access article distributed under the terms and conditions of the Creative Commons Attribution (CC BY) license (https://creativecommons.org/licenses/by/4.0/).