Abstract
In the dynamic operation of a boom sprayer, the boom oscillation will cause the detection value of the boom height to fluctuate greatly, resulting in failures of the control system. Based on the previously developed static boom height detection model for the entire wheat growth cycle, this study aimed to optimize the model to reduce the impact of boom oscillation on the accuracy of boom height detection. Three ultrasonic sensors were installed on each section boom of a three-section boom sprayer, and dynamic boom height detection tests were conducted at vehicle speeds of 4 to 8 km/h across six growth stages of winter wheat in Beijing, a total detection area within a single fixed operational row of approximately 14 ha. The test results showed that as vehicle speed increased, boom oscillations intensified across all sections. By setting the boom oscillation correction parameters, the detecting value of each section of boom height is corrected. The results show that the fluctuation and deviation degree of the boom height-detecting value are obviously reduced, and the correction effect is obvious. Further analysis of the detecting value of the boom height after the correction shows that the previously established detection model still maintains high detection accuracy under dynamic conditions; that is, the detection position of the ultrasonic sensor does not downward shift. This paper provides a low-cost technical method that can be directly applied to the dynamic detection of boom height.
1. Introduction
In China, wheat ranks as the third-largest crop by planting area and holds significant importance as a staple food crop. However, weeds and pests in wheat fields pose substantial threats to yield [1]. To mitigate these challenges, pesticide spraying for the prevention and control of diseases, pests, and weeds is a critical practice in safeguarding crop production [2,3]. Among the various ground application equipment used for field crops, boom sprayers are the most commonly employed [4], valued for their high operational efficiency and large chemical storage capacity [5,6,7,8]. Boom sprayers are particularly well-suited for pesticide application throughout the entire growth cycle of wheat. Maintaining an optimal distance between the sprayer boom and the crop canopy is essential to ensure effective pesticide coverage during spraying operations [9]. However, due to changes in leaf thickness, number, and morphology throughout crop development, it becomes difficult for sensors to consistently provide accurate measurements of this distance [10,11,12,13,14]. In addition, varying terrain, sudden changes in canopy height, and fluctuations in vehicle speed further complicate the detection of boom height [15]. Therefore, advancing boom height detection technology and achieving precise boom height control are critical for improving the quality of boom sprayer operations.
Currently, for boom height detection technology, researchers primarily use non-contact sensors to directly measure crop characteristics [15,16,17,18,19,20,21,22,23,24,25,26,27]. The collected data are then processed using algorithms and fed into the control system, enhancing detection accuracy. However, this approach overlooks the effects of crop growth variations on the accuracy of non-contact sensors, failing to provide a detection method suitable for the entire crop growth cycle. Ultrasonic sensors have been used in agriculture for some time [28,29] and offer advantages such as low cost [30], ease of installation, straightforward data processing, and high accuracy in controlled environments. Nonetheless, they are influenced by factors like canopy density and leaf surface irregularity. Some researchers have considered the impact of canopy density changes on ultrasonic sensor performance during wheat growth. By repeatedly pruning wheat branches and leaves at the same growth stage, the relationship between ultrasonic signals and canopy density was established [31]. Compared to ultrasonic sensors, lidar sensors can provide more precise detection data and have been employed in boom height detection [15,32]. However, lidar data processing is more complex than that of ultrasonic sensors and may require additional software. In addition, ultrasonic sensors are more user-friendly [33], and the cost of lidar sensors is relatively high.
Height control technology predominantly relies on non-contact sensors as the source of control signals, with active suspension systems serving as actuators. Control methods such as PID control [16,34,35,36,37], fuzzy control [19], and threshold control [38] are commonly employed to adjust the expansion of electric or hydraulic push rods, thereby regulating the height of the spray boom. Although automatic control has largely been realized, current boom height control systems lack versatility in their inputs, making it difficult to apply them across various crops or at different stages of the crop growth cycle. As a result, their overall applicability remains limited.
In previous studies [39], the initial detection curve and beam width of the ultrasonic sensor were calibrated on flat ground, the ultrasonic conversion relationship of boom height was obtained, and the height from the boom to the top of the crop was detected by using this relationship. The test was carried out in six key growth stages of wheat, and multiple detection heights were set in each stage. The test found that the ultrasonic sensor detects the height of the boom to the top of the wheat, and its detection position is actually under the top of the wheat, not at the top, and the downward shift degree of its detection position was affected by two factors: detection height and wheat growth stage. By establishing an ultrasonic sensor detection position percentage method, the downward shift distance of the ultrasonic sensor at different heights and wheat growth stages is obtained. Finally, by giving multiple compensation values to the conversion relationship of boom height, the boom height-detecting model for the whole growth cycle of wheat under static conditions is developed, and the detection accuracy of the model is verified. In this study, the height from the boom to the top of the wheat was dynamically detected in six growth stages of wheat. By exploring the change law of detecting the value of the boom height at different vehicle speeds on the field road surface, the influence of boom oscillation on the detection value of boom height was solved. The detection model established in previous studies can still effectively compensate for the downward shift distance of ultrasonic detection position under dynamic conditions, and finally, a dynamic detection model that can be directly applied to field dynamic operation was established.
The ultrasonic sensor calibrated on flat ground cannot be directly used to detect the wheat canopy, and its detection position is affected by the detection distance and wheat growth stage. In previous studies, this problem was solved by compensating values, enabling low-cost ultrasonic sensors to be used for high-precision detection in the field. In this study, the field detection accuracy of the ultrasonic sensor is ensured by retaining the detection model relationship established in previous studies. The influence of boom oscillation on the detecting value of boom height under dynamic conditions is solved by correcting the parameters according to the boom oscillation. This study provides technical support for the application of low-cost ultrasonic sensors in high-precision detection in the field.
2. Materials and Methods
2.1. Design of Dynamic Detection System
In intelligent systems, detection technology is essential for the precise operation of field machinery [40]. Real-time data on boom height serve as the primary information source for boom height control, with its accuracy directly influencing the performance of the control system. To support accurate field detection of boom height, a dynamic boom height detection system was designed.
2.1.1. Hardware Design of Dynamic Detection System
The boom height detection system (Figure 1), with the 3WSH-500 sprayer (Yongjia, Linyi, China) as the carrier, including the TTC32 vehicle control unit (HYDAC Technology, Shanghai, China), STM32F103RCT6 microcontroller (STMicroelectronics, Shanghai, China), PC (Hasee, Beijing, China) three ultrasonic sensors (HC175F30GM-I-2000-V1, HC Sensors, Shenzhen, China), GNSS antenna (TOPGNSS, Shenzhen, China), CAN data storage device (Guangcheng Technology Co., Ltd., Shenyang, China), and a USB/CAN serial (Ledian Xinnan Technology Co., Ltd., Beijing, China). The 3WSH-500 sprayer features a three-section boom structure with a spray width of 12 m. Three ultrasonic sensors were installed at the left, center, and right sections of the boom. The sensor on the central boom was positioned at the midpoint of the middle section, while the sensors on the side booms were installed 100 mm from the ends. A GNSS antenna was mounted at the center of the sprayer’s top using a suction base. A CAN data storage device was used to record data on the CAN bus in real-time, and a USB/CAN interface was employed to monitor the CAN bus data.
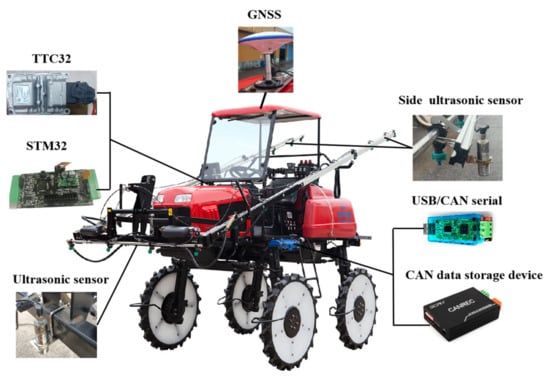
Figure 1.
Boom height dynamic detection system.
The dynamic test data are monitored and recorded by CAN bus communication. The data transmission principle is shown in Figure 2.
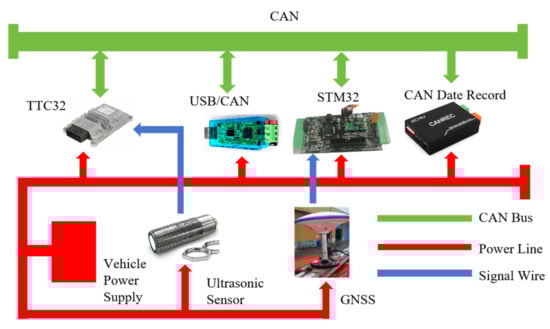
Figure 2.
CAN bus data field transmission principle.
The parameters and functions of the key components of the detection system are shown in Table 1 below.

Table 1.
Detection system key component parameters.
The dynamic detection system was powered by the sprayer’s 12 V vehicle power supply. The ultrasonic sensor outputs a 4–20 mA current signal, which is converted into the boom height through the boom height conversion relationship, and the boom height conversion relationship is loaded into the TTC32 vehicle controller through the CODESYSY V2.3 software on the PC. The GNSS antenna sends message information to the STM32 microcontroller, and the STM32 is responsible for parsing the message information into latitude, longitude, and vehicle speed. The TTC32 vehicle controller and ST332 microcontroller will send the processed data to the CAN bus. Simultaneously, the CAN data storage device records the data in real-time and automatically stores it in EXCEL format for further analysis.
Since the CAN data storage device does not provide a convenient way to view data in real-time during field operations and to prevent the GNSS antenna from starting without proper positioning—resulting in data loss—a USB/CAN serial port was connected in series with the CAN data storage device. After the detection system is activated, real-time data are first monitored using serial port assistant software on a PC via the USB/CAN interface. The test begins once the data are validated; if the data are invalid, the system is restarted.
The designed dynamic detection system has the functions of data acquisition, data transmission, data automatic storage, etc., and a CAN/USB serial port that can be connected to the PC is set up to facilitate real-time viewing of data on the PC, which brings convenience to the development of the test.
2.1.2. Dynamic Detection System Model Input
The boom height conversion relationship is loaded into the TTC32 vehicle control unit through CODESYS V2.3 software on a PC. This software interface can display the ultrasonic sensor’s current value and the converted boom height-detecting value in real-time. In previous studies, the problem of the downward shift of the detection position of the ultrasonic sensor was solved by giving the compensation value to the conversion relationship of the boom height. On this basis, a static detection model of boom height in the whole growth cycle of wheat was developed, which improved the accuracy of low-cost ultrasonic sensors applied to wheat crop detection. The dynamic detection system continues to use this detection model as input to convert the current signal of the ultrasonic sensor into the boom height-detecting value. The static detection model of boom height in the whole growth cycle of wheat is shown in Table 2.
Table 2.
The static detection model.
Where
y = 0.1164x − 334.88, which is the boom height conversion relation after the ultrasonic sensor is calibrated on the flat ground;
x, which is the current signal of the ultrasonic sensor, mA;
y, which is the detecting value of boom height, mm;
A, which is the offset compensation value, mm.
The conversion relationship of boom height is obtained by calibrating the current signal and distance of the ultrasonic sensor on flat ground in previous studies. During the calibration, at least 10 heights were set, and each height was repeated three times. By loading this relationship into the TTC32 vehicle controller, the current signal of the ultrasonic sensor can be calculated as the boom height in real-time.
The detection model has three fixed offset compensation values A in the six growth cycles of wheat and the applicable detection height range of 450–950 mm. According to the model accuracy verification test results in previous studies, the detection error of the detection model was ≤50 mm within the applicable detection distance range, which can provide effective and accurate boom height detection input for wheat from the starting stage to the mature stage, to realize the precise control of the boom height in the field.
2.2. Field Dynamic Detection Test
The field dynamic detection test comprised two components: a data acquisition test of boom oscillation correction and a boom height detection test for the whole growth cycle of wheat. The data acquisition test of boom oscillation correction was conducted during the seedling stage (7 March 2023), while the boom height detection test was performed at six key growth stages of wheat, including the standing (6 April 2023), jointing (21 April 2023), booting (10 May 2023), heading (22 May 2023), filling (6 June 2023), and maturity stages (14 June 2023). The tests were carried out in the wheat test field of the National Precision Agriculture Research Experimental Base in Beijing, China. The wheat variety used was Jingdong 22 winter wheat, with a seeding rate of 225 kg/ha, using a seeder with a width of 3.6 m (2BFX-24, Shijiazhuang Agriculture Machinery Co., Ltd., Shijiazhuang, China). During the field dynamic detection tests, four different speeds were established: 4–5 km/h, 5–6 km/h, 6–7 km/h, and 7–8 km/h for each wheat growth cycle. Both the data acquisition test of boom oscillation correction and the boom height detection tests were conducted along the same operational row in the field (Figure 3). The geographical coordinates of the crop row were 116.4406° longitude and 40.1839–40.1877° latitude. Before initiating the field dynamic detection test, the height from the boom to the top of the crop was adjusted to 500 mm at the starting point of the operational row, and the boom height was maintained consistently throughout the test.
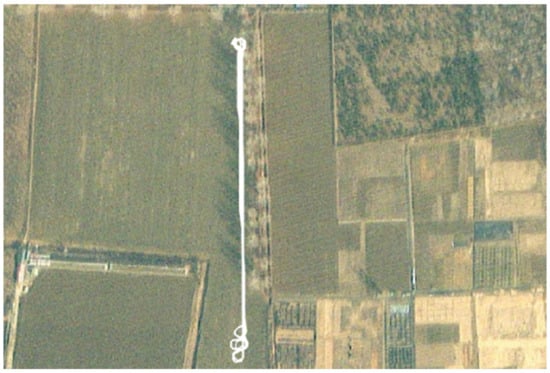
Figure 3.
Dynamic detection test field fixed row.
2.2.1. Data Acquisition Test of Boom Oscillation Correction
The data acquisition test of boom oscillation correction refers to obtaining the detecting values of each section’s boom height for the wheat seedling stage in advance before the boom height detection test for the whole growth cycle of wheat. The purpose is to analyze the oscillation of the boom height in each section under dynamic conditions, obtain the correction parameters of the boom oscillation, and optimize the boom height data obtained from the boom height detection test for the whole growth cycle of wheat.
The fluctuation of boom height detection data mainly comes from three aspects: the fluctuation of the canopy itself caused by plant height difference, the downward shift of the ultrasonic sensor detection position in different growth cycles of wheat, and the boom oscillation caused by terrain undulation and vehicle speed change. The data acquisition test of boom oscillation correction was selected at the wheat seedling stage. The plant height of wheat was about 15~20 mm during this stage. The downward shift of the ultrasonic sensor detection position and the fluctuation of the crop canopy itself could not cause great fluctuation to the detection data of boom height obtained in this stage, which was also the reason why the data acquisition test of boom oscillation correction could be used as the basic correction data.
In addition, the data acquisition test of boom oscillation correction and the boom height detection test for the whole growth cycle of wheat were carried out in the same operation row at four different speeds of 4–5 km/h, 5–6 km/h, 6–7 km/h, 7–8 km/h, so as to ensure that the two tests had the same sprayer trajectory, terrain undulation, and vehicle speed. Most importantly, the boom oscillation was not affected by the change in the wheat growth cycle. Therefore, in the wheat seedling stage, the operation row can better show the data fluctuation of the monitoring value of the boom height due to the boom oscillation.
During the test, the boom height was maintained at a fixed level, and the data acquisition frequency for boom height measurements was set to 10 Hz. Every 10 measurements were averaged, while the data acquisition frequency for vehicle speed and driving trajectory was set to 1 Hz. Data were collected at four different vehicle speeds along the same operational row in the field, with each speed maintained for 10 min, and the total data acquisition time was 40 min.
The data acquisition test of boom oscillation correction employed the control variable method to assess the impact of boom oscillation on boom height detection values. Correction parameters for boom oscillation were obtained to adjust the boom height detection data across six key growth stages of wheat, from the standing stage to the maturity stage.
It should be noted again that the data acquisition test of boom oscillation correction refers to the test carried out in the seedling stage of wheat, and the boom height detection test for the whole growth cycle of wheat refers to the test carried out in six key growth stages of wheat.
2.2.2. Boom Height Detection Test for Whole Growth Cycle of Wheat
Under dynamic conditions, to verify the downward shift of the ultrasonic sensor detection position in each wheat growth cycle and to explore the influence of boom oscillation on boom height fluctuation, the boom height detection test for the whole growth cycle of wheat was designed. The test scenario is shown in Figure 4.
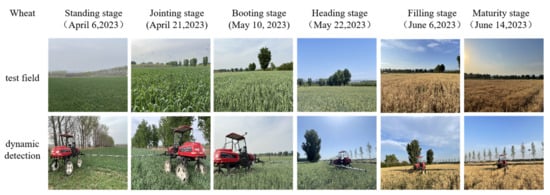
Figure 4.
Boom height detection for the whole growth cycle of wheat.
The sprayer was used to measure the boom height at four different speeds: 4–5 km/h, 5–6 km/h, 6–7 km/h, and 7–8 km/h across six key growth stages of wheat, ranging from the standing stage to the maturity stage. The driving trajectory of the sprayer followed the same path as in the data acquisition test of boom oscillation correction. Throughout the detection process, the boom height was maintained at a constant level. To ensure the accuracy and consistency of the latitude and longitude data for each dynamic test, the sprayer moved in a straight line along the designated operational row in the field using the automatic navigation system in the cab. The driving speed was displayed in real-time on the upper computer screen of the navigation system and controlled via the hand throttle, minimizing issues related to speed instability and trajectory deviation due to the driver’s skill level. At the conclusion of each dynamic detection test, the SD card from the CAN data storage device in the boom height detection system was removed and inserted into a PC, and the data were converted into Excel files using conversion software for subsequent analysis and processing.
The data acquisition frequency for boom height was set to 10 Hz, with every 10 height measurements averaged. The information acquisition frequency for vehicle speed and driving trajectory was set to 1 Hz. Data were collected at four different vehicle speeds along the same operational row in the field, with each speed maintained for 10 min; the total data acquisition time was 40 min.
2.3. Correction and Optimization of Boom Height Detection Data
The purpose of boom height control is that the boom height can be automatically adjusted according to the fluctuation of the canopy itself in the field’s dynamic environment. The premise of this purpose is that the boom height control system can accurately obtain the height from the boom to the top of the crop. During the test, the boom height was fixed and not regulated. The fluctuation of the boom height data mainly comes from three aspects: the fluctuation of the wheat canopy itself caused by the difference in plant height, the detection position downward shift of the ultrasonic sensor in different growth cycles of wheat, and the boom oscillation caused by the terrain undulation and the change of vehicle speed. Among them, the downward shift in the detection position of the ultrasonic sensor means that the ultrasonic sensor detects the height from the boom to the top of the crop. The detection position is actually below the top of the wheat instead of the top, which leads to the detection value of the boom height always being greater than the actual value of the boom height [39]. The boom oscillation will cause the fluctuation of the boom height detection data. To accurately obtain the real-time change of crop canopy height under the boom, it is necessary to correct the data fluctuation caused by the oscillation of each section of the boom. Under dynamic conditions, according to the downward shift of the ultrasonic detection position in different growth cycles of wheat and the oscillation of each section of the boom at different speeds, the boom height detection model for the whole growth cycle of wheat was optimized so that it can be directly used for the input of the boom height control system.
It should be noted that among the sources of fluctuation in the boom height value, the data change caused by the fluctuation of the wheat canopy itself is the effective data required for the boom height control system, while the downward shift of the detection position of the ultrasonic sensor and the boom oscillation are the interference data that need to be removed.
2.3.1. Construction of Boom Oscillation Correction Method
The boom height-detecting value fluctuates near the fixed height value of the boom, so that the boom height control system cannot obtain an accurate boom height-detecting value. To prevent the error regulation of the boom height control system due to the boom oscillation interference, it is necessary to correct the boom height-detecting value.
The fluctuation of the data obtained from the data acquisition test of boom oscillation correction is almost not affected by the fluctuation of the wheat canopy itself and the detection position downward shift of the ultrasonic sensor. To correct the data of the boom height detection test for the whole growth cycle of wheat, the boom height-detecting value obtained from the data acquisition test of boom oscillation correction was compared with the boom fixed height of 500 mm. According to the positive and negative directions of the difference, each difference was divided into upper and lower intervals for mean calculation, respectively. The mean value of the difference between the upper and lower intervals was used as the correction parameter of the boom oscillation in the boom height detection test for the whole growth cycle of wheat.
Through the MATLAB 2020b software editor on the PC, the boom height-detecting value was compared with the boom fixed height of 500 mm in real-time. If the boom height-detecting value is greater than the boom fixed height, an upper interval parameter is given to correct the boom height-detecting value; otherwise, a lower interval parameter is given to correct it.
To prevent excessive correction, the correction retention value is set to 10 mm. When the detecting value of the boom height is greater than the sum of the boom fixed height value and the correction retention value, the current detecting value of the boom height is given an upper interval correction parameter for correction calculation. When the detecting value of the boom height is less than the difference between the boom fixed height value and the modified retention value, the current detecting value of the boom height is given a lower interval correction parameter for correction calculation. If the boom height-detecting value is within the retention range, the value is not corrected, and the current boom height-detecting value is retained.
The MATLAB 2020b software editor obtains the uncorrected boom height-detecting value by defining the address of the EXCEL file, automatically creates a new EXCEL file after the correction is completed, and saves the corrected boom height-detecting value. The flow chart of the boom oscillation correction program is shown in Figure 5.
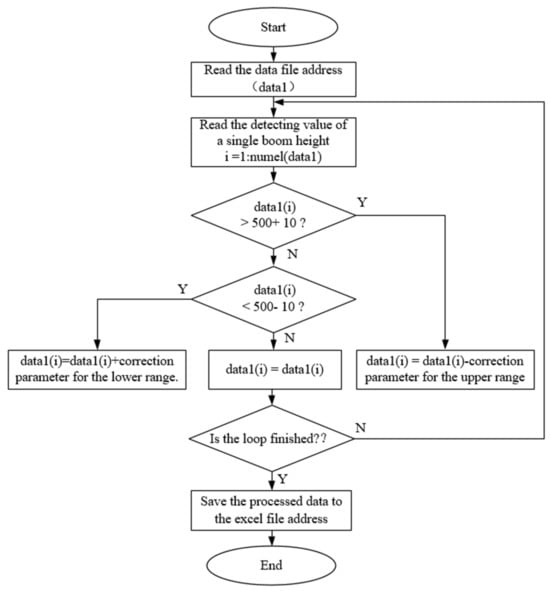
Figure 5.
Boom oscillation correction program flow chart.
2.3.2. Verification of Detection Position Downward Shift of Ultrasonic Sensor
The data of the detection position downward shift of the ultrasonic sensor showed that the detection value of the height boom in the same section boom of the same growth cycle of wheat has the same degree of increase. Due to the changes in wheat canopy density, branch and leaf growth morphology, and so on, the detecting value of boom height increased differently in each wheat growth cycle. If the ultrasonic sensor detecting value is directly used in the boom height control, it will lead to the misjudgment of the boom height control system on the height from the boom to the top of the crop. In previous studies, we have solved the problem of the ultrasonic sensor detection position moving down by compensating the ultrasonic initial detection curve in six key stages of wheat. Under dynamic conditions, whether the method can still be effective, it is necessary to further analyze the variation characteristics of the boom height-detecting value in the field dynamic detection test results.
If the boom height detection model for the whole growth cycle of wheat established in previous studies can still effectively compensate for the downward shift distance of the ultrasonic detection position under dynamic conditions, it is not necessary to optimize the detection model established in the previous study. If there is a downward shift of the detection position of the ultrasonic sensor in the dynamic detection test, a dynamic compensation value is set according to the offset of the boom height values and added to the detection model.
2.4. Construction of Boom Height Dynamic Detection Model for the Whole Growth Cycle of Wheat
According to the degree of boom oscillation and the detection position of the downward shift of the ultrasonic sensor under dynamic conditions, based on the detection model established in the previous study, the boom height dynamic detection model for the whole growth cycle of wheat was established by adding the correction parameters of boom oscillation and dynamic compensation values, which provides a reliable and accurate detection method for the precise control of boom height of wheat sprayer.
3. Results
3.1. Data Acquisition Test Result of Boom Oscillation Correction
The data acquisition test of boom oscillation correction was used as the basic correction data of the boom height detection test for the whole growth cycle of wheat. By acquiring the boom height data at the seedling stage before the six key growth stages of wheat, the correction parameters of boom oscillation are obtained in advance. The data acquisition test results of boom oscillation correction are shown in Figure 6.
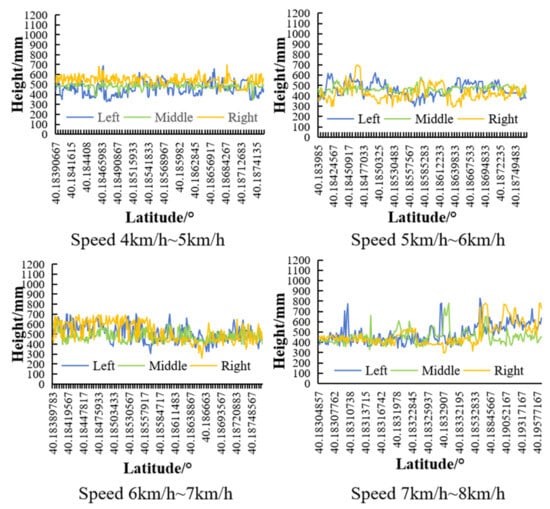
Figure 6.
Variation of boom height in the wheat seedling stage.
It can be seen from Figure 6 that under the same terrain undulation, the same speed, and the same growth cycle, the boom height detection values of the left section, middle section, and right section show obvious differences. In addition, the boom height-detecting values of the same section also have obvious changes in the same terrain undulation, the same growth cycle, and different speeds. To obtain the influence of different sections of boom and vehicle speeds on the boom height-detecting value under the same terrain undulation, the statistical analysis of the boom height at the seedling stage of wheat was carried out. The results are shown in Table 3.
Table 3.
Analysis of boom height in the wheat seedling stage.
In Table 3, L, M, and R are the boom height of the left section, middle section, and right section, respectively. SD is the standard deviation, RMSE is the root mean square error, and CV is the coefficient of variation.
As shown in Table 3, the minimum standard deviation (SD) values are 27 mm, 31 mm, 55 mm, and 71 mm in ascending order of speed, which all correspond to the middle section boom height, while the maximum SD values at each speed correspond to the side section boom height. The minimum coefficient of variation (CV) values, in ascending order of speed, are 0.06, 0.07, 0.11, and 0.16, all corresponding to the middle section boom height, while the maximum CV values at each speed correspond to the side section boom height. These results indicate that, at each speed range, the oscillation of the middle section boom exhibits better performance compared to the side section booms, resulting in a more stable boom height detection value for the middle section.
The minimum root mean square error (RMSE) values, in ascending order of speed, are 32, 79, 58, and 152, all corresponding to the middle section boom height, while the maximum RMSE values at each speed correspond to the side section boom height. This indicates that the overall data for the boom height detection value in the middle section is closer to the fixed height of the boom than that in the side sections, showing a smaller deviation.
As the speed increases, the statistics for each boom section height increase significantly. For example, in the middle section boom, when the speed increases from 4–5 km/h to 7–8 km/h, the SD rises from 27 mm to 71 mm, the RMSE increases from 32 mm to 152 mm, and the CV increases from 0.06 to 0.16. This demonstrates that changes in vehicle speed affect boom oscillation, and with an increase in speed, the oscillation of each section of the boom gradually increases, causing fluctuations in the boom height detection value.
Overall, the boom height for each section remains relatively stable, except for significant fluctuations at the 7–8 km/h vehicle speed range. This stability is due to the relatively low plant height at the seedling stage (15–20 mm), where changes in canopy height and the downward shift of the ultrasonic sensor detection position have minimal impact on the boom height detection value, resulting in a simpler source of fluctuation.
3.2. Boom Height Detection Test Results for the Whole Growth Cycle of Wheat
The dynamic detection test was carried out at six key growth stages of wheat, such as the standing stage, jointing stage, booting stage, heading stage, filling stage, and maturity stage, with four speeds of 4–5 km/h, 5–6 km/h, 6–7 km/h, and 7–8 km/h. The height from the boom to the top of the crop was detected by the dynamic detection system. The current signals of the three ultrasonic sensors installed on the boom are converted into the boom height by the boom height detection model for the whole growth cycle of wheat established under static conditions. The detection results are shown in Figure 7.
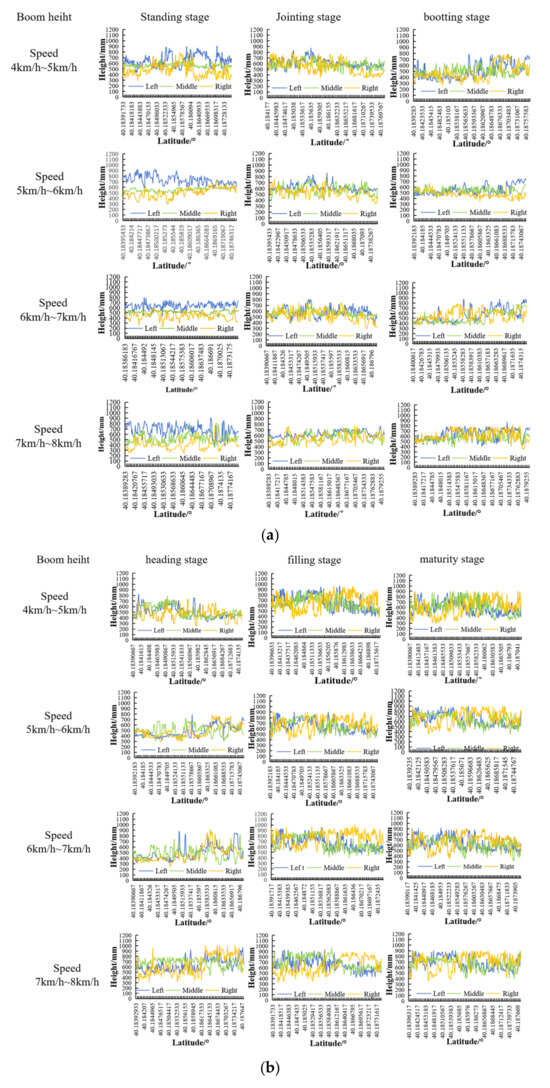
Figure 7.
The boom height change in six critical stages of wheat: (a) The boom height change from rising stage to booting stage; (b) The boom height change from heading stage to maturity stage.
It can be seen from Figure 7 that there are different degrees of fluctuation of each section’s boom height-detecting value. To obtain the fluctuation law of the boom height-detecting value and the deviation degree of the boom height-detecting value from the fixed boom height of 500 mm, the dynamic detection data of the boom height are statistically analyzed. The analysis results are shown in Table 4.
Table 4.
Analysis of boom height changes in six key growth stages of wheat.
In Table 4, SA is statistical analysis, and MAD is the mean value of the absolute value of the difference between the boom height detection and the boom fixed height. S1–S6 are the six key growth stages of wheat: standing, jointing, booting, heading, filling, and maturity.
It can be seen from the data results (Table 4) that the minimum SD in the six key growth stages of wheat is 41 mm, 32 mm, 32 mm, and 55 mm in the increasing order of speed, all of which appeared in the middle section boom height, while the maximum SD values at each speed correspond to the side section boom height. The minimum values of the CV in the six key growth stages of wheat are 0.07, 0.06, 0.06, and 0.09 in the increasing order of speed, which all appeared in the middle section boom height, while the maximum values of the CV at each speed correspond to the side section boom height. This shows that the height-detecting value of the middle section boom is more stable than the boom on both side sections, and the fluctuation is smaller. This is the same as the conclusion obtained in the data acquisition test of boom oscillation correction. Under the change of vehicle speed, the middle section boom always maintains better stability than the two-side section boom.
The mean absolute difference (MAD) can show the overall deviation of the boom height detection value relative to the boom fixed height value and can comprehensively judge the deviation degree of the boom height detection value with RMSE. The minimum values of RMSE in the six key growth stages of wheat are 68 mm, 62 mm, 37 mm, and 80 mm in the increasing order of speed, all of which appeared in the middle section boom height, while the maximum values of RMSE at each speed correspond to the side section boom height. The minimum values of MAD in the six key growth stages of wheat are 56 mm, 50 mm, 32 mm, and 62 mm in the increasing order of speed, all in the middle section boom height, while the maximum values of MAD at each speed correspond to the side section boom height. The maximum and minimum distribution of RMSE and MAD in different speed ranges shows that the detecting value of the middle boom height is closer to the boom fixed height than that of the two sides section and has a small deviation.
From the perspective of different wheat growth cycles in the same speed range, the change of each section boom height did not show obvious regular changes. This is because the change in the wheat growth cycle has nothing to do with the oscillation of the boom, and the change in the wheat growth cycle does not affect the oscillation of the boom in the same speed range and the same operation row. As the wheat growth cycle lengthens, the changes in crop plant height, branch and leaf morphology, canopy density, and so on, with the extension of the wheat growth cycle, changes in crop plant height, branch, and leaf morphology, canopy density, etc., may cause the distance of the actual detection position of the ultrasonic sensor to move downward, which causes the detecting value of the boom height to be offset. However, no relevant data changes were found in Figure 7 and Table 4.
3.3. Correction and Optimization Results of Boom Height Detection Data
3.3.1. Oscillation Correction Results of Boom
The boom height oscillation correction is based on the data acquisition test of boom oscillation correction to correct the boom height detection test data for the whole growth cycle of wheat. The correction parameters are shown in Table 5.
Table 5.
Correction parameters of each sections boom at each speed.
The change in wheat growth is not related to the boom oscillation, so the boom oscillation correction parameters do not distinguish the wheat growth cycle but give the parameters according to the boom position and the sprayer speed. The boom height change after correction is shown in Figure 8.
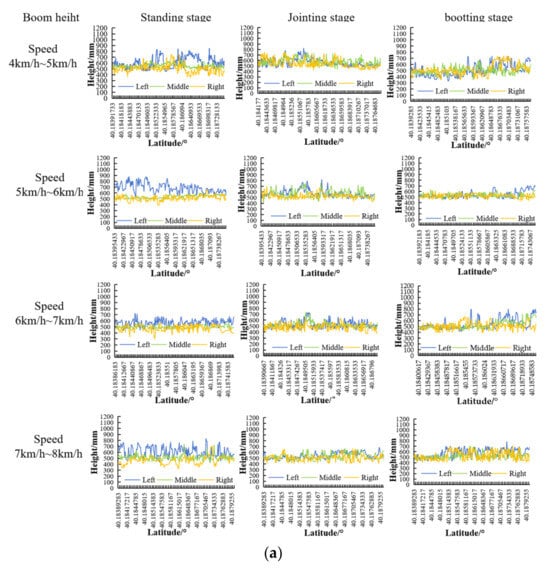
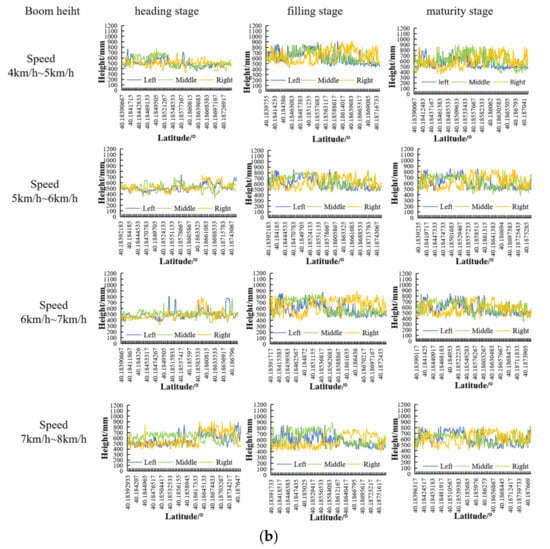
Figure 8.
The correction changes of boom height in six key growth stages of wheat: (a) Correction change of boom height from standing stage to booting stage; (b) correction change of boom height from heading stage to maturity stage.
It can be seen from Figure 8 that the fluctuation of the boom height-detecting value at each speed during the six key growth stages of wheat is significantly reduced after the boom oscillation correction, which is closer to the boom fixed height than before the oscillation correction. This shows that the boom oscillation correction method can effectively correct the data fluctuation caused by boom oscillation in each speed range. In addition, in Figure 8a, the height-detecting value of the left section boom in the wheat standing stage and the speed range of 5–6 km/h is generally stable after the correction, but the detecting value of the boom height is above the boom fixed height, considering the overall offset caused by the fluctuation of the canopy itself or the detection position downward shift of the ultrasonic sensor.
From the results of the boom oscillation correction (Table 6), the boom height after the oscillation correction is closer to the boom fixed height, especially the side sections boom height is the most obvious. From the perspective of the same speed range and different growth cycles of wheat, the side section boom height is close to the middle section boom after correction, which shows that the boom oscillation correction method can correct the height of each boom with different oscillation degrees, from the perspective of the different speed range and same growth cycles of wheat. In the six key growth cycles of wheat, the maximum and minimum values of MAD and RMSE at each vehicle speed decreased after boom oscillation correction. This shows that the boom oscillation correction can reduce the deviation between the boom height-detecting value and the boom fixed height value in each speed range. By comparing the maximum and minimum changes before and after the correction, it is found that the boom oscillation correction performs better in a larger speed range.
Table 6.
Analysis of boom height correction changes in six key growth stages of wheat.
The SD of each section boom height after correction is less than or equal to that before correction. Among them, in the six key growth cycles of wheat, the maximum and minimum values of SD at each vehicle speed decreased after boom oscillation correction. Similarly, the CV of the boom height of each section also decreases to varying degrees. The maximum values of CV at each vehicle speed decreased, and the minimum CV decreased from 0.07 mm, 0.06 mm, 0.06 mm, 0.09 mm to 0.07 mm, 0.05 mm, 0.05 mm, 0.09 mm in the increasing order of speed. This shows that in each speed range, the boom oscillation correction method can reduce the fluctuation of the boom height-detecting value and make it more stable.
However, it should be noted that although most CVs decrease after the boom oscillation correction, a small number of CVs increase slightly. For example, at the jointing stage of wheat, within the speed range of 5 km/h–6 km/h, the SD of the left boom height corrected by boom oscillation decreased from 62 mm to 61 mm, the MAD decreased from 114 mm to 71 mm, the RMSE decreased from 135 mm to 92 mm, but the CV increased from 0.10 to 0.11. By observing the boom height correction change diagram (Figure 8), it is found that a slight increase in the boom height CV occurs in the side section boom. Considering that the CV is affected by the average value when the average value of the side section boom height decreases greatly after the boom oscillation correction, the CV will increase slightly, but this only shows that the dispersion degree of the boom height relative to the average value changes.
In general, after the oscillation correction of the boom height, the data deviation is reduced, and the boom height-detecting value is more stable. However, as the basic correction data of the boom height detection test for the whole growth cycle of wheat, the data acquisition test of boom oscillation correction needs to detect the boom height in the operation row in advance. Therefore, it is impossible to ensure that the two tests have the same meteorological conditions, such as illumination, wind speed, and wind direction, resulting in the method not completely correcting the boom oscillation. In addition, the correction method for boom oscillation adopts the deviation mean within different intervals to set positive and negative correction parameters, which can better correct the overall boom height-detecting value as a whole, making the detection of boom height more accurate, but it cannot guarantee that each boom height-detecting value can achieve the best correction parameters.
3.3.2. Verification Results of the Detection Position Downward Shift of the Ultrasonic Sensor under Dynamic Conditions
The fluctuation of the canopy itself and the detection position downward shift of the ultrasonic sensor will cause the deviation of the boom height-detecting value, but the variation characteristics of the boom height caused by the deviation are not the same.
The fluctuation of the canopy itself refers to the change of crop canopy height under a certain section of boom, which is not affected by the change of vehicle speed. The data feature is that the height-detecting value of one or more booms in the same growth stage suddenly increases or decreases partially, and the data fluctuation generally shows a step change. In addition, the lack of seedlings in the operation row will also cause a sudden increase in the detecting value of individual boom height, but the phenomenon is not continuous. The detection position downward shift of the ultrasonic sensor, which means that when the ultrasonic sensor detects the height from the boom to the top of the crop, the detection position is actually below the top of the crop, resulting in the obtained boom height-detecting value always being greater than the actual boom height. The data feature is that the boom height-detecting value generally fluctuates in the area above the boom fixed height value. Because the ultrasonic sensors installed in each section boom are the same type, the detection position downward shift of the ultrasonic sensor in the same growth cycle and the same speed range will make the height-detecting values of the left, middle, and right sections boom increase at the same time. According to the data change characteristics, when the detection position of the ultrasonic sensor moves down, the boom height with the overall offset of the three sections of the boom can be quickly found through the revised height change diagram of the boom (Figure 8).
By comparing the changes in boom height in each wheat growth cycle in Figure 8, it can be found that the boom height-detecting values at each speed during the standing stage, filling stage, and maturity stage are offset. The offset mainly occurs in the left section boom of the standing stage, the left, middle, and right sections boom of the filling stage, and the maturity stage. It can be seen from Figure 9 that the height-detecting values of each section boom where the offset occurs generally fluctuate above the boom fixed height of 500 mm rather than near the boom fixed height. It can be seen from Table 6 that the MAD and RMSE of the left section boom height are larger than those of the other section booms in each speed range during the standing stage, which indicates that the height-detecting value of the left boom during the standing stage has a large deviation from the boom fixed height at the other section booms. The MAD and RMSE of the left, middle, and right three sections’ boom height at the filling stage and the maturity stage are generally higher than the other growth stages, which indicates that the detecting values of the left, middle, and right three sections boom height in each speed range of the filling stage and the maturity stage The MAD and RMSE of the left, middle and right arm heights at the filling stage and the mature stage were generally higher than those at other growth stages, indicating that the detection values of the left, middle and right boom heights in each speed range at the filling stage and the mature stage had different degrees of offset.
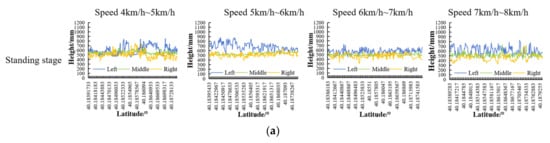
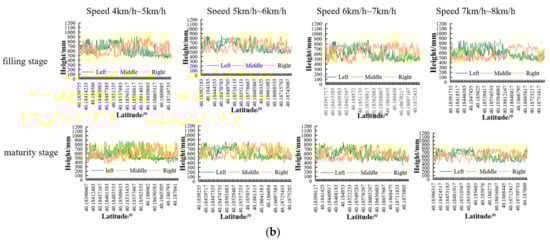
Figure 9.
Variation of boom height due to offset: (a) In the expansion direction of the boom, the crop canopy height under each section boom was different from each other; (b) in the forward direction of the sprayer, the crop canopy height under each section of the boom was changing.
In Figure 9a, the left section boom height has different degrees of overall offset in each speed range during the wheat standing stage, while the height-detecting values of the middle and right section booms fluctuate near the fixed height of the boom, and no offset occurs. In the previous study, we learned that the change in wheat canopy density and boom detection distance would make the detection position of the ultrasonic sensor move down. In the field dynamic detection test, the boom height was set to be fixed, and the canopy density of the wheat in the same growth cycle was relatively consistent. Therefore, if the detection position downward shift of the same type of ultrasonic sensor under the same growth cycle, the same speed range, and the fixed detection height, the left, middle, and right section boom height will increase to different degrees in the area above the fixed height of the boom of 500 mm, but this data performance does not appear in Figure 9a. In addition, the height-detecting value of the left section boom in the wheat standing stage showed the same change rule in four different speed ranges. Because the crop canopy density and plant height were not affected by the change of speed, this phenomenon was caused by the wheat canopy height difference under the left, middle, and right section booms in the extension direction of the boom, which was a data manifestation of the fluctuation of the canopy itself.
In Figure 9b, the height of the left, middle, and right sections boom during the filling stage has offset to different degrees, and the detecting values of each section boom height are generally in the area above the boom fixed height. Looking at this data performance alone, it has satisfied some of the characteristics of the detection position downward shift of the ultrasonic sensor, but the height-detecting values of the left, middle, and right section booms have the same change rule in the four speed ranges of the wheat filling stage, which is also the data performance that may be caused by the fluctuation of the canopy itself. By observing the fluctuation rule of the boom height from the same section boom and different speed ranges during the wheat filling stage, it was found that the data of the left and middle section boom height in the four speed ranges showed that the former part of the boom height-detecting value was larger, and the latter part was relatively lower, showing Z-shaped change characteristics. The overall performance of the right section boom height data in the four speed ranges is an inverse Z-shaped change feature. In the dynamic detection test, the boom height was fixed, and the density of the crop canopy was generally consistent with the same growth cycle. The detection position downward shift of the ultrasonic sensor will lead to different degrees of overall increase in the height-detecting value of the three booms at the same time, but the boom height-detecting value on the same section boom is generally consistent, which does not appear in Figure 9b. There are different degrees of increase before and after the height-detecting value of the same section boom, which is due to the different degrees of increase in the wheat canopy height under the same section boom in the forward direction of the sprayer.
It can be seen from Figure 9b that the boom height in each section of the filling stage and the maturity stage has the same change rule. This is because the plant height of the wheat will no longer change significantly after the wheat reaches the filling stage, and the crop canopy density and plant height of the wheat filling stage and the mature stage are generally close. Therefore, the offset of the detecting value of the boom height at the maturity stage of wheat is also caused by the different degrees of changes in the canopy height under the left, middle, and right section booms in the forward direction of the sprayer. In addition, from the previous field static test results, the detection position downward shift of the ultrasonic sensor is more obvious in the early stage of wheat. This is because the looser crop canopy makes it easier for the ultrasonic sensor to receive the reflected signal from below the canopy. With the extension of the wheat growth cycle, the canopy density gradually increases, and the detection position of the ultrasonic sensor gradually rises to the top of the wheat. Therefore, when the ultrasonic sensor detects the boom height at the filling stage and the maturity stage of wheat, the actual detection position should be near the top of the wheat.
In the field dynamic detection test results after the correction of the boom oscillation, it was not found that the overall detecting value of the boom height caused by the detection position downward shift of the ultrasonic sensor was too large, indicating that the boom height detection model for the whole growth cycle of wheat established under static conditions can still solve the problem of detection position downward shift of the ultrasonic sensor under dynamic conditions.
3.4. Construction Results of Boom Height Dynamic Detection Model for the Whole Growth Cycle of Wheat
The boom height detection model for the whole growth cycle of wheat, which was established in previous studies, has high static detection accuracy of the boom height during the six key growth stages of wheat. On this basis, the current signal of the ultrasonic sensor is converted into the boom height through the boom height detection model for the whole growth cycle of wheat, and the field dynamic detection test was carried out in six key growth stages of wheat with four different speed ranges. The test found that the boom height detection model can still solve the problem of detection position downward shift of the ultrasonic sensor under dynamic conditions, while the boom oscillation under the change of the vehicle speed has an impact on the boom height fluctuation, making the detection model established in the previous study not applicable. To solve the influence of boom oscillation on the accuracy of boom height-detecting value and improve the application versatility and accuracy of the detection model under dynamic conditions, a boom oscillation correction method was constructed, and the boom oscillation correction parameters were combined with the boom height detection model to optimize so that it can be directly used in the field dynamic operation of the sprayer.
3.4.1. Optimization of Boom Oscillation Correction Parameters
To make the boom height detection model for the whole growth cycle of wheat have high versatility in the speed of 4–8 km/h and from the wheat standing stage to the maturity stage, reduce the dynamic application limit of the detection model, and solve the adverse effects of boom oscillation, the correction parameters of boom oscillation in Table 5 are merged and optimized. It can be seen from Table 5 that the correction parameters of the two side section booms in each speed range are close to each other. The absolute difference between the upper interval parameters of the left section and the right section boom is 9 mm, 13 mm, 41 mm, and 22 mm in the increasing order of speed, and the maximum difference is 41 mm. The absolute difference between the lower interval parameters of the left section and the right section boom is 43 mm, 13 mm, 3 mm, and 8 mm in the increasing order of speed, and the maximum difference is only 43 mm. In the dynamic detection of the boom height in the range of 4–8 km/h of the sprayer speed, 43 mm is not a large value. To improve the versatility of the correction method, the correction parameters of the two side section booms are averaged and combined. The combined results are shown in Table 7.
Table 7.
Correction parameter boom position optimization.
In Table 7, LR is the side section boom height, and the side section boom includes the left section and the right section boom.
After the correction parameters of the left and right booms are combined, the number of correction parameters is reduced, but the parameters are still limited by the speed range, which makes the method difficult to apply in the actual operation process. As shown in Table 7, the speed range of 4–5 km/h and 5–6 km/h corresponding to the side section boom on the upper interval correction parameters are 49 mm and 52 mm, the lower interval correction parameters are −54 mm and −83 mm, the two speed range of the side section boom on the interval correction parameter difference absolute value is only 3 mm, the lower interval correction parameter difference absolute value is only 29 mm. In the speed range of 4–5 km/h and 5–6 km/h, the upper interval correction parameters of the middle boom are 12 mm and 23 mm, respectively, and the lower interval correction parameters are −27 mm and −39 mm, respectively. The absolute value of the difference between the upper interval correction parameters in the two speed ranges is only 11 mm, and the absolute value of the difference between the lower interval correction parameters is only 12 mm. In the dynamic detection of boom height, 3 mm, 29 mm, 11 mm, and 12 mm are smaller values, so the upper and lower interval correction parameters in the speed range of 4–5 km/h and 5–6 km/h can be averaged and merged. The upper interval correction parameters of the side section boom corresponding to the speed range of 6–7 km/h and 7–8 km/h are 95 mm and 94 mm, respectively, and the lower interval correction parameters are −69 mm and −78 mm, respectively. The absolute value of the difference between the upper interval correction parameters in the two speed ranges is only 1 mm, and the absolute value of the difference between the lower interval correction parameters is only 9 mm. The upper interval correction parameters of the middle section boom corresponding to the speed range of 6–7 km/h and 7–8 km/h are 51 mm and 70 mm, respectively, and the lower section correction parameters are −50 mm and −74 mm, respectively. The absolute value of the difference between the upper interval parameters in the two speed ranges is only 19 mm, and the absolute value of the difference between the lower interval correction parameters is only 24 mm. In the dynamic detection of boom height, 1 mm, 9 mm, 19 mm, and 24 mm are smaller values, so the upper and lower interval correction parameters in the speed range of 6–7 km/h and 7–8 km/h can be averaged and merged. After position merging and velocity merging, there are four boom oscillation correction parameters in the upper and lower intervals, respectively, which can realize boom oscillation correction in the speed range of 4–6 km/h and 6–8 km/h, as shown in Table 8.
Table 8.
Correction parameter speed optimization.
3.4.2. Parameter Optimization of the Detection Model Established in the Previous Research
The detection model established in previous studies has high accuracy and versatility under static conditions. From Table 2, the detection model established in the previous study can be used in the detection distance range of 450–950 mm from the wheat standing stage to the maturity stage. The offset compensation value is 39.84 mm in the detection distance range of 450–580 mm from the jointing stage to the maturity stage, and the offset compensation value is 96.39 mm in the detection distance range of 851–950 mm from the jointing stage to the maturity stage. In the actual dynamic operation of the sprayer in the wheat field, the optimal height from the boom to the top of the wheat is generally set to 500 mm. According to the actual situation of the wheat field, some operators set the boom height at about 600 mm to prevent the boom from touching the ground while ensuring the uniformity of the spray. Considering that the detection distance range of 851–950 mm in the detection model from jointing stage to maturity stage is not suitable for the actual dynamic operation of the sprayer in the wheat field, the parameters of this range of the detection model are deleted, as shown in Table 9 below.
Table 9.
Optimization of the application range of the detection model established in the previous study.
Where
y0, which is the boom height-detecting value converted by the detection model, mm;
x, which is the current value of the ultrasonic sensor, mA;
A, which is the offset compensation value, mm.
It can be seen from Table 9 that the offset compensation value of the optimized detection model during the wheat standing stage is 19.93 mm, and the offset compensation value from the jointing stage to the maturity stage is 39.84 mm, with a difference of only 19.91 mm. To reduce the restrictions on the use of model parameters, the offset compensation values from the standing stage, jointing stage, to maturity stage were merged by means. The merged detection model shared an offset compensation value of 29.89 mm in the whole wheat cycle, and the detection distance range was 450–850 mm. The detection model after parameter optimization is shown in Table 10.
Table 10.
Parameters of the detection model established in the previous study are merged.
Where
29.98, which is the only offset compensation value A of the detection model, mm.
3.4.3. Establishment of Boom Height Detection Model for Dynamic Operation
The optimized detection model (Table 9) was combined with the optimized boom oscillation parameters (Table 8) to establish a boom height dynamic detection model (Table 11) that can be directly used for dynamic operations.
Table 11.
Boom height dynamic detection model for the whole growth model of wheat.
Where
y, which is the boom height-detecting value obtained by the dynamic detection model, mm;
b, which is the correction parameter of boom oscillation, mm;
y0, which is the boom height-detecting value obtained by the detection model established in the previous study, mm.
In the boom height dynamic detection model for the whole growth cycle of wheat, the detection model equation established in the previous study is still responsible for converting the ultrasonic sensor current into the boom height-detecting value in real-time, while the dynamic model equation is responsible for comparing each boom height-detecting value with the boom setting height value. The size of each boom height-detecting value was corrected to make it a more accurate final input.
4. Discussion
4.1. The Influence of Speed Change on Each Section Boom Height
In the data acquisition test of boom oscillation correction, the middle section boom height of the same speed range and the same operation row has better stability than that of the boom on both sides, and the boom height-detecting value fluctuates near the boom fixed height value. Under the same conditions, there are obvious differences in the height fluctuation degree of different sections of the boom in the dynamic detection, which is caused by the structure of the boom itself. Because the middle boom position is relatively centered, the center of gravity is closer to the center of the sprayer, and the four-link lifting mechanism connects the sprayer with the whole boom through the middle boom, which makes the middle boom and the sprayer have a closer connection. Dou et al. [21] carried out the dynamic detection test of boom height in open land and wheat stubble land, respectively. The test results showed that the change of boom height on both sides was relatively large, while the change of middle section boom height was small. This conclusion is the same as the results obtained from the data acquisition test of boom oscillation correction in this paper. With the increase of the vehicle speed, the fluctuation of the height of each section boom gradually increases, and the deviation from the fixed boom height gradually increases. In the data acquisition test of boom oscillation correction, when the speed rises to 7–8 km/h, the SD rises from 27 to 71 at 4–5 km/h, the RMSE rises from 32 to 152 at 4–5 km/h, and the CV rises from 0.06 to 0.16 at 4–5 km/h. This shows that the boom oscillation was affected by the change in the vehicle speed, and the boom oscillation increases gradually with the increase of the vehicle speed. Wu et al. [22] detected the boom height at a variety of different speeds on the field road before crop cultivation and concluded that the change of speed influenced the boom height but did not analyze the change law of spray bar height in different sections.
4.2. The Offset Problem of Boom Height-Detecting Value
The fluctuation of the canopy itself and the detection position downward shift of the ultrasonic sensor will cause the offset of the boom height-detecting value, but the fluctuation of the boom height-detecting value has different manifestations. The fluctuation of the canopy itself is mainly divided into two directions: in the extension direction of the boom, the canopy heights under the left, middle, and right section booms are different from each other, and the data show that the distribution of the height-detecting values of the left, middle, and right booms is more dispersed (Figure 9a). In the forward direction of the sprayer, the canopy under the left, middle, and right section booms have different degrees of height changes, resulting in large fluctuations in the height-detecting value of the same boom (Figure 9b). In the same growth stage of wheat, the detection position downward shift of the ultrasonic sensor will lead to different degrees of increase in the height-detecting value of the three booms at the same time, but the increased degree of the height-detecting value on the same section boom is generally the same, which is the key data feature of the detection position downward shift of the ultrasonic sensor. Because the canopy fluctuation was not affected by the change of vehicle speed during the same growth stage of wheat, the detecting value of boom height caused by canopy fluctuation shows the same fluctuation law in four different vehicle speed ranges, which is the key data characteristic of canopy fluctuation.
The height of the left, middle, and right three sections of the boom have great fluctuation and offset in the wheat filling stage and maturity stage compared with the previous stages of wheat. Canopy fluctuation and detection position downward shift of ultrasonic sensor may produce this data performance. From the point of view of different speed ranges in the same stage, the three-section booms show the same fluctuation law in different speed ranges, which is the change characteristics of the boom height-detecting value caused by the fluctuation of the canopy itself. In addition, the looser canopy in the early stage of wheat growth is more likely to make the ultrasonic sensor receive the signal reflection from below the top of the wheat, which leads to the actual detection position of the ultrasonic sensor in the area below the top of the wheat. However, in the test results of the previous growth stages of wheat, there was no phenomenon that the three-section boom height-detecting value increased at the same time. As the wheat growth cycle extends to the filling stage and maturity stage, the canopy gradually becomes dense, and the reflected signal received by the ultrasonic sensor should be mostly from the top area of the wheat.
4.3. The Accuracy and Versatility of the Dynamic Detection Model
The detection accuracy of ultrasonic sensors is easily affected by different growth cycles of crops. Bronson et al. [41] found that the correlation between cotton plant height detected by ultrasonic sensors and manual measurements was affected by different growth stages of cotton and proposed a method for estimating cotton plant height by ultrasonic sensors, but the accuracy was relatively low. Whether this can be used in wheat crops still needs to be verified. Zhao et al. [31] obtained the influence of wheat density change on ultrasonic sensor detection by pruning wheat branches and leaves in the same growth stage, but this method did not consider the influence of wheat leaf thickness and spatial posture changes on ultrasonic sensors during growth. The previously developed static detection model demonstrates high accuracy across the six key growth stages of wheat and effectively addresses the issue of the ultrasonic sensor’s detection position shifting downward during different growth cycles. Therefore, to ensure the accuracy of the ultrasonic sensor in detecting the height from the boom to the top of the wheat, the established dynamic detection model retains the digital equation and offset compensation value in the detection model established in the previous study. At the same time, this paper verifies the application reliability of the boom height detection model in dynamic detection; that is, the actual detection position of the ultrasonic sensor in dynamic detection does not move down. This is a good performance, which proves that the previous research work has high practical significance.
During the field operation of the boom sprayer in the whole growth cycle of wheat, the boom oscillation under the change of vehicle speed affects the accuracy of boom height detection. Li et al. [42] placed several crop plants at different growth stages under ultrasonic sensors. By moving the ultrasonic sensor, the influence of speed and crop growth stage on the ultrasonic sensor is obtained. However, this method does not consider the interference of the field environment on the performance of the ultrasonic sensor. In addition, the test does not involve the influence of the boom oscillation on the boom height detection accuracy, and the ultrasonic sensor has a low moving speed, and there may be a large error at a faster speed. The detection model established in the previous study did not consider the influence of vehicle speed difference on the oscillation of different sections of the boom. By constructing a boom oscillation correction method, the oscillation correction of each section boom at different vehicle speeds was carried out, which has a certain practical effect on improving the accuracy of the dynamic detection model.
However, it should be noted that when the correction data of boom oscillation collected at the seedling stage of wheat are used to correct the boom height-detecting values in the last six key growth stages of wheat, the field road surface was changed by wheel rolling during the operation, which will have an impact on the correction effect. In addition, the field static detection test carried out in the previous study at the six growth stages of wheat and the field dynamic detection test carried out in this paper are the same varieties, and the wheat planting density in the test field is the same. Therefore, the application versatility of the dynamic detection model established in this paper may also be affected by different wheat planting densities, which need to be verified in the next research process.
5. Conclusions
This case study demonstrates an optimization method for a wheat growth cycle ultrasonic boom height detection model that effectively reduces the impact of boom oscillation. The core of this method is to integrate the relationship between the ultrasonic sensor and boom height, the detection compensation value of the static detection model, and the boom oscillation correction parameters. This enables stable and accurate boom height detection even during field operations where oscillation occurs. The test results prove the above conclusion. In the field operation row, the boom oscillation gradually increases with the increase of vehicle speed. In the data acquisition test of boom oscillation correction, taking the middle section boom with the smallest boom oscillation as an example, when the speed is increased from 4~5 km/h to 7~8 km/h, the standard deviation (SD) of the boom height detected value increased from 27 mm to 71 mm, and the coefficient of variation (CV) increased from 0.06 to 0.16. As expected, the optimized model can eliminate the influence of boom oscillation in each section boom. Through classification and analysis of the fluctuation of boom height-detecting values in the wheat seedling stage, the boom oscillation correction parameters of each section boom at different speeds are obtained, which makes the maximum mean absolute difference (MAD) of boom height-detecting values decrease from 216 mm to 138 mm, the maximum root mean square error (RMSE) from 80 mm to 46 mm, the maximum standard deviation (SD) of boom height-detecting values from 183 mm to 134 mm, and the maximum coefficient of variation (CV) of boom height-detecting values from 0.29 to 0.23 in the six key growth stages of wheat. The optimization method relies on only three relatively low-priced ultrasonic sensors. Compared to traditional boom height control systems, this method significantly enhances detection reliability through an algorithm model on the basis of almost no increase in hardware cost. It avoids the issues of low reliability and oscillatory adjustment often seen in existing ultrasonic boom height control systems. Although there are still a few abnormal points in the output results of this model, these anomalies are non-continuous and sporadic. By further integrating algorithms such as response time filtering of the control system, it is expected to minimize the error of boom height control.
Author Contributions
Conceptualization, L.C. and J.W.; methodology, J.W., C.Z., S.Y. and L.C.; validation, C.Z.; formal analyses, C.Z., J.W. and S.Y.; investigation, J.W., S.Y., X.P., Y.G. and W.Z.; resources, C.Z. and S.Y.; data curation, J.W. and Y.W.; writing—original draft: J.W.; writing—review and editing, C.Z., L.C. and S.Y.; funding acquisition, C.Z. and S.Y.; supervision. L.C., C.Z. and S.Y. All authors have read and agreed to the published version of the manuscript.
Funding
This research was funded by the National Natural Science Foundation of China (32201661), S.Y.; the Jiangsu Province and Education Ministry Cosponsored Synergistic Innovation Center of Modern Agricultural Equipment (XTCX1002), C.Z; the Youth Science Foundation of Beijing Academy of Agricultural and Forestry Sciences (QNJJ202210), S.Y.; and the Science and Technology Project of Wuhu City (20231y05), C.Z.
Institutional Review Board Statement
Not applicable.
Data Availability Statement
The data presented in this study are available upon request from the corresponding author.
Conflicts of Interest
The authors declare no conflicts of interest.
References
- Huang, H.J.; Huang, Z.F.; Jiang, C.L.; Zhang, C.X.; LI, R.H.; Zhou, Z.R.; Li, G.; Zhou, F.Y.; Zhu, W.D.; Wei, S.H. Weed species composition and characterization in wheat fields along the middle and lower Yangtze River. Plant Prot. 2021, 47, 203–211. [Google Scholar] [CrossRef]
- Hui, X.Q. Conventional technology and characteristics of agricultural plant protection machinery. Agric. Mach. Using Maint. 2018, 8, 52–53. [Google Scholar] [CrossRef]
- Shi, X.Y.; Li, H.B.; Wang, H.G.; Wang, F.T.; Cao, S.Q. Progresses of pesticide reduction techniques in wheat production and the synergistic effects on the prevention and control of wheat pests. J. China Agric. Univ. 2022, 27, 53–62. [Google Scholar]
- Cui, L.F.; Xue, X.Y.; Le, F.X.; Mao, H.P.; Ding, S.M. Design and experiment of electro hydraulic active suspension for controlling the rolling motion of spray boom. Int. J. Agric. Biol. Eng. 2019, 12, 72–81. [Google Scholar] [CrossRef]
- Qiao, B.Y.; Ding, S.M.; Xue, X.L.; Cui, L.F.; Zhou, Q.Q.; Zhang, Y.P. The Research Status and Prospects on the Structure of Spray Boom. J. Agric. Mech. Res. 2017, 39, 246–250+256. [Google Scholar] [CrossRef]
- Feng, Y.N.; Pei, L.; Li, H.; Chen, X.B.; Gong, Y.; Chen, X. Industry status and development trend of self-propelled boom sprayer. J. Chin. Agric. Mech. 2019, 40, 56–59+66. [Google Scholar] [CrossRef]
- Jia, W.D.; Zhang, L.J.; Yan, M.D.; Xue, X.Y. Current situation and development trend of boom sprayer. J. Chin. Agric. Mech. 2013, 34, 19–22. [Google Scholar] [CrossRef]
- Lin, L.H.; Hou, J.L.; Wu, Y.Q.; Liu, X.F. Review and development trend of high clearance boom sprayer. J. Chin. Agric. Mech. 2017, 38, 38–42. [Google Scholar] [CrossRef]
- Burgers, T.A.; Gaard, J.D.; Hyronimus, B.J. Comparison of three commercial automatic boom height systems for agricultural sprayers. Appl. Eng. Agric. 2021, 37, 287–293. [Google Scholar] [CrossRef]
- Ehlert, D.; Adamek, R.; Horn, H.J. Laser rangefinder-based measuring of crop biomass under field conditions. Precis. Agric. 2009, 10, 395–408. [Google Scholar] [CrossRef]
- Zaman, Q.U.; Salyani, M.; Zaman, Q.U.; Salyani, M. Effects of foliage density and ground speed on ultrasonic measurement of citrus tree volume. Appl. Eng. Agric. 2004, 20, 173–178. [Google Scholar] [CrossRef]
- Aziz, S.A.; Steward, B.L.; Birrell, S.J.; Kaspar, T.C.; Shrestha, D.S. Ultrasonic sensing for corn plant canopy characterization. American Soc. Agric. Biol. Eng. 2004, 041120. [Google Scholar] [CrossRef]
- Li, H.Z.; Zhai, C.Y.; Weckler, P.; Wang, N.; Yang, S.; Zhang, B. A Canopy Density Model for Planar Orchard Target Detection Based on Ultrasonic Sensors. Sensors 2017, 17, 31. [Google Scholar] [CrossRef] [PubMed]
- Nan, Y.L.; Zhang, H.C.; Zheng, J.Q.; Bian, L.M.; Li, Y.X.; Yang, Y.; Meng, Z.; Yu, F.G. Estimating leaf area density of Osmanthus trees using ultrasonic sensing. Biosyst. Eng. 2019, 186, 60–70. [Google Scholar] [CrossRef]
- Dou, H.J.; Wang, S.L.; Zhai, C.Y.; Chen, L.P.; Wang, X.; Zhao, X.G. A 1idar sensor based spray boom height detection method and the corresponding testa1 va1idation. Sensors 2021, 21, 2107. [Google Scholar] [CrossRef] [PubMed]
- Chen, W.F.; Qiu, B.J.; Yang, N. Spray Boom Position Control System Based on Ultrasonic Sensors. J. Agric. Mech. Res. 2013, 35, 84–87. [Google Scholar] [CrossRef]
- Wei, X.H.; Shao, Q.; Miao, D.D.; Li, L.; Xie, X.W. Online Control System of Spray Boom Height and Balance. Trans. Chin. Soc. Agric. Mach. 2015, 46, 66–71. [Google Scholar] [CrossRef]
- Pan, F.C.; Deng, F.D.; Wen, H.J. Design and Tests on Boom Height Automatic Adjusting System. J. Agric. Mech. Res. 2017, 39, 107–111. [Google Scholar] [CrossRef]
- Xue, T.; Li, W.V.; Du, Y.F.; Mao, E.R.; Wen, H.J. Adaptive fuzzy sliding mode control of spray boom active suspension for large high clearance sprayer. Trans. Chin. Soc. Agric. Eng. 2018, 34, 47–56. [Google Scholar]
- Sun, X.; Yang, X.J.; Dong, X.; Zhang, T.; Yan, H.R.; Wang, Z.D. Spray Boom Height Intelligent Adjustment System Based on Expert Control. Trans. Chin. Soc. Agric. Mach. 2020, 51, 275–282. [Google Scholar] [CrossRef]
- Dou, H.J.; Zhai, C.Y.; Chen, L.P.; Wang, S.L.; Wang, X. Field Variation Characteristics of Sprayer Boom Height Using a Newly Designed Boom Height Detection System. IEEE Access 2021, 9, 17148–17160. [Google Scholar] [CrossRef]
- Wu, J.G.; Yang, S.; Li, C.Q.; Zhai, C.Y. Design and Test of Spray Boom Height Control System for 3WSH-500 Boom Sprayer. J. Agric. Mech. Res. 2024, 0906, 1–9. [Google Scholar] [CrossRef]
- Jimenez-Berni, J.A.; Deery, D.M.; Rozas-Larraondo, P.; Condon, A.G.; Rebetzke, G.J.; Anthony, G.C.; Greg, J.R.; James, R.A. High Throughput Determination of Plant Height, Ground Cover, and Above-Ground Biomass in Wheat with LiDAR. Front. Plant Sci. 2018, 9, 237. [Google Scholar] [CrossRef] [PubMed]
- Scotford, I.M.; Miller, P.C.H. Combination of Spectral Reflectance and Ultrasonic Sensing to monitor the Growth of Winter Wheat. Biosyst. Eng. 2004, 87, 27–38. [Google Scholar] [CrossRef]
- Li, J.; Nie, Z.; Chen, Y.; Ge, D.; Li, M. Development of Boom Posture Adjustment and Control System for Wide Spray Boom. Agriculture 2023, 13, 2162. [Google Scholar] [CrossRef]
- Koc, C.; Keskin, R. Developing of PIC controlled active boom suspension system for field sprayer. J. Agric. Sci. 2011, 17, 24–33. [Google Scholar] [CrossRef]
- Tadatoshi, S.; Keiji, M.; Kiyoaki, M. Control of Spraying Height with Ultrasonic Sensor for Boom Sprayer (Part 1). J. Jpn. Soc. Agric. Mach. 1992, 54, 31–39. [Google Scholar] [CrossRef]
- Planas, S.; Rosell, J.R.; Pomar, J.; Camp, F.; Solanelles, F.; Gràcia, F.; Jordi, L.; Emilio, G. Performance of an ultrasonic ranging sensor in apple tree canopies. Sensors 2011, 11, 2459–2477. [Google Scholar] [CrossRef]
- Lee, W.S.; Alchanatis, V.; Yang, C.; Hirafuji, M.; Moshou, D.; Li, C. Review: Sensing technologies for precision specialty crop production. Comput. Electron. Agric. 2010, 74, 2–33. [Google Scholar] [CrossRef]
- Yuan, W.; Li, J.; Bhatta, M.; Shi, Y.; Baenziger, P.S.; Ge, Y. Wheat Height Estimation Using LiDAR in Comparison to Ultrasonic Sensor and UAS. Sensors 2018, 18, 3731. [Google Scholar] [CrossRef]
- Zhao, X.G.; Zhai, C.Y.; Wang, S.L.; Dou, H.J.; Yang, S.; Wang, X.; Chen, L. Sprayer boom height measurement in wheat field using ultrasonic sensor: An exploratory study. Front. Plant Sci. 2022, 13, 1008122. [Google Scholar] [CrossRef] [PubMed]
- Wang, X.Y.; Qu, J.Z.; Xu, Y.C.; Li, X.Q.; Xiao, Z.W.; Wang, L.L. Spray Boom Height Control System of Potato Sprayer Based on Canopy Information. Trans. Chin. Soc. Agric. Mach. 2023, 54, 198–207. [Google Scholar] [CrossRef]
- Llorens, J.; Gil, E.; Llop, J.; Escolà, A. Ultrasonic and Lidar Sensors for Electronic Canopy Characterization in Vineyards: Advances to Improve Pesticide Application Methods. Sensors 2011, 11, 2177–2194. [Google Scholar] [CrossRef]
- Yin, X.; An, J.H.; Wang, X.; Wang, Y.L.; LI, J.Q.; Jin, C.Q. Design and Test of Automatic Beam Leveling System for High-clearance Sprayer. Trans. Chin. Soc. Agric. Mach. 2022, 53, 98–105+115. [Google Scholar] [CrossRef]
- Zhang, M.; Hu, L.; Ke, X.R.; Tang, L.M.; Meng, S.B.; Du, P.; Zhou, H.; He, J. Design and Test of Boom Automatic Leveling Control System for Self-propelled Paddy Sprayer. J. Agric. Mech. Res. 2019, 41, 45–51. [Google Scholar] [CrossRef]
- Zhou, Z.Y.; Xiang, Y.; Chen, Y.L.; Yu, X.; Liu, Z.B.; Zheng, D.T. Automatic Retraction Control System of Rotors Hovering Spray Boom Sprayer. Trans. Chin. Soc. Agric. Mach. 2023, 54, 120–131. [Google Scholar]
- Cui, L.F.; Xue, X.Y.; Ding, S.M.; Le, F.X. Development of a DSP-based electronic control system for the active spray boom suspension. Comput. Electron. Agric. 2019, 166, 105024. [Google Scholar] [CrossRef]
- Wang, Q.; Zhang, W.A.; Wang, X.; Wang, S.L. The Control System Design of Agricultural Spray Boom whose Height Can Be Intelligent Adjusted. J. Agric. Mech. Res. 2016, 38, 156–160. [Google Scholar] [CrossRef]
- Wu, J.; Li, C.; Pan, X.; Wang, X.; Zhao, X.; Gao, Y.; Yang, S.; Zhai, C. Model for Detecting Boom Height Based on an Ultrasonic Sensor for the Whole Growth Cycle of Wheat. Agriculture 2024, 14, 21. [Google Scholar] [CrossRef]
- Song, Y.Y.; Hong, S.; Li, M.Z.; Zhang, Q. Technology Application of Smart Spray in Agriculture: A Review. Intell. Autom. Soft Comput. 2015, 21, 319–333. [Google Scholar] [CrossRef]
- Bronson, K.F.; French, A.N.; Conley, M.M.; Barnes, E.M. Use of an ultrasonic sensor for plant height estimation in irrigated cotton. Agron. J. 2021, 113, 2175–2183. [Google Scholar] [CrossRef]
- Li, B.; Bai, X.H.; Li, Y.K. A crop canopy localization method based on ultrasonic ranging and iterative self-organizing data analysis technique algorithm. Sensors 2020, 20, 818. [Google Scholar] [CrossRef] [PubMed]


Disclaimer/Publisher’s Note: The statements, opinions and data contained in all publications are solely those of the individual author(s) and contributor(s) and not of MDPI and/or the editor(s). MDPI and/or the editor(s) disclaim responsibility for any injury to people or property resulting from any ideas, methods, instructions or products referred to in the content. |
© 2024 by the authors. Licensee MDPI, Basel, Switzerland. This article is an open access article distributed under the terms and conditions of the Creative Commons Attribution (CC BY) license (https://creativecommons.org/licenses/by/4.0/).