Article

Grain Yield, Rice Seedlings and Transplanting Quantity in Response to Decreased Sowing Rate under Precision Drill Sowing

Liaoning Rice Research Institute, Shenyang 110101, China
*
Author to whom correspondence should be addressed.
Agriculture 2024, 14(10), 1745; https://doi.org/10.3390/agriculture14101745
Submission received: 21 August 2024 / Revised: 27 September 2024 / Accepted: 1 October 2024 / Published: 3 October 2024
(This article belongs to the Section Crop Production)

Abstract

:
Mechanical transplanting has become an important part of modern Chinese rice production, and an inadequate sowing rate severely inhibits rice seedling growth and development. Precision drill sowing is an effective method for obtaining higher quality seedlings during machine transplanting. There is a lack of systematic research on the precision drilling of rice. Therefore, we carried out research on the quality of machine-transplanted seedlings and precision drill sowing transplantation. A greenhouse experiment (Liaoning Rice Research Institute) and field experiment (Sujiatun District, Shenyang City, Liaoning Province, China) were conducted between 2020 and 2021 to analyze the influence of precision drill sowing on rice growth and yield. Precision drill sowing was conducted at four sowing rates (3400, 3600, 3800, and 4000 seeds/tray), and traditional broadcasting was also conducted at a sowing rate of 4000 seeds/tray. We evaluated the seedling rice quality, physiological and biochemical characteristics and transplanting quantity. The results indicated that precision drill sowing at a sowing rate of 3400 seeds/tray resulted in the highest plumpness value (0.18) and seedling strength index (0.42) of individual plants. However, the empty hill rate was as high as 3.05%, which did not satisfy the field seedling number requirement. Precision drill sowing at a sowing rate of 4000 seeds/tray resulted in the lowest physiological (the average levels of SOD, POD and soluble protein were 311.78 µg/g, 8.25 µg/g and 1.28 µg/g) and biochemical indices of individual plants. The damaged seedling rate increased by 2.07%, and the dead seedling rate increased by 0.25%, resulting in poor seedling and transplanting quality. In this study, 3800 seeds/tray was the best option and had the highest yields of 10,776.60 kg/ha and 10,730.85 kg/ha over the two years. This sowing approach performs well in terms of field transplanting, provides a balance point between seedling number and quality and is conducive to rice yield production. The results of this study are important for improving rice seedling quality, enhancing field transplanting quantity and increasing rice yield and food security.

1. Introduction

Rice is an important food crop in the world; more than half of the Chinese population relies on rice as the main food source [1], and its production level and yield are related to national food security and economic development [2,3]. Scientific and technological progress has continuously improved the mechanization of rice production [4], and mechanical rice cultivation and transplantation have become important factors in modern rice production [2,5,6]. Rice seedling mechanization has generally been implemented with traditional broadcasting during sowing in northeastern China, characterized by efficiency, cold resistance and low costs [7,8,9].
However, there are some problems with this method, such as the high sowing rate, poor seedling quality, and lack of uniformity in terms of seedlings transplanted per hill, leading to a severe seedling damage and a prolonged seedling regreening period, which affect rice yield [10,11]. In contrast, an extremely reduced sowing rate may also lead to poor seedling coverage and a high empty hill rate, resulting in an insufficient primary seedling number and a low production of panicles at the maturity stage [12,13,14].
Precision drill seeding is a seeding method for rice plant seedlings that is different from traditional seeding. It forms equidistant and equal quantities of strip seedlings by dropping rice seeds into the seedling tray in an orderly manner and reduces plant damage; thus, this method is more suitable than others for the mechanical transplanting of seedlings, increasing transplanting seedling quantity and reducing the missing hill percentage in machine transplanting. Given this information, some scholars have proposed hill sowing with precision longitudinal drilling methods for hybrid rice in southern China [15,16,17,18,19,20], as this method can reduce the sowing rate of hybrid rice, promote transplanting quantity and coordinate physiological and ecological characters. In addition, it can increase rice yield, improve the plant uniformity of the rice population, increase the tiller number at peak tillering stage and enhance the leaf area index, promoting dry matter accumulation.
However, there are few reports on the optimal sowing method and precision drill sowing rate for seedlings in northeastern China. In this study, the traditional broadcast sowing method was used as the control, and four precision drill sowing rates were set. By investigating and measuring seedling quality and physiological and biochemical indicators and machine-transplanted quantity, we analyzed rice yield and its constituent factors and explored the effect of precision drill sowing rate on rice seedling quality and transplanting quantity. The purpose of this study was to determine the optimal seeding rate for machine-transplanted seedlings and provide technical support for cultivating rice at a low sowing rate to improve quality, yield and efficiency. It is greatly important to improve the quality of rice seedlings transplanted by machines, improve the effect of transplanting in the field, increase the yield of rice and ensure food security.

2. Materials and Methods

2.1. Experimental Design

The rice (Oryza sativa L.) japonica cultivar ‘Liaojing401’ was used in this study. The tested cultivar belongs to a variety with a balance between panicles and grains that is currently the main cultivated variety in the central rice region of Liaoning Province (bred and provided by the Liaoning Rice Research Institute). Both greenhouse and field experiments were conducted in 2020–2021 at the Liaoning Rice Research Institution (LRRI) in Sujiatun District, Shenyang Liaoning Province, China, at 123.28° E, 41.58° N latitude. The LRRI is located in an area with a warm temperate continental semi-humid monsoon climate, with an average annual temperature of approximately 8 °C and an average annual precipitation of 659.6 mm. There were no natural disasters or extreme weather during the growth period. The meteorological data for the rice growth period at the experimental site are shown in Figure 1. The soil in the experimental area has a pH of 6.3, with an organic matter content of 2.57%, an alkaline nitrogen content of 90.6 mg/kg, an available phosphorus content of 46.6 mg/kg and an available potassium content of 84.7 mg/kg.
The treatments were as follows: precision drill sowing at rates of 3400 seeds/tray (D1), 3600 seeds/tray (D2), 3800 seeds/tray (D3), 4000 seeds/tray (D4) and a traditional broadcast at a sowing rate of 4000 seeds/tray (CK). The precision of the seeding rates was within 5‰. D1–D4 used a high-speed precision drill sowing pipeline (Liaoning Rice Research Institute and Xinmin JiuJing Agricultural Machinery R & D, China Shenyang) with 600 trays per treatment. The CK used a traditional broadcast sowing pipeline (Kubota2BZP-800, Kubota, China Suzhou) with 600 trays per treatment. For all conditions, the tray length was 580 mm, the width was 280 mm and the depth was 30 mm. The sowing and transplanting diagrams are shown in Figure 2. Organic matter-based seedling substrates provided by the LRRI were used as seedling carriers for drill sowing, with a distance between rows of 14 mm. With the growth and development of the plants and the increase in stem base width, the distance between the roots of the seedlings before transplantation was reduced to 10 mm, which still met the requirements of the transplanter’s seedling picking area. The experiments were conducted using a completely randomized design with three replicates for each treatment, and all trays were placed in the same greenhouse at LRRI (E: 123.31°, N: 41.64°). The management of fertilizer and water was carried out according to factory seedling production practices [8].
A completely randomized block design was used in the field experiment, transplanting was conducted in two consecutive years at a leaf age of 3.5 (the unfolded length of the fourth leaf was equal to that of the third leaf length stage) and seedling age of 34 d, from May to October 2020 and 2021, and every sowing treatment was transplanted with 16 trays of seedlings into 36 rows, each 100 m in length, with three replicates, using a Kubota 2ZGQ-6H transplanter (Kubota, China Suzhou); the row distance was 30 cm, and the hill distance was 17 cm. The seedling area obtained by the transplanting machine was 14 mm in both length and width, namely, 20 times in the vertical direction and 41 times in the horizontal direction. Field management was carried out according to the local high-yield field management method [21].

2.2. Index Determination

2.2.1. Investigation of Seedling Morphological Indices

Thirty seedlings of the same size were selected from in the same tray of each plot, with three replicates before transplanting to examine their plant height (PLH), stem base width (SBW), leaf ages (LAs), root numbers (RNs) and root lengths (RLs) and to determine their leaf SPAD values one day before transplanting.

2.2.2. Investigation of Transplanting Quantity

The numbers of empty hill seedlings, floating seedlings, damaged seedlings and dead seedlings on 100 consecutive hills were randomly investigated in each plot, and the percentages were calculated as follows: Equations (1)–(4).
Empty hill rate (HER/%) = empty hill number/100
Damaged seedling rate (DASR/%) = damaged seedling number/100
Floating seedling rate (FLSR/%) = floating seedling number/100
Dead seedling rate (DESR/%) = dead seedling number/100
Fifty hills were marked, and the number of primary seedlings was counted five days after machine transplanting.

2.2.3. Determination of Physiological and Biochemical Characteristics

One hundred seedlings of the same size were selected from each plot before transplanting. The activity of superoxide dismutase (SOD) was determined by the nitrogen blue tetrazole method, the activity of peroxidase (POD) was determined by the guaiacol method, the activity of catalase (CAT) was determined by ultraviolet spectrophotometry, the content of malondialdehyde (MDA) was determined by the thiobarbituric acid method [22], the content of soluble protein (SP) in the leaves was determined by the Coomassie brilliant blue (G-250) method [23], and the content of soluble sugar (SS) was determined by anthrone colorimetry [24].

2.2.4. Measurement of Nutrient Absorption

Two hundred plants with uniform growth were selected for each treatment before transplanting. Dried seedling samples were ground and crushed with a quartz mortar [25], and H2SO4-H2O2 was used for digestion. The total nitrogen content of the plant was determined by the Kjeldahl method, the total phosphorus content of the plant was determined by molybdenum antimony resistance colorimetry, and the total potassium content of the plant was determined by the flame photometric method, with three replicates.

2.2.5. Measurement of Biomass of Stem and Root

At the jointing, heading and maturity stages, five hills of representative plants were selected based on the average number of tillers in each plot. Root sampling involves excavating a 17 cm long, 30 cm wide and 20 cm deep cube centered on the plant, and washing it with flowing water. The stems and roots were water-removed for 30 min at 105 °C and dried to a constant weight at 80 °C.

2.2.6. Determination of Yield and Its Components

At the maturity stage, the side rows in each treatment plot were removed, a Kubota harvester (PRO988Q) was used for harvesting the rice, the yield was calculated according to the actual harvest area, the moisture content of the rice was measured, and then, the rice yield was converted to 14.5% moisture content. The number of productive panicles, primary branches, full seed number, seed setting rate and thousand-seed weight were calculated based on 10 consecutive sampling points in each plot.

2.3. Data Calculation and Statistical Analysis

One hundred seedlings of the same size were selected from each plot before transplanting. The total accumulation of nitrogen, phosphorus and potassium in the rice seedlings represented their absorption. The accumulation of total dry matter at the seedling stage was calculated by the following formulas: Equations (5)–(6).
Nutrient accumulation (mg/100 plants) = dry matter mass of 100 plants × nutrient content
Nutrient accumulation of tray (g/tray) = nutrient accumulation/1000×sowing rate
Rice seedling quality refers to the comprehensive evaluation of the morphological indicators before transplanting and was calculated by the following formulas [26]: Equations (7)–(9).
Plumpness (PLU) = stem dry weight/plant height
seedling strengthening index (SSI) = stem base width × plumpness
U n i f o r m i t y   U N I = 1 x a x a ¯ x a ¯ 2 + [ 1 x b x b ¯ x b ¯ ] 2
where x a and x b represent plant height and stem base width, respectively, and x a ¯ and x b ¯ represent the average values, respectively.
Excel (2020, Microsoft, Redmond, WA, USA) was used for data organization, SPSS (22.0; SPSS Inc., Chicago, IL, USA) was used for the analysis of variance (ANOVA) to evaluate significant differences, and Origin (Origin Lab 2021, Hampton, MA, USA) was used for data plotting. All data are expressed as the mean ± standard deviation with three replicates. Multiple comparisons of means were based on Fisher’s least significant difference (LSD) test at a 5% significance level unless stated otherwise. A structural equation model was used to calculate the path coefficients between yield, transplanting quality, and physiological and ecological indicators by using Smart PLS4.

3. Result

3.1. Morphological Indices of Rice Seedling

To determine the impact of precision drill sowing and mechanical transplantation on rice seedling variables and rice yield, we first aimed to determine the effect of different precision drill sowing rates on rice seedling characteristics by calculating various morphological indices. The morphological indices of the seedlings in the different treatments were consistent between the two years (Table 1). The effect of seeding rate on leaf age and root number was not significant (p > 0.05). Plant height was highest in CK, showing values of 14.15 cm and 14.84 cm in 2020 and 2021, respectively; and the lowest values in D1: 12.26 cm and 12.43 cm in 2020 and 2021, respectively. The SPAD values, stem base width and root length decreased with increasing sowing rate but were higher in the precision drill sowing treatments compared to the traditional broadcast sowing treatment. The variation in plant height and stem base width between the treatments was relatively large. In the D1 and D2 treatments, the plant height and root length decreased, while the stem base width increased.

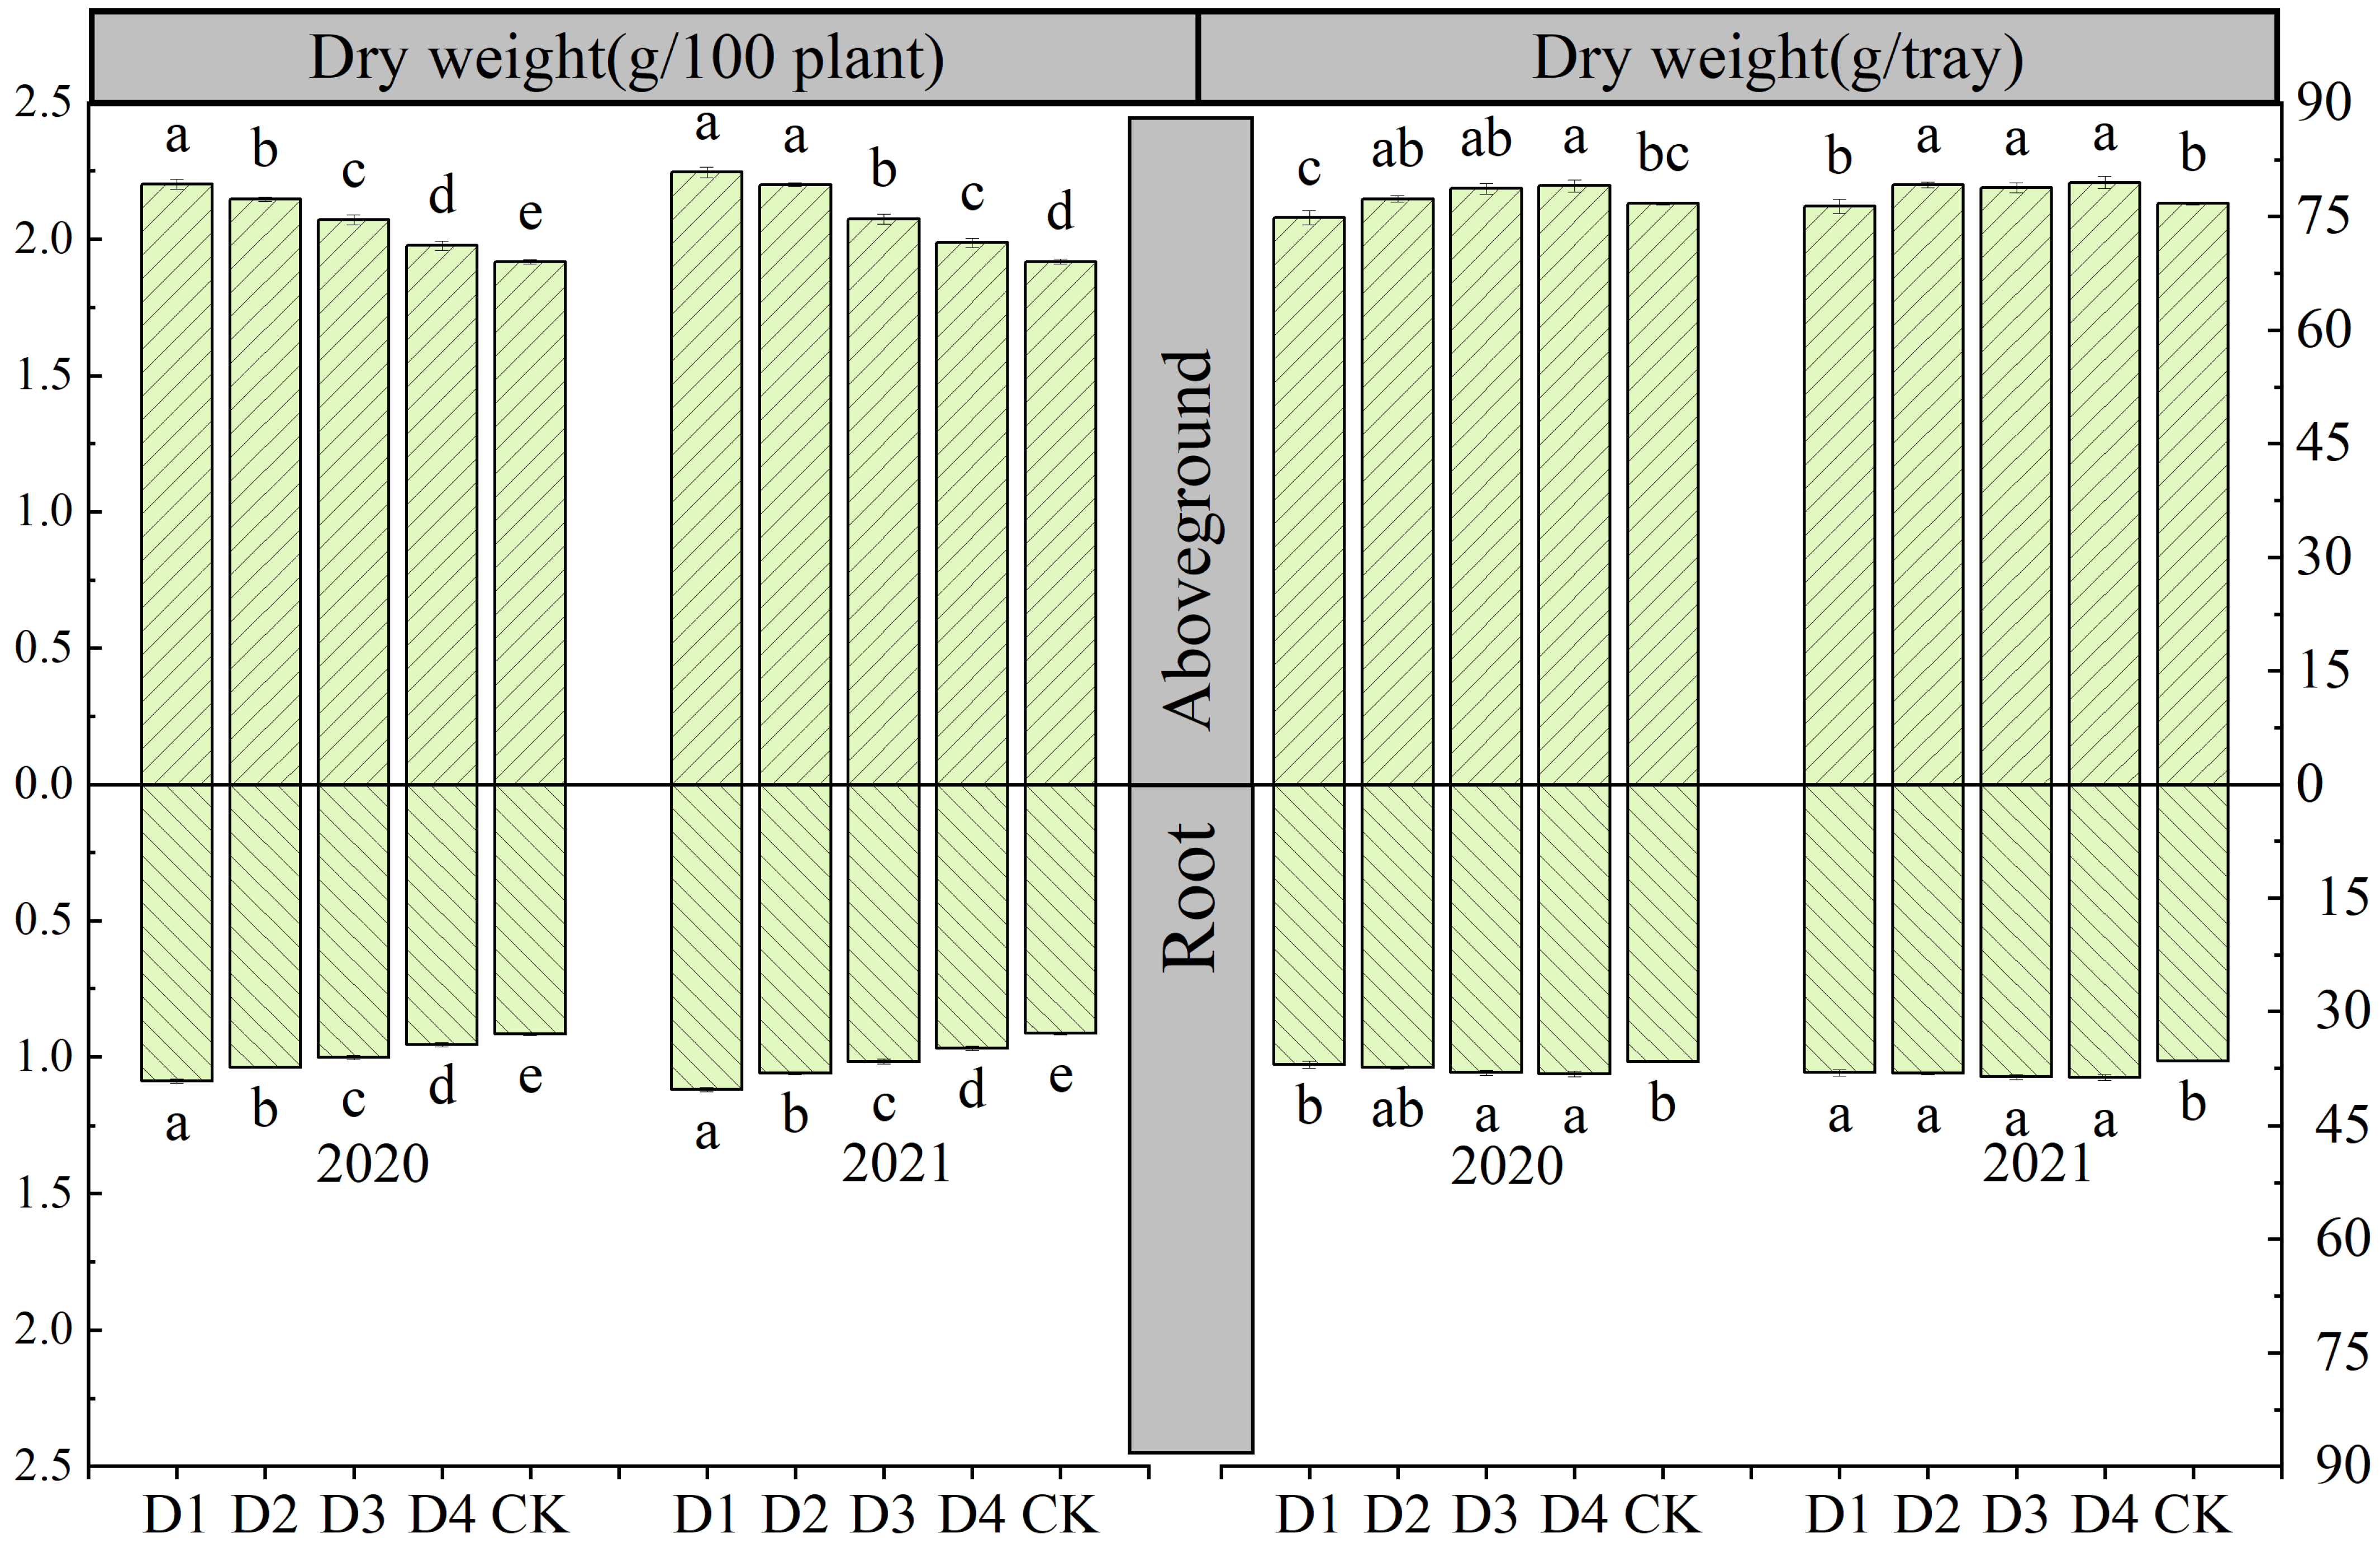
3.2. Biomass Accumulation of Rice Seedlings

Biomass accumulation is the basis of seedling growth and development. Of the treatments, the D1 had the highest stem weight and root weight, showing values of 2.20 g/100 plant and 2.19 g/100 plant, as well as 1.08 g/100 plant and 1.12 g/100 plant in 2020 and 2021, respectively. CK had the lowest values of 1.91 g/100 plant and 1.91 g/100 plant, as well as 0.92 g/100 plant and 0.91 g/100 plant in 2020 and 2021, respectively (Figure 3), reaching a significant level (p < 0.05). Except for the stem weight in D1 and D2 in 2021, the differences among the other treatments reached a significant level (p < 0.05), where the difference between root weight among the treatments was more obvious than that of stem weight, indicating that the change in root weight was more obvious when the sowing rate decreased.
The whole tray material accumulation in D3 and D4 was high, with stems of 78.66, 78.79, 79.03 and 79.47 g/tray and root weights of 38.08, 38.64, 38.23 and 38.70 g/tray in 2020 and 2021, respectively, while the accumulation in D1 and CK was low, with stems of 74.84 and 76.32 g/tray and roots of 36.64 and 36.52 g/tray in 2020 and 2021, respectively, reaching a significant level (p < 0.05). This indicates that whole tray seedling biomass accumulation required not only a good individual plant level but also an appropriate seeding amount to ensure population growth in the whole tray.

3.3. Nutrient Absorption of Rice Seedlings

The nutrient absorption of seedlings is affected by different sowing rates and methods, resulting in differences in the nutrient accumulation of individual plants and seedling tray populations. The changes in nutrient absorption of seedlings (Table 2) in the different treatments were consistent between the two years. The N, P and K uptake decreased with decreasing sowing rate, and the N, P and K uptake in the precision drill sowing treatments was higher than that in CK.
The highest absorption of N in the whole tray was the highest in D3 and D4 in both years, while the lowest were in D1 and CK in 2020 and in D1 in 2021. In 2020, the P uptake in the whole tray was higher in the precision drill sowing treatments compared to CK. In 2021, D4 had the highest P uptake, at 2.30 g/tray, D3 had the second highest P uptake, at 2.26 g/tray, and D1 had the lowest P uptake, at 2.17 g/tray; however, the P uptake of 2020 in the precision drill sowing treatments were significantly different (p < 0.05) from those in CK. The absorption of K in the whole tray was higher in the precision drill sowing treatments compared to CK in 2021, except for D1.

3.4. Physiological and Biochemical Characteristics of Rice Seedling

SOD, POD, CAT and MDA are the physiological responses of seedlings to different growth conditions and can be used as important indicators to judge the status of seedlings. The changes in the physiological and biochemical characteristics of seedlings in the different treatments were consistent between the two years (Table 3). SOD, POD and CAT activities, as well as the soluble protein and soluble sugar contents were highest in D1 and lowest in CK, reaching a significant level (p < 0.05). Among these, the POD activity and soluble sugar content significantly (p < 0.05) changed among the different treatments. The MDA activity was highest in CK and lowest in D1 in 2020, showing a decreasing trend with a decrease in the seeding rate, which was significantly lower in D1 than it was in CK.

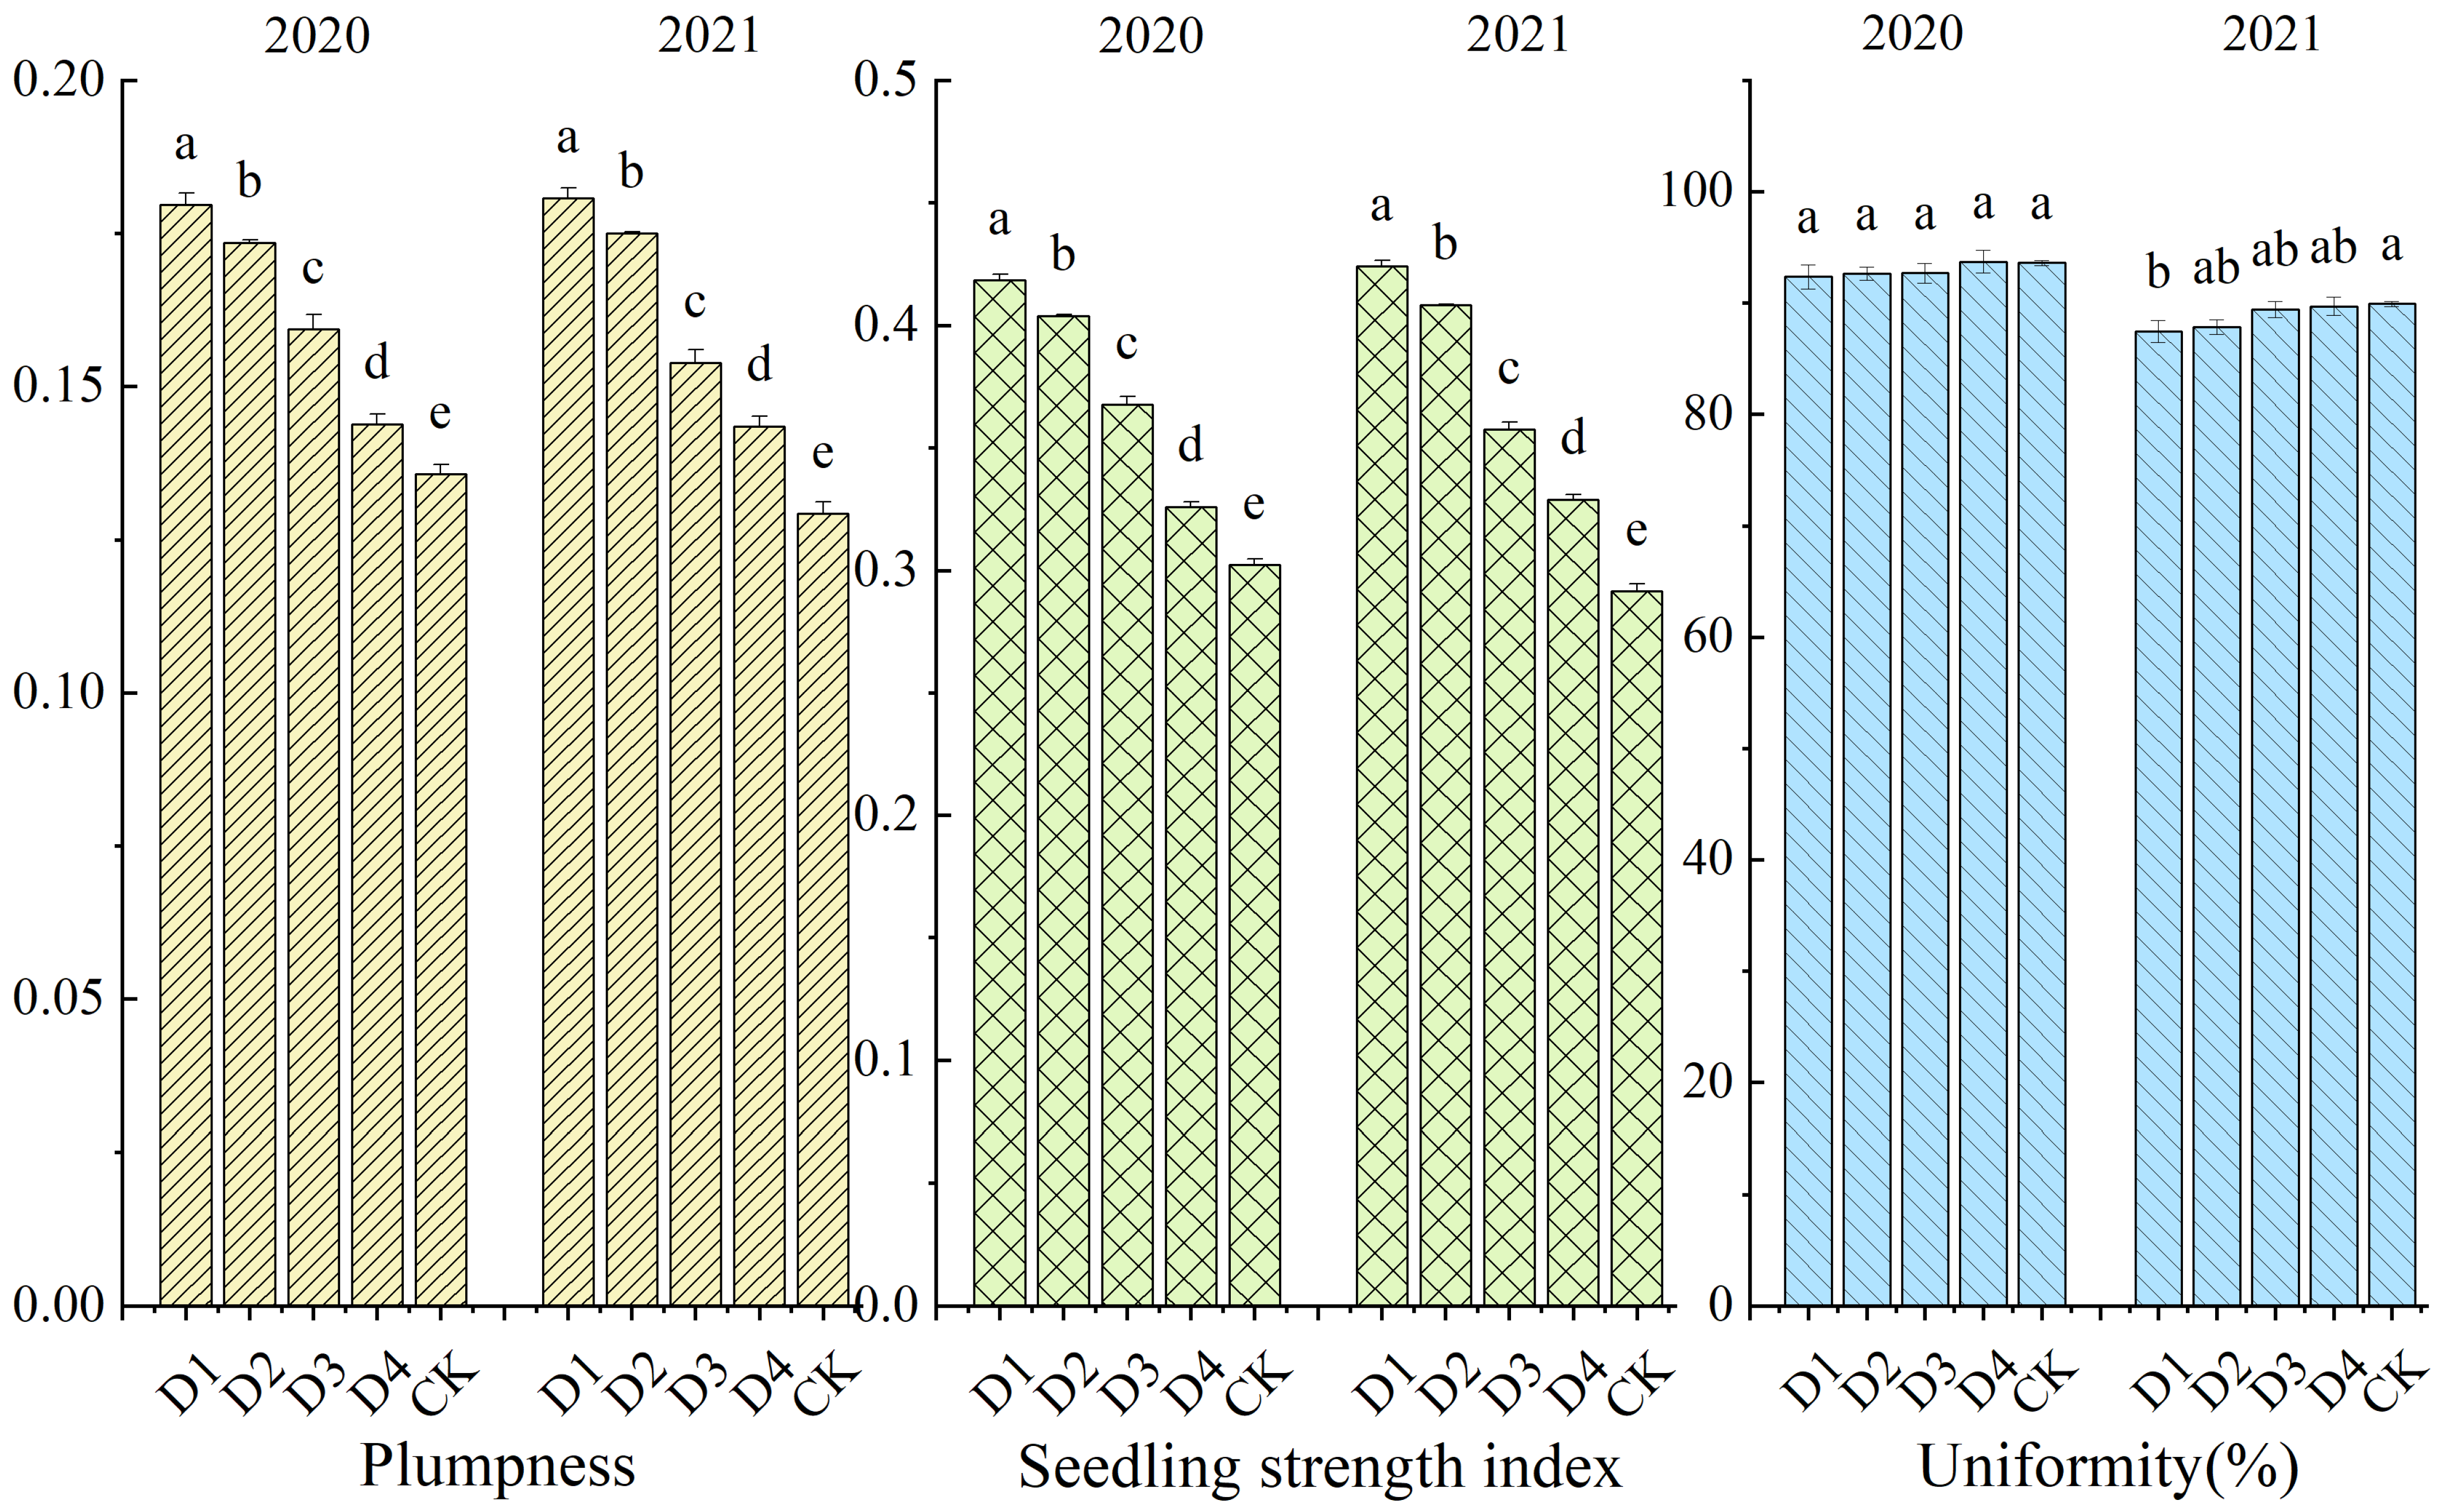
3.5. Quality of Rice Seedling

Seedling quality is the basis for calculating the comprehensive morphological index. Seedling plumpness and the seedling strength index were consistent between years (Figure 4), with D1 having the highest values: a seedling plumpness of 0.18 in both years and a seedling strength index of 0.42 in both years. CK had the lowest values, with a seedling plumpness of 0.14 and 0.13 in 2020 and 2021, respectively, and a seedling strength index of 0.30 and 0.29 in 2020 and 2021, respectively. With the decrease in the seeding amount, seedling plumpness and the seedling strength index increased significantly (p < 0.05), indicating that precision drill sowing is conducive to increasing seedling strength and that a reduction in the seeding rate is conducive to improving individual seedling quality. Seedling uniformity showed a trend of decreasing with decreasing seeding rate, with no significant (p > 0.05) difference among the treatments in 2020, and a significant difference between D1 and CK in 2021.

3.6. Transplanting Quality of Rice Seedling

Field transplanting quantity is an important measure for testing the comprehensive quality of machine-transplanted seedlings and the basis for determining the final yield of rice. The effects of transplanting seedlings from the different treatments to the field had the same trends between the two years (Table 4). Generally, the primary seedling number decreased with decreasing seeding amount, and D4 and CK had significantly (p < 0.05) higher seedling amounts than the other treatments, indicating that the seeding rate significantly (p < 0.05) affected the primary seedlings in the field, given that the same area of seedlings was used by the transplanter. Among the treatments, the rate of empty hills increased with the decrease in seeding rate, and compared with the other treatments, in D1, this rate increased significantly (p < 0.05) by 3.01% and 3.09% in 2020 and 2021, respectively; in addition, the rates of empty hills in D2 and D3 were significantly (p < 0.05) lower than those in D4 and CK. The damaged seedling rate and dead seedling rate increased significantly (p < 0.05) with increasing sowing rate, and these rates were lower in D4 compared to CK. The floating seedling rate of D1 was the lowest, reaching a significant (p < 0.05) level in D4 and CK. Other treatments showed an increasing trend with increasing seeding rate but did not reach a significant (p > 0.05) level. In summary, the precision drill sowing method is beneficial because it produces seedlings for the transplanter, reduces planting injury caused by transplanting, and improves the field transplanting effect.

3.7. Biomass of Stem and Root

The biomass at different growth stages is an important indicator reflecting the growth of rice. The biomass of the stem and root from the different treatments exhibited the same trends across the two years. There was no significant difference (p > 0.05) between years, a significant difference (p < 0.05) between treatments, and no significant interaction (p > 0.05) between treatments and years (Table 5). The biomass of the stems at each stage of the two-year period was the highest in D3, with an increase in biomass accumulation as the growth period progressed. It reached its peak at maturity, reaching 20.35 t/ha and 20.45 t/ha in 2020 and 2021, respectively, which was significantly (p < 0.05) higher than that of CK and D1. The mature biomass of D2 and D4 treatments exceeded 20 t/ha over both years, which was significantly (p < 0.05) higher than that of CK and D1, maintaining a relatively high level.
The root biomass of the underground part was the highest in D3 over both years, with the peak occurring at the heading stage. In 2020 and 2021, it was 1.56 t/ha and 1.57 t/ha, respectively, which was significantly (p < 0.05) higher than other treatments. During the jointing stage, D3 was significantly (p < 0.05) higher than CK and D1. A good accumulation of aboveground biomass and underground biomass support provides a biomass basis for yield accumulation.

3.8. Grain Yield and Yield Components

The yield and composition factors of rice are the most important indicators in rice production. Among the treatments, D3 had the highest yield, followed by D2, and in 2020 and 2021 (Table 6), the yield values were 10,776.60 kg/ha and 10,730.85 kg/ha and 10,592.85 kg/ha and 10,524.90 kg/ha, respectively; these values were significantly (p < 0.05) higher than those in D1 and CK. The yield difference was mainly due to the number of productive panicles and the number of full seeds. The number of primary branches was the highest in D4, showing a value of 11.42, which was significantly (p < 0.05) higher than that in CK. The thousand-seed weight in D1 was significantly (p < 0.05) higher than those in CK and D4 in 2020. The seed setting rate was not significantly different (p > 0.05) among the treatments in 2020, but that in D1 was significantly (p < 0.05) higher than that in CK in 2021. The number of productive panicles was the lowest in D1 and the highest in D4, indicating that the difference in the number of tillers caused by the seeding rate affected the whole growth period. The number of primary seedlings in D3 and D2 ensured a sufficient number of productive panicles at maturity and reduced the plant injury rate to provide a good foundation for plants to grow plumper seeds and improve rice yield.

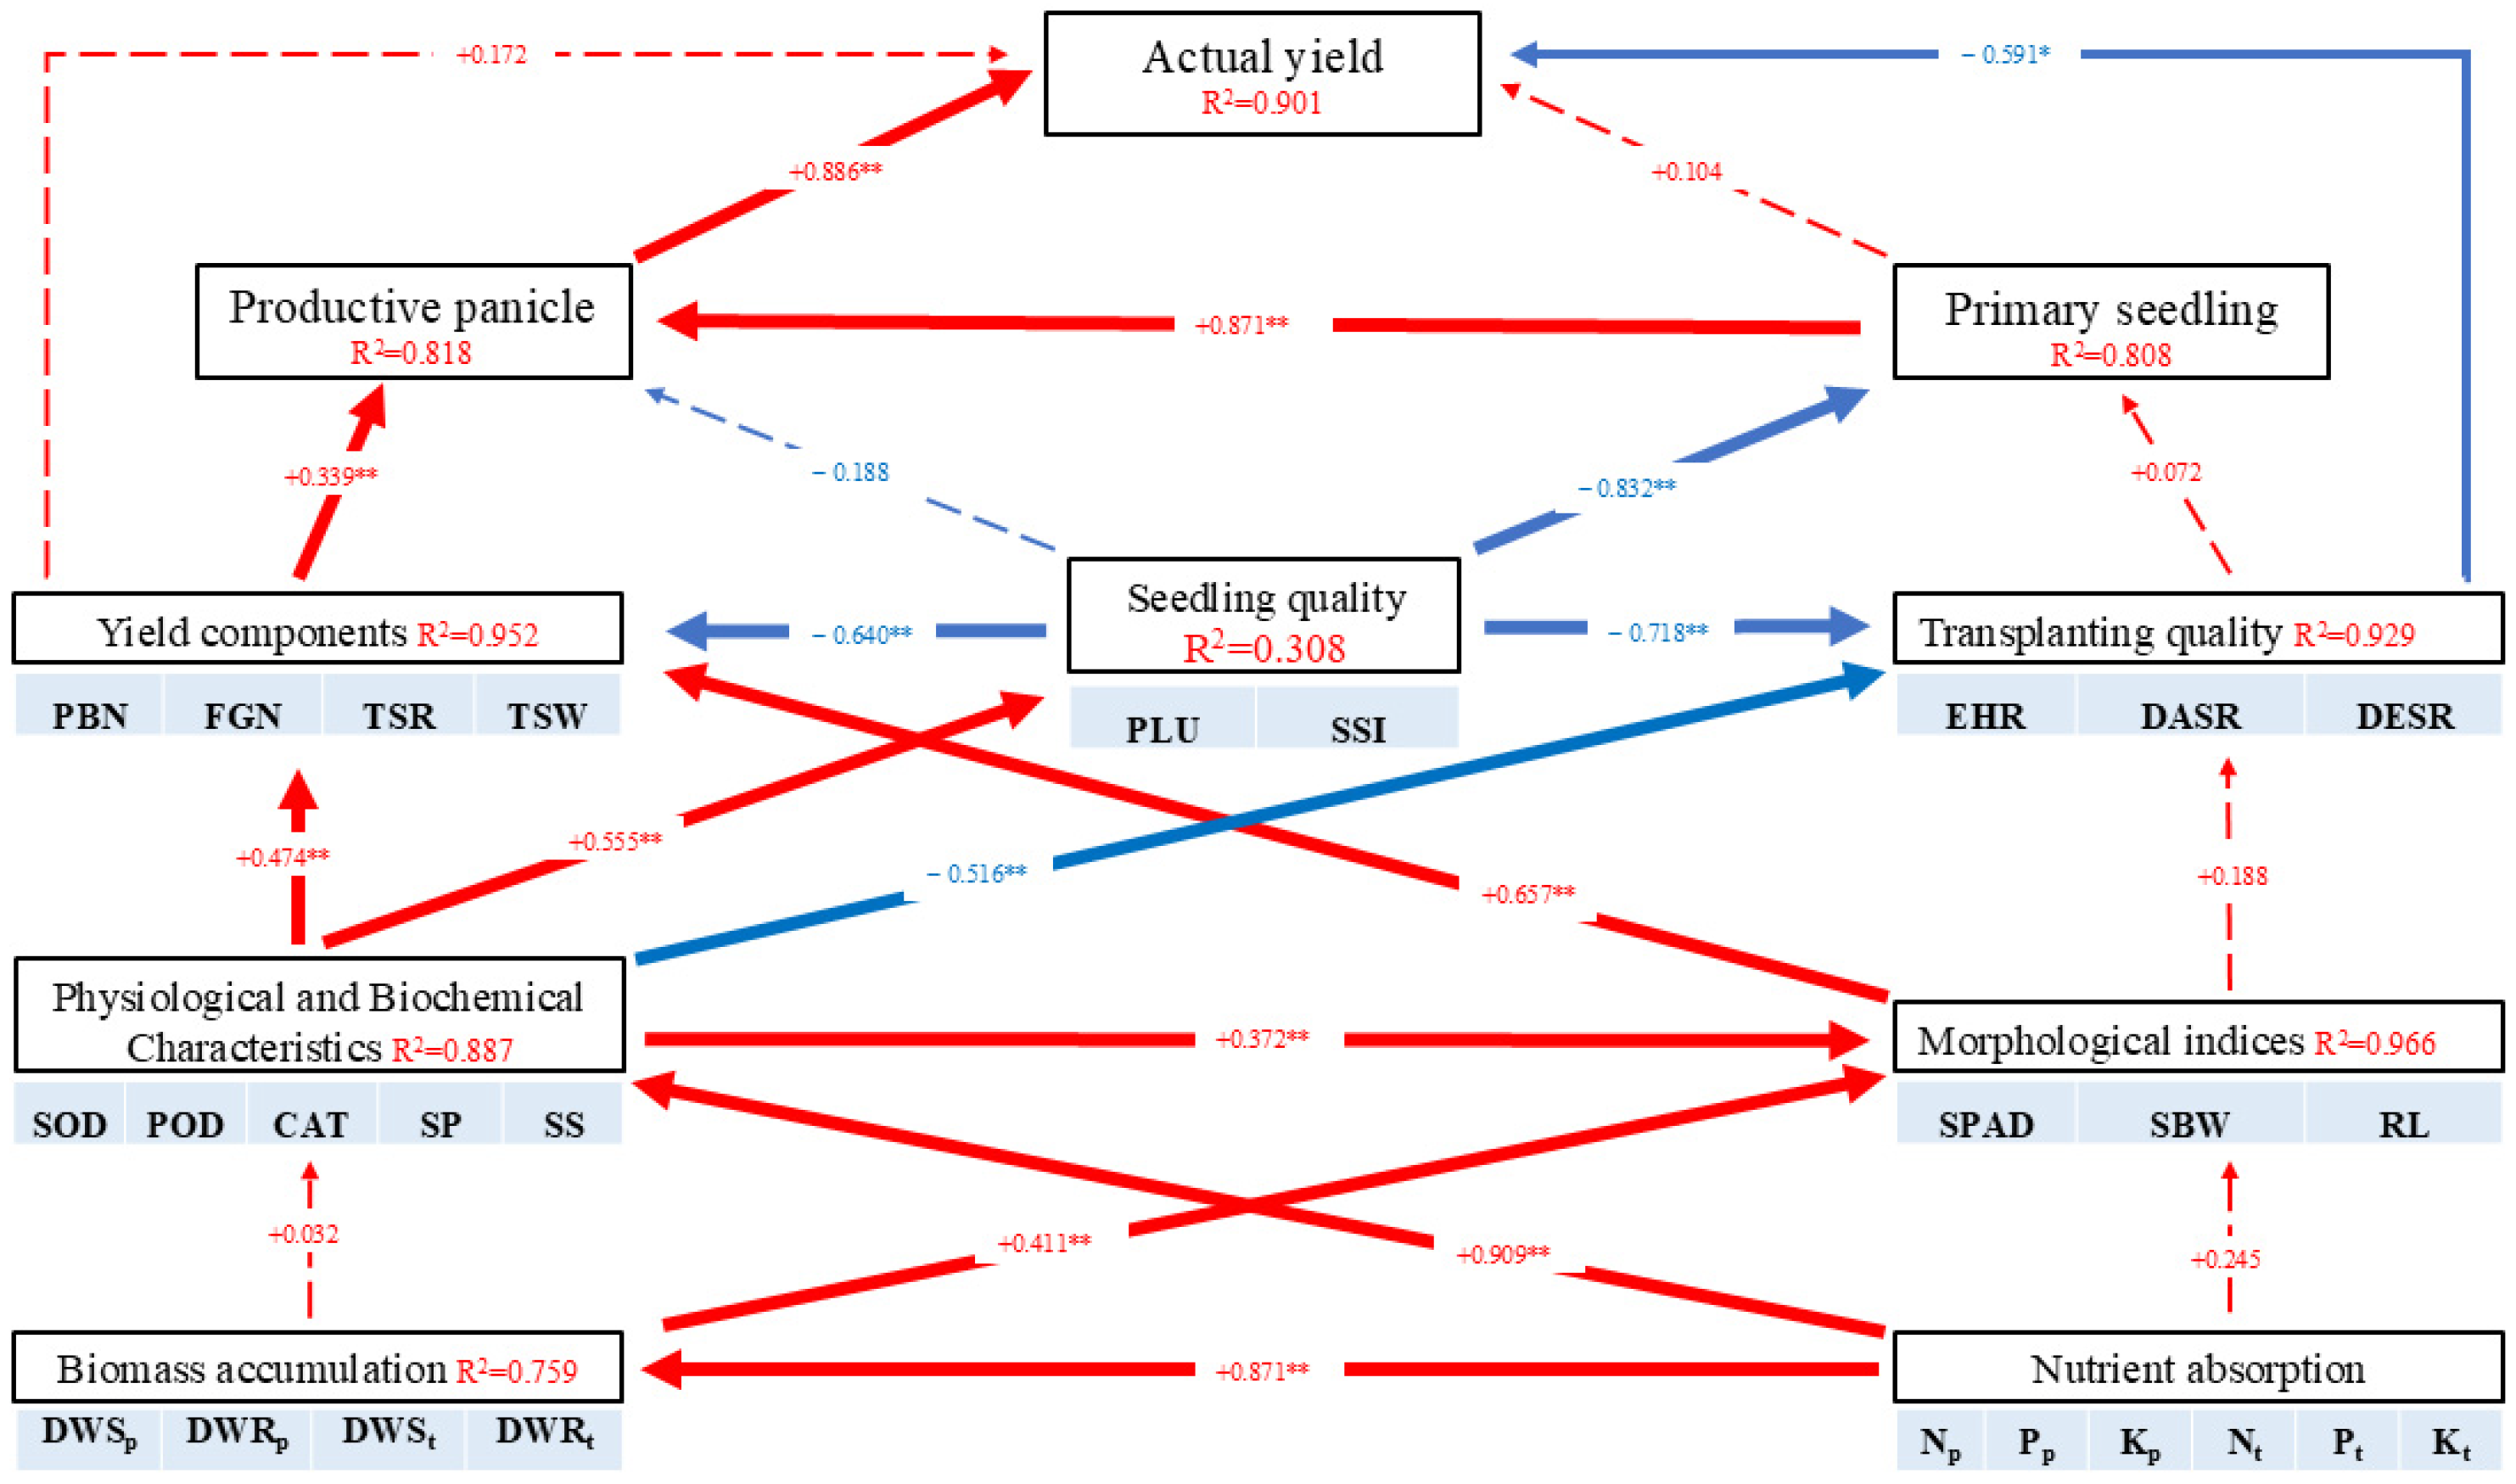
3.9. Correlation between Precision Drill Sowing Rate and Rice Yield, Transplanting Quality and Physiological and Ecological Indicators

Structural equation models (SEMs) were used to calculate the path coefficients between rice yield, transplanting quality and physiological and ecological indicators (Figure 5). The actual yield was significantly influenced by the productive panicle (path coefficient 0.886). The productive panicle was significantly influenced by yield components (path coefficient 0.339) and primary seedling (path coefficient 0.871). The indirect effect of precision drill sowing rate on yield was mainly attributed to its significant impact on the seedlings’ physiological and biochemical characteristics. Seedling quality had a direct negative effect on yield components (path coefficient −0.640), primary seedling (path coefficient −0.832) and transplanting quality (path coefficient −0.718). This indicates that pursuing the individual strength of seedlings alone is not conducive to yield formation, and a balance between the quantity and quality of seedlings should be sought. The physiological and biochemical characteristics had direct negative effects on transplanting quality, with path coefficients of −0.516 (p < 0.01). The physiological and biochemical characteristics significantly affected the morphological indices, with a path coefficient of 0.372 (p < 0.01). The physiological and biochemical characteristics were significantly influenced by nutrient absorption, with a path coefficient of 0.909 (p < 0.01). Biomass accumulation was significantly influenced by nutrient absorption, with a path coefficient of 0.871 (p < 0.01).

4. Discussion

Integrating precision drill sowing and machine transplanting at a suitable seeding rate improves agronomic technology and optimizes agricultural machinery designs, thus ensuring the seedling quality and quantity required for machine transplanting and individual rice robustness. In addition, the procedure provides the required seedling morphology for good machine transplanting performance, as well as both theoretical and technical support for high-quality, accurate and minimally destructive rice seedling production processes.
High-quality mechanical transplanting is the result of the integration of agricultural machinery and agronomy. Agricultural technology mainly focuses on rice yield, ignoring the adaptability of agricultural machinery, while agricultural machinery involves different planting modes [27,28,29]. The mechanical transplanting of rice seedlings should not only strictly conform to the operational quality standards of rice transplanters but also be conducive to the formation of high rice yields and quality. Therefore, rice seedling quality has a very substantial impact on the quality of mechanical transplanting and rice yield [30,31]. In this study, we optimized the sowing method, upgraded from traditional broadcasting to precision drill sowing, with seeds lined in the seedling tray, created ventilation and light transmission channels and opened the closed space of the seedbed. Traditional broadcast seedling cultivation involves more than 100 g (4000 seeds, Liaojing 401 with a thousand-seed weight of 25 g in this study); however, this value can be reduced by 5% through precision drilling, improving the seedling and transplanting quality.
At present, the machine transplanting method used in rice production damages seedling roots, stems and leaves or even causes seedling death during transplanting, resulting in temporary stagnation of growth and development, affecting rice growth and yield [26,32]. Precision sowing technology at a low sowing rate ensures fewer seedlings, so that strong seedlings are cultivated for transplanting and forming seedling root carpets, which are conducive to hybrid rice yield production.

4.1. Changes in Physiological and Morphological Characteristics of Seedlings at Different Precision Drill Sowing Rates

The keys to improving seedling transplanting technology are using a low precision drill sowing seeding rate, ensuring seeding uniformity and accurate vertical seedling delivery of carpet-seedling transplanting, and deeply integrating agricultural machinery and agronomy [33]. Although an increase in the seeding rate can increase the root entwining force, seedling uniformity is poor, the proportion of weak seedlings increases, the quality of seedlings decreases significantly and dry matter accumulation decreases [34]. In this study, with an increasing seeding rate, the stem base width, root length, plumpness and seedling strength index decreased (Table 1 and Figure 4). However, individual growth at a low seeding rate was vigorous, and tray material accumulation was minimal, resulting in high individual seedling quality and a low number of tray seedlings. The D1 treatment reduced seedling uniformity in the tray due to the prominent growth of individual seeds, indicating that the extremely reduced sowing rate was not suitable for producing a whole tray of seedlings of high quality. Generally, the root shoot ratio and rice seedling strength index need to be improved [35], and in this study, the number of productive rice panicles in D3 increased by 6.80% compared to CK, thus significantly increasing the rice yield by 7.86% (Table 6). These results indicate that an adequate sowing rate is fundamental for establishing robust primary seedlings and achieving an optimal number of productive panicles in machine transplanting, which ultimately contributes to yield formation. In addition, in this study, although individual material accumulation and element absorption were the highest at the low sowing rate, those of the whole tray were the lowest (Table 2 and Figure 3). The material accumulation and seedling quality in the D3 treatment were relatively high, and the comprehensive transplanting quality was good, providing seedlings that produced productive panicles for yield formation. With the decrease in sowing rate, individual seedlings have greater nutrient supply and growth space. Precision drill sowing provides orderly strip space for the growth of seedling populations, further promoting the growth and development of individual seedlings. Reducing the seeding rate and adopting precision drill sowing improved the seedling morphological index; thus, the morphological characteristics needed for high-quality seedlings to be used in machine transplanting were obtained.
SOD is the key enzyme for scavenging active oxygen free radicals in plants [36]. CAT is the enzyme for scavenging H2O2 and other active oxygen free radicals in plants [37]. POD participates in the decomposition of peroxides in plants and can catalyze H2O2 to oxidize other substrates [38]. Rice can maintain free radicals in plants at normal levels through the combined action of the above three enzymes [36,37,38]. MDA is one of the main products and indicators of membrane lipid peroxidation. The soluble protein and total sugar contents of seedlings can improve their material accumulation, forming strong seedlings and providing a good foundation for later rice growth and development [10]. In this study, D1–D4 treatments increased the contents of SOD, CAT, POD, soluble sugar and soluble protein and decreased the contents of MDA (Table 3), which indicates that reducing the seeding rates can provide a more suitable growth environment for individual seedlings, and drilling in rows provides good ventilation and light transmission at the seedling stage, reduces the competition between seedlings and supports excellent physiological and biochemical characteristics for individual growth. Precision drill sowing and an optimized sowing rate can improve the growth environment at the seedling stage, improve the individual physiological and biochemical characteristics of seedlings, and provide a physiological basis for the overall improvement of seedling quality.
Therefore, the appropriate seeding rate should be at the upper limit of the maximum seeding rate for each seedling tray to ensure good seedling quality in different environments, and the seeding rate should also be at the lower limit of the point at which the physiological characteristics of individual seedlings begin to decline, to maintain the balance between rice individuals and the population in a tray. To determine appropriate seeding amounts for obtaining quality seedlings, it is also important to determine how the rice seedling quality affects transplanting success and yield amounts.

4.2. Changes in Transplanting Quantity and Rice Yield at Different Precision Drill Sowing Rates

Rice seedling quality plays a very important role in transplanting performance and yield formation. Poor-quality rice seedlings are not conducive to regeneration after mechanical transplanting, with the number of effective panicles at maturity and yield decreasing [9,36]. The ideal tray seedling conditions need to ensure seedling uniformity and a strong root entwining force. When pulling out seedlings from a tray, the seedlings form a carpet that does not easily loosen. During production, to ensure a sufficient number of primary seedlings, machine-transplanted early rice should aim for early tillering and more tillers to obtain more productive panicles to achieve high yields [4,39]. Using mechanized cultivation and transplanting technology for rice carpet seedlings with a low seeding rate and large pot area, which has a large space for seedling growth in separate pots. This approach can cultivate an upper root system that forms the carpet and a lower root system that penetrates the pots, thus providing the conditions necessary for cultivating seedlings suitable for planting with long seedling stages [40]. Machine-transplanted, large-pot carpet seedlings have minimal damage and a short seedling growth period, decreasing the pressure from rotation with a significant effect on yield increase [15].
In this study, compared with traditional broadcast sowing (CK), precision drill sowing (D1–D4) can provide a “strip seedling” mode between pot seedlings and carpet seedlings, which can reduce the plant injury caused when seedlings are picked up longitudinally by machine transplanting, thus decreasing the rates of damaged and dead seedlings (Table 4). With the decrease in the seeding rate, the number of seedlings obtained during machine transplanting decreased, resulting in a decrease in the number of primary seedlings needing to be transplanted. Although the quality of individual seedlings was high, it was difficult to compensate for the difference in productive panicles and biomass at maturity, resulting in a decrease in yield (Table 5 and Table 6). Thus, precision drill sowing seedling cultivation improves the quality of seedlings and ensures that the number of seedlings in whole trays is optimized, appropriately reducing the sowing rate to provide high-quality seedlings in ideal quantities for field machine planting.
During machine planting, the rice population is affected by the empty hill rate and the number of machine-transplanted seedlings. The empty hill rate caused by mechanical transplanting is high when seeding occurs at a low broadcast sowing rate, and the population growth at the seedling stage is uneven. The seeding rate was too low (D1), individual growth was too high, and some individual seedlings were highly prominent, resulting in uneven differences in the seedling tray; thus, a seeding rate that was too low was not conducive to the growth of the whole tray of seedlings. However, seeding at high seeding rates does not meet the quality requirements for machine-transplanted seedlings, and the productive panicle rate is low, which is not conducive to biomass accumulation of growth stage and yield [20,41]. Empty hills are one of the important factors restricting the yield of machine-transplanted rice populations. Although individual seedlings grow well at low seeding rates, the empty hill rate is high, seedling root carpet formation is very poor, and the biomass accumulation during the growth stage is low; thus, low sowing rates cannot be used for large-scale applications [41]. In this study, the average empty hill rate in D1 was 3.25%, which was significantly higher than that for the other sowing rates, resulting in the lowest number of primary seedlings and biomass accumulation of growth stage (Table 5), ultimately affecting the number of productive panicles (Table 4 and Table 6) at maturity; thus, this rate cannot be used in production (Table 4). Wang et al. [20] reached a similar conclusion through a study of precision drill seeding with a low seeding rate and determined that precision drill seeding could reduce the rate of missing seedlings by 11.7% at most. Both the D4 and CK resulted in a high number of damaged and dead seedlings, which affected survival and delayed seedling recovery in the regeneration period, resulting in a loss in the primary seedling number advantage and a reduction in the number of grains per panicle at maturity, which reduced the yield.
At the 3600~3800 seeds/tray sowing rate, precision drill transplants improved the primary seedling number transplanted by reducing the empty hill rate and the numbers of damaged and dead seedlings, thereby improving rice yield and thus rice quality and yield. This rate not only maintains acceptable plant health and integrity but also provides a good balance between the whole tray population and individuals when transplanting.

4.3. Compatibility of Agricultural Machinery and Agronomy with Sowing Method and Sowing Rate

In this study, precision drill sowing enabled the carpet seedlings to be accurately selected and cut by a separate planting mechanism (Figure 2 and Table 4). A seeding row distance of 14 mm is the same as that of a machine conducting vertical picking (14 mm); thus, this distance matches the existing rules for cutting and picking seedlings by a transplanter seedling needle, reduces damage from vertically picking seedlings, improves field transplanting performance and provides a seedling basis for rice yield production. During production, 196,100 hills per hectare are required when using 30 cm and 17 cm row distances based on a machine-transplanted seedling area that is 14 mm long and wide. Theoretically, transplanting four seedlings per hill is satisfactory [8,16]. According to the data on factors that affect transplant quality, such as empty hills, damaged seedlings and dead seedlings, a minimum increase of 10% in the seeding amount can meet the requirements of high-quality, machine-transplanted seedlings; that is, the 3800 seeds/tray treatment (the D3 treatment) should be used. As an upgrade product of the existing sowing pipeline, precision drill sowing upgraded the traditional broadcast roller to a horizontal strip roller, reducing the seeding rate. In this study, D1, D2 and D3 reduced seeding rates by 15%, 10% and 5%, respectively, compared with CK, saving the seed input cost. According to the service cycle and work efficiency of the precision drill sowing roller, the cost of precision drill increases the original production cost by 1–2% for single tray (data provided by Xinmin JiuJing Agricultural Machinery R & D, China Shenyang). In this study, seedling quality and field transplanting quality were improved through precision drill sowing. Compared with CK distribution, the D3 treatment increased the yield by 477.47 kg/ha and 531.91 kg/ha, achieving the goal of increasing yield and improving the input–output ratio of rice production in terms of economic benefits.
In this study, which was restricted by the regional rice planting habits, only the main varieties in the market with a 1000-grain weight of 25 g were selected, which had certain limitations on the selection of sowing quantity for other varieties with different grain weights. Therefore, further research on optimizing precision drill seeding under different grain weight conditions is needed to improve the quality of machine-transplanted seedlings and rice yield.

5. Conclusions

Precision drill sowing seedling cultivation can optimize the quality of rice seedlings, improve the physiological and biochemical characteristics of rice seedlings, facilitate the growth of individual seedlings and meet the requirements for machine-transplanted seedlings. Among the sowing rates, the 3800 seed/tray precision drill sowing rate facilitated individual seedling growth and the formation of a seedling tray population that was more suitable for machine transplanting and performed well in terms of field transplanting. The balance point between seedling quantity and quality before and after transplanting that is conducive to the formation of rice yield was determined.

Author Contributions

L.D., conceived and designed the experiments, performed the experiments, analyzed the data, wrote the first and final draft; R.L. performed the experiments and analyzed the data; L.M., analyzed the data; T.Y., analyzed the data and authored or reviewed drafts of the paper; Y.F. analyzed the data and authored or reviewed drafts of the paper; Y.L. conceived and designed the experiments, contributed reagents/materials/analysis tools, reviewed the first drafts, confirmed the final manuscript and decided on paper submission. All authors have read and agreed to the published version of the manuscript.

Funding

This work was supported by the National Key R&D Program of China (2017YFD0300700), and the Youth Fund of the President of Liaoning Academy of Agricultural Sciences (2022QN2302).

Institutional Review Board Statement

Not applicable.

Data Availability Statement

The data presented in this study are available upon reasonable request to the corresponding author.

Conflicts of Interest

The authors declare that there are no competing interests.

References

  1. Hao, S.; Liu, X.; Liu, C.; Liu, W. Nitrogen Loss and Migration in Rice Fields under Different Water and Fertilizer Modes. Plants 2024, 13, 562. [Google Scholar] [CrossRef] [PubMed]
  2. Zhu, D.Z.; Chen, H.Z.; Xiang, J.H.; Zhang, Y.P.; Zhang, Y.K. Innovation and Practice of High-Yield Rice Cultivation Technology in China. Sci. Agric. Sin. 2015, 48, 3404–3414. [Google Scholar]
  3. Zhang, J.; Lin, Y.; Huang, J.; Bai, Z.; Sajid, H.; Zhu, L.; Cao, X.; JIN, Q. Effects of substrate types and uniconazole on mechanized transplanting qualities and grain yield for late rice with different seedling ages. Trans. Chin. Soc. Agric. Eng. Trans. CSAE 2018, 34, 44–52. [Google Scholar]
  4. Lv, W.; Zeng, Y.; Shi, Q.; Pan, X.; Huang, S.; Shang, Q.; Tan, X.; Li, M.; Hu, S. Tillering and Panicle Formation Characteristics of Machine-transplanted Early Rice and Its Parameters of Basic Population Formulae. Acta Agron. Sin. 2016, 42, 427–438. [Google Scholar]
  5. Huang, M.; Chen, J.; Cao, F.; Zou, Y. Increased hill density can compensate for yield loss from reduced nitrogen input in machine-transplanted double-cropped rice. Field Crops Res. 2018, 221, 333–338. [Google Scholar] [CrossRef]
  6. Samonte, S.O.P.B.; Wilson, L.T.; Tabien, R.E. Maximum node production rate and main culm node number contributions to yield and yield-related traits in rice. Field Crops Res. 2006, 96, 313–319. [Google Scholar] [CrossRef]
  7. Huang, M.; Shan, S.; Xie, X.; Cao, F.; Zou, Y. Why high grain yield can be achieved in single seedling machine-transplanted hybrid rice under dense planting conditions? J. Integr. Agric. 2018, 17, 1299–1306. [Google Scholar] [CrossRef]
  8. Li, R.; Dong, L.; Shang, W.; Ma, L.; Wang, X.; Wang, Z.; Li, Y. Effects of Seedling-raising Substrate and Water Spraying Interval on Seedling Quality and Grain Yield of Mechanically Transplanted Rice. Chin. J. Rice Sci. 2021, 35, 59–68. [Google Scholar]
  9. Yu, L.; Ding, Y.; Xue, Y.; Ling, Q.; Yuan, Z. Factors affacting rice seedling quality of mechanical transplanting rice. Trans. Chin. Soc. Agric. Eng. Trans. CSAE 2006, 22, 73–78. [Google Scholar]
  10. Liao, S.; Tan, X.; Li, M.; Hu, K.; Pan, X.; Shi, Q. Effects of Brassinolide on Physiological Characteristics and Growth of Straw Substrate-cultured Rice Seedlings After Transplanting. Chin. J. Rice Sci. 2020, 34, 181–190. [Google Scholar]
  11. Hiroyuki, S.; Kitagawa, H.; Kensuke, O.; Kazuyasu, N.; Mitsunori, S.; Akio, O.; Morio, M.; Satoko, Y. Development of rice “seed-mats” consisting of hardened seeds with a cover of soil for the rice transplantor. Plant Prod. Sci. 2008, 11, 108–115. [Google Scholar]
  12. Shan, S.; Jiang, P.; Fang, S.; Cao, F.; Zhang, H.; Chen, J.; Yin, X.; Tao, Z.; Lei, T.; Huang, M. Printed sowing improves grain yield with reduced seed rate in machine-transplanted hybrid rice. Field Crops Res. 2020, 245, 107676. [Google Scholar] [CrossRef]
  13. Lampayan, R.M.; Faronilo, J.E.; Tuong, T.P.; Espiritu, A.J.; de Dios, J.L.; Bayot, R.S.; Bueno, C.S.; Hosen, Y. Effects of seedbed management and delayed transplanting of rice seedlings on crop performance, grain yield, and water productivity. Field Crops Res. 2015, 183, 303–314. [Google Scholar] [CrossRef]
  14. Jang, Y.; Sharavdorj, K.; Ahn, Y.; Cho, J. Effects of Planting Density and Nitrogen Fertilization on the Growth of Forage Rice in Reclaimed and General Paddy Fields. Plants 2023, 13, 13. [Google Scholar] [CrossRef]
  15. Jia, X.; Song, J.; Wang, J.; Cao, X.; Liu, C.; Wan, L.; Zheng, H.; Xu, Z. Effects of seedling age and substrate soil ratio on the population quality and yield of late rice of machine-transplanted large-pot carpet seedlings. Trans. Chin. Soc. Agric. Eng. Trans. CSAE 2022, 38, 1–11. [Google Scholar]
  16. Zhang, Q.; Xiang, K.; Sun, Y.; Wu, Y.; Guo, C.; Tang, Y.; Liu, F.; Ma, J. Effects of seeding amount and transplanting machines on rice yield and population quality under different seedling raising methods. J. Nucl. Agric. Sci. 2020, 34, 2595–2606. [Google Scholar]
  17. Du, Y.; Miao, X.; Li, G.; Zhang, J.; Wang, S.; Liu, Z.; Tang, S.; Ding, Y. Common Characteristics of Balanced Yield Increase in a Large Area of Mechanical Transplanted Rice in Jiangsu Province. Acta Agron. Sin. 2014, 40, 2183–2191. [Google Scholar] [CrossRef]
  18. Luo, H.; Li, J.; Yuan, Z.; He, R.; Ma, Z.; Zhang, L. Coupling relationships of nursing seedling densities and finger sticking area by mechanized hybrid rice transplanter. Trans. Chin. Soc. Agric. Eng. Trans. CSAE 2009, 25, 98–102. [Google Scholar]
  19. Li, Z.; Ma, X.; Xie, J.; Chen, G.; Zheng, Z.; Tan, Y.; Huang, Y. Experiment on precision seedling raising and mechanized transplanting of hybrid rice under low sowing rate in double cropping area. Trans. Chin. Soc. Agric. Eng. Trans. CSAE 2014, 30, 17–27. [Google Scholar]
  20. Wang, Y.; Zhu, D.; Chen, R.; Fang, W.; Wang, J.; Xiang, J.; Chen, H.; Zhang, Y.; Chen, J. Beneficial Effects of Precision Drill Sowing with Low Seeding Rates in Machine Transplanting for Hybrid Rice to Improve Population Uniformity and Yield. Sci. Agric. Sin. 2022, 55, 666–679. [Google Scholar]
  21. Dong, L.; Gao, H.; Li, Y.; Li, R.; Shang, W.; Yao, J.; Ma, L.; Sui, G. Effects of Row and Hill Spacing on Rice Canopy Structure and Yield. J. Shenyang Agric. Univ. 2021, 52, 265–271. [Google Scholar]
  22. Zhang, C.; Yu, X.; Yang, L.; Lin, H.; Xin, S. Determination of nitrogen release from coated urea in soils using bured fertilizer packet and its application. Environ. Chem. 2017, 36, 2055–2061. [Google Scholar]
  23. Li, H. Principles and Techniques of Plant Physiological and Biochemical Experiments; Higher Education Press: Beijing, China, 2000; pp. 167–169. [Google Scholar]
  24. Zhao, S. Plant Physiology Experiment Guide; China Agricultural Science and Technology Press: Beijing, China, 2004; pp. 26–34. [Google Scholar]
  25. Li, L. Plant Physiology Module Experiment Guide; Science Press: Beijing, China, 2009; pp. 95–97. [Google Scholar]
  26. Li, Y.; Wang, H.; LÜ, T.; Zhang, S.; Jiang, M.; He, Q.; Sun, Y.; Ma, J. Effects of Mechanically-transplanted Modes and Density on Photosynthetic Production and Yield in Hybrid Rice at Different Seedling-ages. Chin. J. Rice Sci. 2017, 31, 265–277. [Google Scholar]
  27. Li, Z.; Ma, X.; Li, H.; Guo, L.; Liu, C.; Fu, R.; Yang, M.; Liang, Z. Yield components and characteristics of hybrid rice with different mechanical transplanting methods under low sowing rate. J. South China Agric. Univ. 2020, 41, 22–29. [Google Scholar]
  28. Yang, H.; Chen, G.; Li, Z.; Li, W.; Zhang, Y.; Li, C.; Hu, M.; He, X.; Zhang, Q.; Zhu, C. Responses of Yield and Photosynthetic Characteristics of Rice to Climate Resources under Different Crop Rotation Patterns and Planting Methods. Plants 2024, 13, 526. [Google Scholar] [CrossRef]
  29. Yu, G.; Wang, L.; Sun, L.; Zhao, X.; Ye, B. Advancement of Mechanized Transplanting Technology and Equipments for Field Crops. Trans. Chin. Soc. Agric. Mach. 2022, 53, 1–20. [Google Scholar]
  30. Lv, W.; Huang, G.; Shao, Z.; Zeng, Y.; Shi, Q.; Pan, X.; Wei, S. Straw substrate with decomposition agent improving seedling quality and yield of machine-transplanted rice. Trans. Chin. Soc. Agric. Eng. Trans. CSAE 2017, 33, 195–202. [Google Scholar]
  31. Song, Y.; Zhang, H.; Dai, Q.; Huo, Z.; Xu, K.; Wei, H.; Zhu, C.; Sun, Z.; Yang, D.; Wang, W. Seedling quality regulation of rice potted-seedling in mechanical transplanting. Trans. Chin. Soc. Agric. Eng. Trans. CSAE. 2013, 29, 11–22. [Google Scholar]
  32. Li, Y.; Wang, H.; Yan, F.; Li, N.; Sun, Y.; Dai, Z.; Xie, H.; Ma, J. Effects of Root-cutting Treatment on Growth and Physiological Characteristics of Hybrid Rice at Different Seedling-ages. Chin. J. Rice Sci. 2016, 30, 626–636. [Google Scholar]
  33. Li, Z.; Ma, X.; Li, X.; Chen, L.; Li, H.; Yuan, Z. Research progress of rice transplanting mechanization. Trans. Chin. Soc. Agric. Mach. 2018, 49, 1–20. [Google Scholar]
  34. Teng, F.; Chen, H.; Zhu, D.; Cai, X.; Xiang, J.; Xu, Y.; Zhang, Z. Effects of Sowing Rates on Seedling Root Entwining and Seedling Quality of Machine-Transplanted Rice. Acta Agric. Univ. Jiangxiensis. 2015, 37, 398–403. [Google Scholar]
  35. An, Z.; Guan, H.; Zhu, Y.; Chai, R.; Gao, H.; Hua, S.; Wang, Y. Effects of combined application of humic acid with seedling raising substrate on seedling quality and rice yield. Soil Fertil. Sci. China 2022, 55, 173–181. [Google Scholar]
  36. Lin, Y.; Zhang, J.; Hu, J.; Zhu, L.; Cao, X.; Yu, S.; Jin, Q. Effects of different seedling substrates on physiological characters and grain yield of mechanized-transplanted rice. Trans. Chin. Soc. Agric. Eng. Trans. CSAE 2016, 32, 18–26. [Google Scholar]
  37. Zhu, C.; Xu, Q.; Cao, X.; Zhu, L.; Kong, Y.; Jin, Q.; Zhang, J. Effects of Substrates with Different Properties on Chilling Tolerance of Early Rice Seedlings. Chin. J. Rice Sci. 2021, 35, 503–512. [Google Scholar]
  38. Luo, M.; Liu, Y.; Li, J.; Gao, T.; Wu, S.; Wu, L.; Lai, X.; Xu, H.; Hu, H.; Ma, Y. Effects of Straw Returning and New Fertilizer Substitution on Rice Growth, Yield, and Soil Properties in the Chaohu Lake Region of China. Plants 2024, 13, 444. [Google Scholar] [CrossRef]
  39. Vishwakarma, C.; Krishna, G.K.; Kapoor, R.T.; Mathur, K.; Dalal, M.; Singh, N.K.; Mohapatra, T.; Chinnusamy, V. Physiological Analysis of Source–Sink Relationship in Rice Genotypes with Contrasting Grain Yields. Plants 2023, 13, 62. [Google Scholar] [CrossRef] [PubMed]
  40. Wang, J.; Zeng, Y.; Yi, Y.; Zhang, Q.; Hu, Q.; Tan, X.; Huang, S.; Shang, Q.; Zeng, Y.; Shi, Q. The uniformity of mechanical-transplanted early-season rice under different seedling rates and its effects on the formation of grain yield. Crops 2018, 34, 141–147. [Google Scholar]
  41. Wang, Y.; Zhu, D.; Xiang, J.; Chen, H.; Zhang, Y.; Xu, Y.; Zhang, Y. Characteristics of seedling raising and mechanized transplanting of hybrid rice with a low seeding rate by precise seeding method. Chin. J. Rice Sci. 2020, 34, 332–338. [Google Scholar]
Figure 1. Meteorological data for the rice growth period at the experimental site.
Agriculture 14 01745 g001
Figure 2. Sowing and transplanting diagram.
Agriculture 14 01745 g002
Figure 3. Effects of precision drill sowing rate on rice seedling biomass accumulation. Note: a one-way analysis of variance (ANOVA), followed by a least-significant-difference (LSD) multiple range test, was performed to evaluate the statistical differences among the treatments per each parameter measured. Values followed by different letters within a column for the same year are significantly different at 5% probability levels.
Agriculture 14 01745 g003
Figure 4. Effects of precision drill sowing rate on rice seedling quality. Note: a one-way analysis of variance (ANOVA), followed by a least-significant-difference (LSD) multiple range test, was performed to evaluate the statistical differences among the treatments per each parameter measured. Values followed by different letters within a column for the same year are significantly different at 5% probability levels.
Agriculture 14 01745 g004
Figure 5. Interrelatedness map showing the potential mechanisms of precision drill sowing to improve rice yield by regulating physiological and ecological indicators. A red arrow with a “+” indicates a positive effect; a blue arrow with a “−” indicates a negative impact. The solid line denotes that the impact is statistically significant, and the thicker the line, the greater the impact. The dotted line indicates that the impact is not statistically significant. * = significant at p < 0.05; ** = significant at p < 0.01.
Agriculture 14 01745 g005
Table 1. Effects of precision drill sowing rate on the morphological indices of rice seedlings.
TreatmentLeaf AgeSPADPlant Height (cm)Stem Base Width (mm)Root NumberRoot Length (cm)
2020D13.42 ± 0.08 a35.32 ± 0.86 a12.26 ± 0.30 d2.33 ± 0.06 a10.26 ± 0.22 a11.23 ± 0.27 a
D23.44 ± 0.10 a34.87 ± 1.06 a12.39 ± 0.38 d2.33 ± 0.07 a10.26 ± 0.27 a10.88 ± 0.33 b
D33.41 ± 0.15 a33.67 ± 1.48 b13.01 ± 0.57 c2.31 ± 0.10 a10.16 ± 0.39 a10.46 ± 0.46 c
D43.43 ± 0.16 a33.23 ± 1.51 bc13.76 ± 0.63 b2.27 ± 0.10 b10.19 ± 0.41 a9.88 ± 0.45 d
CK3.42 ± 0.12 a33.06 ± 1.12 c14.15 ± 0.48 a2.23 ± 0.08 c10.13 ± 0.30 a8.60 ± 0.29 e
CV/%0.29782.66775.66021.69060.52319.0361
2021D13.46 ± 0.08 a35.95 ± 0.88 a12.43 ± 0.30 d2.35 ± 0.06 a10.31 ± 0.25 a11.85 ± 0.29 a
D23.44 ± 0.10 a35.78 ± 1.08 a12.58 ± 0.38 d2.34 ± 0.07 a10.32 ± 0.31 a11.57 ± 0.35 b
D33.47 ± 0.15 a34.70 ± 1.52 b13.50 ± 0.59 c2.33 ± 0.1 ab10.32 ± 0.45 a11.02 ± 0.48 c
D43.48 ± 0.16 a33.58 ± 1.53 c13.88 ± 0.63 b2.30 ± 0.10 b10.30 ± 0.47 a10.48 ± 0.48 d
CK3.47 ± 0.12 a33.77 ± 1.14 c14.84 ± 0.50 a2.26 ± 0.08 c10.25 ± 0.35 a10.29 ± 0.35 d
CV/%0.41042.83736.58631.41520.24175.4701
p ValueY0.00270.00010.00010.00960.0050.0001
T0.88810.00010.00010.00050.29080.0001
Y × T0.40150.25620.00440.85480.78070.0001
Note: Data in the table are means ± standard deviation, with three replicates. A one-way analysis of variance (ANOVA), followed by a least-significant-difference (LSD) multiple range test, was performed to evaluate the statistical differences among the treatments per each parameter measured. Different letters indicate significant differences at the p < 0.05 probability level within a column for a year. A two-way ANOVA was used to test the effects of treatment, year and their interactions. CV indicates the coefficient of variation, Y indicates the year, T indicates treatment, Y × T indicates the interaction between year and treatment.
Table 2. Effects of precision drill sowing rate on rice seedling nutrient absorption.
TreatmentN (mg/100 plant)P (mg/100 plant)K (mg/100 plant)N (g/tray)P (g/tray)K (g/tray)
2020D1125.08 ± 3.05 a60.14 ± 1.47 a176.97 ± 4.32 a4.25 ± 0.10 c2.04 ± 0.05 a6.02 ± 0.15 a
D2123.23 ± 3.73 b57.44 ± 1.74 b168.92 ± 5.11 b4.44 ± 0.13 b2.07 ± 0.06 a6.08 ± 0.18 a
D3119.89 ± 5.26 c54.54 ± 2.39 c160.38 ± 7.04 c4.56 ± 0.2 a2.07 ± 0.09 a6.09 ± 0.27 a
D4112.89 ± 5.13 d51.41 ± 2.34 d152.62 ± 6.93 d4.52 ± 0.21 a2.06 ± 0.09 a6.10 ± 0.28 a
CK107.38 ± 3.64 e49.11 ± 1.66 e145.00 ± 4.91 e4.3 ± 0.15 c1.96 ± 0.07 b5.80 ± 0.20 b
CV/%5.63847.30697.06962.69761.94531.8974
2021D1127.78 ± 3.12 a63.85 ± 1.56 a187.45 ± 4.57 a4.34 ± 0.11 c2.17 ± 0.05 c6.37 ± 0.16 b
D2124.99 ± 3.78 b60.79 ± 1.84 b182.13 ± 5.51 b4.50 ± 0.14 b2.19 ± 0.07 c6.56 ± 0.20 a
D3124.02 ± 5.44 b59.35 ± 2.60 c174.60 ± 7.66 c4.71 ± 0.21 a2.26 ± 0.10 b6.63 ± 0.29 a
D4116.67 ± 5.30 c57.38 ± 2.61 d163.45 ± 7.42 d4.67 ± 0.21 a2.30 ± 0.10 a6.54 ± 0.30 a
CK112.82 ± 3.82 d54.95 ± 1.86 e156.98 ± 5.32 e4.51 ± 0.15 b2.20 ± 0.07 c6.28 ± 0.21 b
CV/%4.62095.10486.56512.88022.08072.0108
p ValueY0.00010.00010.00010.00010.00010.0001
T0.00010.00010.00010.00010.00010.0001
Y × T0.03420.00040.09070.0440.00010.1103
Note: Data in the table are means ± standard deviation, with three replicates. A one-way analysis of variance (ANOVA) followed by least significant difference (LSD) multiple range test was performed to evaluate the statistical differences among the treatments per each parameter measured. Different letters indicate significant differences at p < 0.05 probability level within a column in a year. A two-way ANOVA was used to test the effects of treatment, year and their interactions. CV indicates coefficient of variation, Y indicates the year, T indicates the treatment, Y × T indicates the interaction between year and treatment.
Table 3. Effects of precision drill sowing rate on physiological and biochemical characteristics of rice seedlings.
TreatmentSOD (U/g)POD (U/g)CAT (U g/min)MDA (nmol/g)Soluble Protein (μg/g)Soluble Sugar (mg/g)
2020D1342.35 ± 8.35 a9.86 ± 0.24 a43.23 ± 1.05 a0.44 ± 0.01 d1.32 ± 0.03 a17.21 ± 0.42 a
D2332.35 ± 10.06 b9.06 ± 0.27 b43.33 ± 1.31 a0.45 ± 0.01 c1.31 ± 0.04 a16.24 ± 0.49 b
D3323.35 ± 14.19 c8.66 ± 0.38 c42.34 ± 1.86 b0.46 ± 0.02 c1.26 ± 0.06 b15.77 ± 0.69 c
D4321.40 ± 14.60 cd7.95 ± 0.36 d41.24 ± 1.87 c0.47 ± 0.02 b1.21 ± 0.06 c15.57 ± 0.71 c
CK314.46 ± 10.65 d6.26 ± 0.21 e41.25 ± 1.4 c0.51 ± 0.02 a1.20 ± 0.04 c15.24 ± 0.52 d
CV/%2.954214.592.15624.99483.92134.2797
2021D1319.74 ± 7.80 a9.08 ± 0.22 a42.11 ± 1.03 b0.47 ± 0.01 c1.35 ± 0.03 a17.05 ± 0.42 a
D2317.07 ± 9.60 ab8.85 ± 0.27 b42.95 ± 1.3 a0.47 ± 0.01 c1.35 ± 0.04 a16.66 ± 0.5 b
D3310.48 ± 13.62 b8.81 ± 0.39 b42.79 ± 1.88 a0.49 ± 0.02 b1.34 ± 0.06 a16.25 ± 0.71 c
D4302.15 ± 13.72 c8.55 ± 0.39 c42.07 ± 1.91 b0.49 ± 0.02 b1.24 ± 0.06 b16.01 ± 0.73 d
CK290.35 ± 9.84 d7.57 ± 0.26 d40.32 ± 1.37 c0.54 ± 0.02 a1.20 ± 0.04 c15.87 ± 0.54 d
CV/%3.47226.14752.21585.17494.99432.6334
p ValueY0.00010.00010.09030.00010.00010.0001
T0.00010.00010.00010.00010.00010.0001
Y × T0.00570.00010.00040.08380.00010.0003
Note: Data in the table are means ± standard deviation, with three replicates. A one-way analysis of variance (ANOVA), followed by least significant difference (LSD) multiple range test was performed to evaluate the statistical differences among the treatments per each parameter measured. Different letters indicate significant difference at p < 0.05 probability level within a column in a year. A two-way ANOVA was used to test the effects of treatment, year and their interactions. CV indicates coefficient of variation, Y indicates the year, T indicates the treatment, Y × T indicates the interaction between year and treatment.
Table 4. Effects of precision drill sowing rate on transplanting quality of rice seedlings.
TreatmentPrimary Seedlings (/m2)Empty Hill Rate (%)Damaged Seedling Rate (%)Floating Seedling Rate (%)Dead Seedling Rate (%)
2020D180.33 ± 1.96 d3.01 ± 0.08 a3.39 ± 0.08 e1.60 ± 0.04 b0.01 ± 0.00 e
D284.67 ± 2.56 c1.72 ± 0.06 b3.88 ± 0.12 d1.62 ± 0.05 a0.10 ± 0.00 d
D387.36 ± 3.83 b1.69 ± 0.07 c4.21 ± 0.18 c1.62 ± 0.07 a0.19 ± 0.01 c
D492.26 ± 4.19 a1.32 ± 0.06 d5.56 ± 0.25 b1.63 ± 0.07 a0.33 ± 0.01 b
CK92.76 ± 3.14 a1.27 ± 0.04 e6.79 ± 0.23 a1.64 ± 0.06 a0.46 ± 0.02 a
CV/%5.356435.030726.06250.966972.4759
2021D181.55 ± 1.99 d3.09 ± 0.08 a3.10 ± 0.08 e1.59 ± 0.04 c0.13 ± 0.00 e
D286.91 ± 2.63 c1.74 ± 0.06 b3.37 ± 0.1 d1.60 ± 0.05 bc0.20 ± 0.01 d
D389.99 ± 3.95 b1.71 ± 0.08 c4.03 ± 0.18 c1.62 ± 0.07 ab0.21 ± 0.01 c
D494.35 ± 4.29 a1.30 ± 0.06 d5.04 ± 0.23 b1.63 ± 0.07 a0.30 ± 0.01 b
CK94.45 ± 3.20 a1.28 ± 0.04 e6.87 ± 0.23 a1.64 ± 0.06 a0.50 ± 0.02 a
CV/%5.43336.217330.52661.164847.1532
p ValueY0.00010.00010.00010.08490.0001
T0.00010.00010.00010.00010.0001
Y × T0.68850.00030.00010.73880.0001
Note: Data in the table are means ± standard deviation, with three replicates. A one-way analysis of variance (ANOVA), followed by a least-significant-difference (LSD) multiple range test, was performed to evaluate the statistical differences among the treatments per each parameter measured. Different letters indicate significant differences at the p < 0.05 probability level within a column for a year. A two-way ANOVA was used to test the effects of treatment, year and their interactions. CV indicates coefficient of variation, Y indicates year, T indicates treatment, Y × T indicates the interaction between year and treatment.
Table 5. Effects of precision drill sowing rate on stem and root biomass of rice seedlings.
Biomass of Stem (t/ha)Biomass of Root (t/ha)
YearTreatmentsJointingHeadingMaturityJointingHeading
2020D16.76 ± 0.15 d11.65 ± 0.26 c19.46 ± 0.49 b1.23 ± 0.04 c1.50 ± 0.05 cd
D26.94 ± 0.21 b12.02 ± 0.38 ab20.20 ± 0.62 a1.28 ± 0.02 ab1.53 ± 0.04 b
D37.08 ± 0.29 a12.16 ± 0.26 a20.35 ± 0.89 a1.30 ± 0.04 a1.56 ± 0.06 a
D46.87 ± 0.30 bc11.83 ± 0.41 bc20.05 ± 0.64 a1.25 ± 0.06 bc1.52 ± 0.05 bc
CK6.77 ± 0.20 cd11.67 ± 0.20 c19.56 ± 0.64 b1.24 ± 0.03 c1.50 ± 0.04 d
CV/%1.70231.68211.75041.94851.5794
2021D16.72 ± 0.15 cd11.46 ± 0.28 c19.33 ± 0.39 c1.23 ± 0.02 c1.48 ± 0.03 c
D26.91 ± 0.19 b11.83 ± 0.46 ab20.00 ± 0.81 b1.27 ± 0.02 b1.53 ± 0.04 b
D37.05 ± 0.33 a12.06 ± 0.63 a20.45 ± 0.63 a1.31 ± 0.07 a1.57 ± 0.04 a
D46.82 ± 0.3 bc11.67 ± 0.51 bc20.16 ± 0.48 ab1.24 ± 0.05 bc1.53 ± 0.04 b
CK6.70 ± 0.21 d11.63 ± 0.20 bc19.35 ± 0.50 c1.23 ± 0.04 c1.50 ± 0.03 c
CV/%1.89241.71782.25752.56042.0055
p ValueY0.07340.05590.31050.75790.8638
T0.00000.00050.00000.00010.0000
Y × T0.96770.95390.31160.78820.5712
Note: Data in the table are means ± standard deviation, with three replicates. A one-way analysis of variance (ANOVA), followed by a least-significant-difference (LSD) multiple range test, was performed to evaluate the statistical differences among the treatments per each parameter measured. Different letters indicate significant differences at p < 0.05 probability level within a column for a year. A two-way ANOVA was used to test the effects of treatment, year and their interactions. CV indicates coefficient of variation, Y indicates year, T indicates treatment, Y × T indicates the interaction between year and treatment.
Table 6. Effects of precision drill sowing rate on grain yield and yield components of rice seedlings.
TreatmentPPNPBNFSNSSRTSWAY
2020D1342.50 ± 8.35 d11.23 ± 0.27 ab123.29 ± 3.01 a89.65 ± 2.19 a24.56 ± 0.60 a10,306.58 ± 251.37 c
D2353.33 ± 10.69 c11.34 ± 0.34 ab124.65 ± 3.77 a88.69 ± 2.68 a24.35 ± 0.74 ab10,592.84 ± 320.61 b
D3365.56 ± 16.04 b11.26 ± 0.49 ab123.93 ± 5.44 a88.59 ± 3.89 a24.27 ± 1.06 ab10,776.54 ± 472.84 a
D4372.47 ± 16.92 a11.42 ± 0.52 a121.25 ± 5.51 b88.45 ± 4.02 a24.13 ± 1.10 b10,472.88 ± 475.71 b
CK370.09 ± 12.54 ab11.21 ± 0.38 b119.59 ± 4.05 b88.35 ± 2.99 a24.10 ± 0.82 b10,299.07 ± 348.93 c
CV/%3.11560.67211.52340.53520.69481.6657
2021D1344.90 ± 8.41 b11.48 ± 0.28 ab121.28 ± 2.96 ab90.58 ± 2.21 a25.02 ± 0.61 a10,241.23 ± 249.78 c
D2358.35 ± 10.85 a11.39 ± 0.34 b121.69 ± 3.68 a89.95 ± 2.72 a24.99 ± 0.76 a10,524.96 ± 318.56 b
D3362.85 ± 15.92 a11.62 ± 0.51 a119.82 ± 5.26 bc89.64 ± 3.93 ab24.98 ± 1.10 a10,730.79 ± 470.83 a
D4362.93 ± 16.49 a11.61 ± 0.53 a118.36 ± 5.38 cd88.40 ± 4.02 bc24.92 ± 1.13 a10,424.24 ± 473.50 b
CK357.86 ± 12.12 a11.60 ± 0.40 a117.64 ± 3.99 d88.22 ± 2.99 c24.90 ± 0.84 a10,198.88 ± 345.53 c
CV/%1.83780.79491.32921.02670.18221.8621
p ValueY0.01130.00010.00010.03590.00010.0684
T0.00010.07450.00010.0030.15340.0001
Y×T0.00090.05140.37040.35720.60820.9868
Note: Data in the table are means ± standard deviation, with three replicates. A one-way analysis of variance (ANOVA), followed by a least-significant-difference (LSD) multiple range test, was performed to evaluate the statistical differences among the treatments per each parameter measured. Different letters indicate significant differences at the p < 0.05 probability level within a column for a year. A two-way ANOVA was used to test the effects of treatment, year and their interactions. CV indicates coefficient of variation, Y indicates year, T indicates treatment, Y × T indicates the interaction between year and treatment. PPN indicates the productive panicle number; PBN indicates the primary number of branches; FSN represents the number of full seeds per panicle; SSR indicates the seed setting rate; TSW indicates the thousand-seed weight; AY indicates the actual yield.
Disclaimer/Publisher’s Note: The statements, opinions and data contained in all publications are solely those of the individual author(s) and contributor(s) and not of MDPI and/or the editor(s). MDPI and/or the editor(s) disclaim responsibility for any injury to people or property resulting from any ideas, methods, instructions or products referred to in the content.

