Article

Festuca ovina L. As a Monitor Plant Species of Traffic Air Along the Highway in of the City of Warsaw (Poland)

by
Agata Jędrzejuk
1,*,
Filip Chyliński
2 and
Beata Fornal-Pieniak
1
1
Institute of Horticultural Sciences, Department of Environmental Protection and Dendrology, Warsaw University of Life Sciences, Nowoursynowska 159, 02-787 Warsaw, Poland
2
Instytut Techniki Budowlanej, Filtrowa Street 1, 00-611 Warsaw, Poland
*
Author to whom correspondence should be addressed.
Agriculture 2024, 14(10), 1750; https://doi.org/10.3390/agriculture14101750
Submission received: 26 July 2024 / Revised: 20 September 2024 / Accepted: 26 September 2024 / Published: 4 October 2024
(This article belongs to the Section Ecosystem, Environment and Climate Change in Agriculture)

Abstract

:
In the urban environment dust particles form a major part of air pollutants and can affect the physiological functions of the plant. Plants proved to be very powerful tools in as-sessing environmental pollution because of their wide distribution. Festuca ovina is a durable plant with specific habitat requirements, but there is no data on physiological response on traffic pollution. The purpose of the study was to measure impact of traffic pollution for Festuca ovina plant to different distance from the source of pollution (highway) basing on physiological markers and microscopical ob-servations. 3 hypoteses were formulated concerning the effect of distance from the source of pollution to the reaction of plants; difference of physiological reaction of leaves and roots to stress conditions; roots as a better indicator of urban pollutions. Current results suggest that Festuca ovina could serve as an effective plant marker for monitoring traffic pollution. The combination of high flavonoid production and reduced free proline concentration in leaves were observed and may suggests the potential tolerance of this plant species to traffic highway pollution. Ammonia content may be a good indicator or ROS accumulation in leaves and roots of plants according to the distance of the pollution source.

1. Introduction

The urban environment comprises natural, semi-natural, and synanthropic vegetation, along with inanimate components, such as soil, water, and air. Urbanisation modifies these elements to varying degrees, inducing negative alterations such as decreased water retention, soil and air pollution, and temperature increases ranging from 3 to 10 °C compared to non-urban regions [1,2].
Urban environmental pollution primarily originates from road traffic, greenhouse gas emissions associated with heating systems within our climate zone, and industrial activities. Reports from the WHO [3] emphasize that prolonged exposure to air pollution reduces life expectancy [3]. Tong et al., also conducted research in this field [4].
Urbanisation leads to reduced vegetation productivity, shortened vegetation periods, and synanthropisation [5]. Automobile-based pollutants usually deposit on leaves, blocking the stomata and affecting transpiration. These depositions obstruct CO2 absorption, which causes a decrease in photosynthesis, as well as affects the growth of plants and their productivity. It is reported that gaseous pollutants are absorbed by leaves, while the particulate ones are absorbed on the outer surfaces of the plants and are not that injurious. Dust from automobiles evolves from exhaust, as well as due to vehicular movement on roads. Air quality has gained prominence in global environmental discussions, with the WHO establishing ambient air quality standards (AAQS) as a universally recognised benchmark. Addressing air pollution holds promise not only for human health but also for reducing the global disease burden. WHO estimates suggest that approximately two million deaths, primarily in developing nations, are linked to indoor air pollution, with an additional 1.3 million attributed to outdoor air pollution. Atmospheric pollutants are deposited on canopy surfaces, both horizontally and vertically [6,7,8]. Particulate matter is eliminated from ambient air through sedimentation, impaction, and precipitation mechanisms [9,10,11]. Morphological studies of dust particles on leaf surfaces have identified individual smaller particles, hygroscopic particle agglomerates, and smaller particles that adhere to larger particles [12]. The elemental composition of this dust varies with particulate size, exhibiting higher concentrations of heavy metals such as Zn, Cr, Pb, Cu, Ni, and Co in finer fractions of particulate matter [13]. While soot constitutes the primary component of these dust particles, trace amounts of heavy metals, such as Pb, Zn, Ni, V, Cd, Ti, As, and Cu, have also been identified [12,14].
Dust particles form a major part of air pollutants arising due to industrial processes and a pose serious threat to the ecosystem. Aerosols, being small enough to be suspended in air, have an affinity for adhering to the solid surfaces they come into contact with it. After deposition, dust particles have a tendency to stick to the leaf surfaces. In a study conducted by [15] it was revealed that both mineralogy and particle size are very important factors that control the biochemical reactions within the plants. It has been demonstrated that at even very low concentrations, fine dust particles are capable of causing effects where, as in case of coarse particles, higher doses are required. As the chemical nature of the particulates is diverse, a series of synergistic reactions may occur among these particles which, in turn, can affect the physiological functions of the plant in a number of ways.
Numerous studies have explored the plant characteristics that aid in capturing airborne dust particulates. Leaf surface roughness, epidermal cell arrangement, and trichome density were correlated with the dust removal capacity of plants. These morphological attributes contribute to increased dust accumulation in the leaves, enhancing the dust-filtering capabilities of plant species [8]. Plants prove to be very powerful tools in assessing environmental pollution because of their wide distribution [16,17]. Those growing near roadsides may show poor growth and reduced photosynthetic rates, and suffer from the accelerated degradation of epicuticular waxes [18]. Rapid reactions to adverse environmental conditions may range from invisible physiological biochemical processes, to visible morphological symptoms of injury. Biochemical biomarkers may be very specific for one or a group of pollutants or a general indication of an environmental stress [19,20,21]. The main marker of environmental stress on the plant body is free proline content, a universal osmolytic element essential for primary metabolism. Proline accumulation in a plant is a response to several stresses and may have a role in plant defense reactions [22]. Proline acts as a free radical scavenger to protect plants away from oxidative stress effects [23]. Proline is the main plant marker of environmental stress, but endogenous ammonia may also be a biomarker of such. During plant metabolism, ammonia (NH3) is a byproduct of several processes in plants, including amino acid deamination and photorespiration. Under normal conditions, ammonia is rapidly assimilated into amino acids via the glutamine synthetase/glutamate synthase (GS/GOGAT) pathway to avoid toxicity. Under several stress factors, such as drought, imbalanced temperature, salt, and heavy metals, the accumulation of ammonia in a plant body may increase. Environmental stresses can directly inhibit the activity of enzymes involved in ammonia assimilation, such as GS and GOGAT, increase protein degradation, releasing amino acids that are deaminated to produce ammonia, or the root function may be affected, resulting in the increase in nutrient uptake, leading to imbalances in nitrogen assimilation pathways [24,25,26,27].
Flavonoids, belonging to a wide group of secondary metabolites [28] have been reported to display a wide range of uses in plant–environment interactions [29,30,31]. In plants, the biosynthesis of flavonoids is upregulated, not only as a consequence of UV-radiation, but also in response to a wide range of other environmental stresses [32,33,34,35,36]. It has been postulated that flavonoids are synthesized to effectively counter stress-induced oxidative damage. Flavonoids may accomplish their antioxidant functions by both preventing the generation of ROS (through their ability to chelate transition metal ions such as Fe and Cu, [31,37,38,39], and scavenging ROS once formed [32,40,41,42,43].
Urban forests are deemed crucial green spaces, playing a pivotal role in maintaining city biodiversity and serving as phytoremediators, contributing to improved human well-being [44]. Few studies have focused on grass species in urban forests and their resilience to anthropogenic impacts. Herbaceous plants serve as robust monitor plants of air pollution that results from environmental change, as supported by studies, such as those from García-Romero et al. [45].
Festuca ovina L. (bent grass) is a typical grass in coniferous forests, represented by the Peucedano-Pinetum community in urban forests in Poland. Festuca ovina belongs to the Poaceae family and is a common species of perennial grass in Polish coniferous forests. Festuca ovina L. is a durable plant with specific habitat requirements because it prefers positions where few plants can cope. There is no literature data concerning the physiological response of bent grass on traffic air pollution and its potential utility as an accelerator tolerating urban pollutants.
The purpose of this study was to measure the impact of traffic pollution on the Festuca ovina plant for different distances from the source of pollution (highway), based on physiological markers and microscopical observations.
The research hypothesis was formulated as follows:
Hypothesis 1.
The distribution of the air traffic pollution was affected by the distance from the source of the pollution, but its effect is not equal with the physiological reaction of the studied plants.
Hypothesis 2.
The physiological response/reaction of the aboveground and underground parts of the plant to the stress conditions differs, which should be very important knowledge during formulating the directions for management green areas in the city.
Hypothesis 3.
The underground parts of plant (roots) could be a better indicator of stress conditions, which will be created by urban pollution.

2. Material and Methods
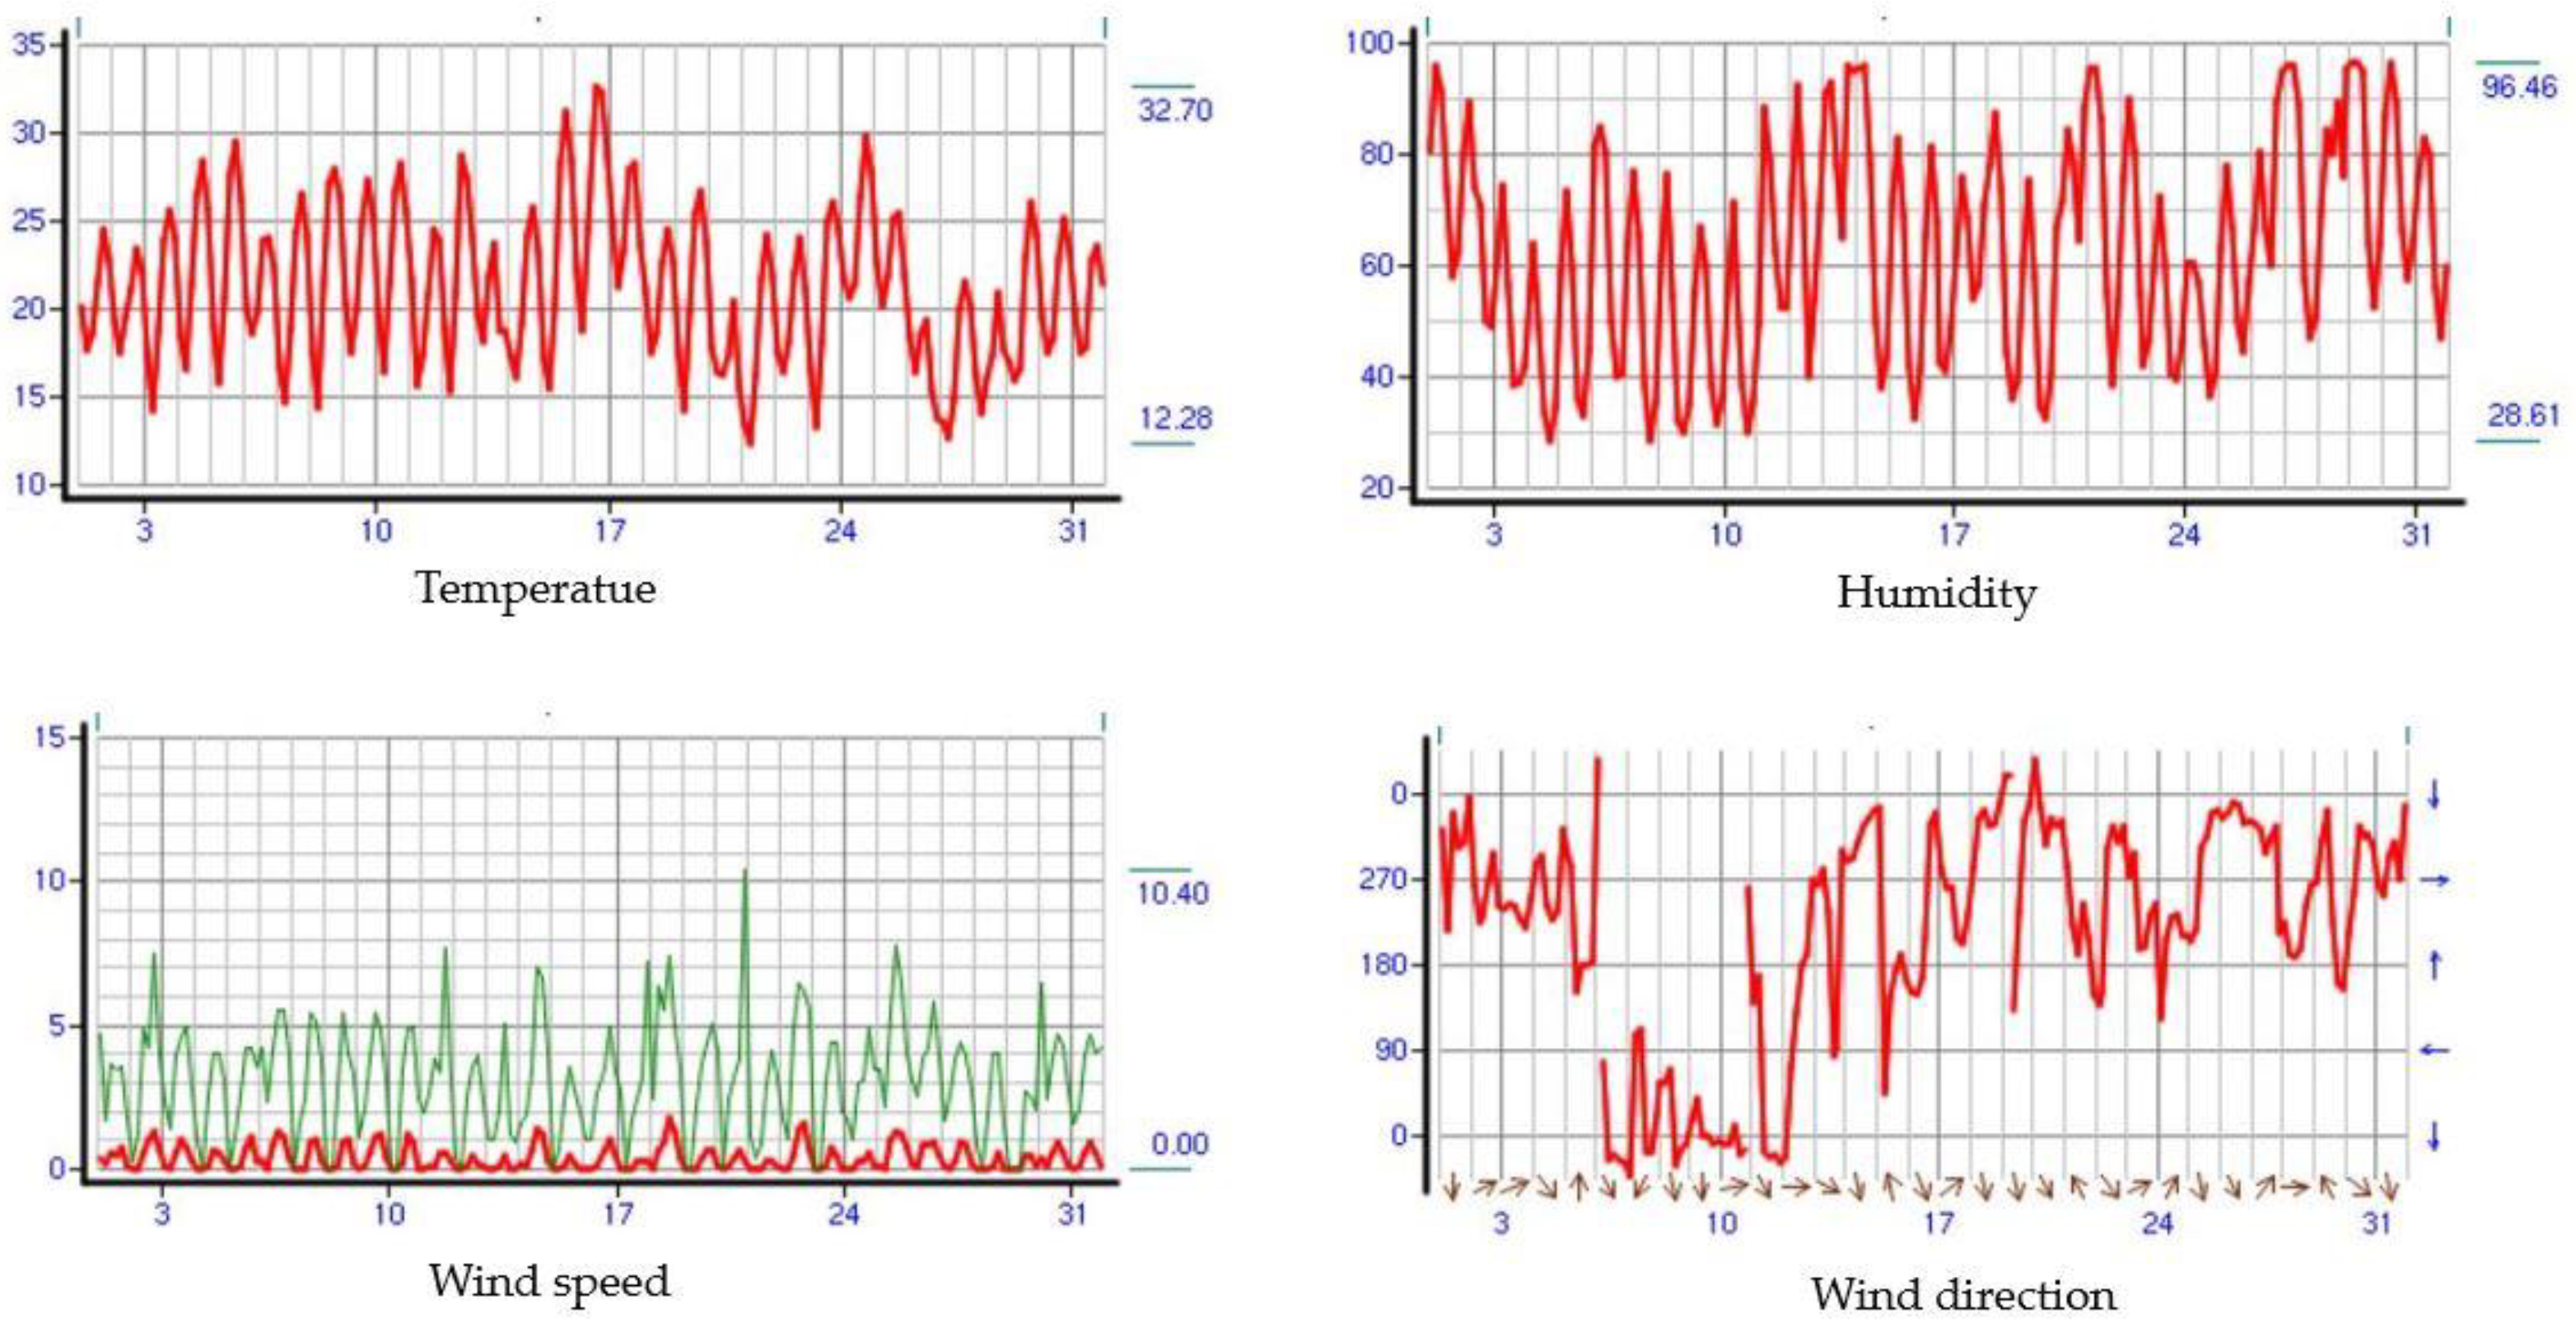
2.1. Study Area

Warsaw is the largest city in Poland, where urban forests are one of the most important elements of green infrastructure. The studies were conducted in 2023 in the summer (July) in Warsaw (Poland) and outside the city. The studied object was part of the Młociny Forest, which is a fresh coniferous forest (Peucedano-Pinetum) growing on poor, sandy soil.
The tree density was 75%, the shrub layer only 5%. The height of the tree stands were from 15 to 25 m on each studied plot. Festuca ovina was a dominated plant in the herb layer. The other plants in the herb layer were represented by Festuca rubra (only 5% plant cover) and mosses (10% plant cover). The percent cover of plants in each vegetation layers that were tree, shrub, and herb layers were determined according to the Braun–Blanquet method.
The Młociny Urban Forest is situated in the northern part of Warsaw (at 52°14′ N and 21°1′ E), crossed by a road (S7 highway), with double traffic lines (Figure 1).
Car traffic on the studied road is 64,997 cars/day (Public Road Authority (PRA). Interactive Map of the Apr Zdm Automatic Measurement System. Available online: https://zdm-warszawa.maps.arcgis.com (accessed on 1 July 2023)). The climate environment, comprising the temperature, moisture, wind speed, and direction from July 2023 are presented in Figure 2.

2.2. Plant Sample Collection and Biochemical Analyses

The samples of Festuca ovina L. were located near the source of the pollution (road) depending on the distance from the road: location 1–0 m (adjacent to the road), location 2–1 m, location 3–5 m, and location 4–10 m in the Młociny Forest (Figure 3). The control plot was located 50 m from the road in a fresh coniferous forest, which was located outside the city. The edge of the forest is located 1 m from the road. The samples of Fesuca ovina L. plants were collected during the growing season in July 2023 (Figure 4). Festuca ovina in Poland grows as a common grass on poor soils that, in municipal areas, is gladly replaced by ornamental perennials that mostly suffer from municipal pollution. The plant material utilized in our study is a common grass found throughout Central Poland, both in mixed forests and urban environments. Despite its robust growth in areas affected by pollution, it is actively managed and often removed by municipal services. We were able to collect these plants without requiring any special permissions. For the biochemical analyses, 9 plants from each location were collected and immediately frozen at −20 °C. For the analytical analyses, 0.5 g of leaves (upper part) and roots (below-ground part) were used (three trials per plant for each location). For the SEM observations, 9 whole leaves from each location were collected in a sterile urine pail and stored in darkness at RT. Directly before, observations of 0.5 cm long leaf pieces were taken and properly prepared for analyses.

2.3. Determination of Flavonoid Content

The flavonoid content was determined using the method described by Eom et al. [46]. Briefly, the plant material (0.5 g) was ground in 5 mL of 80% methanol. The resulting mixture was centrifuged at 20,000 rpm for 15 min. The supernatant was carefully transferred to a new tube. For the analysis, 500 µL of the extract was collected, and 100 µL of 10% aluminium chloride, and 100 µL of sodium acetate solution (1M) (PolAura, Morąg, Poland) were added. The volume was adjusted to 4.3 mL using 80% methanol. The prepared samples were thoroughly mixed and left to stand for 6 min. After this incubation period, 2 mL of 1 mmol/mL NaOH (PolAura, Morąg, Poland) solution was added and the mixture was diluted to 10 mL with distilled water. The mixture was then mixed again and left for an additional 15 min. Absorbance was measured at a wavelength of 510 nm nm by using a spectrophotometer AOELab UV 1600, Chung Hsing Rd., Chutung, Hsinchu, Taiwan.

2.4. Determination of Ammonia Content

Ammonia was quantified using the Berthelot reaction with the Weatherburn method, following the procedure outlined by [47]. Initially, the plant material (0.5 g) (leaves) was ground in 3 mL of 0.3 mmol H2SO4 (PolAura, Poland) (pH 3.5). The resulting homogenate was centrifuged for 10 min at 14,000 rpm using a Sigma 3K30 centrifuge (Sigma Aldrich, Darmstadt, Germany). The supernatant was carefully transferred to fresh tubes. For the analysis, 200 µL of the extract was diluted with 0.5 mM H2SO4 (PolAura, Poland) (3.8 mL). To initiate the colour reaction, 0.5 mL of reagent A (25 mg sodium nitroprusside and 5 g phenol in 100 mL—PolAura, Poland distilled water) and 0.5 mL of reagent B (2.5 g NaOH and 40 mL 50% NaOCl—PolAura, Poland in 100 mL distilled water) were added. The mixture was incubated in a Unipan 357 (DANLAB, Białystok, Poland) water bath for 20 min at 37 °C with 60 revolutions per minute. The absorbance was measured at 625 nm by using a spectrophotometer AOELab UV 1600, Chung Hsing Rd., Chutung, Hsinchu, Taiwan. Three replicates were used for each treatment combination. The ammonia content was determined using an extinction coefficient of 3.9982 µmol cm−1 per gram of dry weight (DW).

2.5. Determination of Free Proline Content

Free proline content was determined using the method described by Bates et al. [48]. 0.5 g of the sample was ground in 10 mL of 0.3% aqueous solution of sulfosalicylic acid (PolAura, Morąg, Poland). The samples were centrifuged for 20 min (20,000 rpm). The supernatant (2 mL of the supernatant) was taken for analysis and mixed with 2 mL of ninhydrin solution and 2 mL of ice-cold acetic acid (PolAura, Morąg, Poland). The samples were incubated for 1 h in a water bath Unipan 357 (DANLAB, Poland) (100 °C) and then cooled to room temperature. 4 mL of toluene was added to the mixture. The mixture was then shaken for 20 s to obtain two phases. Absorbance was measured at a wavelength of 520 nm. Toluene was used as a blank sample.

2.6. SEM Analyses

SEM Scanning electron microscopy (SEM) observations were performed using a Scanning Electron Microscope, model Sigma 500VP (Zeiss Microscopy, Oberkochen, Germany). Secondary electron (SE) and backscattered electron (BSE) images were obtained. Phase compositions were analysed using the Oxford Ultim Max 40 EDX detector (Oxford Instruments NanoAnalysis, High Wycombe, UK). SEM examinations of the Festuca leaves were carried out to identify the type of dust particles present on their surfaces and to discover their probable origin. In addition, a semi-quantitative analysis was performed to estimate the number of anthropogenic dust particles (ADP) adsorbed on their surface and the gradient of the concentration as a function of the distance from the road as a source of pollution. From the collected samples of bent grass leaves, three random samples from each analysed field were selected, and approximately 20 mm sections from the middle of each were cut. The cut sections were placed directly on a microscopic stage using graphite tape. An example of a sample prepared for microscopic examination is shown in Figure 5. Before SEM examination, the samples were cold evaporated. For semi-quantitative analysis, only the upper sides of leaves were exanimated for semi-quantitative analysis due to the low concentration of the dust particles on the underside of the leaves. Images of the leaf surface were automatically collected in the chosen region. The received images (approximately 100 for each type) were statistically analysed using the ZEN software (ver. 3.3.89.0000, Carl Zeiss Microscopy GmbH, 80 Bendemeer Rd, Singapore) to calculate the number of anthropogenic particles. Anthropogenic dust particles (ADP) were defined as those whose composition was composed of atoms with a higher molecular weight than silicon. The molecular mass was estimated using a backscattered electron (BSE) detector, which differentiates grains using different shades of grey. The determination of organic and inorganic particles was carried out by analysing their composition and the shape of their grains. The composition of the particles was determined using an EDX detector. Organic particles are mainly made of carbon and their shape is mostly amorphous. The composition of the inorganic particles varies a lot and contains heavier elements from aluminium to silicone. The shape of the inorganic particles also varies from the organic particles.

2.7. Statistical Analysis

The results were analysed using the statistical software, Statistica 2023. A one-way analysis of variance (ANOVA) was performed. The means were compared using the LSD test (ANOVA 1) and the Tukey–Kramer test (ANOVA 2), as appropriate.

2.8. Data Availability

The data sets used and/or analysed during the current study are available from the corresponding author on reasonable request.

3. Results

The samples of the leaves and roots were analysed separately.

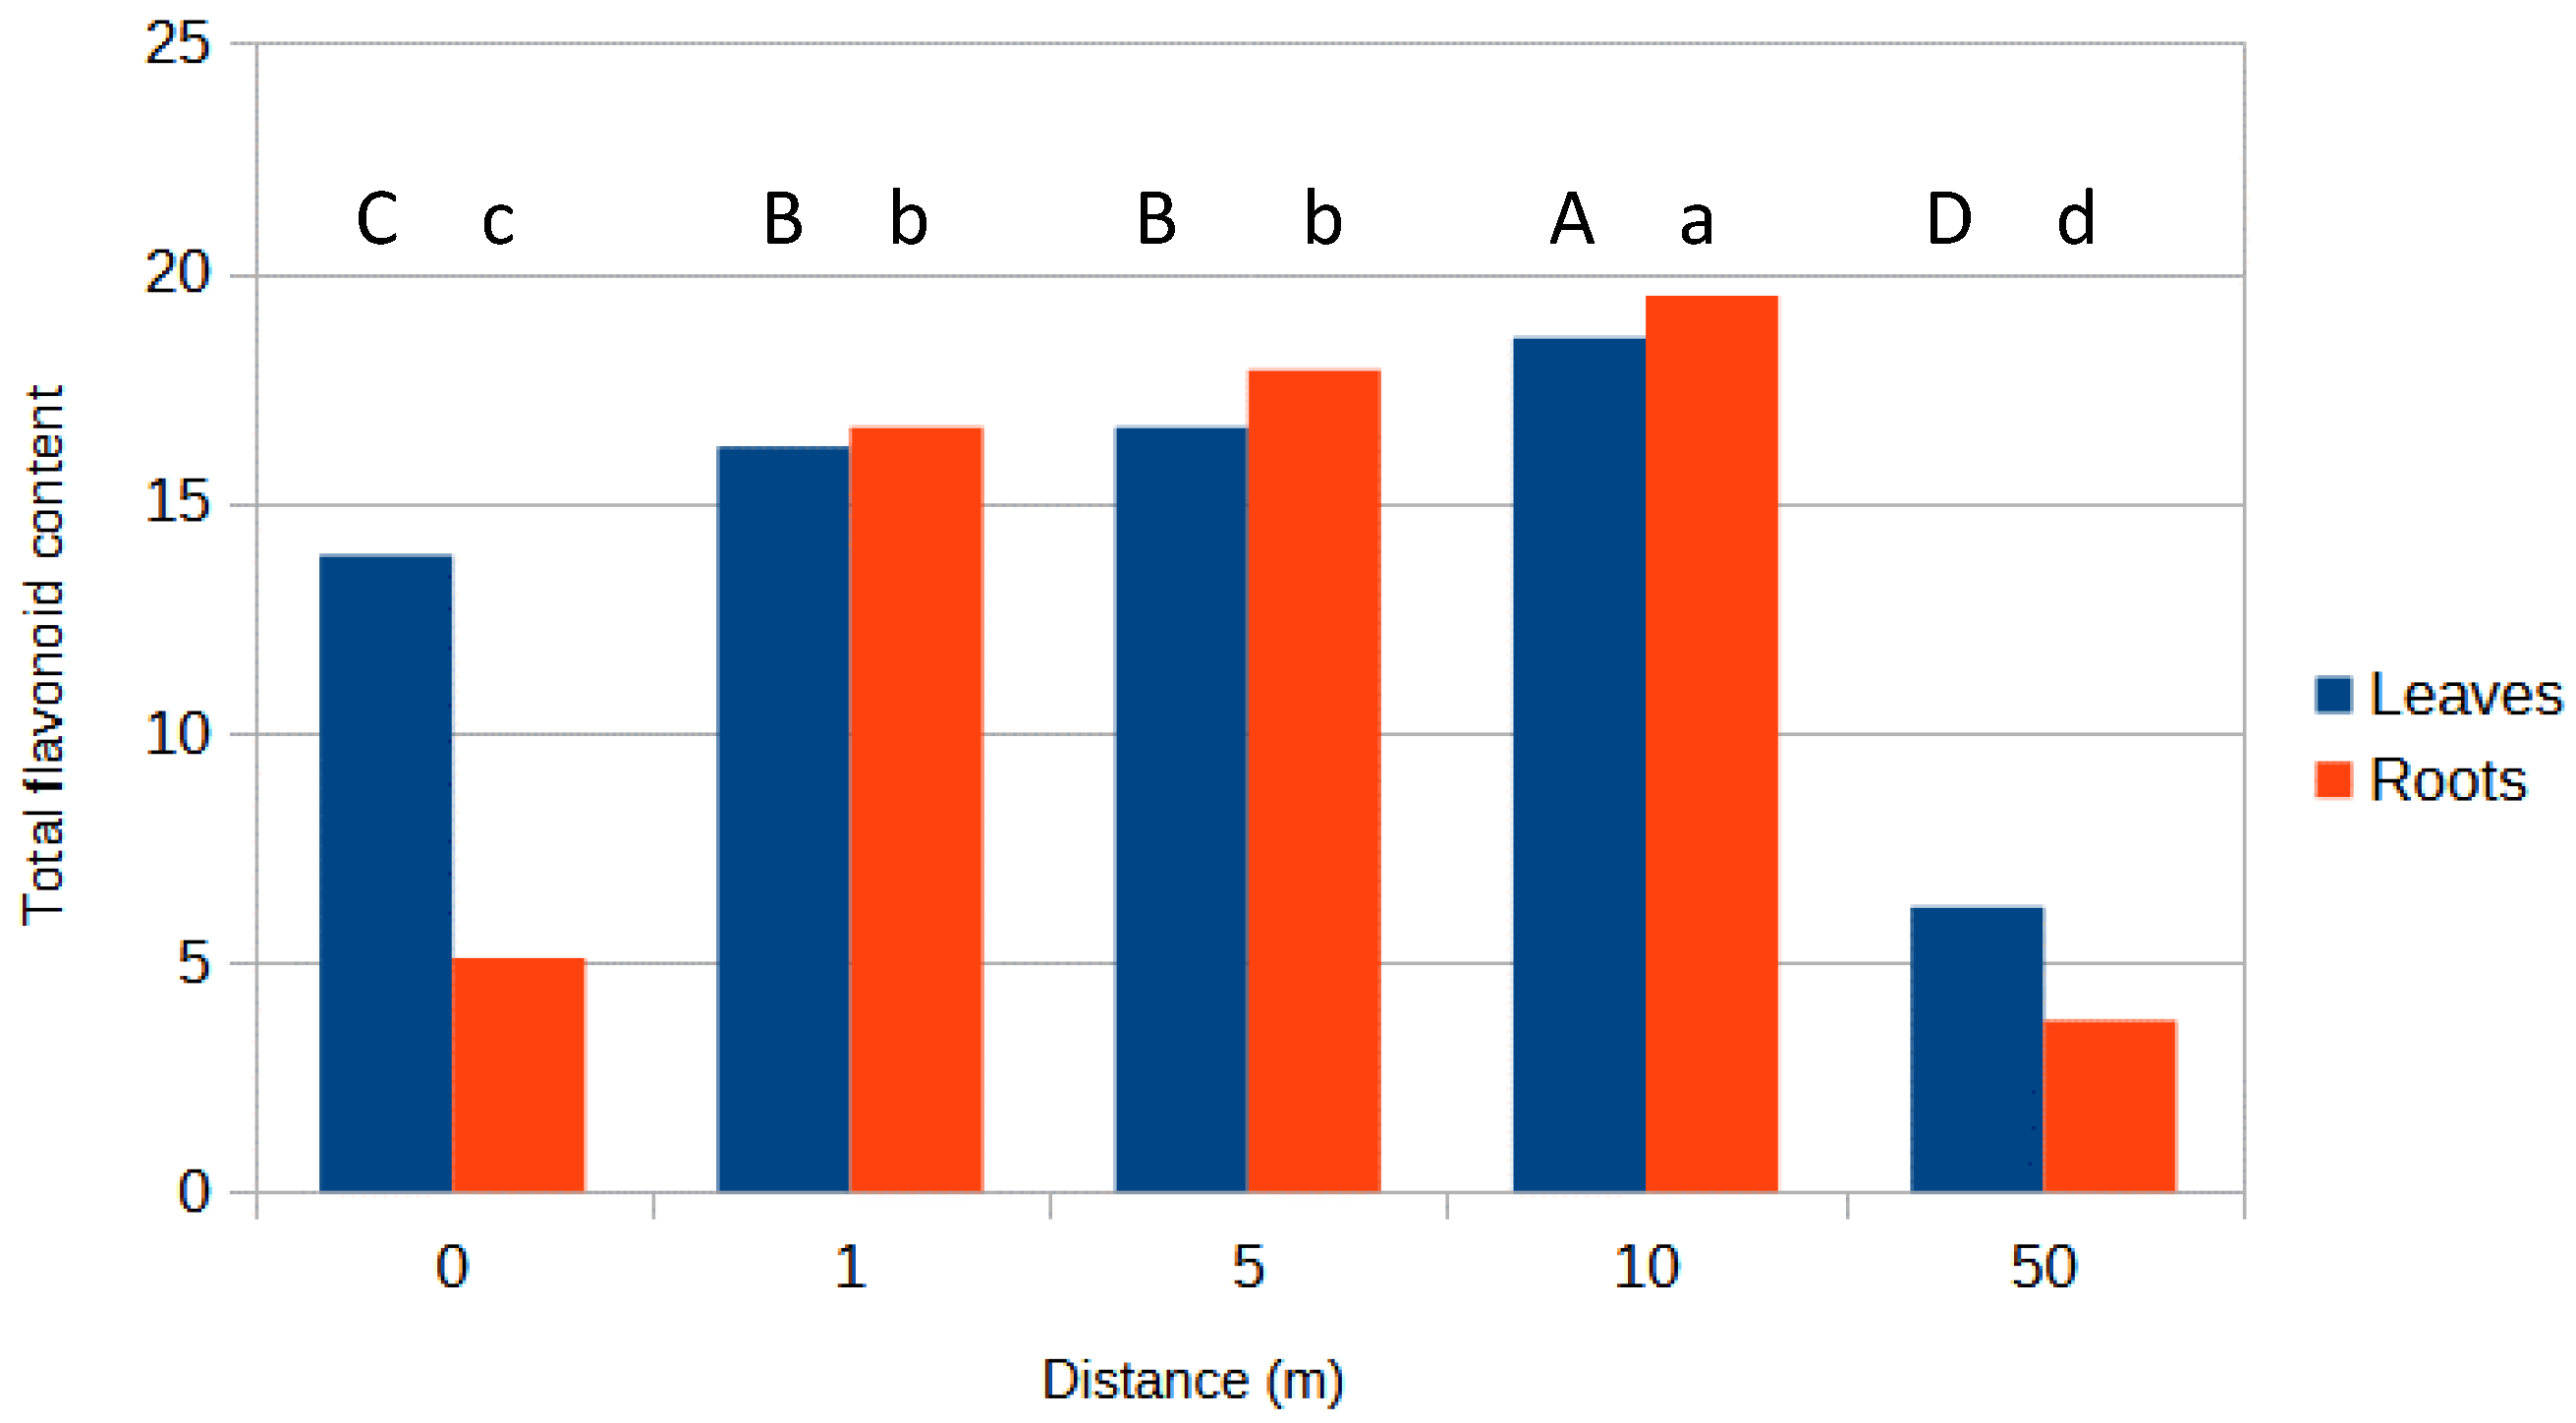
3.1. Total Flavonoid Content

The lowest flavonoid content was observed in the plants growing in a forest environment, which is natural for this species (Figure 6). In the case of plants growing in an area affected by transport pollution (plants directly exposed to pollution, plants growing 1–10 m away from the pollution source), an increase in flavonoid content was observed both in the roots and the aboveground parts with increasing distance. Notably, the level of flavonoids in direct contact with pollution was much lower in the underground part, which was not evident in the case of samples growing 1, 5, and 10 m away from the pollution source (Figure 6).

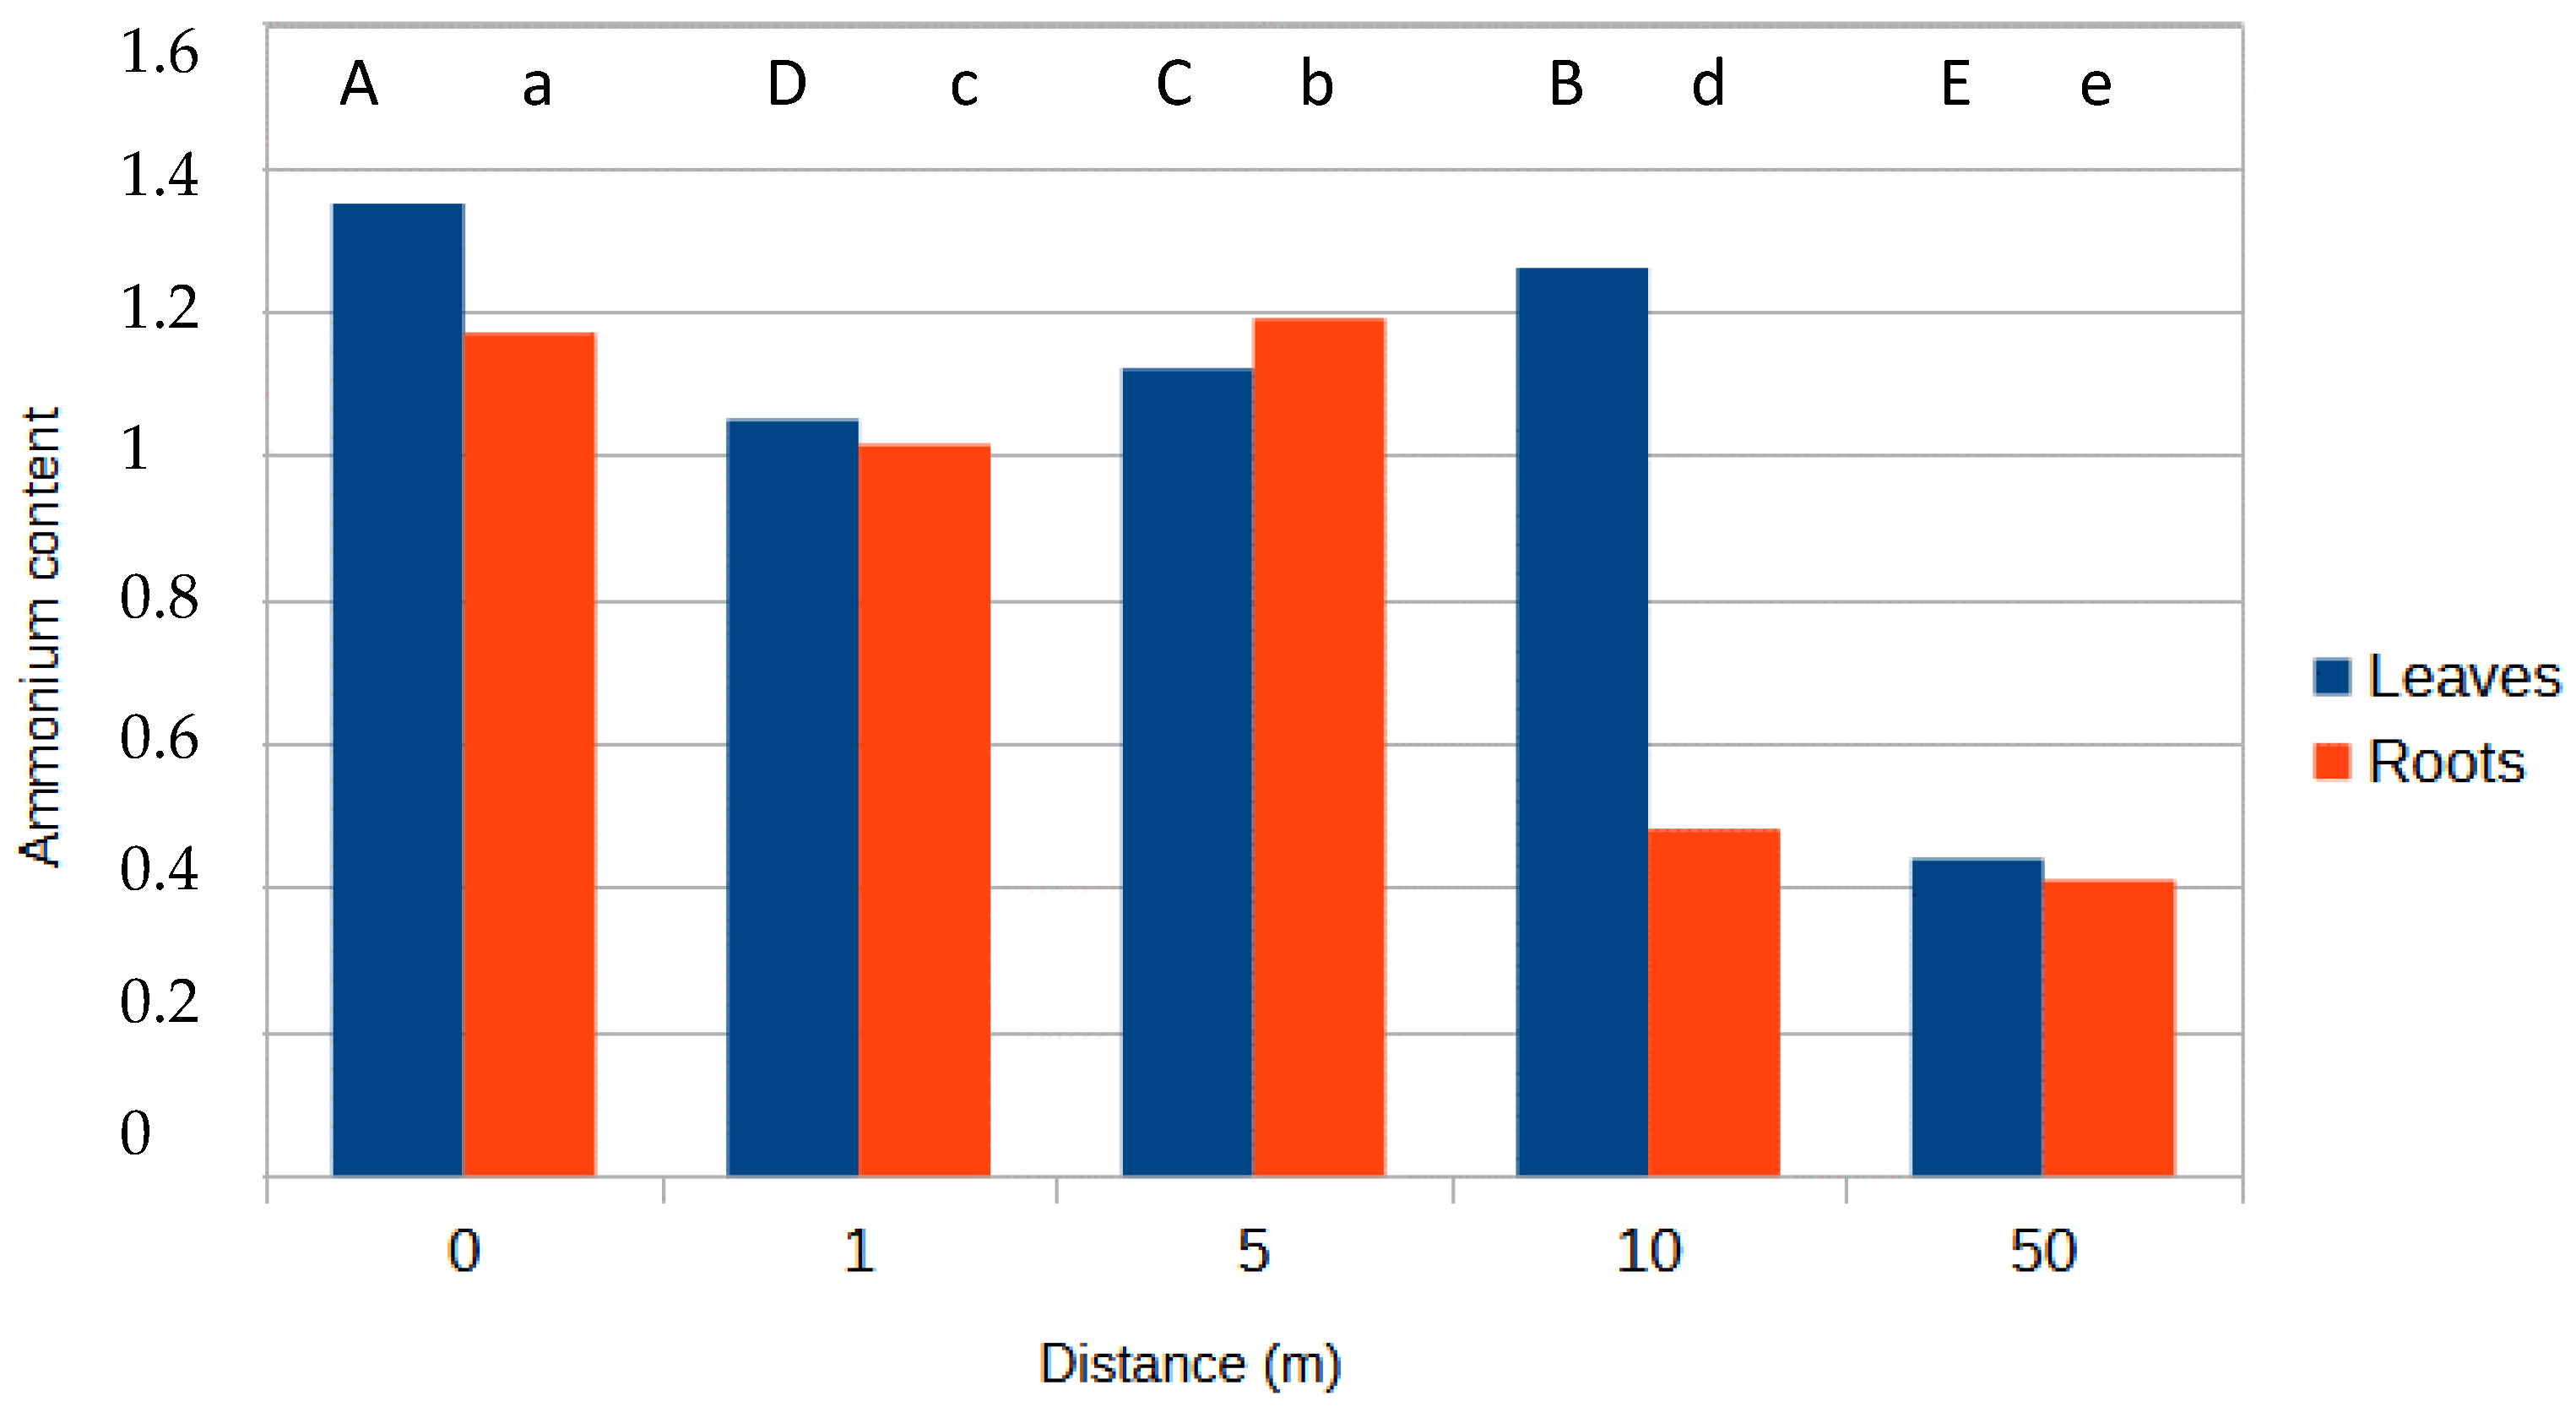
3.2. Ammonia Content

The lowest ammonia content was observed in plants growing in the natural environment (Figure 7). Its value was 0.41 µmol·g−1 DM in the above-ground part and 0.44 µmol·g−1 DM in the root part. The highest ammonia content in the aboveground parts was observed in plants directly exposed to pollution (Figure 7). Plants growing at distances of 1 and 5 m from the pollution source accumulated lower ammonia in the aboveground part; however, at a distance of 10 m, the value increased again (Figure 7). Interestingly, at a distance of 10 m from the pollution source, the ammonia content in the roots of the studied plants significantly decreased and did not differ significantly from the ammonia in the roots of plants collected from the natural site (Figure 7).

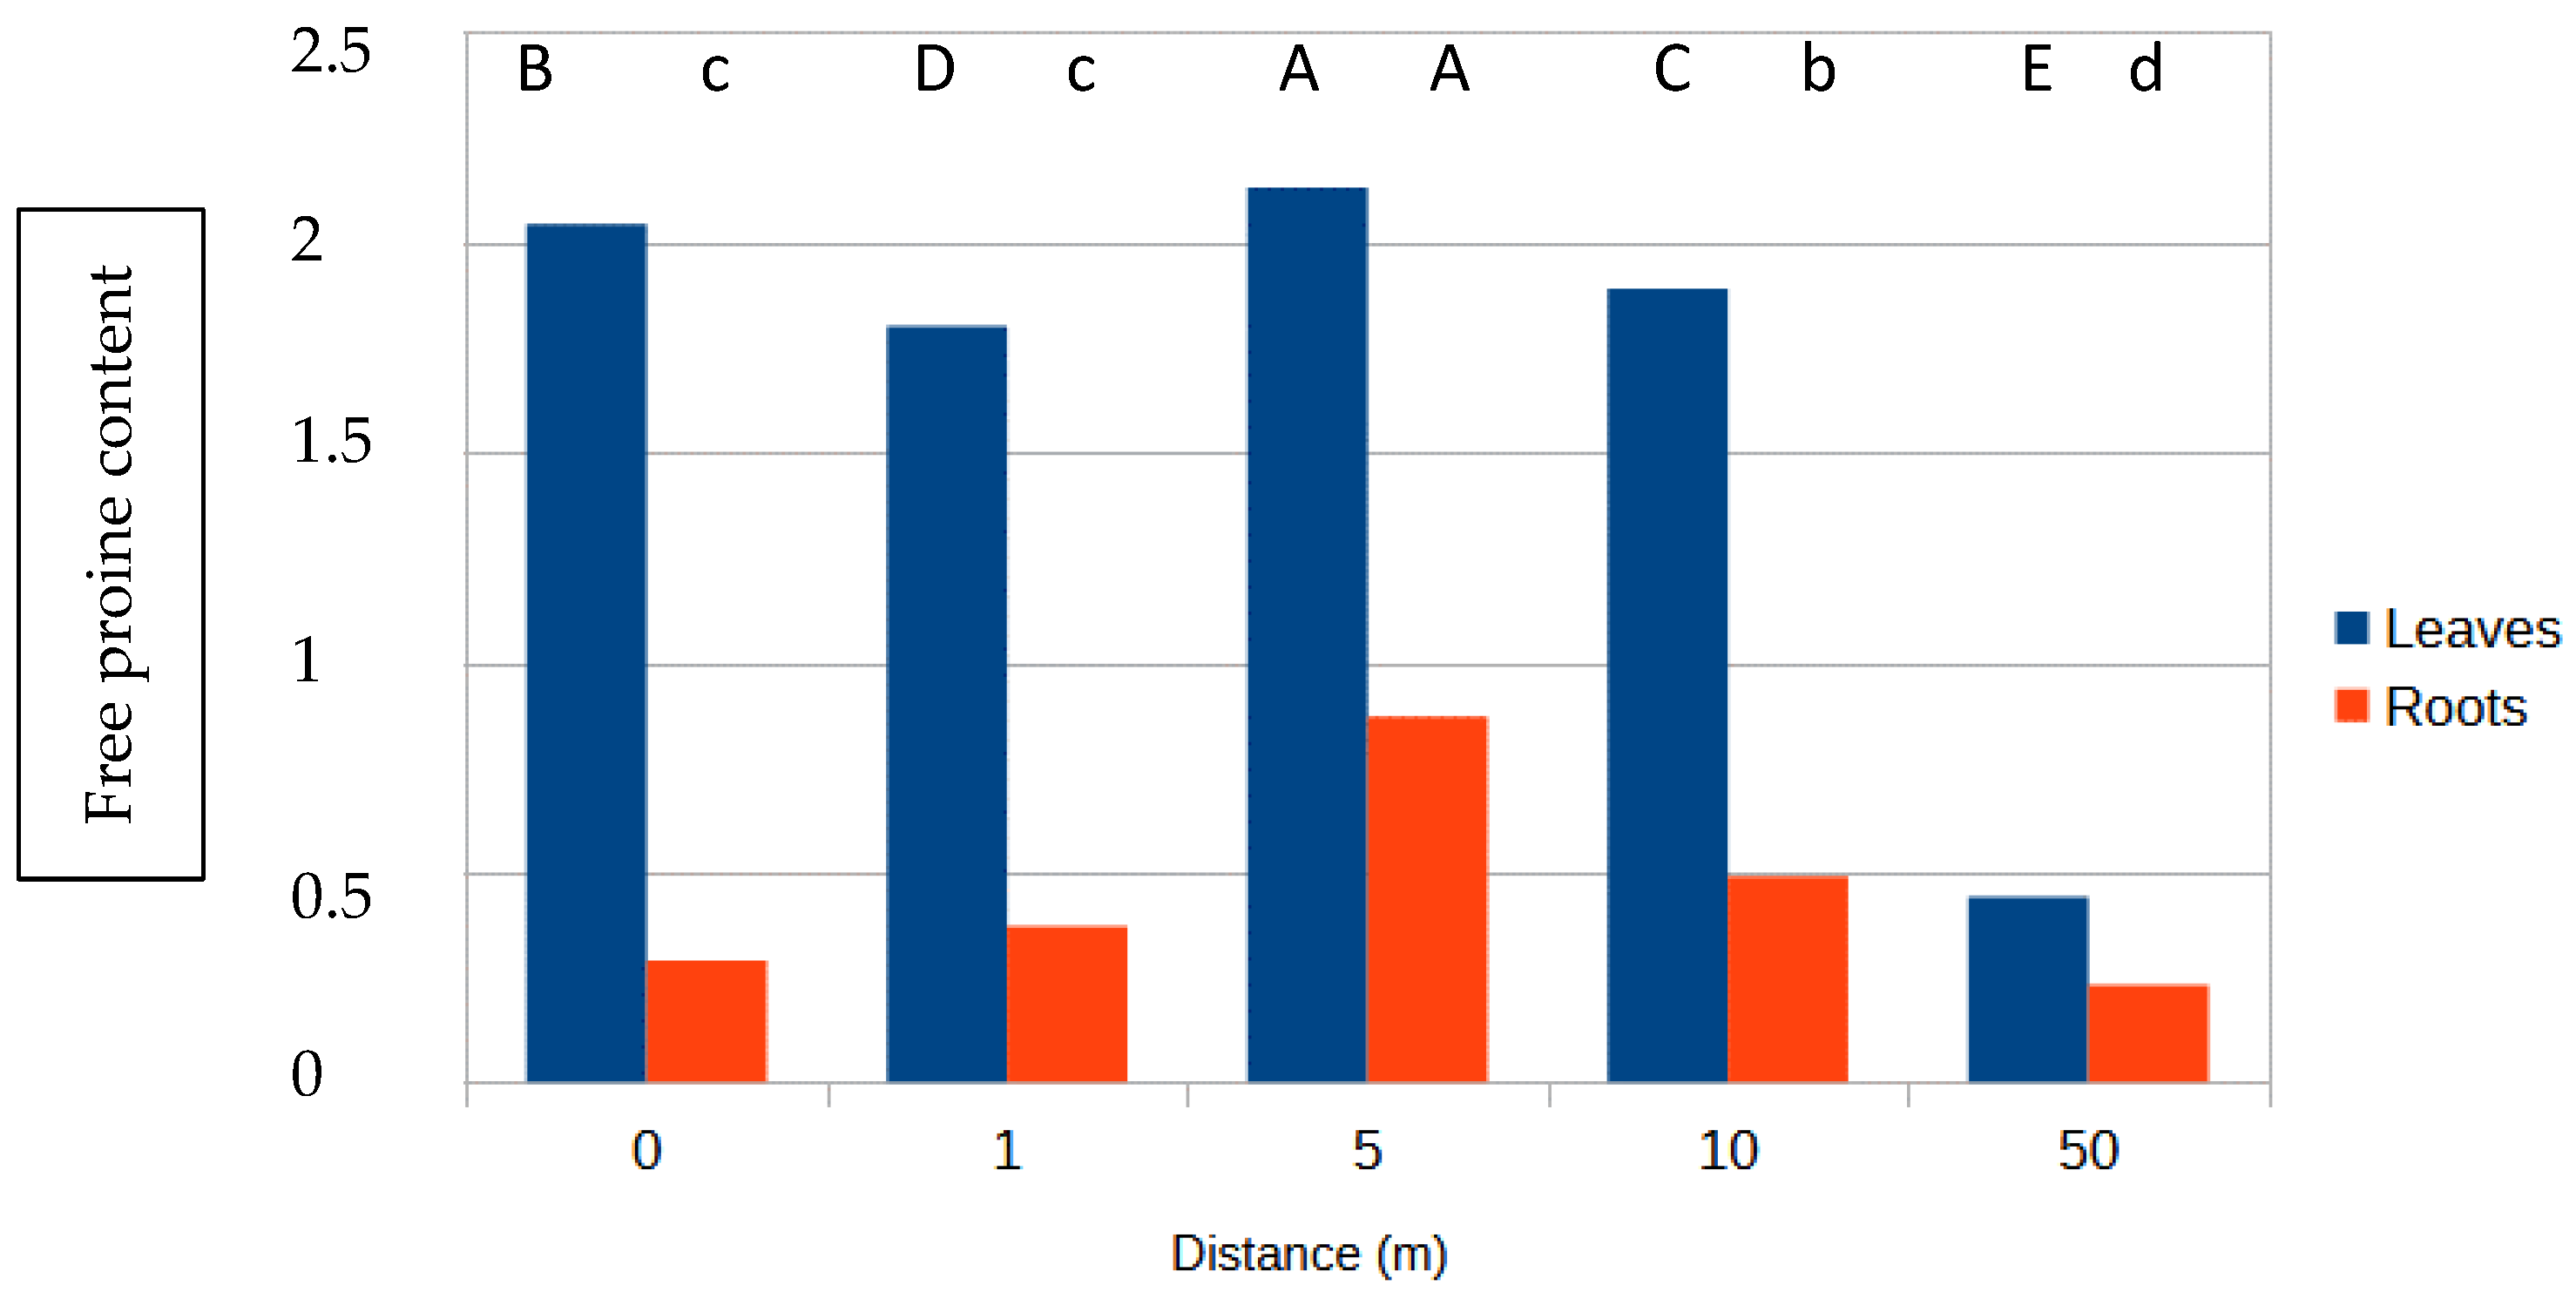
3.3. Free Proline Content

The lowest free proline content was observed in plants growing in the natural environment (Figure 8). The highest content of free proline in both the aboveground and root parts was observed in plants growing 5 m away from the transport pollution (Figure 8). The proline content in plants growing 0–10 m from the pollution source ranged from 1.8 to 2.13 µg·g−1 DM in the above-ground part and from 0.29 to 0.87 µg·g−1 DM in the root part. No toxic effects of street pollution on the excessive production of free proline were observed in the plants’ defence against oxidative stress.

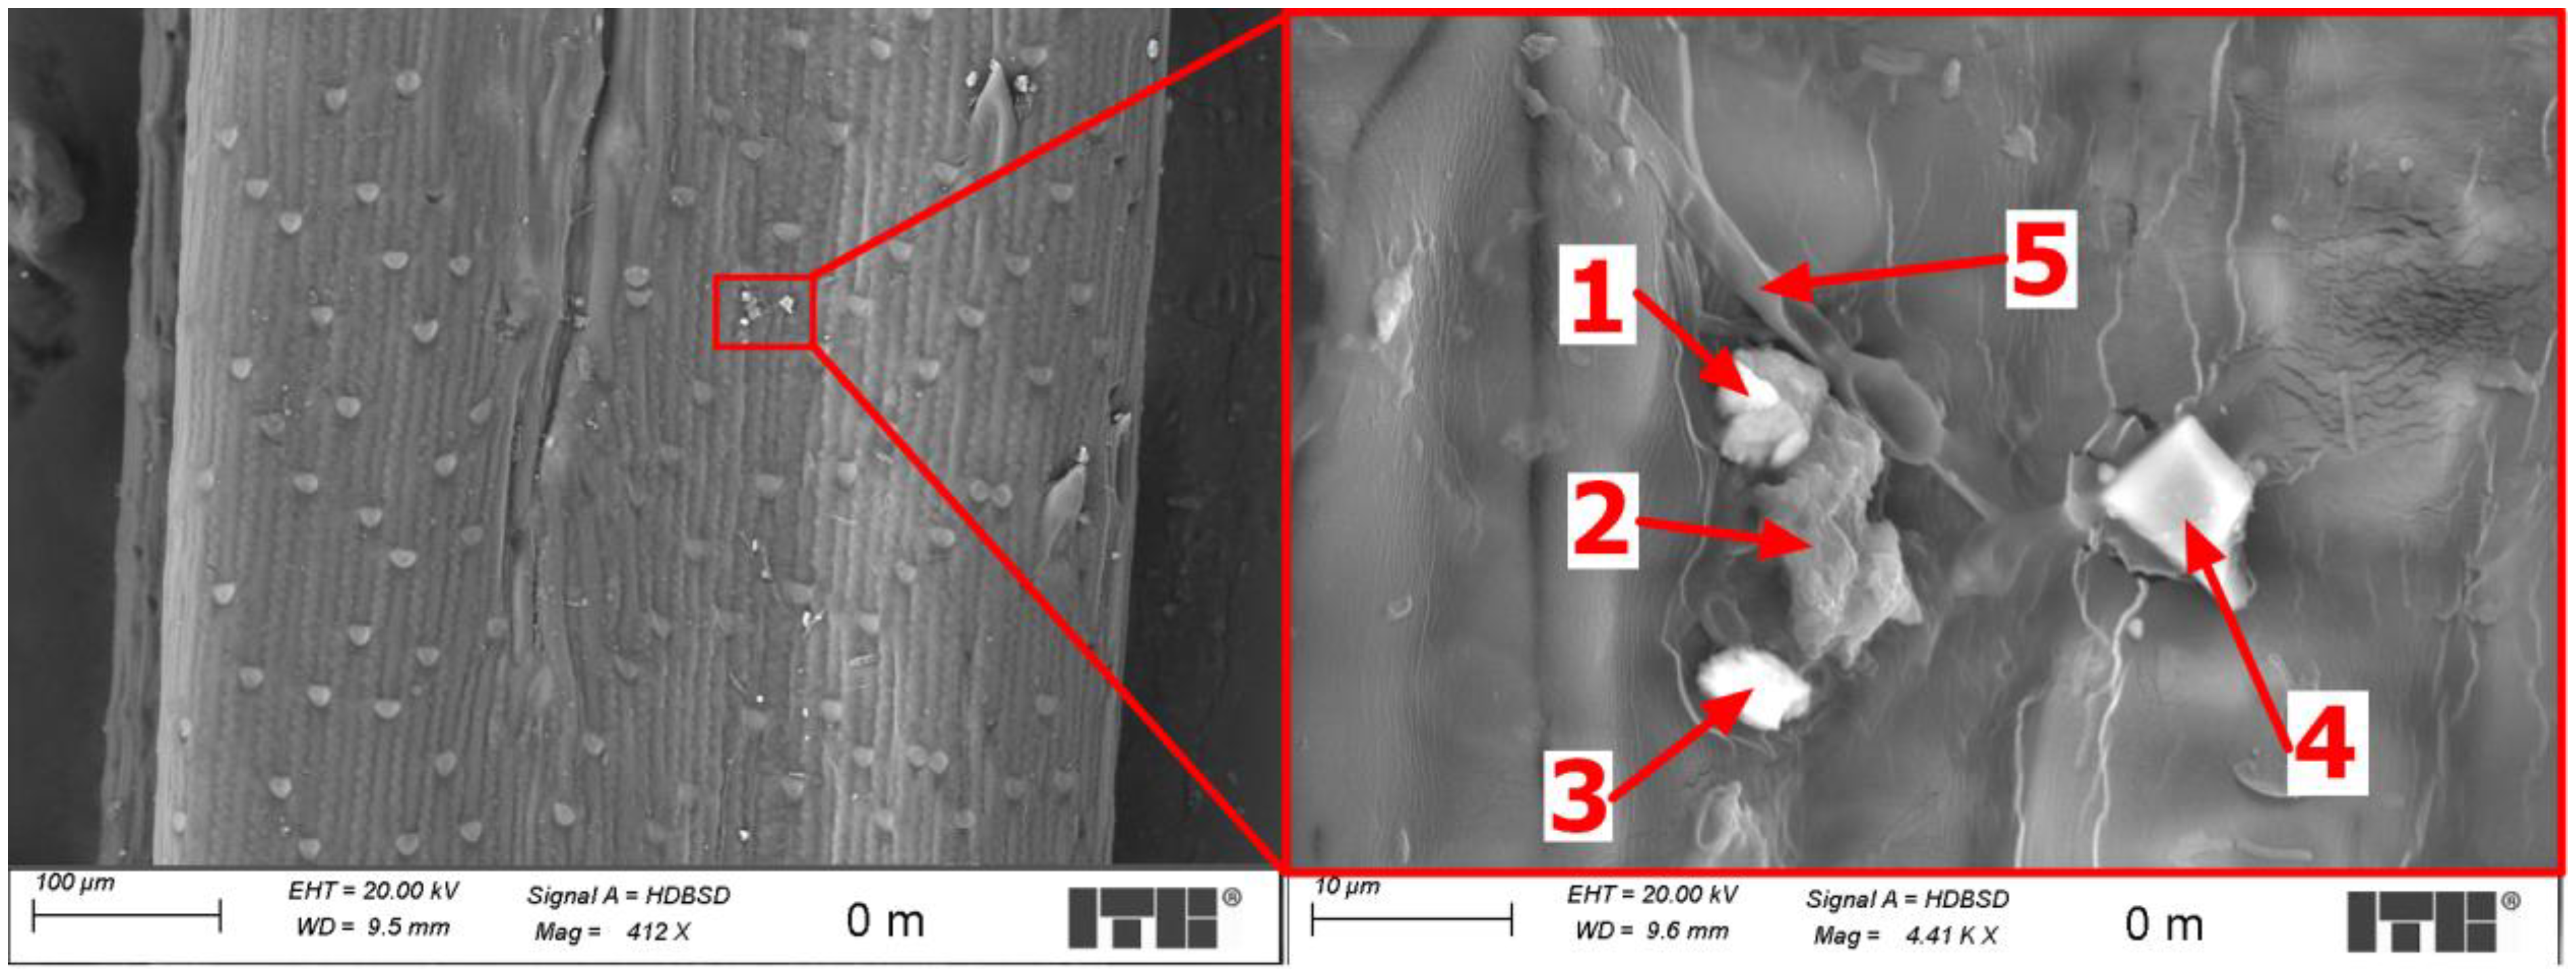
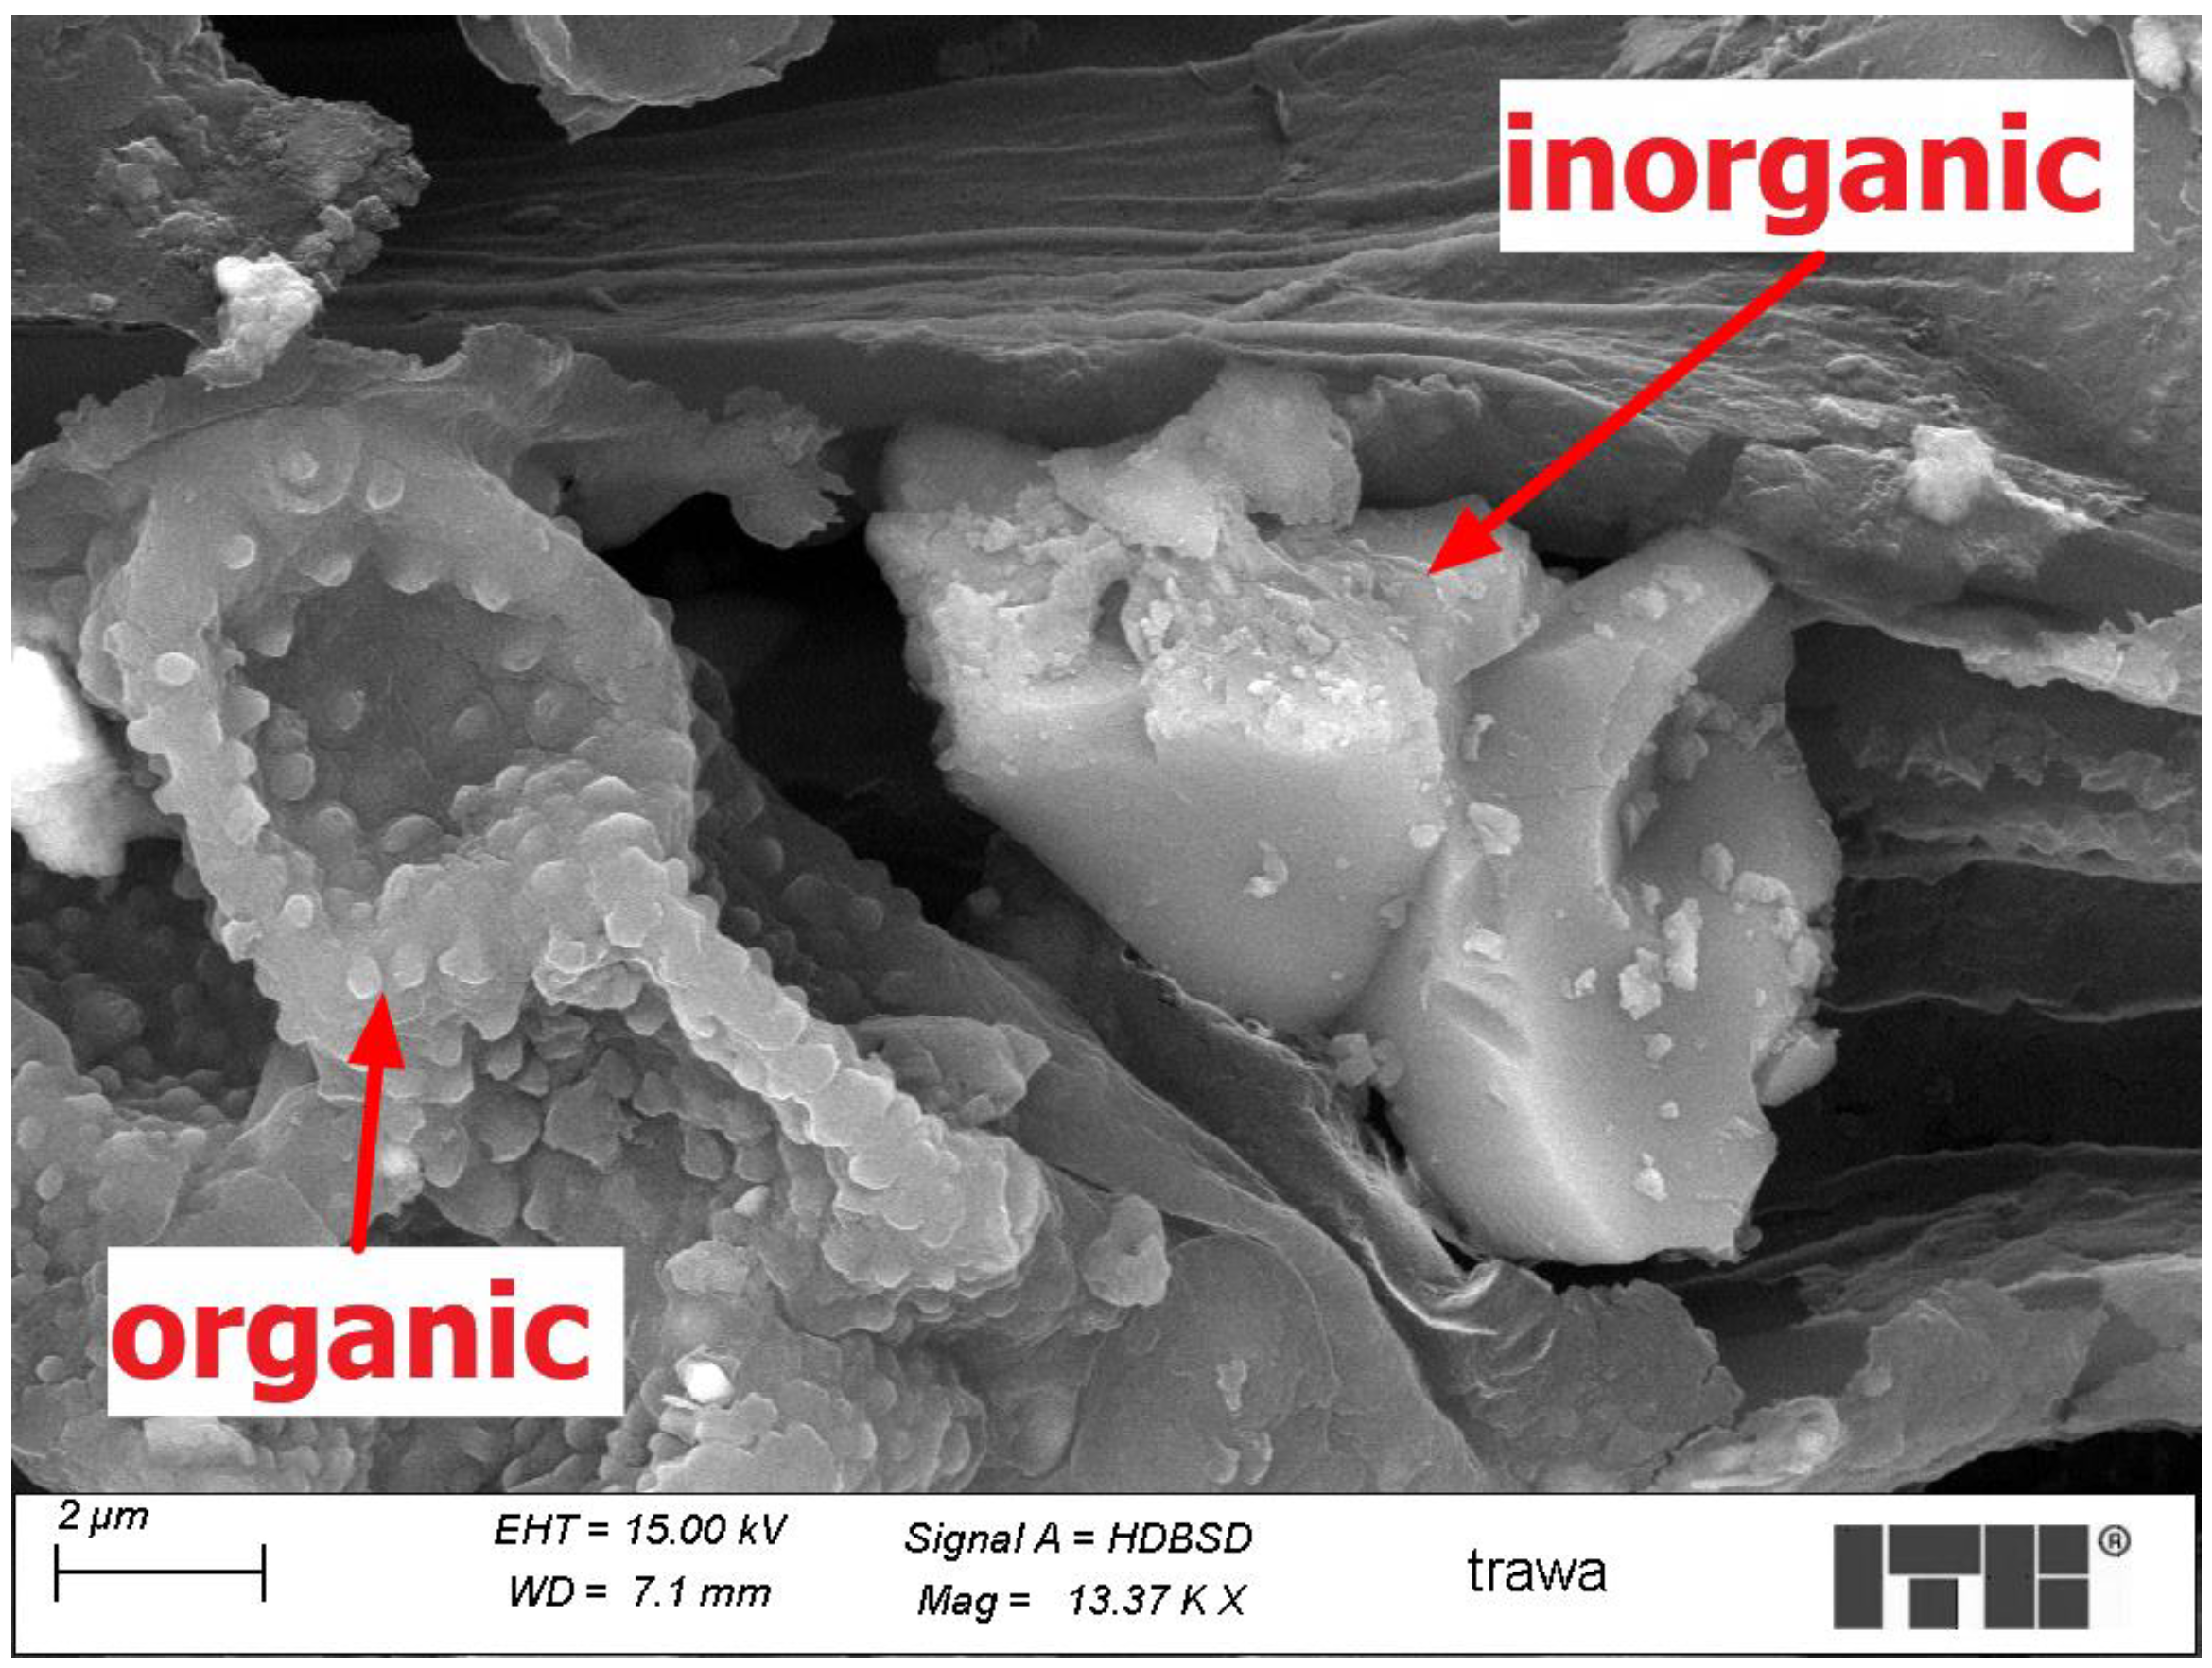
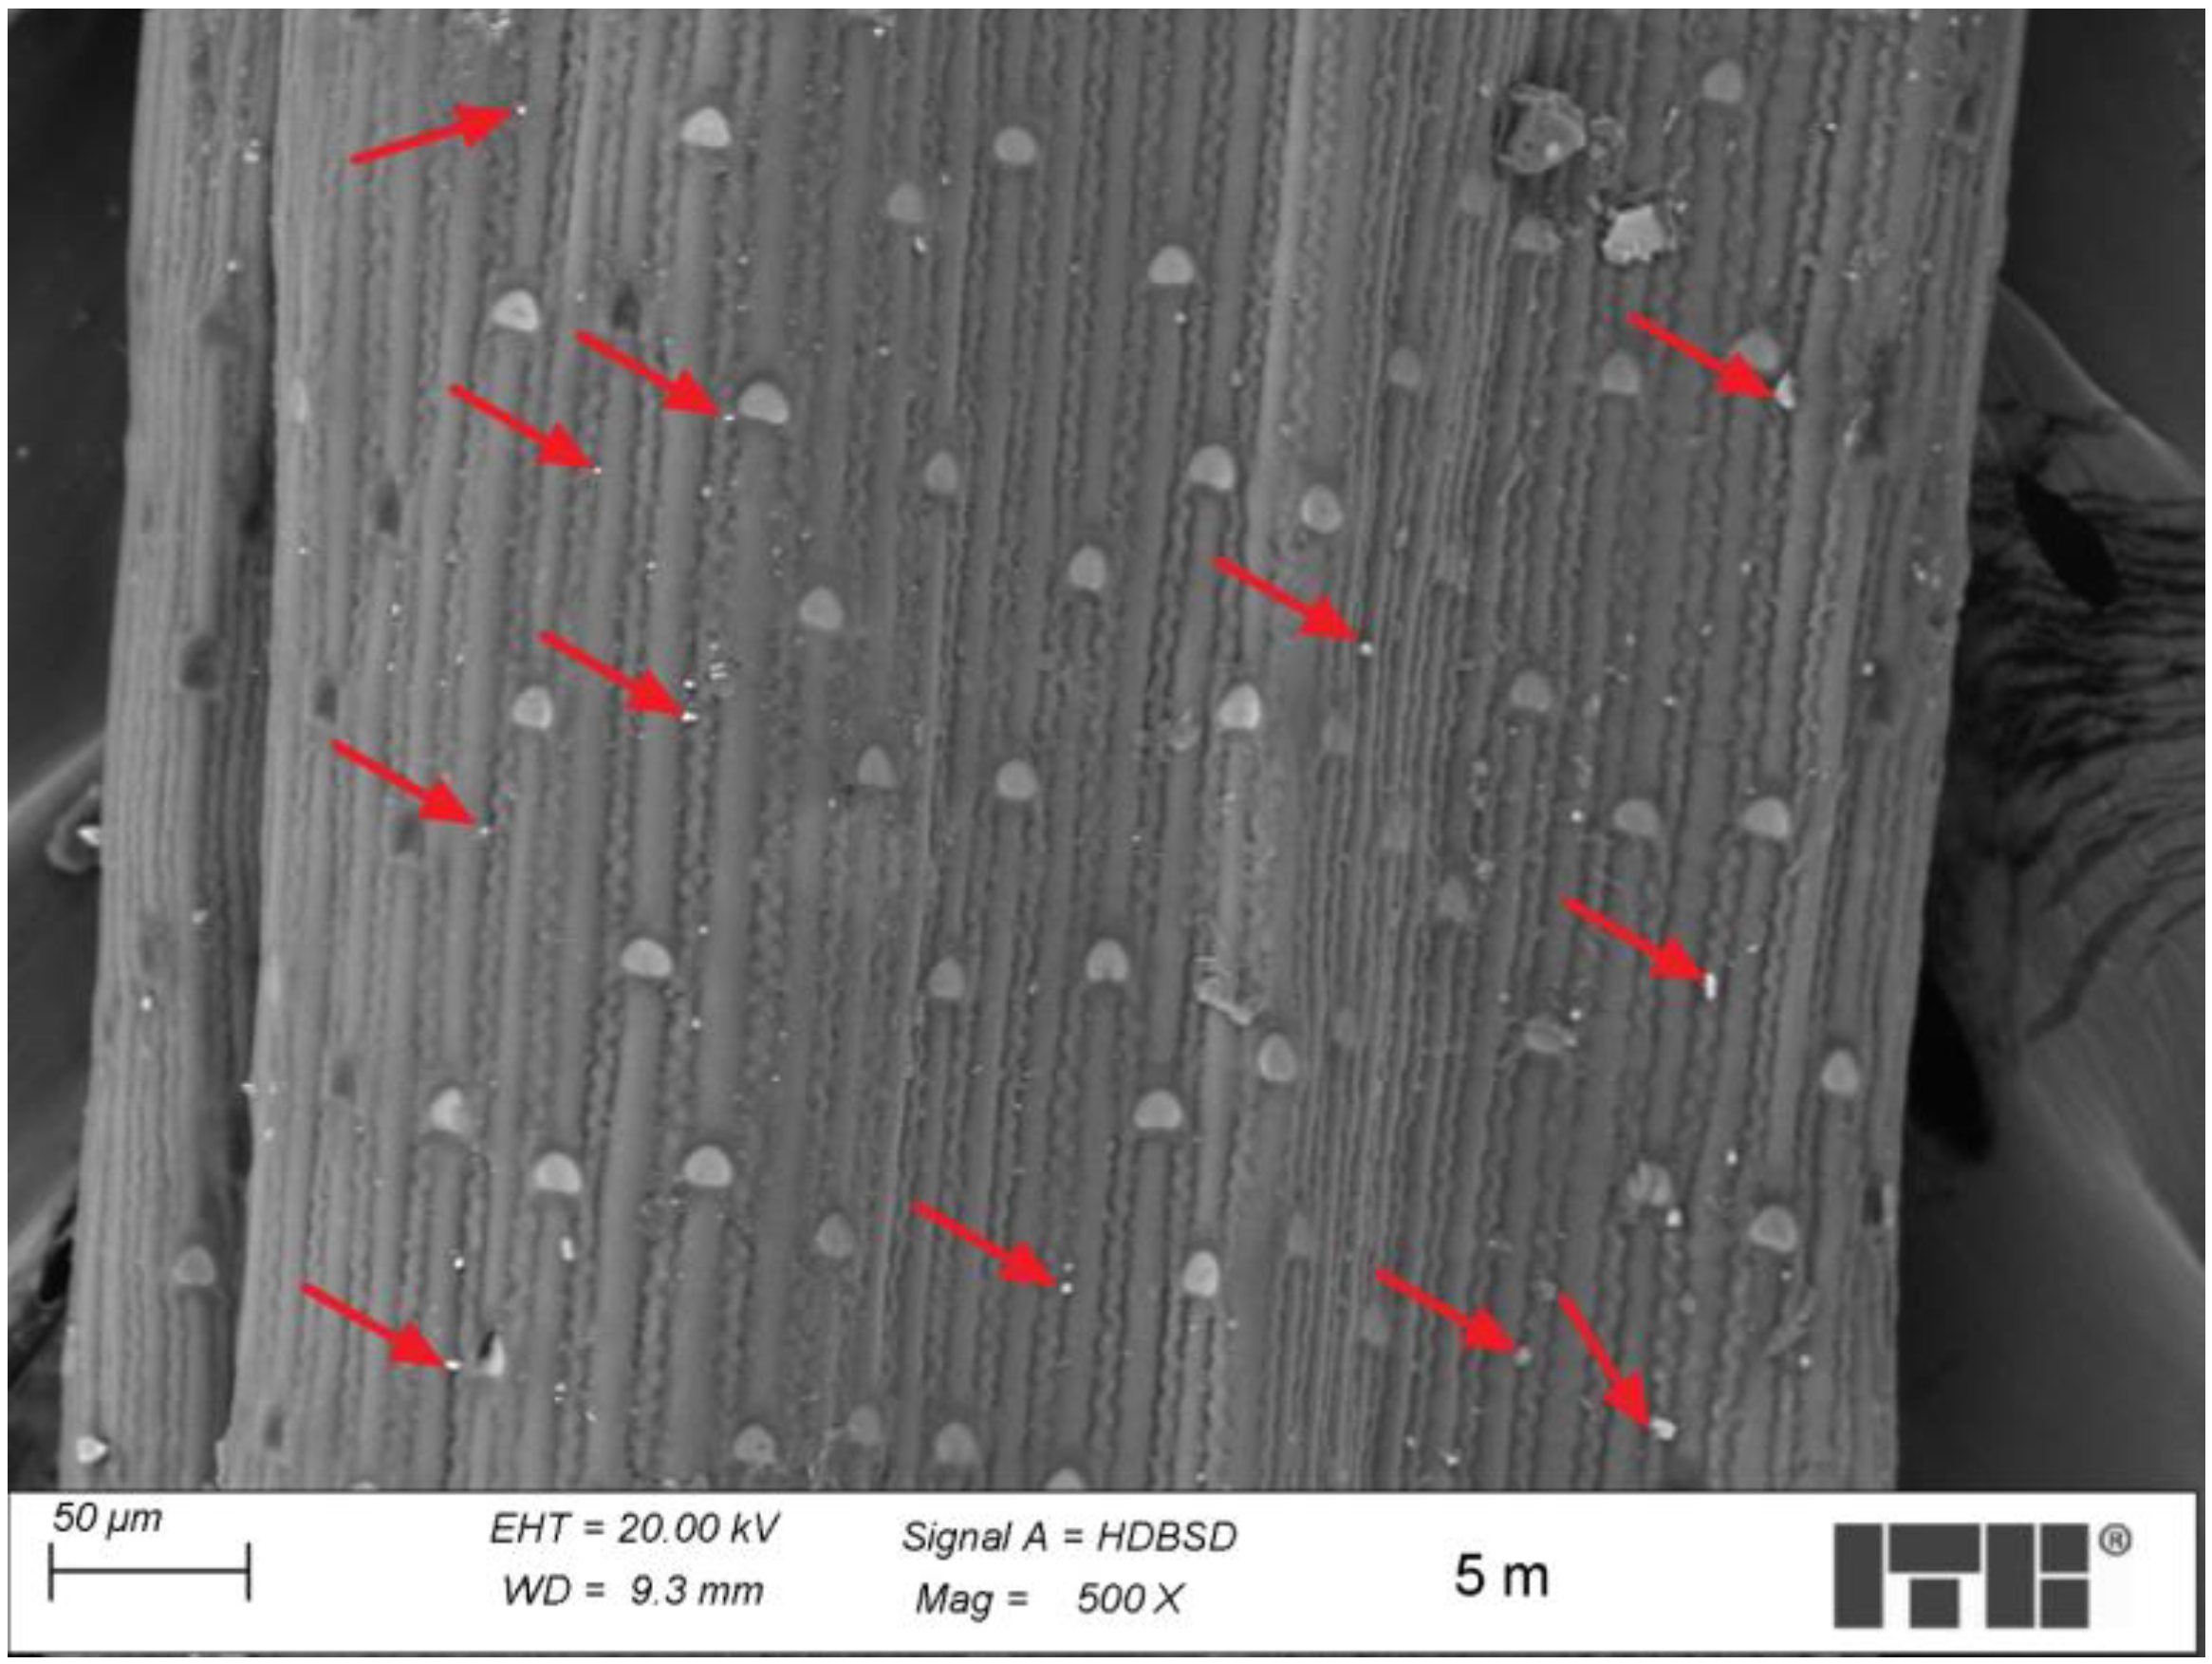
3.4. Microscopic Examinations

Microscopic examinations have shown that the surface of Festuca leaves might accumulate various types of dust particles, such as organic matter, natural aggregate dust (e.g., plagioclase, orthopyroxene, quartz, and feldspar), industrial waste (fly ash), and steel particles with various compositions. From these groups of anthropogenic particles, inorganic particles were chosen, excluding organic particles. Examples of such particles are shown in Figure 9 and Figure 10.
Using a backscattered electron detector (SEM-BSD), the particles containing heavier elements are brighter in the images. This property was used for searching for images of particles containing elements with masses equal to or higher than that of silicon. Only the abaxial sides of the leaves were examined for semi-quantitative analysis due to the low concentration of dust particles on the underside the leaves. One of the images collected during the analysis is presented in Figure 11 with marked examples of dust particles.
Using the software for graphical statistical analysis, the amount of dust particles was calculated and divided by the area of the examined leaf. The operation was carried out over 100 times for each type of sample, and the average results were presented as the number of anthropogenic dust particles per square millimetre of leaf surface (ADP).
The results of the semi-quantitative analysis presented in Figure 12 show that the concentration of anthropogenic dust particles (ADP) is the highest in the area close to the road, and it decreases with the distance from the source of the pollution. The most rapid decrease in dust content was observed at a distance of one meter from the road. The ADP value drops by half at a distance of 10 m from the source. The obtained values suggest the logarithmic shape of the curve. If so, then to receive the reference value of dust concentration, the distance from the source should be at least 50–100 m.

4. Discussion

Plants have demonstrated remarkable efficiency in capturing atmospheric particles. Depending on the dust load, exposure duration, and plant tolerance to pollution, adverse changes may occur pertaining to the leaf surface, structure, and growth. This can lead to leaf surface reduction, subsequently affecting the total biomass [49,50,51]. Hence, studying the pattern of changes and the adaptation of plant species to withstand and survive the stress conditions induced by environmental pollution is crucial. This aids in understanding species performance and effective utilisation, particularly in industrial and urban settings.
In urban and industrial areas, plants endure continuous exposure to high-level air pollutants, leading to chronic damage to their physiological, morphological, and anatomical characteristics. Elements available to plants in the environment are broadly categorised into essential elements for survival, and toxic and unnecessary elements. Elevated exposure doses of low-consumption elements in the environment disrupt plant systems, induce stress, and trigger observable signs of resistance and adaptation. This exposure can also cause physiological, morphological, and anatomical abnormalities in plants [52,53,54,55,56,57,58,59]. In the ongoing experiment, a noticeable reduction in visible leaf deposits was observed as the distance from the contamination source increased (Hypothesis 1). According to Hypothesis 1, plants near the roadsides or high-traffic areas accumulate more pollutants like nitrogen oxides, sulphur oxides, and particulate matter; increased proline and antioxidant enzyme activities are observed in plants closer to roads, indicating higher stress levels. In the current study, although free proline content was higher in plants growing closer to the source of pollution, it did not approach a toxic level. An interesting fact was also that the ammonia and total flavonoid content was increasing according to the distance from the source of pollution. This event was probably dictated by the higher accumulation of toxic elements in the soil and its easier negative effects on plants on the physiological level.
The exact role of increased flavonoid content in stressed plants remains unclear. Flavonoids can directly shield leaves by acting as antioxidants and indirectly by serving as pigments that screen for excess visible and ultraviolet radiation, thereby reducing radiation damage [60,61]. In this study, an elevation in total flavonoids was noted in the leaves and roots of Festuca at distances of 1 to 10 m from the street pollution source. The surge in flavonoid content in plants, including bent grass, which is far from the pollution sources, may be attributed to various factors. Flavonoids are secondary metabolites in plants and are often involved in defence mechanisms against diverse stressors, including pollution [62,63]. The higher flavonoid content in bent grass may result from alterations in the soil induced by pollutants affecting microbial communities or changing nutrient availability. These effects can provoke stress responses in plants, thereby prompting flavonoid production [64,65]. It is noteworthy that elucidating the specific reasons for the increased flavonoid content in bent grass in a particular area necessitates a detailed scientific examination and analysis of the local environment, including the soil composition, pollution levels, and plant genetics. The augmentation of flavonoids may also be linked to their ability to chelate metal ions in the cytosol or vacuoles [66]. Flavonoids can mitigate the adverse effects of metal toxicity, owing to their direct chelating properties [66]. Additionally, the detoxification systems in plants against exogenous phytotoxic chemicals involve conjugation to glutathione (GSH) by glutathione S-transferase, followed by the removal of conjugates from the cytosol by membrane-associated transport proteins [67,68] This suggests that heightened flavonoids might affect GSH synthesis, thereby safeguarding plants against municipal pollution.
The current study revealed increased proline content in leaves and roots under high pollution stress conditions (0–10 m), yet its levels did not seem to stress the plants. This aligns with other studies where plants subjected to diverse stressors, such as salinity or pollution, exhibited increased proline accumulation, aiding in osmotic adjustment, membrane stabilisation, and the detoxification of harmful ions synthesised in plant cells [69,70,71]. Proline accumulation under stress conditions can be indicative of stress-tolerant species selection, as stress-tolerant species exhibit higher proline concentrations [72,73,74]. Interestingly, in this study, the free proline level was notably lower in the roots than in the leaves. Proline accumulation can vary among species and different plant organs [75], with leaves producing more amino acids than roots. The proline concentration in the leaves (approximately 2 U) indicates a stress-free level in plants (Hypothesis 2).
The threshold for ammonia accumulation in plants can vary significantly, owing to multiple factors, including plant species, environmental conditions, the growth stage, and the plant’s inherent capacity to manage nitrogen metabolism [76]. Specific thresholds defining stressful ammonia accumulation in plants may not be universally defined [77]. However, plants generally possess diverse mechanisms to manage and detoxify ammonia to mitigate its toxic effects. Elevated levels of ammonia were notably observed in the leaves of plants situated within 0–10 m from the pollution source in the current experiment compared to plants in their natural state. This potentially signifies the response of a plant to stress. Simultaneously, the low proline and relatively high flavonoid levels could suggest a robust plant response that neutralises the adverse effects of urban pollution stress. Similar ammonia levels were noted in the roots of plants growing 0–5 m from the pollution source. At a distance of 10 m, the ammonia levels in the roots resembled those of plants grown under natural conditions (50 m from the pollution source). Roots are considered good indicators of air pollution (Hypothesis 3). The decline in ammonia levels in the roots at a distance of 10 m from the pollution source might indicate a critical distance that remains safe for plants against the impact of urban pollutants. The roots of plants, including grasses, can indeed be significant indicators of traffic pollution stress. The explanation may be that even air pollution accumulates in the soil for a longer time. The roots are in direct contact with the soil, where many pollutants, especially heavy metals and particulate matter from traffic emissions, settle and accumulate. This direct exposure makes roots more sensitive and accurate indicators of the soil pollution levels. Soil retains pollutants for extended periods, leading to the prolonged exposure of roots to these contaminants, providing a historical record of pollution [78]. It is worth it to mention that the accumulation of chemical compounds, such as free proline or total flavonoids, responsible for scavenging of ROS, was much higher in leaves.

5. Conclusions

In summary, our recent research strongly suggests that Festuca ovina could serve as an effective plant marker for monitoring traffic pollution, particularly through the analysis of the ammonia content present in both above- and below-ground sections of the plant. Our studies revealed that the distances exceeding 50 m from the primary source of street pollution appear to provide a safe environment for plants, minimising the deposition of dust on their leaves. Additionally, our findings indicate a substantial increase in total flavonoid production in these plants; despite this, there was a notably low concentration of free proline. The combination of high flavonoid production and reduced free proline concentration suggests the potential tolerance of this plant species to traffic highway pollution.
Urban greenery is an integral part of the city system. The public and city managers should be made aware of the important indicative role of herbaceous plant species like Festuca ovina. The research carried out here is a pilot study and will be continued in larger urban areas in order to confirm the significant role of this species as an indicator of pollution. It is important to understand the significant bioindication role of herbaceous species, which will contribute to better management of urban greenery in the future.

Author Contributions

Conceptualization: A.J. and B.F.-P.; methodology: A.J., F.C. and B.F.-P.; Data curation: A.J. and F.C.; Manuscript preparation: A.J., F.C. and B.F.-P. equally. All authors have read and agreed to the published version of the manuscript.

Funding

The research was funded by the Ministry of Science in Poland.

Institutional Review Board Statement

Not applicable.

Data Availability Statement

The data presented in this study are available in article.

Conflicts of Interest

The authors declare no conflicts of interest.

References

  1. Barakat-Haddad, C.; Zhang, S.; Siddiqua, A.; Dghaim, R. Air Quality and Respiratory Health among Adolescents from the United Arab Emirates. J. Environ. Public Health 2015, 2015, 284595. [Google Scholar] [CrossRef] [PubMed]
  2. Referowska-Chodak, E. Pressures and Threats to Nature Related to Human Activities in European Urban and Suburban Forests. Forests 2019, 10, 765. [Google Scholar] [CrossRef]
  3. World Health Report 2013: Research for Universal Health Coverage; WHO: Geneva, Switzerland, 2013.
  4. Tong, D.; Pan, L.; Chen, W.; Lamsal, L.; Lee, P.; Tang, Y.; Kim, H.; Kondragunta, S.; Stajner, I. Impact of the 2008 Global Recession on air quality over the United States: Implications for surface ozone levels from changes in NOx emissions. Geophys. Res. Lett. 2016, 43, 9280–9288. [Google Scholar] [CrossRef]
  5. Hime, N.; Marks, G.; Cowie, C. A Comparison of the Health Effects of Ambient Particulate Matter Air Pollution from Five Emission Sources. Int. J. Environ. Res. Public Health 2018, 15, 1206. [Google Scholar] [CrossRef] [PubMed]
  6. Balasubramaniam, T.; Shen, G.; Esmaeili, N.; Zhang, H. Plants’ Response Mechanisms to Salinity Stress. Plants 2023, 12, 2253. [Google Scholar] [CrossRef]
  7. Isayenkov, S.V.; Maathuis, F.J.M. Plant Salinity Stress: Many Unanswered Questions Remain. Front. Plant Sci. 2019, 10, 80. [Google Scholar] [CrossRef] [PubMed]
  8. Khan, A.M.; Pandey, V.; Yunus, M.; Ahmad, K.J. Plants as dust scavengers: A case study. Indian For. 1989, 115, 670–672. [Google Scholar]
  9. Lohr, V.I.; Pearson-Mims, C.H. Particulate matter accumulation on horizontal surfaces in interiors: Influence of foliage plants. Atmos. Environ. 1996, 30, 2565–2568. [Google Scholar] [CrossRef]
  10. Harrison, R.M.; Yin, J. Particulate matter in the atmosphere: Which particle properties are important for its effects on health? Sci. Total Environ. 2000, 249, 85–101. [Google Scholar] [CrossRef]
  11. Pal, A.; Kulshreshtha, K.; Ahmad, K.J.; Behl, H.M. Do leaf surface characters play a role in plant resistance to auto-exhaust pollution? Flora-Morphol. Distrib. Funct. Ecol. Plants 2002, 197, 47–55. [Google Scholar] [CrossRef]
  12. Tomasevic, M.; Anicic, M. Trace element content in urban tree leaves and SEM-EDAX characterization of deposited particles. Facta Univ.-Ser. Phys. Chem. Technol. 2010, 8, 1–13. [Google Scholar] [CrossRef]
  13. Samara, C.; Voutsa, D. Size distribution of airborne particulate matter and associated heavy metals in the roadside environment. Chemosphere 2005, 59, 1197–1206. [Google Scholar] [CrossRef] [PubMed]
  14. Bućko, M.S.; Magiera, T.; Johanson, B.; Petrovský, E.; Pesonen, L.J. Identification of magnetic particulates in road dust accumulated on roadside snow using magnetic, geochemical and micro-morphological analyses. Environ. Pollut. 2011, 159, 1266–1276. [Google Scholar] [CrossRef] [PubMed]
  15. Chatson, K.; Doley, D. Mineral particulates and vegetation: Effect of coal dust, overburden and fly ash on light interception and leaf temperature. Clean Air Environ. Qual. 2006, 40, 40–44. [Google Scholar]
  16. Nadal, M.; Schuhmaher, M.; Domingo, J. Metal pollution of soils and vegetation in an area with petrochemical industry. Sci. Total Environ. 2004, 321, 59–69.17. [Google Scholar] [CrossRef]
  17. Guenat, S.; Dallimer, M. A global meta-analysis reveals contrasting impacts of air, light, and noise pollution on pollination. Ecol. Evol. 2023, 13, e9990. [Google Scholar] [CrossRef] [PubMed]
  18. Mehmood, Z.; Yang, H.-H.; Awan, M.U.F.; Ahmed, U.; Hasnain, A.; Luqman, M.; Muhammad, S.; Sardar, A.A.; Chan, T.-Y.; Sharjeel, A. Effects of Air Pollution on Morphological, Biochemical, DNA, and Tolerance Ability of Roadside Plant Species. Sustainability 2024, 16, 3427. [Google Scholar] [CrossRef]
  19. Giri, S.; Shrivastava, D.; Deshmukh, K.; Dubey, P. Effect of Air Pollution on Chlorophyll Content of Leaves. Curr. Agric. Res. J. 2013, 1, 93–98. [Google Scholar] [CrossRef]
  20. Iqbal, M.; Breivik, K.; Syed, J.H.; Malik, R.N.; Li, J.; Zhang, G.; Jones, K.C. Emerging issue of e-waste in Pakistan: A review of status, research needs and data gaps. Environ. Pollut. 2015, 207, 308–318. [Google Scholar] [CrossRef] [PubMed]
  21. Uka, U.N.; Hogarh, J.; Belford, E.J.D. Morpho-Anatomical and Biochemical Responses of Plants to Air Pollution. Int. J. Mod. Bot. 2017, 7, 1–11. [Google Scholar]
  22. Rubio, V.; Valverde, M.; Rojas, E. Effects of atmospheric pollutants on the Nrf2 survival pathway. Environ. Sci. Pollut. Res. 2010, 17, 369–382. [Google Scholar] [CrossRef]
  23. Husted, S.; Hebbern, C.A.; Mattsson, M.; Schjoerring, J.K. A critical experimental evaluation of methods for determination of NH4+ in plant tissue, xylem sap and apoplastic fluid. Physiol. Plant. 2000, 109, 167–179. [Google Scholar] [CrossRef]
  24. Britto, D.T.; Kronzucker, H.J. NH4+ toxicity in higher plants: A critical review. J. Plant Physiol. 2002, 159, 567–584. [Google Scholar] [CrossRef]
  25. Seifi, H.S.; Van Bockhaven, J.; Angenon, G.; Höfte, M. Glutamate metabolism in plant disease and defense: Friend or foe? Mol. Plant-Microbe Interact. 2013, 26, 475–485. [Google Scholar] [CrossRef]
  26. Lea, P.J.; Miflin, B.J. Glutamate synthase and the synthesis of glutamate in plants. Plant Physiol. Biochem. 2003, 41, 555–564. [Google Scholar] [CrossRef]
  27. Harborne, J.B.; Williams, C.A. Advances in Flavonoid Research since 1992. Phytochemistry 2000, 55, 481–504. [Google Scholar] [CrossRef]
  28. Winkel-Shirley, B. Biosynthesis of flavonoids and effects of stress. Curr. Opin. Plant Biol. 2002, 5, 218–223. [Google Scholar] [CrossRef] [PubMed]
  29. D’Auria, J.C.; Gershenzon, J. The secondary metabolism of Arabidopsis thaliana: Growing like a weed. Curr. Opin. Plant Biol. 2005, 8, 308–316. [Google Scholar] [CrossRef]
  30. Agati, G.; Biricolti, S.; Guidi, L.; Ferrini, F.; Fini, A.; Tattini, M. The biosynthesis of flavonoids is enhanced similarly by UV radiation and root zone salinity in L. vulgare leaves. J. Plant Physiol. 2011, 168, 204–212. [Google Scholar] [CrossRef] [PubMed]
  31. Tattini, M.; Galardi, C.; Pinelli, P.; Massai, R.; Remorini, D.; Agati, G. Differential accumulation of flavonoids and hydroxycinnamates in leaves of Ligustrum vulgare under excess light and drought stress. N. Phytol. 2004, 163, 547–561. [Google Scholar] [CrossRef]
  32. Tattini, M.; Guidi, L.; Morassi-Bonzi, L.; Pinelli, P.; Remorini, D.; Degl’Innocenti, E.; Giordano, C.; Massai, R.; Agati, G. On the role of flavonoids in the integrated mechanisms of response of Ligustrum vulgare and Phillyrea latifolia to high solar radiation. N. Phytol. 2005, 167, 457–470. [Google Scholar] [CrossRef]
  33. Lillo, C.; Lea, U.S.; Ruoff, P. Nutrient depletion as a key factor for manipulating gene expression and product formation in different branches of the flavonoid pathway. Plant Cell Environ. 2008, 31, 587–601. [Google Scholar] [CrossRef] [PubMed]
  34. Ollson, L.C.; Veit, M.; Bornman, J.F. Epidermal transmittance and phenolic composition of atrazine-tolerant and atrazine-sensitive cultivars of Brassica napus grown under enhanced UV-B radiation. Physiol. Plant. 1999, 107, 259–266. [Google Scholar] [CrossRef]
  35. Agati, G.; Galardi, C.; Gravano, E.; Romani, A.; Tattini, M. Flavonoid distribution in tissues of Phillyrea latifolia as estimated by microspectrofluorometry and multispectral fluorescence microimaging. Photochem. Photobiol. 2002, 76, 350–360. [Google Scholar] [CrossRef] [PubMed]
  36. Agati, G.; Matteini, P.; Goti, A.; Tattini, M. Chloroplast-located flavonoids can scavenge singlet oxygen. N. Phytol. 2007, 174, 77–89. [Google Scholar] [CrossRef]
  37. Brown, I.; Trethowan, J.; Kerry, M.; Mansfield, J.W.; Bolwell, G.P. Location of components of the oxidative cross-linking of glycoproteins and callose synthesis in papillae formed during the interaction between non-pathogenic strains of Xanthomonas campestris and French bean mesophyll cells. Plant J. 1998, 15, 333–343. [Google Scholar] [CrossRef]
  38. Melidou, M.; Riganakos, K.; Galaris, D. Protection against nuclear DNA damage offered by flavonoids in cells exposed to hydrogen peroxide: The role of iron chelation. Free Radic. Biol. Med. 2005, 39, 1591–1600. [Google Scholar] [CrossRef]
  39. Hernandez, I.; Alegre, L.; Van Breusegem, F.; Munne-Bosch, S. How relevant are flavonoids as antioxidants in plants? Trends Plant Sci. 2009, 14, 125–132. [Google Scholar] [CrossRef] [PubMed]
  40. Ryan, J.A.; Bell, R.M.; Davidson, J.M.; Oconnor, G.A. Plant Uptake of Non-ionic organic chemicals from soils. Chemosphere 1988, 17, 2299–2323. [Google Scholar] [CrossRef]
  41. Babu, A.G.; Kim, J.D.; Oh, B.T. Enhancement of heavy metal phytoremediation by Alnus firma with endophytic Bacillus thuringiensis GDB-1. J. Hazard. Mater. 2013, 250–251, 477–483. [Google Scholar] [CrossRef]
  42. Agati, G.; Azzarello, E.; Pollastri, S.; Tattini, M. Flavonoids as antioxidants in plants: Location and functional significance. Plant Sci. 2012, 196, 67–76. [Google Scholar] [CrossRef] [PubMed]
  43. Mandziuk, A.; Fornal-Pieniak, B.; Stangierska, D.; Parzych, S.; Widera, K. Social Preferences of Young Adults Regarding Urban Forest Recreation Management in Warsaw, Poland. Forests 2021, 12, 1524. [Google Scholar] [CrossRef]
  44. García-Romero, L. Biogeomorphological processes in an arid transgressive dunefield as monitor plant of air pollutions of human impact by urbanization. Sci. Total Environ. 2019, 650, 73–86. [Google Scholar] [CrossRef] [PubMed]
  45. Eom, S.; Jin, C.W.; Park, H.J.; Kim, E.H.; Chung, I.M.; Kim, M.J.; Yu, C.Y.; Cho, D.H. Far infrared ray irradiation stimulates antioxidant activity in Vitis flexuosa THUNB. Berries. Korean J. Med. Crop Sci. 2007, 15, 319–323. [Google Scholar]
  46. Weatherburn, M.W. Phenol-hypochlorite reaction for determination of ammonia. Anal. Chem. 1967, 39, 971–974. [Google Scholar] [CrossRef]
  47. Bates, L.S.; Waldren, R.P.; Teare, I.D. Rapid determination of free proline for water-stress studies. Plant Soil 1973, 39, 205–207. [Google Scholar] [CrossRef]
  48. Ram, S.S. SEMEDS: An important tool for air pollution bio-monitoring. Micron 2012, 43, 490–493. [Google Scholar] [CrossRef] [PubMed]
  49. Ram, S.S. Nuclear Microscopy for Air-Pollutant Characterization and Its Advantages over Traditional Techniques. J. Appl. Spectrosc. 2014, 81, 145–150. [Google Scholar] [CrossRef]
  50. Ram, S.S. Plant canopies: Bio-monitor and trap for re-suspended dust particulates contaminated with heavy metals. Mitig. Adapt. Strateg. Glob. Chang. 2014, 19, 499–508. [Google Scholar] [CrossRef]
  51. Tomašević, M. Heavy metals accumulation in tree leaves from urban areas. Environ. Chem. Lett. 2004, 2, 151–154. [Google Scholar] [CrossRef]
  52. Kar, S. Metallic components of traffic-induced urban aerosol, their spatial variation, and source apportionment. Environ. Monit. Assess. 2010, 168, 561–574. [Google Scholar] [CrossRef]
  53. Neill, S.J. Hydrogen peroxide and nitric oxide as signalling molecules in plants. J. Exp. Bot. 2002, 53, 1237–1247. [Google Scholar] [CrossRef] [PubMed]
  54. Younis, U.Y. Dust Interception Capacity and Alteration of Various Biometric and Biochemical Attributes in Cultivated Population of Ficus carica L. IOSR J. Pharm. Biol. Sci. 2013, 6, 35–42. [Google Scholar]
  55. Bandhu, H. Elemental composition and sources of air pollution in the city of Chandigarh, India, using EDXRF and PIXE techniques. Nucl. Instrum. Methods Phys. Res. Sect. B Beam Interact. Mater. At. 2000, 160, 126–138. [Google Scholar] [CrossRef]
  56. Dadkhah-Aghdash, H. Detection of urban trees sensitivity to air pollution using physiological and biochemical leaf traits in Tehran, Iran. Sci. Rep. 2022, 12, 15398. [Google Scholar] [CrossRef] [PubMed]
  57. Maryum, Z. An overview of salinity stress, mechanism of salinity tolerance and strategies for its management in cotton. Front. Plant Sci. 2022, 13, 935543. [Google Scholar] [CrossRef] [PubMed]
  58. Kondo, T. Absorption of Formaldehyde by Oleander (Nerium indicum). Environ. Sci. Technol. 1995, 29, 2901–2903. [Google Scholar] [CrossRef] [PubMed]
  59. Landi, M.; Tattini, M.; Gould, K.S. Multiple functional roles of anthocyanins in plant-environment interactions. Environ. Exp. Bot. 2015, 119, 4–17. [Google Scholar] [CrossRef]
  60. Clemens, S. Tolerance to toxic metals by a gene family of phytochelatin synthases from plants and yeast. EMBO J. 1999, 18, 3325–3333. [Google Scholar] [CrossRef]
  61. Jozefczak, M. Glutathione Is a Key Player in Metal-Induced Oxidative Stress Defenses. Int. J. Mol. Sci. 2012, 13, 3145–3175. [Google Scholar] [CrossRef]
  62. Hare, P.D. Proline synthesis and degradation: A model system for elucidating stress-related signal transduction. J. Exp. Bot. 1999, 50, 413–434. [Google Scholar] [CrossRef]
  63. Kavi Kishor, P.B. Regulation of proline biosynthesis, degradation, uptake and transport in higher plants: Its implications in plant growth and abiotic stress tolerance. Curr. Sci. 2005, 88, 424–438. [Google Scholar]
  64. Ashraf, M.; Foolad, M.R. Roles of glycine betaine and proline in improving plant abiotic stress resistance. Environ. Exp. Bot. 2007, 59, 206–216. [Google Scholar] [CrossRef]
  65. Yancey, P.H. Living with Water Stress: Evolution of Osmolyte Systems. Science 1982, 217, 1214–1222. [Google Scholar] [CrossRef] [PubMed]
  66. Jaleel, C.A.; Manivannan, P.; Sankar, B.; Kishorekumar, A.; Gopi, R.; Somasundaram, R.; Panneerselvam, R. Changes in biochemical constituents and induction of early sprouting by triadimefon treatment in white yam (Dioscorea rotundata Poir.) tubers during storage. J. Zhejiang Univ. Sci. B 2007, 8, 283–288. [Google Scholar] [CrossRef] [PubMed]
  67. Verbruggen, N.; Hermans, C. Proline accumulation in plants: A review. Amino Acids 2008, 35, 753–759. [Google Scholar] [CrossRef] [PubMed]
  68. Rai, P.K. Impacts of particulate matter pollution on plants: Implications for environmental biomonitoring. Ecotoxicol. Environ. Saf. 2016, 129, 120–136. [Google Scholar] [CrossRef] [PubMed]
  69. Sharma, P.; Jha, A.B.; Dubey, R.S.; Pessarakli, M. Reactive oxygen species, oxidative damage, and antioxidative defense mechanism in plants under stressful conditions. J. Bot. 2012, 2012, 217037. [Google Scholar] [CrossRef]
  70. Karmakar, R.; Padhy, P.K. Antioxidant defense and heavy metal accumulation in plants grown on contaminated soil by automobile exhaust. Environ. Sci. Pollut. Res. 2019, 26, 28327–28341. [Google Scholar]
  71. Kelemen, D.; Tóth, B.; Kovács, B. Effect of heavy metals on the root growth and oxidative stress of oak species. Cent. Eur. For. J. 2015, 61, 178–184. [Google Scholar]
  72. Havaux, M.; Kloppstech, K. The protective functions of carotenoid and flavonoid pigments against excess visible radiation at chilling temperature investigated in Arabidopsis npq and tt mutants. Planta 2001, 213, 953–966. [Google Scholar] [CrossRef]
  73. Popek, R.; Łukowski, A.; Bates, C.; Oleksyn, J. Particulate matter, heavy metals and polycyclic aromatic hydrocarbons accumulation on the leaves of Tilia cordata Mill. in five Polish cities with different level of air pollution. Int. J. Phytoremediat. 2017, 19, 1134–1141. [Google Scholar] [CrossRef]
  74. Mandal, M.; Popek, R.; Przybysz, A.; Roy, A.; Das, S.; Sarkar, A. Breathing fresh air in the city: Implementing avenue trees as a sustainable solution to reduce particulate pollution in urban agglomerations. Plants 2023, 12, 1545. [Google Scholar] [CrossRef] [PubMed]
  75. Łukowski, A.; Popek, R.; Karolewski, P. Particulate matter on foliage of Betula pendula, Quercus robur, and Tilia cordata: Deposition and ecophysiology. Environ. Sci. Pollut. Res. Int. 2020, 27, 10296–10307. [Google Scholar] [CrossRef] [PubMed]
  76. Hrotkó, K.; Gyeviki, M.; Sütöriné, D.M.; Magyar, L.; Mészáros, R.; Honfi, P.; Kardos, L. Foliar dust and heavy metal deposit on leaves of urban trees in Budapest (Hungary). Environ. Geochem. Health 2021, 43, 1927–1940. [Google Scholar] [CrossRef] [PubMed]
  77. Simon, E.; Baranyai, E.; Braun, M.; Cserháti, C.; Fábián, I.; Tóthmérész, B. Elemental concentrations in deposited dust on leaves along an urbanization gradient. Sci. Total Environ. 2014, 490, 514–520. [Google Scholar] [CrossRef] [PubMed]
  78. González, J.A.; Prado, F.E.; Piacentini, R.D. Atmospheric dust accumulation on native and non-native species: Effects on gas exchange parameters. J. Environ. Qual. 2014, 43, 801–808. [Google Scholar] [CrossRef] [PubMed]
Figure 1. Location of Młociny Urban Forest with samples from Warsaw.
Agriculture 14 01750 g001
Figure 2. Climate environment information; date from June 2023 for Młociny Forest (wind speed—green color in the day, red color—in the night) https://infometeo.pl/lomianki (accessed on 17 September 2024).
Agriculture 14 01750 g002
Figure 3. The location of the samples from the source of the transport pollution (road) in the Młociny Urban Forest (* samples of Festuca ovina).
Agriculture 14 01750 g003
Figure 4. Festuca ovina L.; example of plant sample collection.
Agriculture 14 01750 g004
Figure 5. Example of sample prepared for SEM examinations.
Agriculture 14 01750 g005
Figure 6. The total flavonoid content (mg rutine·g−1 DM) in Festuca ovina depending on the distance from the source of the pollution. The leaves (uppercase letters) and roots (lowercase letters) were analysed separately. The letters represent the statistical differences (α ≤ 0.05) between the treatments.
Agriculture 14 01750 g006
Figure 7. The total ammonium content (µmol·g−1 DM) in Festuca ovina depending on the distance from the source of pollution. The leaves (uppercase letters) and roots (lowercase letters) were analysed separately. The letters represent the statistical differences (α ≤ 0.05) between the treatments.
Agriculture 14 01750 g007
Figure 8. The free proline content (μg·g−1 DM) in Festuca ovina depending on the distance from the source of pollution. The leaves (uppercase letters) and roots (lowercase letters) were analysed separately. The letters represent the statistical differences (α ≤ 0.05) between the treatments.
Agriculture 14 01750 g008
Figure 9. Examples of analysed areas of leaf and various types of dust particles; 1—plagioclase, 2—organic matter, 3—steel particle, 4—quartz, 5—organic matter.
Agriculture 14 01750 g009
Figure 10. Examples of organic and inorganic particles.
Agriculture 14 01750 g010
Figure 11. Example of image collected for analysis (arrows mark some of the dust particles).
Agriculture 14 01750 g011
Figure 12. The concentration of dust particles depending on the distance from the road.
Agriculture 14 01750 g012
Disclaimer/Publisher’s Note: The statements, opinions and data contained in all publications are solely those of the individual author(s) and contributor(s) and not of MDPI and/or the editor(s). MDPI and/or the editor(s) disclaim responsibility for any injury to people or property resulting from any ideas, methods, instructions or products referred to in the content.

