Abstract
Rice production remains highly dependent on nitrogen (N). There is no positive linear correlation between N concentration and yield in rice cultivation because an excess of N can unbalance the distribution of photo-assimilates in the plant and consequently produce a lower yield. We intended to study these imbalances. Remote sensing is a useful tool for monitoring rice crops. The purpose of this study was to evaluate the effectiveness of using remote sensing to assess the impact of N applications on rice crop behavior. An experiment with three different doses (120, 170 and 220 kg N·ha−1) was carried out over two years (2021 and 2022) in Valencia, Spain. Biomass, Leaf Area Index (LAI), plants per m2, yield, N concentration and N uptake were determined. Moreover, reflectance values in the green, red, and NIR bands of the Sentinel-2 satellite were acquired. The two data matrices were merged in a correlation study and the resulting interpretation ended in a protocol for the evaluation of the N effect during the main phenological stages. The positive effect of N on the measured parameters was observed in both years; however, in the second year, the correlations with the yield were low, being attributed to a complex interaction with climatic conditions. Yield dependence on N was optimally evaluated and monitored with Sentinel-2 data. Two separate relationships between NIR–red and NDVI–NIR were identified, suggesting that using remote sensing data can help enhance rice crop management by adjusting nitrogen input based on plant nitrogen concentration and yield estimates. This method has the potential to decrease nitrogen use and environmental pollution, promoting more sustainable rice cultivation practices.
1. Introduction
World food security is strongly dependent on the rice crop, which represents the largest caloric intake for humans [1]. Since the 1980s, the expansion of rice cultivated area decreased due to an improvement in rice yield [2], and as a result, crop yield became the determining variable in the maintenance of food security [3]. The United Nations predicts a linear increase in population until 2050; however, over the last few decades, rice yield increase has been stagnant [2]. In the new century, the concept of a Second Green Revolution has arisen, a movement that aims to continue increasing yield without altering the sustainability of the planet (Sustainable Agriculture) [4]. Rice production remains highly dependent on nitrogen (N) [5]. Nowadays, it is necessary to reduce the use of N [6], as excessive use can lead to an increase in Greenhouse Gases (methane, NO2) and nitrate pollution of water [7]. Moreover, from an economic perspective, N fertilizers are products with a volatile price [8].
Crop modelling has attempted to evaluate the effect of N on yield [9], with the objective of modifying crop management based on its variability [10,11,12,13]. Uncontrolled system variables (temperature, humidity, pest and disease incidence, weeds, water supply, soil properties, etc.) can interact with N rates in different ways, altering crop ecology and yield [14]. This variability on many occasions is a limiting factor for achieving a high average yield [15,16,17].
Classically, a multitude of crop field parameters were determined in order to evaluate the effect of N and its efficiency. The acquisition of continuous, non-discrete measurements in the field is complex; therefore, alternatives were designed to obtain them [18]. An alternative widely used parameter is remote sensing in the solar spectrum. The reflectance of the green, red, and NIR bands is correlated with the use of solar radiation by the plant canopy. Depending on how this radiation in each spectral band is reflected, the effect of N on the crop could be evaluated [19]. Green biomass and crop photosynthetic capacity are correlated with remote sensing data and N content [20]. Several studies have used satellite data to monitor N in vegetation canopies [21,22,23]. In radiometric measurements, including reflectance, Vegetation Indices (VIs) such as NDVI, GNDVI, or indices derived from the red edge spectral bands have been used [24,25,26]. In rice crops, a quadratic correlation has been found between N (concentration and uptake) and most of the VIs [27]; the phenomenon of index saturation has been used to justify these correlations [28]. Wang et al. (2012) [29] obtained a linear correlation, avoiding the saturation of the VIs with a new index formed by three spectral bands. In other similar crops, such as wheat, the estimation of canopy N has also been studied; using the red edge bands, new indices were elaborated upon, looking for a linear relationship with the VIs [30,31,32]. One of the applications of these models or indices is that the N dose applied within the field can be modified [33,34,35]. However, the use of linear relationships or artificial intelligence can result in over-fitted models or difficult agronomic interpretation, limiting their applicability [36,37,38].
The use of vegetation indices has provided a solution to the low temporal and spatial resolution of the previous satellites, facilitating crop monitoring [39]. With the new Sentinel-2 mission, the applicability of spectral reflectance, without combination in a VI, has been demonstrated as a decisive fact [15,37,40,41]. In rice cultivation, the evolution and correlation of reflectance in the visible and NIR bands were demonstrated as an optimal technique for the evaluation of crop yield performance during the crop season prior to harvest [42].
Satellite data provide a simple and free tool to monitor crop growing, as the measured reflectance includes the consequences of both controlled variables (N dose) and uncontrolled variables [43]. The effect of N on crop and yield could be different in each year and field location due to the random effect of uncontrolled variables (mainly climatic conditions), as proposed by Liu et al. (2019) [44], comparing a year of normal temperatures with a year of high temperatures. The scientific literature is focused on using satellite data to understand the N content of the rice crop [45]; however, its effect on the plant and yield is usually not considered. Thus, the purpose of this study is to evaluate the effectiveness of using remote sensing data with Sentinel-2 at 10 m spatial resolution to assess the impact of N applications on rice crop performance and yield prior to harvest, and to define a method for monitoring rice crop as a predictive tool of anomalies on plant N nutrition, according to the critical phenological stages (Figure S1).
2. Materials and Methods
2.1. Location Description
The study was carried out throughout 2021 and 2022 in a traditional rice-producing area at sea level (Albufera wetland; N 39°16′59.99″; W 0°22′0.01″), in the coastal region of Valencia (Spain), (see Figure S2). The coastal wetland of Albufera has an area of 211.2 km2 and is bordered by the Turia and Jucar rivers. This area can be considered as a homogeneous rice planting area, approximately 15,000 ha of rice are cultivated [40]. Rice is sown in the last weeks of May and harvested during September and October, cultivars are typically of short and medium grain. JSendra cultivar (medium grain) represents approximately 60% of the planted area. The soil is sandy loam with pH: 8.0, organic matter: 3.0%, and electrical conductivity (EC): 3.2 dS·m−1. The irrigation water comes from Albufera Lake and has no rice crop restrictions regarding salinity (pH: 7.3; EC: 3.1 dS·m−1), according to Ayer and Westcott (1994) [46].
Papadakis’ agroclimatic classification system defines the climate in this area as subtropical Mediterranean with hot and dry summers [47]. Figure 1 shows the daily evolution of temperature (T) and relative humidity (RH) in 2021 and 2022, recorded by a datalogger (Onset HOBO and InTemp Data Loggers). In addition, from the recorded data, according to the methodology recommended by Allen et al. (1998) [48], the Vapor Pressure Deficit (VPD) for each day was obtained. The evolution of both years is shown in Figure 2, very high values of VPD (>2 kPa) were reached in 2022 at initial phenological stages. Table 1 shows the averages of temperatures, RH, and VPD in the comparison of both years. The comparison was performed for the entire crop season and for the days prior to field sampling (0–47 DAS, where DAS = Days After Sowing). The year 2022 was hotter and drier than 2021. According to Krishnan et al., (2011) [49], the ideal average daily temperature for crop growth ranges from 22 to 28 °C; maximum temperatures should not exceed 35 °C, while at night, temperatures higher than 22 °C could stress the plants due to a high respiration rate. Relative humidity values lower than 30% would also cause stress due to stomatal closure, and values higher than 90% could increase the incidence of fungal diseases. Thus, Figure 1 and Figure 2 show a higher number of optimal days with optimal temperatures and RH in 2021 compared to 2022.
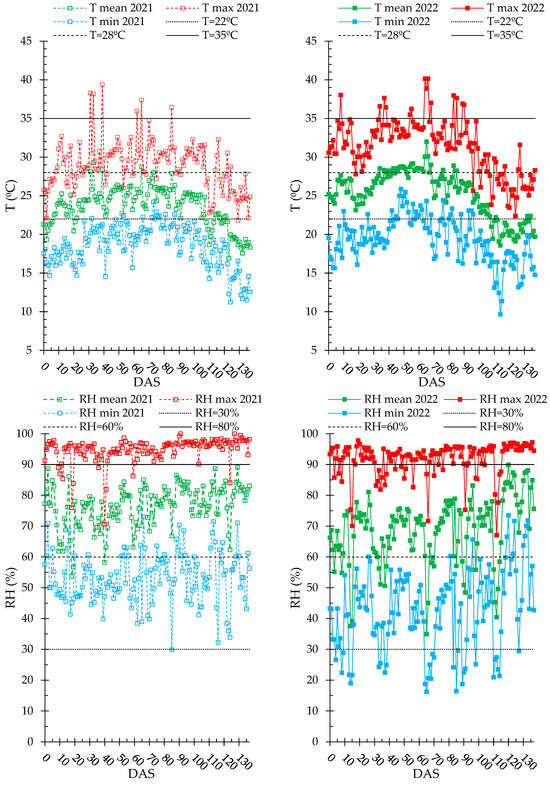
Figure 1.
Maximum (T max), mean (T mean) and minimum (T min) temperatures; maximum (RH max), mean (RH mean) and minimum (RH min) relative humidity from sowing to harvest in the experimental plot area in 2021 and 2022. DAS = Days After Sowing.
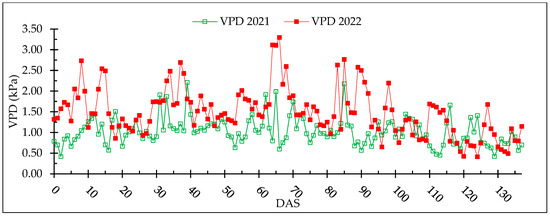
Figure 2.
Daily evolution of the VPD value in each year. DAS = Days After Sowing.

Table 1.
Mean values of maximum (T max), mean (T mean) and minimum (T min) temperatures; maximum (RH max), mean (RH mean) and minimum (RH min) relative humidity for the whole season (left) and for the first 47 days of the season (right).
2.2. Experimental Design
The JSendra cultivar was cultivated in this experiment. Three N doses were tested: 120 kg N·ha−1 (N1), 170 kg N·ha−1 (N2), and 220 kg N·ha−1 (N3). These doses were chosen based on the legal recommendations established for rice cultivation in Albufera Natural Park by environmental restrictions (see Figure S2). Other nutrient elements were applied in agreement with the recommendations of Osca (2013) [50].
Currently, the state legislation says: “To achieve a more environmentally sustainable rice production in Valencia, nitrogen fertilization is limited to 170 Nitrogen Fertilizer Units (FNU). However, to maintain the economic sustainability of the agricultural system, it is necessary to understand the productive response of the different varieties to nitrogen fertilization to find the optimum dose in each case”. N was applied 7 days before sowing into a single 2.5 ha field, following a randomized block experimental design, with 3 replications of 2778 m2. Three samples per replication dose were taken 47 days after sowing, a critical time in accordance with Franch et al. (2021) [40] and San Bautista et al. (2022) [42], at uniform distances (25%, 50%, and 75% of the field length, in the center line of each plot). In each sampling point, the area analyzed was 0.5 m2, and plant samples were collected at the end of tillering, a critical phenological stage to achieve high yields and monitor plant growth using remote sensing data. The number of fertile tillers affects the yield of the JSendra variety and, so, it is important to evaluate the crop performance at this crop phenological stage [42]. Nitrogen application was carried out with a centrifugal fertilizer spreader.
Water management was carried out by flooding (gravity) the fields to a depth of 10–15 cm, as described by San Bautista et al. (2022) [42], in both years. The water sheet was maintained at about 12 cm throughout all seasons, except for drying periods. Sowing was performed under flooded conditions (2–3 cm of water sheet) on 4 June 2021, and 9 June 2022, and the phenological stage were coincident in both years. Figure 3 shows the crop phenology and flooding periods. Weed and pest management followed common grower practices and recommendations of Osca (2013) [50].
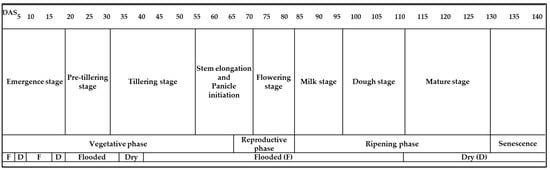
Figure 3.
Timing of the main phenological stages of rice in Valencia until harvest (DAS: Days After Sowing). The last row represents water management. Adapted from San Bautista et al. (2022) [42].
2.3. Data
2.3.1. Yield Data
The harvest was on October 19 for 2021 and October 24 for 2022. Yield values were obtained by the Deutz-Fahr B9306 TSB combine, equipped with Yield Trakk yield monitoring software (Topcon company, Tokyo, Japan), capable of measuring crop yield in real-time. The cutting width used by the harvester was 7.6 m, providing continuous yield data (approximately every one meter). The processing of these yield maps was carried out according to the methodology described in Franch et al. (2021) [40]. The yield map was transferred to a grid composed of 100 m2 polygons (coinciding with the spatial resolution of the satellite), obtaining the average within each of them. All the computational transformation and data processing was carried out with the QGIS 3.10 software.
2.3.2. Crop Growth Indices and Plant N
Aboveground Biomass (AGB), Leaf Area Index (LAI), and plants per unit area (plants per m2) were measured in each sample at 47 DAS. Biomass was measured after drying at 105 °C for 48 h. The LAI was obtained using the image analysis program ImageJ 1.53v(ImageJ software, 2023). The leaves were separated and then photographed on a white background, pressed with transparent glass, and then the images were loaded into ImageJ, quantifying the green surface of the photo; finally, the LAI was obtained. N concentration (%) of stem and leaves was analyzed with the Kjeldahl method, and the N content of the stem and leaves in kg N ha−1 (N uptake) was also obtained as a result of the product between the aboveground biomass and the N percentage. Nitrogen Use Efficiency (NUE) was obtained as yield relative to the amount of N applied [51].
2.3.3. Remote Sensing Data
Satellite images obtained by the Multi-Spectral Instrument (MSI) on board the Sentinel-2A/B constellation of tile T30SYJ were used. Sentinel-2 (S2) captures images of the Earth’s surface in 13 spectral bands; from these, the bands with the highest spatial resolution (10 m) were considered in this study: green (≈560 nm), red (≈665 nm) and near-infrared (NIR) (≈842 nm). The blue band was excluded from the study since it shows higher inaccuracy given its higher dependence on residual aerosol content after the atmospheric correction [52,53,54]. The small size of rice fields in Spain and in large parts of the world [55] makes it difficult to use the bands at 20 m (red edge and SWIR); for this reason, it is necessary to exploit the information of the bands of higher spatial resolution (10 m). The NDVI (Normalized Difference Vegetation Index, Equation (1)), which relates NIR and red reflectance, was used as a reference value for the final protocol [56]. Cloud-free images from sowing to harvest in 2021 and 2022 were processed. For this study, the dates coincident in both years were selected, according to days after sowing and phenology. Table 2 shows the dates and phenological stage of the crop. In 2021, no images were available during flowering; other studies have shown a low correlation between crop parameters and reflectance during this period [40,57,58]. Therefore, crop monitoring using satellite imagery during the heading date could be irrelevant. Similarly, the images available in the first 20 days of cultivation were not coincident. However, the dominance of water and soil over the crop in this period would not allow either correct monitoring [42,59]. Finally, in the dough stage, the dates differ by 5 days, which was considered negligible.
Table 2.
Satellite dates used in the study with their equivalence in Days After Sowing (DAS) and phenological stage.
For each sampling point, the average reflectance within a 20 m radius was obtained, considering the uncertainty that Sentinel-2 may present. The downloaded product was level 2A, which provides surface reflectance.
2.4. Statistical Analysis
The proposal for monitoring rice crops as a predictive tool of anomalies in plant N nutrition includes four levels of analysis, distributed in layers as presented in Figure 4. In the first term, the crop growth indices, plant N, and yield (measured in the field) were considered. The effects of the main factors (N dose and year) were partitioned using ANOVA (Analysis of Variance). Mean separations were performed using the least significant difference (LSD) test at p < 0.05. Variations between parameters were fitted to the first-order equation using a least square fitted method. Similarly, the satellite data (reflectance and vegetative index) were analyzed in the second layer using ANOVA and LSD (second layer). In a third layer or analysis level, the correlations between the values of layer 1 and layer 2 were determined for all available dates; the values of each dose were combined, aiming in this study the joining of both layers in correlation models. Finally, the protocol for N effect evaluation was built using a fourth analysis level or layer, and in this case, the NDVI was characterized. Red–NIR correlation, based on San Bautista et al. (2022) [42] is a useful tool for crop monitoring. The novelty in this new proposal is the incorporation of combined yield registered in the red–NIR dynamics, considering also three key moments in crop nutrition (tillering, stem elongation and ripening). The proposed procedure aims to establish a relationship between red–NIR and NIR–NDVI, using Sentinel pixel for each estimated yield and nitrogen dose in different N content and years before stem elongation and panicle initiation [40]. This approach will allow us to detect anomalies in plant growth and suggest adjustments to crop management practices related to plant nutrition for rice plants.
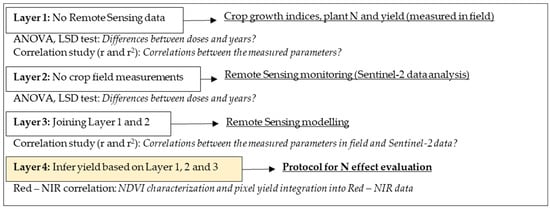
Figure 4.
Workflow carried out in this article for the construction of the protocol for N effect evaluation.
In terms of digitization footprint, layer 1 was formed by manual data measured in the field and laboratory and sensor data acquired by the combine harvester, the required storage and processing speed of the computer were not extremely demanding, and the data volume was inferior to 4000 MB, mainly due to LAI pictures. In layer 2, Sentinel-2 data were obtained using the Google Earth Engine platform, which reduces the size of data by downloading a region of interest (ROI) and the bands and dates considered (a 0% cloud mask was implemented within the ROI), resulting in 0.1 MB. All layers were processed with Statgraphics Centurion 19 and QGIS 3.10 software, and the amount of data from layers 1 and 2 were merged into numerical data matrices of less than 1 MB for layers 3 and 4. Weather data storage was 0.4 MB, providing the sensor with an Excel sheet.
3. Results
3.1. Crop Growth Indices, Plant N, and Yield
The results of the measured parameters in field and laboratory, as well as the yield values, are shown in Table 3. For each year, the biomass increased with the N dose, being more important than the effect of N in 2021. The effect on N concentration differed between years; in 2021, no statistically significant differences were found, while in 2022, N2 and N3 doses exhibited higher values of N concentration in plants (p < 0.01). N uptake increased with N dose in both years (p < 0.01) in a similar way. LAI values also increased with the N dose in 2021, but in 2022, no statistically significant differences were found. This effect on LAI was similar to the yield. Thus, in 2021, the yield increased with the dose of N, while in 2022 no significant differences were found. Plants per m2 were lower at the lowest dose (N1) in 2021, but in 2022 this behaviour was the opposite, and plants per m2 were higher in N1. Open field conditions could modify the effect of N, appearing in some uncontrollable and complex interactions (weather, soil, weeds, water supply, etc.). For this reason, the yield per plant and the biomass per plant were obtained. In this comparison, there were no significant differences in the year 2021, whereas, in the year 2022, significant differences could be found, meaning that, yield and biomass per plant in the year 2022 increased with the N dose. The year 2022 was extremely dry and hot, as stated in Materials and Methods (Table 1), as a consequence, the comparison between years showed a higher AGB, LAI, and yield in the year 2021; however, the N concentration was higher in the year 2022. Finally, the N uptake, plants per m2, and yield per plant did not differ statistically between years. These differences between years were also noted in the yield/AGB ratio, considered an early harvest index during the vegetative phase. In the year 2021, a lower yield/AGB ratio was obtained, with the biomass at 47 DAS, very similar to the final yield value; nevertheless, in the year 2022, the biomass during tillering was considerably lower than the final yield. Finally, in each year, the lowest N dose exhibited the highest efficiency between yield and biomass.
Table 3.
Crop growth indices, plant N, and yield results for N dose and year.
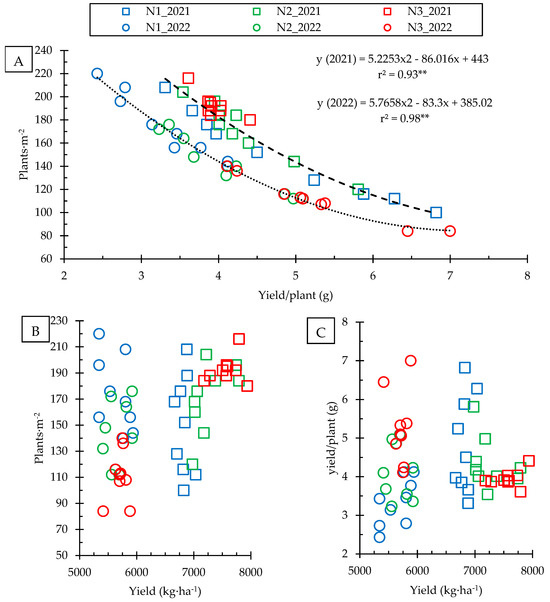
Of the aforementioned results, a special mention should be addressed to the values of plants per m2 and yield per plant. In the year 2021, the highest number of plants was found in N3; however, for the year 2022, it was the opposite, finding in N3 the lowest number of plants. This phenomenon, attributed to uncontrolled field variables, provoked significant changes in yield values per plant. Thus, while in 2021, the differences in yield per plant between treatments were not significant, the differences were significant in 2022, when the higher N dose resulted in a higher yield per plant. In the comparison between years, the differences are statistically significant in the N1 and N3 doses (p < 0.05), and the N1 dose in 2021 showed a higher yield per plant (probably due to the lower number of plants) than the same dose in 2022. On the other hand, the N3 dose showed a higher yield per plant in 2022 (probably also due to a lower number of plants). No significant differences between years were found at the N2 dose. The interaction between the number of plants and yield per plant is evident in Figure 5A. A quadratic adjustment between both is shown for each studied year. In 2022, despite the lower number of plants, the yield per plant did not increase. The N2 and N3 doses showed a yield per plant similar to the maximum in 2021. According to Figure 5B, which shows the yield in terms of plants per m2, and Table 3, a higher dose of N increased the yield in the points with a high number of plants in 2021; but this result cannot be contrasted in 2022, where the number of plants in N2 and N3 was lower. Figure 5C demonstrated that yield per plant was no higher than 7 g plant−1. The result obtained in 2022 is remarkable—a higher yield per plant was insufficient to increase the yield of the N3 dose with respect to N1. In summary, the lower number of plants in the year 2022 resulted in an increase in yield per plant in N3, but this was not enough to improve yield.
The correlation between each measured parameter is shown in Table 4. In both years, no correlation was found between AGB and N concentration, whereas, this correlation was significant between AGB and N uptake (p < 0.05), as well as between N uptake and N concentration. For the remaining parameters, there were differences between years. In 2021, the correlations for LAI and yield were statistically significant, excluding N concentration and the number of plants. In contrast, in 2022, LAI and yield showed no significant correlation with the other variables. Similarly, plants per m2 showed a significant correlation with AGB and LAI in 2021. However, in 2022, no correlation was found; the only significant correlation was found between the number of plants and %N (negative correlation). Finally, in the last row of Table 4, the r2 value is shown for the model between the yield and the linear combination of the other variables (without satellite data). In the year 2021, the r2 was high (r2 = 0.82) and considerably higher compared to 2022 (r2 = 0.28).
Table 4.
Correlation matrix (r) between each of the crop parameters. The last row of the table contains the r2 obtained in a multiple regression model between yield and all other measured parameters.
3.2. Remote Sensing Monitoring
Spectral reflectance time evolutions in the green, red, and NIR bands for each treatment and year are shown in Figure 6. In the visible bands (green and red), total reflectance decreased with the increase in N dose (p < 0.05). However, this pattern differed on some dates. Differences were not observed at 20 days. In the year 2021 the differences appeared at the tillering stage (45 DAS), and these differences were maintained throughout the entire season, being higher between N1 and the other rates in the grain filling and ripening stages. In 2022, no differences between treatments appeared during the vegetative phase (tillering and stem elongation); the differences were found from 85 DAS onwards (grain filling and ripening), and the reflectance decreased with the increase in the N dose, similar to 2021. Comparison between years is particularly interesting. During the vegetative phase (20 to 55 DAS), there were no significant differences between the two years; however, during the grain filling and ripening stages, large differences were observed. The visible reflectance in 2022 was considerably lower, being remarkable at 85 DAS, where the reflectance was similar to the vegetative phase in 2022, while in 2021, the reflectance showed a significant increase.
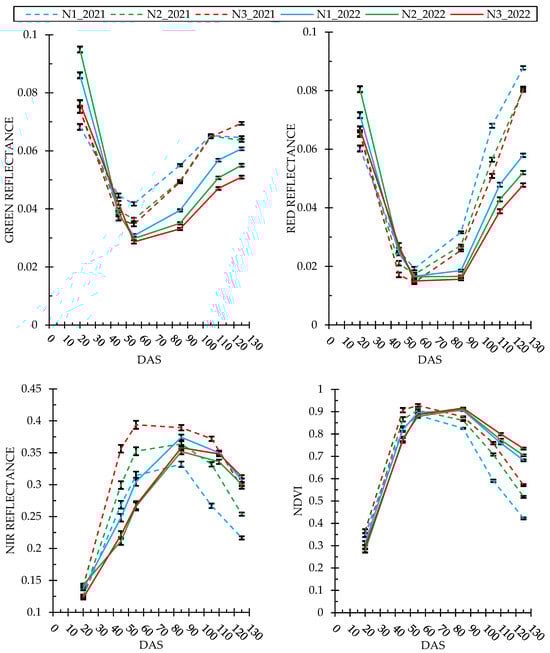
Figure 6.
Time series evolution of the average reflectance for each dose by year. Vertical bars represent the LSD interval (p < 0.05).
In the NIR band, it was also difficult to find a clear pattern at 20 DAS. After this date, in this band, different results were obtained each year. In 2021, reflectance increased with N dose from 45 DAS, and the differences between N1 and the other rates increased at grain filling (similar to visible bands). In 2022, the lowest N dose exhibited the highest reflectance during the vegetative phase, but no differences were observed between N2 and N3. The differences between N1 and N3 disappeared during grain filling and ripening, thus, the NIR season reflectance was similar in the three doses. In the comparison between years, remarkable differences were also observed. In this way, reflectance in the NIR was higher in 2021 during the vegetative phase (mainly 45 and 55 DAS). This difference was reduced during grain filling and ripening when reflectance remained higher only in the 2021 N3 dose. The reflectance in the 2021 N1 and N2 doses dropped below the 2022 values in the last phases of the season (85, 105, and 125 DAS), and more importantly, the decrease in the low dose (N1).
Results from the spectral band data coincided with NDVI values. Figure 6 shows the temporal evolution of this index for each dose and year. In the year 2021, differences were uniform among the three doses, increasing NDVI value with increasing N applications, and a sharp drop in N1 dose at grain filling was also observed. In 2022, the crop performance was different. In the vegetative phase, the value of NDVI was slightly higher in N1. However, during grain filling and ripening, this performance changed, increasing the value of NDVI with the N dose, as happened in 2021. Overall differences between years were also observed with the NDVI; during the vegetative phase (45 DAS), the highest values were registered in 2021, but this tendency was modified in the grain filling and ripening stages when values in 2022 surpassed those registered in 2021.
3.3. Remote Sensing Modelling
The correlation study between the green, red, and NIR spectral bands and each of the measured parameters is shown in Figure 7 for both years. In this analysis, the results revealed clear differences between years. In 2021, most of the parameters showed an optimal correlation with satellite data, especially at the date close to the sampling (45 DAS). The visible bands were negatively correlated on all dates, with the exception of the first date for green and red and the last one for Green. In the NIR band, significant correlations were positive on all dates. Plants per m2 and N concentration were the variables that exhibited the lowest correlation in that year, while yield showed the highest correlation in all bands. The results in 2021 were consistent with the findings of the previous sections. Thus, a lower reflectance value in the green and red bands was correlated with a high yield value, N uptake, biomass, and LAI, whereas the correlation for plants per m2 and N concentration was lower. In the NIR band, a higher value was correlated with an increase in the measured parameter values. On the other hand, in 2022, the correlations were low and highly variable. During the vegetative phase, the correlations were low; only biomass and N uptake showed a similar correlation to 2021 in the visible bands, but this trend disappeared in the grain filling and ripening stages. In these bands, the negative correlation for N concentration and LAI took significant values at distant dates from sampling; similarly, in the NIR, the %N was negatively correlated with reflectance after the sampling date. The number of plants in 2022 did not show any correlation in the vegetative phase, but during the grain-filling and ripening stages, positive correlations were found in the green and red bands (a higher number of plants resulted in a higher reflectance in the visible bands). There was no correlation in the NIR band. The correlation with yield and bands in 2022 followed a similar behaviour in the three bands; on the first date (20 DAS), the correlations were negative. However, these correlations disappeared in the middle dates of the season and turned positive at ripening, being significant in the NIR band.
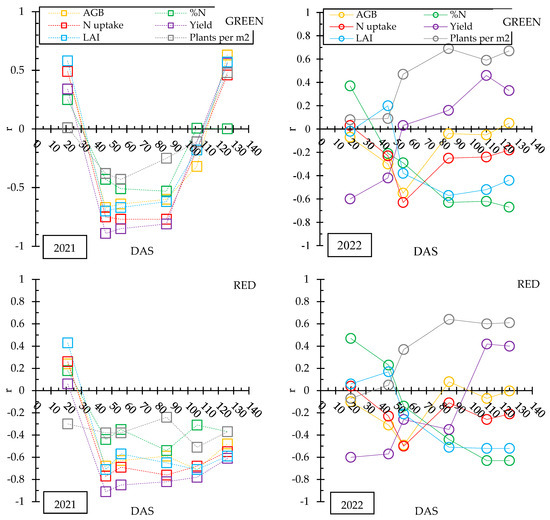
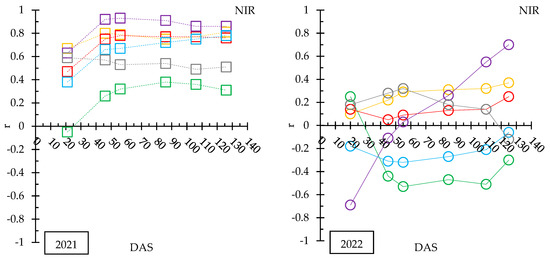
Figure 7.
Evolution of coefficient correlation (r) between measured parameters and reflectance per band and year (2021, (left); 2022, (right)). Correlations are statistically significant at p < 0.05 for r > |0.5|.
3.4. Protocol for N Effect Evaluation
The temporal evolution of the correlation coefficient between the red band and the NIR in both years is shown in Figure 8. The correlation was inconsistent at the first date, differing between years. Thus, in 2021, the correlation was non-significant, while in 2022, the correlation remained positive. For 45 and 55 DAS, the two years showed a similar pattern: the correlations were negative and significant, being slightly higher in 2021. However, the main differences between years occurred in the grain filling and maturity stages (85, 110, and 125 DAS). In 2021, the correlation was maintained at these three dates, with the maximum value of the entire season at 110 DAS. On the contrary, the correlation disappeared in the year 2022, red and NIR showed no correlation.
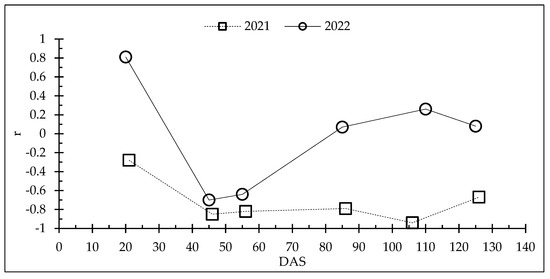
Figure 8.
Time evolution of the correlation coefficient (r) between the red and NIR bands in both years (2021 and 2022). Correlations are statistically significant at p < 0.05 for r ≥ |0.64|.
In order to identify discontinuities in the correlation between red and NIR bands across years, the dynamics for the two selected dates (45 and 85 DAS) and also for the 55 DAS were analyzed considering the N dose as an unknown variable. In Figure 9 each pixel was classified according to its yield measured by a combine harvester. On the left side of Figure 9, the red–NIR dynamics are shown for the first date (45 DAS), the adjusted line between years was very similar, although in the year 2022, reflectance values were lower, and all pixels were in a similar line adjustment. For 55 DAS, differences in the adjustments were found. The same NIR value corresponded to a different red value depending on the studied year. These differences increased at 85 DAS, and the functions were completely different. In most cases, the interpretation of the red–NIR dynamics can be challenging due to the measurement saturation in the red band, which takes values very close to zero. For this reason, the NDVI index was used, as shown on the right side of Figure 9, this index could be an indicator of crop phenology and the fraction of Absorbed Photosynthetically Active Radiation (fAPAR) by canopy, as it was demonstrated by Mosleh et al. (2015) [60] and Myneni and Williams (1994) [61]. In this sense, the x-axis would be a normalized indicator of the photosynthetic crop state and its phenology. The results in Figure 9 show discontinuities in the relationship between NIR and NDVI, these discontinuities appeared at 55 DAS and were intensified at 85 DAS. The interpretation of the NDVI index was dependent on the NIR value and date. For this reason, the same NDVI value exhibited different NIR values at 55 DAS. At 85 DAS, an NIR value exhibited different NDVI values. According to the yield values and the positive effect of N on yield, and also considering the better weather conditions in 2021, the 2021 adjustments could be considered optimal, with a significant imbalance between NIR and red and NIR and NDVI values in 2022.
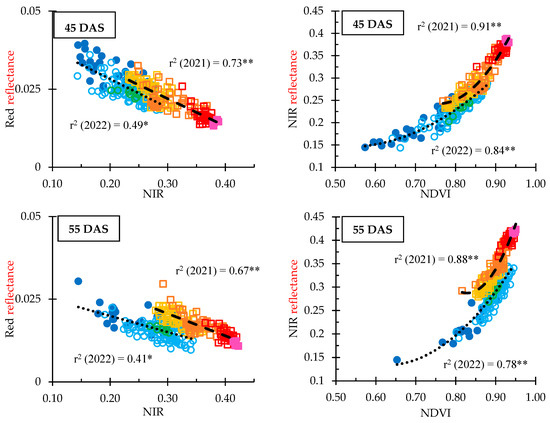
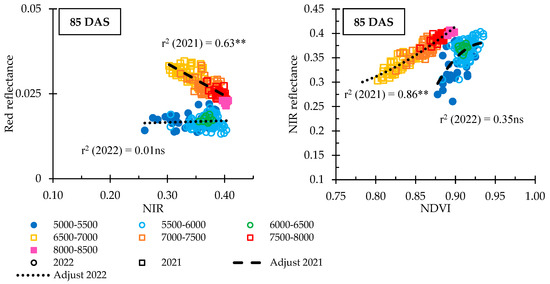
Figure 9.
Red–NIR dynamics and lineal model (left) and NIR–NDVI and quadratic model (right) dynamics as a function of yield range in kg·ha−1, Days After Sowing (45, 55 and 85 DAS) and year (□: 2021; and ○: 2022). **, * and ns: significant at p < 0.01, at p < 0.05 and non-significant.
4. Discussion
The effect of N on rice crops can be highly variable, as shown in this article. Several authors [44,62,63] have studied the effect of N fertilization on yield, obtaining similar results, and also verifying a notable influence of climatic conditions, affecting the partitioning of plant photoassimilates. A complex interrelation between biomass, N content, LAI, plants per m2 and yield was verified. Prior to the use of the satellite data, the dependence of the yield on the other parameters was studied and then the Sentinel-2 values were integrated into a crop management proposal.
4.1. Crop Parameters and Indices
Regarding crop productive parameters, biomass and LAI were affected by N applications, increasing with N dose in 2021; however, in 2022, LAI was not influenced statically by the N supply. In general, these results agree with the scientific literature regarding the effect of N on promoting an increase in these growth indices [64]. The number of rice plants per unit area was correlated positively with the N dose in 2021, but the opposite happened in 2022. Previous studies about rice density in the literature were focused on the determination of the optimum sowing rate, performing comparisons between different values [65,66]. In this work, the sowing rate was uniform in the three treatments and in both years. Nevertheless, anomalies in plant emergence were found. This anomalous emergence was a random phenomenon in the experiment, being an inevitable condition in crop production in open fields [67]. In the first year, the lowest number of plants was encountered at the lowest N dose; however, in the second year, the situation was the opposite, and N failed to improve plant emergence [68,69]. According to Ma et al. (2023) [70] excessive N application of basal fertilizer could reduce seedling emergence in rice crops. Studying the interaction between the density of plants and N dose on yield, N at a high dose with low density resulted in higher yield per plant in 2022, while, in 2021, the low dose of N, combined with a low density, presented a yield per plant similar to the higher dose. However, the total yield with a low N dose in 2021 was higher than the high dose in 2022. These results suggest that the effect of N applications on grain yield per unit area is dependent on the number of plants, according to Takahashi et al. (1976) [71], who reported that in high plant density conditions, plants could uptake the optimal rate of N and increase the rice yield per unit area. Furthermore, a low number of plants would limit the increase in yield per unit area due to biological limitations of the variety or climatic conditions [72]. Thus, in 2022, plants should have shown a considerably higher yield to achieve a similar total yield (per unit area) compared to 2021, in agreement with Counce and Wells (1990) [73]. The yield per biomass ratio was affected by N dose in both years, showing the same plant response to N dose, decreasing with the increase in N supply. In addition, NUE was reduced with the N rate increase in both years and was negatively correlated with N concentration, according to YaoHong et al. (2006) [74]. Therefore, the different performance of rice crops between years regarding N applications is due to climatic conditions independent of the N dose; in other words, the N dose effect in terms of yield per biomass and NUE was similar in both years.
Productive parameters in this experiment in both years could be related to the N uptake of rice plants and concentration in the leaves. The carried-out interrelation is supported by the values of N concentration and uptake. In this sense, a higher number of plants would mean a lower %N in the measured area, the N uptake being independent of the number of plants. N uptake would be dependent on the N dose, with a positive correlation, in both years, according to the increase in biomass, while N concentration was essentially stable, not changing with N applications. Sheehy et al. (2008) [75] attributed this pattern of N to the dilutive effect because an increase in leaf area and biomass causes a decrease in N concentration in the stem and leaf of rice plants. The concept of a critical N-dilution curve for rice yield [76] was studied in order to describe the influence of N applications on grain yield. A negative correlation between N concentration and plant dry matter (biomass) was verified by Li et al. (2022) [77]. In this sense, Ata-Ul-Karim et al. (2014) [78] studied the relationship between biomass and LAI with N concentration on the plant, obtaining a negative correlation between %N and biomass and LAI. Using these models developed by Ata-Ul-Karim et al. (2014) [78] in this rice experiment, a limiting N concentration was obtained for the low N dose in the year 2021, while an optimum N concentration was found in the intermediate and high N dose. In 2022, all treatments exhibited an N concentration higher than the optimum, indicating that biomass and LAI were too low. High temperatures and low relative humidity (excessive VPD) were registered during emergence and tillering in 2022; this phenomenon, as reported by Zhang et al. (2017) [79], reduces plant growth, altering the partitioning and decreasing the number of fertile tillers [80,81]. Therefore, low biomass and LAI obtained in 2022 resulted in high N concentration, and the grain yield and N use efficiency were low due to poor plant growth (low LAI) during emergence and tillering. These results agree with Yulong et al. (2021) [82], who reported an increase in N concentration in rice plants with low N use efficiency. In 2021, the high yields could be explained by the higher values of biomass during emergence and tillering, in agreement with Horie et al. (1997) [83], who correlated high growth during these stages with a greater number of panicles and a greater number of grains per unit area, resulting in a high yield.
4.2. Satellite Data
The pattern of plant response to N supply under defined crop management and environmental conditions was explained in accordance with scientific literature. Rice plant reaction to N applications could be monitored with remote sensing data, identifying anomalies caused by the N effect. Relevant differences between N applications and years were found by analyzing the evolution of the satellite spectral bands. The visible spectral region is characterized by a low reflectance when the chlorophyll concentration is very high [56]. In addition, the N concentration is strongly correlated with chlorophyll content [84]. Therefore, a higher leaf N percentage would be indicative of a darker green color in plants. In this experiment, reflectance in visible bands maintained lower values in 2022 than in 2021, denoting a higher concentration of chlorophyll and, consequently, a higher N concentration. The visible reflectance was similar during the first stage of the vegetative phase, in both years. The differences between years were remarkable during grain filling and ripening, in 2022, a higher N dose resulted in a lower crop reflectance in the visible bands, resulting in a prolonged canopy greenness in these stages. In 2021, compared to 2022, the visible bands showed a high negative correlation with yield, which would mean an optimal balance between chlorophyll concentration and vegetative growth, in other words, an adequate N translocation from stem and leaves to grains, one of the main reasons for high NUE values obtained in this year compared to 2022 [74]. On the other hand, the NIR band would be the best parameter to infer yield [40] and could be used to monitor crop rice management [42]. In this band, reflectance is increased with a greater number of reflecting plant surfaces [85], so NIR reflectance increases with the number and size of leaves. This phenomenon explains the positive correlation between the NIR band and LAI or biomass [86,87]. The increase in the number and size of leaves demands an optimal chlorophyll content but also appropriate climatic conditions for high net photosynthesis [88]. In recent years, extreme climatic events around the world have evidenced problems in crops, reducing yields as a consequence of high temperatures [89]. The balance between energy or carbohydrates consumed in cellular respiration and that consumed in the accumulation of dry matter for vegetative and grain growth is negatively disrupted, reducing net photosynthesis [90]. The increase in net photosynthesis is considered relevant in higher plant yields and a critical aspect of the Second Green Revolution [91]. In this sense, high values in the NIR band would be necessary to obtain the maximum yield, but plants would require optimal environmental conditions to achieve a highly productive response. These relationships between NIR and yield can be checked in the results of this experiment. The highest NIR value was recorded at the highest dose of N and the highest yield was recorded at the same dose in the year 2021. Nevertheless, these correlations disappeared in 2022, showing low values of NIR during the vegetative stage. These higher NIR values in 2021 were registered during stem elongation, a crucial moment in determining the number of fertile tillers and the panicle size [83].
4.3. Monitoring Rice Crop Proposal
Crop monitoring using remote sensing could be improved with the correlation study between red and NIR, and between NIR and NDVI [92]. Visible bands (green and red) present a similar interpretation, i.e., both bands decrease in reflectance due to increased chlorophyll content. The reflectance in the green band is higher due to a lower radiation absorption. However, its behavior is still influenced by the chlorophyll content, as Hatfield et al. (2008) [56] described. Therefore, correlation coefficients between red and green bands are highly positive (see Table S1), as long as the greenness of the plants is maintained, and the collinearity between bands indicates an excess of variables when both bands are combined. On the other hand, the loss of greenness is not usually considered in the red-green study; correlations are not evident in phenological stages close to harvest (plants change to a yellow color, modifying radiation absorption). Thus, non-consistent behaviors were found between both bands, coinciding with San Bautista et al. (2022) [42], pointing out a lack of collinearity near the harvest. Based on that study, the authors examined the collinearity between red and NIR in detail because the dysfunction in interpreting both spectral regions could be consistent and supported by the literature. Thenkabail et al. (2000) [28] also discussed a dysfunction in the red–NIR interpretation based on the red reflectance saturation in high LAI canopies, while the NIR reflectance would not reach saturation at the same time. The negative correlation was supposed to interpret the NDVI values. A continuous collinearity would indicate a similar red–NIR saturation and an overfitted protocol. Nevertheless, in the second year, the collinearity between red and NIR was low at grain filling, maintaining low values until harvest. Moreover, considering the yields achieved, the red and NIR bands did not follow the expected pattern in the year comparison. This phenomenon could change the interpretation of the NDVI. The NDVI index is based on the difference between NIR and red reflectance, thus, an increase in this difference implies a higher NDVI value. A saturation phenomenon was described by many authors [27,28] because the reflectance in the red reaches its minimum value for a LAI below which the NIR reaches its maximum value [93]. According to our results, the pattern observed in the red and NIR values and NIR and NDVI values in both years could be considered in agreement with scientific literature at initial growing stages (45 DAS, tillering phase), describing a linear model in the first and a quadratic model in the second relation. However, these relationships were disrupted at 55 and 85 DAS. On these dates, a single NIR value corresponded with two values of red (one per year), and an NDVI value corresponded with two values of NIR (one per year). In 2022, the high N concentration would have resulted in this anomaly, and it was evidenced that the highest crop greenness (low reflectance in the red band and high NDVI) was inefficient due to low vegetative growth during tillering (low NIR, LAI and biomass). NIR–NDVI dynamics would show that the high N concentration after panicle initiation would be less efficiently utilized for grain yield [94]. This erratic behavior could be useful to evaluate the effect of N and to provide a yield forecast, furthermore, the comparison between this reflectance and NDVI would allow the design of a pre-harvest crop warning system.
Finally, the most important to the rice industry is the proposal of a final protocol to evaluate the effect of N based on remote sensing data. Comparing this study with a similar one conducted by Rehman et al. (2019) [27] in California (USA), using a similar variety, and under similar climatic and management conditions, some considerations can be discussed. The practice of additional N applications as top-dressing around panicle initiation (45–50 DAS) was pointed out by Rehman et al. (2019) [27] as a practice aimed at N deficiency correction. They only used the NDVI as a remote sensing monitoring parameter, obtaining a strong saturation. A better monitoring of N crop nutritional status would be possible by adding the interaction between NDVI and NIR in the present study. In this sense, the fourth level of analysis (layer 4) would mean an integration of remote sensing values with the agronomic interpretation, thus improving the empirical correlation models obtained in layer 3. Three conditions in the evolution of red and NIR bands, and NDVI, would be necessary to infer yield and crop nutrition.
First, a linear relationship between red and NIR and a quadratic model between NIR and NDVI should be found at the initial stages, high NIR and NDVI values would be desirable during the tillering phase. Therefore, yield could be increased via the number of fertile tillers, number of grains, and grain weight. At this moment, an application of N top-dressing could improve the three yield components.
Second, N fertilization could enhance the photosynthetic capacity at panicle initiation, improving yield via the number and weight of grains [95]. However, this increase must be aligned with high net photosynthesis (optimal weather conditions). The number of fertile tillers could not be modified, thus, low NIR values for high NDVI would indicate an excessive N concentration.
Third, at grain filling, a low red reflectance should ensure a high grain weight, but the effect of N would be highly dependent on optimal environmental conditions and also on the previous phenological stages [96]. An excessive percentage of N would result in prolonged green straw maintenance, and high NDVI without a significant increase in NIR, comparing high-yield values with low-yield values. The crop greenness, or the high percentage of N, does not necessarily result in high yields, because red and NDVI values at ripening would be dependent on NIR recorded during tillering and stem elongation stages. In this sense, the NIR–NDVI interaction at 55 DAS (stem elongation) should be studied in detail, obtaining a reference curve that includes more fields and years.
According to this proposal, crop management efforts should be focused on achieving a large NIR and NDVI at 45 DAS (tillering), making this crop performance the most important to increase yields. After ensuring these high values, it would be appropriate to monitor reflectance in the visible bands for the remaining season. The potential yield would be achieved with high NIR and NDVI during the vegetative phase and low reflectance in the visible bands during grain filling and ripening. The scientific literature does not provide significant results that could impact the crop management of rice plant nutrition before the heading phenological stage. Studies show a very low and non-significant correlation (R2 = 0.09; p > 0.05) between nitrogen (N) concentration and vegetation indices (VIs) before heading [97]. The correlation between N concentration and rice plant grain yield is also unclear [78,98]. Previous authors reported N concentration values in rice plants between 1-2%, while this study extends the range to 5%, covering a wider function domain. The results of this study confirm the possibility of crop management intervention before 55 DAS based on intra-field yield, reflectance in electromagnetic bands and VIs, and N concentration. The study also reports two different dynamics between near-infrared (NIR)-red and normalized difference vegetation index (NDVI)–NIR based on intra-field yield and N concentration (Figure 9). These findings could lead to new research areas, as it may be possible to improve crop management in rice plants by using remote sensing data before stem elongation and panicle initiation. This change in management would involve adjusting nitrogen input based on plant N concentration and model-estimated yields. Instead of increasing N input when N concentration is low, the focus would shift to reducing N input when N concentration is high and model-estimated yields [40] are low. This approach could enable more environmentally friendly rice cultivation decision-making by reducing N inputs and minimizing environmental pollution. This research is motivated by the notable concern of the rice industry to comply with nitrogen dosage regulations within the Natural Park of “La Albufera” of Valencia (Spain).
5. Conclusions
N fertilization in rice crops is still a challenging area of concern. In this study, significant differences between years were found in relation to the influence of N dose on yield. Biomass, LAI, and N concentration were identified as the essential parameters to analyze these differences between N applications. In the first year studied, these values were in accordance with the literature and with the expected effect of N. Thus, biomass and LAI increased with the dose, while concentration was low. In the second year, severe anomalies were found, mainly attributed to inappropriate environmental conditions (high temperatures and VPD), that provoked no difference between N doses and lower yields. However, differences between applied N doses in nitrogen use efficiency (NUE) were maintained in both years, regardless of the year’s climatic conditions. This result is critical in establishing the protocol proposed in this work, confirming that NUE is a good indicator of productivity.
The novelty of this research is the introduction of remote sensing as an effective tool in identifying these anomalies in the performance of the rice crop in the two years under study. Therefore, in 2021, strong correlations were obtained between the parameters measured in the field and the satellite data, while in 2022, the correlations were weak. The values of red and NIR bands showed a distinct interpretation, inferring crop greenness (red band) and vegetative growth rate (NIR band). This interpretation coincided with the field parameters, improving the knowledge about crop behavior during all phenological stages. To obtain a better balance in the distribution of dry matter between grain and leaves and a higher yield, high values of NIR reflectance and low values in the red band during the vegetative phase would be desirable. In this way, it would be possible to evaluate the performance of N fertilization on the crop. To better understand these physical variables, a protocol was proposed to relate both variables.
The proposed protocol for monitoring the influence of nitrogen on the rice crop is based on the in-depth analysis of the correlations between data matrices: field parameters and satellite data. The NDVI values depended on the interpretation of the NIR values at the analyzed date of each phenological stage. A high NDVI would not imply a higher yield in all phenological phases. The same NDVI value can be associated with very different yield and reflectance values in the red band. The relationship between reflectance in the red band and NDVI, and between NIR and NDVI, was maintained up to 55 DAS, using pixels ranked by performance as points. This negative linear relationship in the red–NDVI relationship and positive in the NIR–NDVI relationship was impossible in the following phenological stages. This relationship was eliminated due to the low yields achieved in the second year.
Remote sensing could be a promising tool to monitor the influence of N dose on yield, mainly due to the ability to the complex interactions between the crop and the environmental conditions. N use efficiency could be monitored, leading to the development of a productive and sustainable crop management system.
Supplementary Materials
The following supporting information can be downloaded at: https://www.mdpi.com/article/10.3390/agriculture14101753/s1, Figure S1: Essential stages of this work; Figure S2: Location of the study area: Albufera Natural Park, Valencia (Spain); Table S1: Study of linear correlation between the spectral bands used in the paper and between the bands and NDVI.
Author Contributions
A.S.B., S.C.-I. and C.R.; methodology, A.S.B., S.C.-I., C.R. and D.F.; software, D.F., B.F., S.C.-I., and C.R.; validation, A.S.B., D.F., B.F., C.R. and S.C.-I.; formal analysis, A.S.B., D.F., S.C.-I., B.F., C.D. and C.R.; investigation, A.S.B., D.F., S.C.-I., B.F., C.D. and C.R.; resources, A.S.B., B.F. and C.R.; data curation, A.S.B., D.F., B.F., S.C.-I., C.D. and C.R.; writing—original draft preparation, A.S.B., D.F., S.C.-I. and C.R.; writing—review and editing, A.S.B., D.F., B.F., S.C.-I., C.D. and C.R.; visualization, A.S.B., D.F., B.F., S.C.-I., C.D. and C.R.; supervision, A.S.B., D.F., B.F., S.C.-I., C.D. and C.R.; project administration, A.S.B.; funding acquisition, A.S.B., B.F. and C.R. All authors have read and agreed to the published version of the manuscript.
Funding
This research has been funded by the PREDIC-PRO project SCPP2100C008733XVD, of the State Research Agency of the Ministry of Science, Innovation and Universities, and ACIF Generalitat Valenciana, European Union (European Social Fund. Investing in Your Future) (CIACIF/2021/143) and DETECTORYZA project INNEST/2022/227, INNEST/2022/319 and INNEST/2022/361 Regional Operational Programme, FEDER Comunitat Valenciana de la Innovació, Generalitat Valenciana.
Data Availability Statement
https://sentinels.copernicus.eu/web/sentinel/missions/sentinel-2 (accessed on 7 January 2023).
Conflicts of Interest
The authors declare no conflict of interest.
References
- Awika, J.M. Major Cereal Grains Production and Use around the World. In Proceedings of the ACS Symposium Series; ACS Publications: Washington, DC, USA, 2011; Volume 1089. [Google Scholar]
- FAOSTAT. Available online: https://www.fao.org/faostat/en/#home (accessed on 16 July 2024).
- Khush, G.S. Green Revolution: Preparing for the 21st Century. Genome 2011, 42, 646–655. [Google Scholar] [CrossRef]
- Wollenweber, B.; Porter, J.R.; Lübberstedt, T. Need for Multidisciplinary Research towards a Second Green Revolution. Curr. Opin. Plant Biol. 2005, 8, 337–341. [Google Scholar] [CrossRef] [PubMed]
- Gu, J.; Yang, J. Nitrogen (N) Transformation in Paddy Rice Field: Its Effect on N Uptake and Relation to Improved N Management. Crop Environ. 2022, 1, 7–14. [Google Scholar] [CrossRef]
- Liu, Y.; Hu, B.; Chu, C. Toward Improving Nitrogen Use Efficiency in Rice: Utilization, Coordination, and Availability. Curr. Opin. Plant Biol. 2023, 71, 102327. [Google Scholar] [CrossRef]
- Linquist, B.A.; Liu, L.; van Kessel, C.; van Groenigen, K.J. Enhanced Efficiency Nitrogen Fertilizers for Rice Systems: Meta-Analysis of Yield and Nitrogen Uptake. Field Crops Res. 2013, 154, 246–254. [Google Scholar] [CrossRef]
- Kornher, L.; von Braun, J. The Global Food Crisis Will Not Be over When International Prices Are Back to Normal. ZEF Policy Brief SSRN Electron. J. 2023, 42, 1–8. [Google Scholar] [CrossRef]
- Haghshenas, H.; Ghanbari Malidarreh, A. Response of Yield and Yield Components of Released Rice Cultivars from 1990-2010 to Nitrogen Rates. Cent. Asian J. Plant Sci. Innov. 2021, 1, 23–31. [Google Scholar] [CrossRef]
- Gao, Y.; Sun, C.; Ramos, T.B.; Huo, Z.; Huang, G.; Xu, X. Modeling Nitrogen Dynamics and Biomass Production in Rice Paddy Fields of Cold Regions with the ORYZA-N Model. Ecol. Modell. 2023, 475, 110184. [Google Scholar] [CrossRef]
- Li, T.; Angeles, O.; Marcaida, M.; Manalo, E.; Manalili, M.P.; Radanielson, A.; Mohanty, S. From ORYZA2000 to ORYZA (v3): An Improved Simulation Model for Rice in Drought and Nitrogen-Deficient Environments. Agric. For. Meteorol. 2017, 237–238, 246–256. [Google Scholar] [CrossRef]
- Bouman, B.A.M.; Van Laar, H.H. Description and Evaluation of the Rice Growth Model ORYZA2000 under Nitrogen-Limited Conditions. Agric. Syst. 2006, 87, 249–273. [Google Scholar] [CrossRef]
- Pang, G.B.; Li, Y.; Xu, Z.H.; Gao, H.Z. Calibration and Evaluation of ORYZA2000 under Water and Nitrogen Managements. Appl. Mech. Mater. 2014, 641–642, 246–250. [Google Scholar] [CrossRef]
- Cai, S.; Zhao, X.; Yan, X. Effects of climate and soil properties on regional differences in nitrogen use efficiency and reactive nitrogen losses in rice. Environ. Res. Lett. 2022, 17, 054039. [Google Scholar] [CrossRef]
- Skakun, S.; Kalecinski, N.I.; Brown, M.G.L.; Johnson, D.M.; Vermote, E.F.; Roger, J.C.; Franch, B. Assessing Within-Field Corn and Soybean Yield Variability from Worldview-3, Planet, Sentinel-2, and Landsat 8 Satellite Imagery. Remote Sens. 2021, 13, 872. [Google Scholar] [CrossRef]
- Kayad, A.; Sozzi, M.; Gatto, S.; Marinello, F.; Pirotti, F. Monitoring Within-Field Variability of Corn Yield Using Sentinel-2 and Machine Learning Techniques. Remote Sens. 2019, 11, 2873. [Google Scholar] [CrossRef]
- Filippi, P.; Whelan, B.M.; Vervoort, R.W.; Bishop, T.F.A. Mid-Season Empirical Cotton Yield Forecasts at Fine Resolutions Using Large Yield Mapping Datasets and Diverse Spatial Covariates. Agric. Syst. 2020, 184, 102894. [Google Scholar] [CrossRef]
- Saberioon, M.; Amin, M.S.M.; Gholizadeh, A.; Ezri, M.H. A Review of Optical Methods for Assessing Nitrogen Contents during Rice Growth. Appl. Eng. Agric. 2014, 30, 657–669. [Google Scholar] [CrossRef]
- Hank, T.B.; Berger, K.; Bach, H.; Clevers, J.G.P.W.; Gitelson, A.; Zarco-Tejada, P.; Mauser, W. Spaceborne Imaging Spectroscopy for Sustainable Agriculture: Contributions and Challenges. Surv. Geophys. 2019, 40, 515–551. [Google Scholar] [CrossRef]
- Zhang, H.; Duan, Z.; Li, Y.; Zhao, G.; Zhu, S.; Fu, W.; Peng, T.; Zhao, Q.; Svanberg, S.; Hu, J. Vis/NIR Reflectance Spectroscopy for Hybrid Rice Variety Identification and Chlorophyll Content Evaluation for Different Nitrogen Fertilizer Levels. R. Soc. Open Sci. 2019, 6, 191132. [Google Scholar] [CrossRef]
- Brinkhoff, J.; Dunn, B.W.; Robson, A.J.; Dunn, T.S.; Dehaan, R.L. Modeling Mid-Season Rice Nitrogen Uptake Using Multispectral Satellite Data. Remote Sens. 2019, 11, 1837. [Google Scholar] [CrossRef]
- Brinkhoff, J.; Dunn, B.W.; Robson, A.J. Rice Nitrogen Status Detection Using Commercial-Scale Imagery. Int. J. Appl. Earth Obs. Geoinf. 2021, 105, 102627. [Google Scholar] [CrossRef]
- Zheng, J.; Song, X.; Yang, G.; Du, X.; Mei, X.; Yang, X. Remote Sensing Monitoring of Rice and Wheat Canopy Nitrogen: A Review. Remote. Sens. 2022, 14, 5712. [Google Scholar] [CrossRef]
- Lee, Y.J.; Yang, C.M.; Chang, K.W.; Shen, Y. A Simple Spectral Index Using Reflectance of 735 Nm to Assess Nitrogen Status of Rice Canopy. Agron. J. 2008, 100, 205–212. [Google Scholar] [CrossRef]
- Xue, L.; Cao, W.; Luo, W.; Dai, T.; Zhu, Y. Monitoring Leaf Nitrogen Status in Rice with Canopy Spectral Reflectance. Agron. J. 2004, 96, 135–142. [Google Scholar] [CrossRef]
- Zheng, H.; Cheng, T.; Li, D.; Zhou, X.; Yao, X.; Tian, Y.; Cao, W.; Zhu, Y. Evaluation of RGB, Color-Infrared and Multispectral Images Acquired from Unmanned Aerial Systems for the Estimation of Nitrogen Accumulation in Rice. Remote Sens. 2018, 10, 824. [Google Scholar] [CrossRef]
- Rehman, T.H.; Borja Reis, A.F.; Akbar, N.; Linquist, B.A. Use of Normalized Difference Vegetation Index to Assess N Status and Predict Grain Yield in Rice. Agron. J. 2019, 111, 2889–2898. [Google Scholar] [CrossRef]
- Thenkabail, P.S.; Smith, R.B.; De Pauw, E. Hyperspectral Vegetation Indices and Their Relationships with Agricultural Crop Characteristics. Remote Sens. Environ. 2000, 71, 158–182. [Google Scholar] [CrossRef]
- Wang, W.; Yao, X.; Yao, X.F.; Tian, Y.C.; Liu, X.J.; Ni, J.; Cao, W.X.; Zhu, Y. Estimating Leaf Nitrogen Concentration with Three-Band Vegetation Indices in Rice and Wheat. Field Crops Res. 2012, 129, 90–98. [Google Scholar] [CrossRef]
- Bonfil, D.J.; Michael, Y.; Shiff, S.; Lensky, I.M. Optimizing Top Dresseing Nitrogen Fertilization Using Venμs and Sentinel-2 L1 Data. Remote Sens. 2021, 13, 3934. [Google Scholar] [CrossRef]
- González-Piqueras, J.; Lopez-Corcoles, H.; Sánchez, S.; Villodre, J.; Bodas, V.; Campos, I.; Osann, A.; Calera, A. Monitoring Crop N Status by Using Red Edge-Based Indices. Adv. Anim. Biosci. 2017, 8, 338–342. [Google Scholar] [CrossRef]
- Crema, A.; Vandini, G.; Boschetti, M.; Nutini, F.; Cillis, D.; Casa, R. Interaction between Soil Variability and Maize Nitrogen Status Assessment from Sentinel-2. In Proceedings of the Precision Agriculture 2019—Papers Presented at the 12th European Conference on Precision Agriculture, ECPA 2019, Montpellier, France, 8–11 July 2019. [Google Scholar]
- Villodre, J.; Campos, I.; Lopez-Corcoles, H.; Gonzalez-Piqueras, J.; González, L.; Bodas, V.; Sanchez-Prieto, S.; Osann, A.; Calera, A. Mapping Optimum Nitrogen Crop Uptake. Adv. Anim. Biosci. 2017, 8, 322–327. [Google Scholar] [CrossRef]
- Plaza, C.; Calera, M.; Campoy, J.; Osann, A.; Calera, A.; Bodas, V. Commercial Wheat Fertilization Based on Nitrogen Nutrition Index and Yield Forecast. In Proceedings of the EGU General Assembly Conference Abstracts EGU2020, Vienna, Austria, 4–8 May 2020. [Google Scholar] [CrossRef]
- Nutini, F.; Confalonieri, R.; Paleari, L.; Pepe, M.; Criscuolo, L.; Porta, F.; Ranghetti, L.; Busetto, L.; Boschetti, M. Supporting Operational Site-specific Fertilization in Rice Cropping Systems with Infield Smartphone Measurements and Sentinel-2 Observations. Precis. Agric. 2021, 22, 1284–1303. [Google Scholar] [CrossRef]
- Onojeghuo, A.O.; Blackburn, G.A.; Huang, J.; Kindred, D.; Huang, W. Applications of Satellite ‘Hyper-Sensing’ in Chinese Agriculture: Challenges and Opportunities. Int. J. Appl. Earth Obs. Geoinf. 2018, 64, 62–86. [Google Scholar] [CrossRef]
- Skakun, S.; Vermote, E.; Franch, B.; Roger, J.C.; Kussul, N.; Ju, J.; Masek, J. Winter Wheat Yield Assessment from Landsat 8 and Sentinel-2 Data: Incorporating Surface Reflectance, through Phenological Fitting, into Regression Yield Models. Remote Sens. 2019, 11, 1768. [Google Scholar] [CrossRef]
- Tian, L.; Wang, Z.; Xue, B.; Li, D.; Zheng, H.; Yao, X.; Zhu, Y.; Cao, W.; Cheng, T. A Disease-Specific Spectral Index Tracks Magnaporthe Oryzae Infection in Paddy Rice from Ground to Space. Remote Sens. Environ. 2023, 285, 113384. [Google Scholar] [CrossRef]
- Jackson, R.D.; Huete, A.R. Interpreting Vegetation Indices. Prev. Vet. Med. 1991, 11, 185–200. [Google Scholar] [CrossRef]
- Franch, B.; San Bautista, A.; Fita, D.; Rubio, C.; Tarrazó-Serrano, D.; Sánchez, A.; Skakun, S.; Vermote, E.; Becker-Reshef, I.; Uris, A. Within-Field Rice Yield Estimation Based on Sentinel-2 Satellite Data. Remote Sens. 2021, 13, 4095. [Google Scholar] [CrossRef]
- Hunt, M.L.; Blackburn, G.A.; Carrasco, L.; Redhead, J.W.; Rowland, C.S. High Resolution Wheat Yield Mapping Using Sentinel-2. Remote Sens. Environ. 2019, 233, 111410. [Google Scholar] [CrossRef]
- Bautista, A.S.; Fita, D.; Franch, B.; Castiñeira-Ibáñez, S.; Arizo, P.; Sánchez-Torres, M.J.; Becker-Reshef, I.; Uris, A.; Rubio, C. Crop Monitoring Strategy Based on Remote Sensing Data (Sentinel-2 and Planet), Study Case in a Rice Field after Applying Glycinebetaine. Agronomy 2022, 12, 708. [Google Scholar] [CrossRef]
- Segarra, J.; Buchaillot, M.L.; Araus, J.L.; Kefauver, S.C. Remote Sensing for Precision Agriculture: Sentinel-2 Improved Features and Applications. Agronomy 2020, 10, 641. [Google Scholar] [CrossRef]
- Liu, K.; Deng, J.; Lu, J.; Wang, X.; Lu, B.; Tian, X.; Zhang, Y. High Nitrogen Levels Alleviate Yield Loss of Super Hybrid Rice Caused by High Temperatures during the Flowering Stage. Front. Plant Sci. 2019, 10, 357. [Google Scholar] [CrossRef]
- Rossi, M.; Candiani, G.; Nutini, F.; Gianinetto, M.; Boschetti, M. Sentinel-2 Estimation of CNC and LAI in Rice Cropping System through Hybrid Approach Modelling. Eur. J. Remote Sens. 2022, 56, 2117651. [Google Scholar] [CrossRef]
- Water Quality for Agriculture. Available online: https://www.fao.org/3/t0234e/t0234e00.htm (accessed on 30 May 2023).
- Elías Castillo, F.; Ruiz Beltrán, L. Agroclimatología de España; Instituto Nacional de Investigaciones Agrarias (España): Santiago, Chile, 1977. [Google Scholar]
- Allen, R.G.; Pereira, L.S.; Raes, D.; Smith, M. Crop Evapotranspiration—Guidelines for Computing Crop Water Requirements—FAO Irrigation and Drainage Paper 56. Irrig. Drain. 1998, 65, D05109. [Google Scholar] [CrossRef]
- Krishnan, P.; Ramakrishnan, B.; Reddy, K.R.; Reddy, V.R. High-Temperature Effects on Rice Growth, Yield, and Grain Quality. Adv. Agron. 2011, 111, 87–206. [Google Scholar]
- Osca Lluch, J.M. Cultivos Herbáceos Extensivos: Cereales; Editorial UPV: Valencia, Spain, 2013. [Google Scholar]
- Lee, S. Recent Advances on Nitrogen Use Efficiency in Rice. Agronomy 2021, 11, 753. [Google Scholar] [CrossRef]
- Jiang, Z.; Huete, A.R.; Didan, K.; Miura, T. Development of a Two-Band Enhanced Vegetation Index without a Blue Band. Remote Sens. Environ. 2008, 112, 3833–3845. [Google Scholar] [CrossRef]
- Li, Y.; Chen, J.; Ma, Q.; Zhang, H.K.; Liu, J. Evaluation of Sentinel-2A Surface Reflectance Derived Using Sen2Cor in North America. IEEE J. Sel. Top. Appl. Earth Obs. Remote Sens. 2018, 11, 1997–2021. [Google Scholar] [CrossRef]
- Doxani, G.; Vermote, E.F.; Roger, J.C.; Skakun, S.; Gascon, F.; Collison, A.; De Keukelaere, L.; Desjardins, C.; Frantz, D.; Hagolle, O.; et al. Atmospheric Correction Inter-Comparison EXercise, ACIX-II Land: An Assessment of Atmospheric Correction Processors for Landsat 8 and Sentinel-2 over Land. Remote Sens. Environ. 2023, 285, 113412. [Google Scholar] [CrossRef]
- Chauhan, B.S.; Jabran, K.; Mahajan, G. Rice Production Worldwide; Springer International Publishing AG: Cham, Switzerland, 2017. [Google Scholar]
- Hatfield, J.L.; Gitelson, A.A.; Schepers, J.S.; Walthall, C.L. Application of Spectral Remote Sensing for Agronomic Decisions. Agron. J. 2008; 100, S-117–S-131. [Google Scholar]
- Harrell, D.L.; Tubaña, B.S.; Walker, T.W.; Phillips, S.B. Estimating Rice Grain Yield Potential Using Normalized Difference Vegetation Index. Agron. J. 2011, 103, 1717–1723. [Google Scholar] [CrossRef]
- Nuarsa, I.W.; Nishio, F.; Nishio, F.; Hongo, C.; Hongo, C. Relationship between Rice Spectral and Rice Yield Using Modis Data. J. Agric. Sci. 2011, 3, 80. [Google Scholar] [CrossRef][Green Version]
- Kimura, R.; Okada, S.; Miura, H.; Kamichika, M. Relationships among the Leaf Area Index, Moisture Availability, and Spectral Reflectance in an Upland Rice Field. Agric. Water Manag. 2004, 69, 83–100. [Google Scholar] [CrossRef]
- Mosleh, M.K.; Hassan, Q.K.; Chowdhury, E.H. Application of Remote Sensors in Mapping Rice Area and Forecasting Its Production: A Review. Sensors 2015, 15, 769–791. [Google Scholar] [CrossRef] [PubMed]
- Myneni, R.B.; Williams, D.L. On the Relationship between FAPAR and NDVI. Remote Sens. Environ. 1994, 49, 200–211. [Google Scholar] [CrossRef]
- Fageria, N.K. Yield Physiology of Rice. J. Plant Nutr. 2007, 30, 843–879. [Google Scholar] [CrossRef]
- Huang, S.; Miao, Y.; Zhao, G.; Yuan, F.; Ma, X.; Tan, C.; Yu, W.; Gnyp, M.L.; Lenz-Wiedemann, V.I.S.; Rascher, U.; et al. Satellite Remote Sensing-Based in-Season Diagnosis of Rice Nitrogen Status in Northeast China. Remote Sens. 2015, 7, 10646–10667. [Google Scholar] [CrossRef]
- Lemaire, G.; van Oosterom, E.; Sheehy, J.; Jeuffroy, M.H.; Massignam, A.; Rossato, L. Is Crop N Demand More Closely Related to Dry Matter Accumulation or Leaf Area Expansion during Vegetative Growth? Field Crops Res. 2007, 100, 91–106. [Google Scholar] [CrossRef]
- Tian, G.; Gao, L.; Kong, Y.; Hu, X.; Xie, K.; Zhang, R.; Ling, N.; Shen, Q.; Guo, S. Improving Rice Population Productivity by Reducing Nitrogen Rate and Increasing Plant Density. PLoS ONE 2017, 12, e0182310. [Google Scholar] [CrossRef]
- Lin, X.Q.; Zhu, D.F.; Chen, H.Z.; Cheng, S.H.; Uphoff, N. Effect of Plant Density and Nitrogen Fertilizer Rates on Grain Yield and Nitrogen Uptake of Hybrid Rice (Oryza sativa L.). J. Agric. Biotechnol. Sustain. Dev. 2009, 1, 44–53. [Google Scholar]
- Dobermann, A. Factors Causing Field Variation of Direct-Seeded Flooded Rice. Geoderma 1994, 62, 125–150. [Google Scholar] [CrossRef]
- Hara, Y.; Toriyama, K. Ammonium Nitrogen in Soil Solution and Seed Nitrogen Affect the Percentage of Establishment of Rice Plants in Submerged Soil. Soil Sci. Plant Nutr. 1998, 44, 415–422. [Google Scholar] [CrossRef]
- Hara, Y.; Toriyama, K. Seed Nitrogen Accelerates the Rates of Germination, Emergence, and Establishment of Rice Plants. Soil Sci. Plant Nutr. 1998, 44, 359–366. [Google Scholar] [CrossRef]
- Ma, S.; Wang, G.; Su, S.; Lu, J.; Ren, T.; Cong, R.; Lu, Z.; Zhang, Y.; Liao, S.; Li, X. Effects of Optimized Nitrogen Fertilizer Management on the Yield, Nitrogen Uptake, and Ammonia Volatilization of Direct-Seeded Rice. J. Sci. Food Agric. 2023, 103, 4553–4561. [Google Scholar] [CrossRef] [PubMed]
- Takahashi, J.; Wada, G.; Shoji, S. The Fate of Fertilizer Nitrogen Applied to the Paddy Field and Its Absorption by Rice Plant: VII. Relationships between the Absorption of Nitrogen by the Rice Plants and the Growth of the Plants. Jpn. J. Crop Sci. 1976, 45, 220–225. [Google Scholar] [CrossRef][Green Version]
- Harrell, D.L.; Blanche, S.B. Tillage, Seeding, and Nitrogen Rate Effects on Rice Density, Yield, and Yield Components of Two Rice Cultivars. Agron. J. 2010, 102, 592–597. [Google Scholar] [CrossRef]
- Counce, P.A.; Wells, B.R. Rice Plant Population Density Effect on Early-Season Nitrogen Requirement. J. Prod. Agric. 1990, 3, 390–393. [Google Scholar] [CrossRef]
- Zhang, Y.-H.; Zhang, Y.-L.; Huang, Q.-W.; Xu, Y.-C.; Shen., Q.-R. Effects of Different N Application Rates on Grain Yield and Nitrogen Uptake and Utilization by Different Rice Cultivars. Plant Nutr. Fertil. Sci. 2006, 12, 616–621. [Google Scholar]
- Sheehy, J.E.; Ferrer, A.B.; Mitchell, P.L.; Elmido-Mabilangan, A.; Pablico, P.; Dionora, M.J.A. How the Rice Crop Works and Why It Needs a New Engine. In Charting New Pathways to C4 Rice; World Scientific: Singapore, 2008. [Google Scholar]
- Sheehy, J.E.; Dionora, M.J.A.; Mitchell, P.L.; Peng, S.; Cassman, K.G.; Lemaire, G.; Williams, R.L. Critical Nitrogen Concentrations: Implications for High-Yielding Rice (Oryza sativa L.) Cultivars in the Tropics. Field Crops Res. 1998, 59, 31–41. [Google Scholar] [CrossRef]
- Li, X.; Ata-UI-Karim, S.T.; Li, Y.; Yuan, F.; Miao, Y.; Yoichiro, K.; Cheng, T.; Tang, L.; Tian, X.; Liu, X.; et al. Advances in the Estimations and Applications of Critical Nitrogen Dilution Curve and Nitrogen Nutrition Index of Major Cereal Crops. A Review. Comput. Electron. Agric. 2022, 197, 106998. [Google Scholar] [CrossRef]
- Ata-Ul-Karim, S.T.; Zhu, Y.; Yao, X.; Cao, W. Determination of Critical Nitrogen Dilution Curve Based on Leaf Area Index in Rice. Field Crops Res. 2014, 167, 76–85. [Google Scholar] [CrossRef]
- Zhang, S.; Tao, F.; Zhang, Z. Spatial and Temporal Changes in Vapor Pressure Deficit and Their Impacts on Crop Yields in China during 1980–2008. J. Meteorol. Res. 2017, 31, 800–808. [Google Scholar] [CrossRef]
- Vu, D.H.; Stuerz, S.; Pieters, A.; Asch, F. Leaf Gas Exchange of Lowland Rice in Response to Nitrogen Source and Vapor Pressure Deficit. J. Plant Nutr. Soil Sci. 2021, 184, 448–460. [Google Scholar] [CrossRef]
- Ohsumi, A.; Hamasaki, A.; Nakagawa, H.; Homma, K.; Horie, T.; Shiraiwa, T. Response of Leaf Photosynthesis to Vapor Pressure Difference in Rice (Oryza sativa L) Varieties in Relation to Stomatal and Leaf Internal Conductance. Plant Prod. Sci. 2008, 11, 184–191. [Google Scholar] [CrossRef]
- Yulong, Y.; Qingfeng, M.; Hao, Y.; Qingsong, Z.; Ye, L.; Cui, Z. Climate Change Increases Nitrogen Concentration in Rice with Low Nitrogen Use Efficiency. Earths Future 2021, 9, e2020EF001878. [Google Scholar] [CrossRef]
- Horie, T.; Ohnishi, M.; Angus, J.F.; Lewin, L.G.; Tsukaguchi, T.; Matano, T. Physiological Characteristics of High-Yielding Rice Inferred from Cross-Location Experiments. Field Crops Res. 1997, 52, 55–67. [Google Scholar] [CrossRef]
- Lee, Y.J.; Yang, C.M.; Chang, K.W.; Shen, Y. Effects of Nitrogen Status on Leaf Anatomy, Chlorophyll Content and Canopy Reflectance of Paddy Rice. Bot. Stud. 2011, 52, 295–303. [Google Scholar]
- Ustin, S.L.; Jacquemoud, S. How the Optical Properties of Leaves Modify the Absorption and Scattering of Energy and Enhance Leaf Functionality. In Remote Sensing of Plant Biodiversity; Springer Nature: Cham, Switzerland, 2020. [Google Scholar]
- Adeluyi, O.; Harris, A.; Foster, T.; Clay, G.D. Exploiting Centimetre Resolution of Drone-Mounted Sensors for Estimating Mid-Late Season above Ground Biomass in Rice. Eur. J. Agron. 2022, 132, 126411. [Google Scholar] [CrossRef]
- Liu, S.; Zeng, W.; Wu, L.; Lei, G.; Chen, H.; Gaiser, T.; Srivastava, A.K. Simulating the Leaf Area Index of Rice from Multispectral Images. Remote Sens. 2021, 13, 3663. [Google Scholar] [CrossRef]
- Lv, C.; Huang, Y.; Sun, W.; Yu, L.; Hu, Z. Elevated [CO2] Raises the Temperature Optimum of Photosynthesis and Thus Promotes Net Photosynthesis of Winter Wheat and Rice. Physiol. Plant 2022, 174, e13757. [Google Scholar] [CrossRef]
- Asseng, S.; Ewert, F.; Martre, P.; Rötter, R.P.; Lobell, D.B.; Cammarano, D.; Kimball, B.A.; Ottman, M.J.; Wall, G.W.; White, J.W.; et al. Rising Temperatures Reduce Global Wheat Production. Nat. Clim. Chang. 2015, 5, 143–147. [Google Scholar] [CrossRef]
- Mendez, K.; Adviento-Borbe, M.A.; Lorence, A.; Walia, H. Significant Shift of Ambient Night-Time Air Temperature during Rice Growing Season in Major US Rice States. Am. J. Clim. Chang. 2021, 10, 134–151. [Google Scholar] [CrossRef]
- Araus, J.L.; Sanchez-Bragado, R.; Vicente, R. Improving Crop Yield and Resilience through Optimization of Photosynthesis: Panacea or Pipe Dream? J. Exp. Bot. 2021, 72, 3936–3955. [Google Scholar] [CrossRef]
- Huang, S.; Tang, L.; Hupy, J.P.; Wang, Y.; Shao, G. A Commentary Review on the Use of Normalized Difference Vegetation Index (NDVI) in the Era of Popular Remote Sensing. J. For. Res. 2021, 32, 1–6. [Google Scholar] [CrossRef]
- Gausman, H.W. Plant Leaf Optical Properties in Visible and Near-Infrared Light, 1st ed.; Texas Tech University: Lubbock, TA, USA, 1985; Volume 29. [Google Scholar]
- Fu, P.; Wang, J.; Zhang, T.; Huang, J.; Peng, S. High Nitrogen Input Causes Poor Grain Filling of Spikelets at the Panicle Base of Super Hybrid Rice. Field Crops Res. 2019, 244, 107635. [Google Scholar] [CrossRef]
- Sui, B.; Feng, X.; Tian, G.; Hu, X.; Shen, Q.; Guo, S. Optimizing Nitrogen Supply Increases Rice Yield and Nitrogen Use Efficiency by Regulating Yield Formation Factors. Field Crops Res. 2013, 150, 99–107. [Google Scholar] [CrossRef]
- Fahad, S.; Ihsan, M.Z.; Khaliq, A.; Daur, I.; Saud, S.; Alzamanan, S.; Nasim, W.; Abdullah, M.; Khan, I.A.; Wu, C.; et al. Consequences of High Temperature under Changing Climate Optima for Rice Pollen Characteristics-Concepts and Perspectives. Arch. Agron. Soil Sci. 2018, 64, 1473–1488. [Google Scholar] [CrossRef]
- Yu, K.; Li, F.; Gnyp, M.L.; Miao, Y.; Bareth, G.; Chen, X. Remotely detecting canopy nitrogen concentration and uptake of paddy rice in the Northeast China Plain. ISPRS J. Photogramm. Remote Sens. 2013, 78, 102–115. [Google Scholar] [CrossRef]
- Samonte, S.O.P.; Wilson, L.T.; Medley, J.C.; Pinson, S.R.M.; McClung, A.M.; Lales, J.S. Nitrogen Utilization Efficiency: Relationships with Grain Yield, Grain Protein, and Yield-Related Traits in Rice. Agron. J. 2006, 98, 168–176. [Google Scholar] [CrossRef]


Disclaimer/Publisher’s Note: The statements, opinions and data contained in all publications are solely those of the individual author(s) and contributor(s) and not of MDPI and/or the editor(s). MDPI and/or the editor(s) disclaim responsibility for any injury to people or property resulting from any ideas, methods, instructions or products referred to in the content. |
© 2024 by the authors. Licensee MDPI, Basel, Switzerland. This article is an open access article distributed under the terms and conditions of the Creative Commons Attribution (CC BY) license (https://creativecommons.org/licenses/by/4.0/).