Article

Artificial Neural Network Model for Predicting Carrot Root Yield Loss in Relation to Mechanical Heading

1
Department of Agronomy, Faculty of Agronomy, Horticulture and Biotechnology, Poznan University of Life Sciences, Dojazd 11, 60-632 Poznan, Poland
2
Department of Biosystems Engineering, Faculty of Environmental and Mechanical Engineering, Poznan University of Life Sciences, Wojska Polskiego 50, 60-637 Poznan, Poland
*
Author to whom correspondence should be addressed.
Agriculture 2024, 14(10), 1755; https://doi.org/10.3390/agriculture14101755
Submission received: 25 August 2024 / Revised: 20 September 2024 / Accepted: 30 September 2024 / Published: 5 October 2024
(This article belongs to the Section Digital Agriculture)

Abstract

:
Modelling and predicting agricultural production processes have high cognitive and practical values. Plant growth, the threat of pathogens and pests, and the structure of agricultural machinery treatments are mostly non-linear, measurable processes that can be described mathematically. In this paper, a multiple regression analysis was carried out in the first step to check the non-linearity of the data and yielded a coefficient of determination of R2 = 0.9741 and the coefficient of determination corrected for degrees of freedom was R2adj = 0.9739. An artificial neural network model, called CH-NET, is then presented to predict the yield loss of carrot roots by leaving root mass in the field during harvest at the mechanical heading stage. The proposed network model has an architecture consisting of an input layer, three hidden layers with 12 neurons each, and an output layer with one neuron. Twelve input criteria were defined for the analysis and testing of the network, eight of which related to carrot root parameters and four to the heading machine. The training, testing, and validation database of the CH-NET network consisted of the results of field trials and tests of the operation of the patented (P.242097) root heading machine. The proposed CH-NET neural network model achieved global error (GE) values of 0.0931 t·ha−1 for predicting carrot root yield losses for all twelve criteria adopted. However, when the number of criteria is reduced to eight, the error increased to 0.0991 t·ha−1. That is, the prediction was realised with an accuracy of 90.69%. The developed CH-NET model allows the prediction of economic losses associated with root mass left in the field or contamination of the raw material with undercut leaves. The simulations carried out showed that minimum root losses (0.263 t·ha−1) occur at an average root head projection height of 38 mm and a heading height of 20 mm from the ridge surface.

1. Introduction

The carrot (Daucus carota L.) is one of the most popular and widely cultivated root vegetables in the world. It is characterised by its high content of carotene, carotenoids, dietary fibre, amino acids, trace elements, and vitamins [1,2,3]. According to the Food and Agriculture Organization (FAO) [4], world carrot production in 2023 was just over 43.0 million tonnes. This represents a decrease of 0.8% in world carrot production in 2023, after two years of growth. The country with the highest carrot production was China, with 19.0 million tonnes, accounting for about 44.0% of the world’s production of this vegetable. China′s carrot production was also five times higher than that of the second largest producer, Uzbekistan (around 3.5 million tonnes). Third in this ranking, with a 3.2% share of world production, was the United States (around 1.4 million tonnes). In the EU, according to Eurostat [4], more than 5.0 million tonnes were produced, with Germany (18.0%), France (15.0%), and Poland (14.0%) being the largest producers.
With such a large production and demand for raw materials by the agri-food industry, it is important to minimise losses in the field, mainly during harvesting but also during transport, storage, and processing. It is also important to obtain a yield of roots of appropriate quality, mainly in terms of nutrient content and their morphological characteristics, mainly colouring, shape, length, and diameter. Unfortunately, carrot roots can also develop defects such as cracks and deformations related to adverse climatic (e.g., drought), soil (e.g., soil compaction), and anthropogenic (e.g., fertilisation, harvesting technique, and transport and storage conditions) conditions. Such factors reduce the commercial value of the roots, can increase susceptibility to disease, and can have a huge, measurable economic impact on growers.
The amount of yield loss during root harvesting is influenced by a number of factors, e.g., the method of plantation management, carrot variety, canopy height, soil moisture, and most importantly by the selection of the correct parameters for the root heading and ploughing process, which depends mainly on the type of machinery used. Carrot roots that are badly damaged or incorrectly detasseled have a lower commercial value and are more difficult to store because they are more likely to be infected with pathogens.
Artificial intelligence (AI) and deep neural networks (DNNs) are state-of-the-art, highly sophisticated tools for modelling, simulation, and prediction of complex processes, especially when dealing with complex relationships between variables. DNNs are currently being used to address multi-level complex tasks such as image analysis and object recognition [5,6], face and action recognition [7], driver monitoring [8,9], and quality assessment of products, crops, and other biological materials [10,11]. DNNs have improved the accuracy of human speech recognition [12,13], as well as many related tasks such as natural language processing [14], machine translation, or sound generation [15]. The models developed and generated by DNNs are used to understand the genetics and mechanism of development of many diseases, such as autism and spinal muscular atrophy [16] and skin [17], brain [18], and breast [19] cancers. They are also used for programming of manipulators [20], path planning of ground robots [21], visual navigation [22], and control of aircraft and tracking of autonomous vehicles [23].
They are also extremely useful for extracting quality characteristics of agricultural products based on shape [24,25,26,27], colour [28,29,30], texture [31], and light spectrum [32]. Digital techniques and methods provide new knowledge that can be applied to quality control of food and agricultural products with high accuracy [33,34,35,36]. The possibility of using neural networks to assess the quality of food products, roots of root crops, identification of weeds, and diseases or pests of crops is currently of interest to many researchers [37,38,39,40,41,42,43,44]. Texture, shape, and colour characteristics of products Ahmed et al. [45] and Hema Swathi et al. [46] used weed detection to detect damaged areas in apple and orange crops. Computer image analysis has become one of the main techniques used in agriculture to evaluate seeds and grains in terms of quality loss by quantifying the degree of mechanical damage, maturity stage, disease infestation, or contamination with other plant species [29,47]. The non-invasive nature of these methods and the increasing computing power of computers make machine vision and DNNs a significant advantage over labour-intensive and costly methods that destroy the material being assessed [48,49]. Computer-assisted techniques allow the application of precision agriculture technology in balanced fertilisation and spot application of crop protection products and precision agronomic treatments, e.g., seeding and planting of seedlings [50,51].
Deep neural networks have been used to qualitatively evaluate carrot roots since the last century. However, due to hardware limitations and low computational power, they were used to identify external root characteristics. Batchelor and Searcy [52] used neural networks and computer image analysis to identify the stem–root junction; Howarth [53] analysed discolouration, staining, and damage to root surfaces; Howarth and Searcy [54] analysed root shape defects and distortion, and Howarth et al. [55] analysed root tip shape characteristics. The rapid and dynamic development of computer techniques, together with the development of new programming languages, has allowed more detailed research into the classification and qualitative evaluation of carrot roots. Hahn and Sanchez [56] developed an algorithm to accurately estimate the volume of carrot roots using two images tilted by 90°. Xie et al. [1] first organoleptically extracted image features of carrot roots and then classified them into four different classes using backpropagation in a neural network (BPNN), support vector machines (SVMs), and extreme learning machines (ELMs). On the other hand, Zhu et al. [57] and Ni et al. [43] used neural network models to automatically identify defective carrot roots while recognising a specific type of defect. Many solutions and algorithms for image recognition based on the specific characteristics of each carrot defect have been proposed in the literature [1,24,26]. Predictive models presented in the literature to estimate carrot root yield were mainly based on satellite images [58,59,60,61]. This approach resulted in a relatively large prediction error, but is undoubtedly a fast and cheap approach.
The hypothesis of the study was formulated in the form of the following question: Is it possible to develop an accurate yield loss prediction model for carrot roots in the process of carrot heading, based on artificial neural networks?
The aim of the vast majority of proposals available in the literature is to qualitatively evaluate and classify carrot roots from the perspective of the food and agri-food industry. The economic aspect of agricultural production and carrot cultivation is equally important. The aim of this work is to develop an algorithm for predicting carrot root yield losses at the stage of mechanical heading and harvesting from the field. The input database is actual field trials and tests of the heading. The realisation of the objective of the work will allow an accurate and automatic adjustment of the root heading machine according to the prevailing agrotechnical conditions.

2. Materials and Methods

2.1. Definition of Criteria for Predicting Carrot Root Yield Loss

Assumptions based on mechanical parameters of the heading machine and agrotechnical factors related to the quality requirements of the European Union for fresh fruit and vegetables covered by the Common Market Organisation (CMO) were used as a basis for defining criteria for predicting yield losses of carrot roots during mechanical heading using AI models.
Table 1 shows the twelve basic criteria with the marginal values used in the prediction and loss estimation process. The marginal values of the prediction process were determined on the basis of field experiments in which the distance between plants in a row, the distance between plants in a row on a ridge, the height of the head above the soil surface, and the height of the root tip were measured on randomly selected plots of 9 m2. The yield of carrot roots per 9 m2 plot, the weight, diameter, and the length of a single carrot root were then determined from the samples taken. On the other hand, on the basis of the heading machine trials, the limiting values for the angular and progressive speed in the rotation of the heading disc, the height of the heading disc above the furrow surface, and the progressive speed of the machine unit were defined.

2.2. Dataset Preparation

Experiments to obtain data to simulate yield losses during mechanical heading of carrot roots were carried out on two farms located in the villages of Dąbrowa Biskupia (52°78′ N, 18°55′ E), Kujawsko-Pomorskie province, and Brzezie (51°89′ N, 17°87′ E), Wielkopolskie province. In both trial farms, carrots were grown on trapezoidal ridges at a distance of 75 cm. On one of the ridges, 2 rows of carrot seeds were sown at a distance of 7 cm. The sowing depth was 2.0–2.3 cm, depending on the conditions. The working speed during sowing was 3.5–4.0 km∙h−1. The following varieties grown in the trials were those recommended by the processing industry: Bangor, Komarno, Muleta, and Warmia, which, according to the growers, are very productive but require deep soil cultivation. The roots of these varieties are cylindrical and have strong foliage, which is important for mechanical heading. Detailed information characterising the varieties is given in Table 2.
For each variety, yield measurements were taken from randomly selected plots of 9 m2 (Figure 1a). The weight of individual carrot roots from these plots (Figure 1b) was measured using a CAS corporation laboratory balance, model SW-1, with a graduation of 1 g. The length of the carrot roots was measured using a stiff rod measuring device with an accredited calibration certificate, with a measuring scale of 1 mm, and the diameter was measured using a Digital Caliper SDH caliper (Figure 1c), with a measuring scale of 0.01 mm. Materials are collected on the platform Supplementary Materials https://github.com/piotrrybacki/carrot-disc.git, (accessed on 26 August 2024).

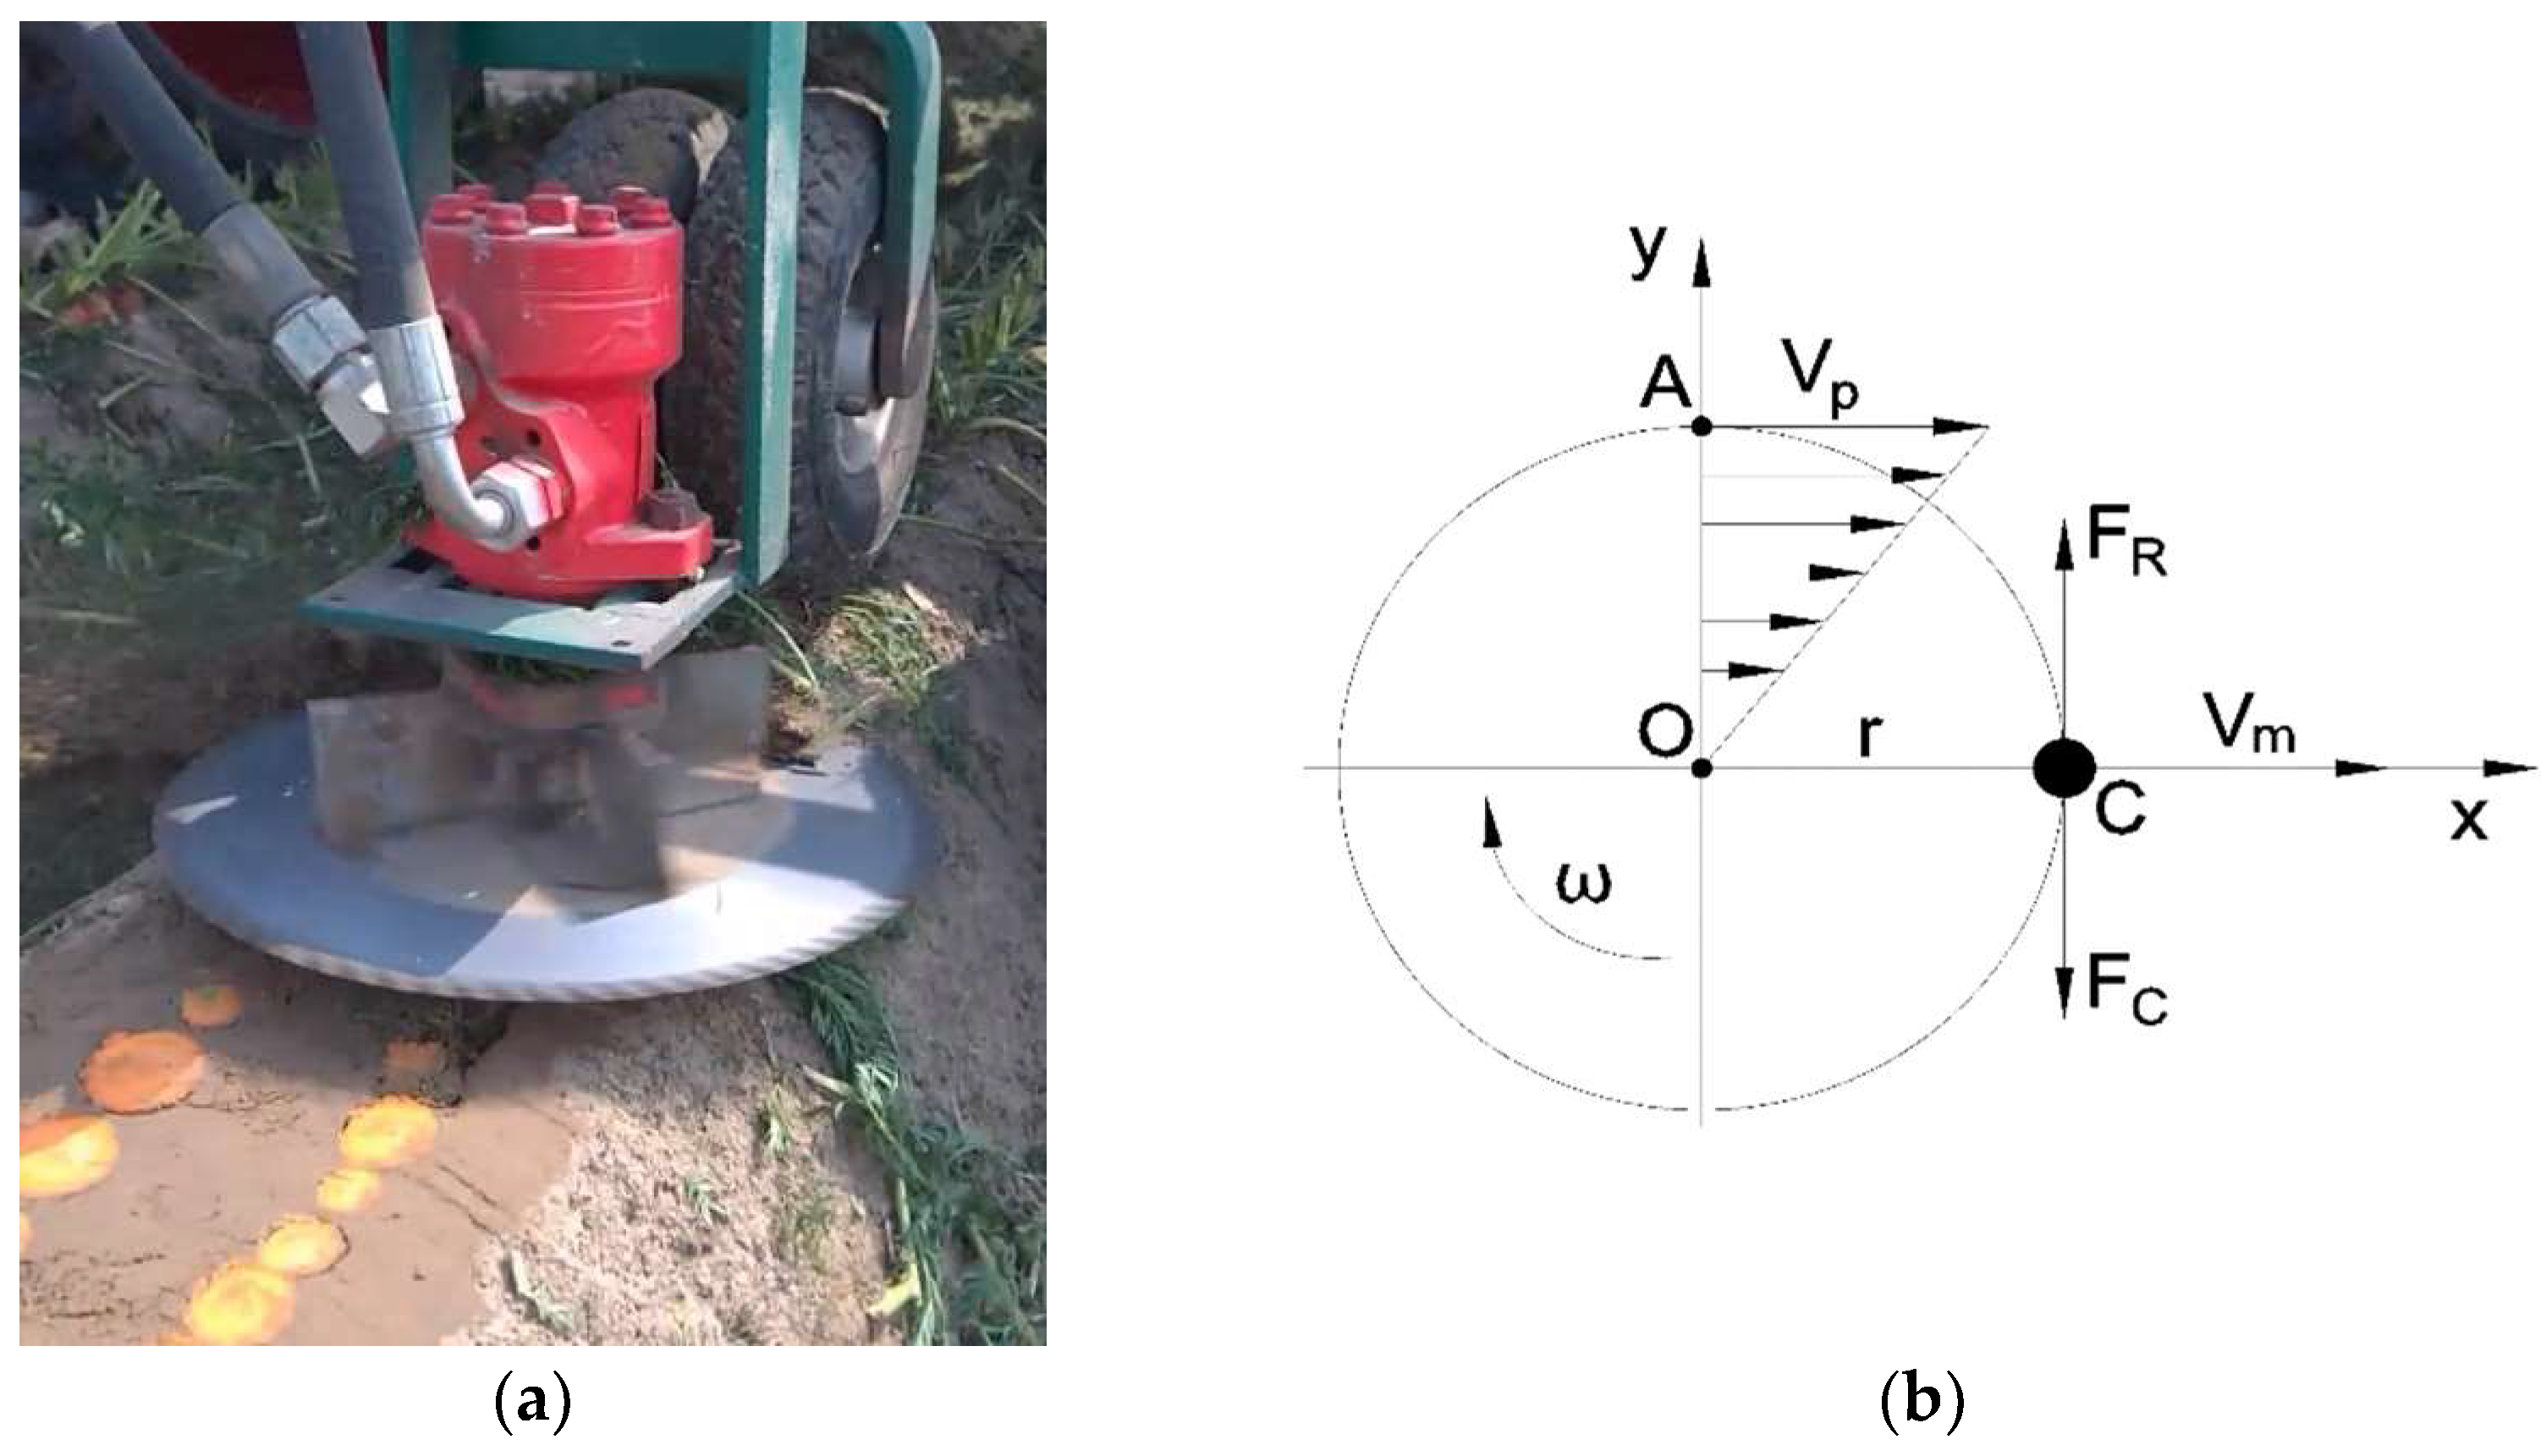
2.3. Design of a Carrot Root Heading Machine

Among the designs of carrot root heading machines known to date, the main technical problem encountered in field conditions is the susceptibility of the cutting unit to mechanical damage, most commonly caused by stones. Intense abrasive wear of the cutting blades operating at the soil–biomaterial interface is also a problem. The most common cause of damage or excessive wear is a malfunctioning of the terrain shape mapping system.
The simulation study used a design with a working element in the form of a heading disc with knives on the periphery, driven by a BMR 50 hydraulic motor. The disc rotates at a speed in the range of 45–725 rpm−1 and achieves a torque of Mo = 100 Nm, which influences the cutting force of the FC. The carrot root heading machine in operation is shown in Figure 2a, and the distribution of speeds and forces during the mechanical heading process is shown in Figure 2b.

2.4. Predictive Model for Carrot Root Yield Loss

Modelling and predicting agricultural production processes have high cognitive and practical values. Plant growth, the threat of pathogens and pests, and the structure of agricultural machinery treatments are mostly non-linearly measurable processes that can be described mathematically. However, they depend on a number of dynamically changing factors. In this analysis, the non-linearity of the criteria adopted for predicting carrot root yield losses was first checked using multiple regression function analysis. Preliminary evaluation of the data and their analysis using multiple linear regression will also allow the weights of the individual input criteria to be determined. The general form of the multiple linear regression equation is shown in Equation (1):
y = α 0 + α 1 x 1 + α 2 x 2 +   +   α n x n + ε ,
where y—the dependent variable, i.e., carrot root yield loss during heading; α0—the free expression, which determines the value of y when all xs are equal to zero; α1, α2, and αn—the regression coefficients, which determine how each independent variable affects y, x1, x2, and xn—the independent variables; ε—the error, which represents residuals or noise in the data that the model cannot explain.
The artificial neural network model proposed in this paper, called CH-NET (Carrot Harvest-NET), allows a multi-criteria analysis of the determinants of carrot root yield loss. Taking into account the number of 1205 measurements (trials) and the number of inputs to the network (criteria), it was determined that it should have a structure of 12:3 × 12:1 (12 inputs, 3 hidden layers with 12 neurons per layer, and 1 output) in order to be generalisable (Figure 3). The decision to choose three hidden layers was based on previously conducted simulation studies. It was dictated by the desire to avoid the danger of overfitting the model.
In the input layer of the CH-NET, criteria (factors) affecting the amount of yield loss in carrot roots were marked from x1 to x12. In this model, an S-type hyperbolic function described by Equation (2) was used to transfer and combine the hidden and output layers:
f ( x ) = e x e x e x + e x ,
Each factor of the input vector X = [x1, x2,…, x12]T is defined by a numerical value that affects the yield loss of the carrot roots. The values from w1,1 to w12,12 are the components of the weight vector W, which is the combination of the input layer with the first hidden layer and the subsequent hidden layers, Equation (3).
W = w 1,1         w 1,2 w 1,12 w 2,1         w 2,2 w 2,12                           w 12,1       w 12,2   w 12,12   ,
In the proposed model for predicting carrot root loss during heading, when calculating the output values of the hidden layers, the threshold vector B = [b1, b2,…, b12]T is considered as the weight value of a node with a fixed value of 1 in the input layer. Therefore, the input vector X can be extended to X= [XT, 1]T = [x1, x2,…, x12, 1]T. Similarly, the weight vector from the input layer to the hidden layer W can be extended to W′ according to Equation (4):
W = w 1,1           w 1,2 w 1,12       b 1   w 2,1           w 2,2 w 2,12       b 2                                                 w 12,1         w 12,2   w 12,12       b 12     ,
Therefore, the output value F can be expressed as follows in Equation (5):
F = f ( W · X ) ,
Similarly, the weight vector T from the hidden layer to the output layer was extended to the form T= [t1, t2,… t12, b0]T. Thus, the final value of the output layer of the neural network, which is the prediction model for carrot root yield loss, was obtained in Equation (6):
y = F T       1 · T   T ,
The dataset used in the prediction process was randomly divided into a learning set, a validation set, and a test set. The selection of the weights is performed in the learning set, but the ultimate goal is to minimise the error for the test set, the so-called generalisation error. During the learning phase of the network, a learning set was used to control the learning process by checking the degree of training of the neurons. In fact, learning involved two phases: selecting weights for the learning set and testing the weights on samples from the test and validation sets. The modification of the values of the weights continued until the approximation criterion was not reached in the learning set (minimisation of the approximation error) or the error value did not increase in the validation set. For both sets, the error function is usually the sum of the squares of the deviations (SS) between the target value and the output value of the network. When the selection of weights is complete, the network enters the replay mode using the test set. This contains values that were not previously used to train the network. If the network structure and weights were correctly selected, the model should generate the smallest possible error; i.e., the global minimum of the objective function should be achieved. The validation of the model, i.e., its assessment in terms of its ability to predict carrot root yield losses, was carried out on the basis of the value of the global model error (GE), calculated for the test set from Equation (7):
G E = i = 1 n z i y i 2 i = 1 n z i 2 ,
where n—number of cases, z—set value (benchmark), and y—network response.
In addition, the error values can be analysed as a criterion for the quality of the model, both in the learning phase and in the test and validation phases. The most commonly used criteria are as follows:
-
Mean error:
M E = 1 n   i = 1 n z i y i ,
-
Absolute mean error:
M A E = 1 n   i = 1 n / z i y i /   ,
-
Standard deviation:
R M S = i = 1 n z i y i 2 n 1   ,
-
Normalised standard deviation:
n R M S = R M S y m a x   y m i n ,
-
Error variance:
M S E = 1 n 1   i = 1 n z i y i 2 ,
-
Mean absolute percentage error:
M A P E = 1 n   i = 1 n y i y ^ i y i · 100 % ,
Additional measures of the quality of the carrot root yield loss prediction model used in this study were the standard deviation ratio (SDR), calculated as the standard deviation of the prediction errors divided by the standard deviation of the output variable, and Pearson′s linear correlation coefficient (R), calculated overall or by crop type, for the network and target responses. The generalisation ability, i.e., the ability to generalise the knowledge with respect to the modelled prediction of carrot root yield losses, provides the following conditions:
-
the learning set is representative of the modelled yield loss prediction, taking into account the criteria considered;
-
the number of learning cases exceeds the number of connections in the network (number of network weights) by a factor of ten;
-
the learning process is completed when the minimum error on the test set is reached.
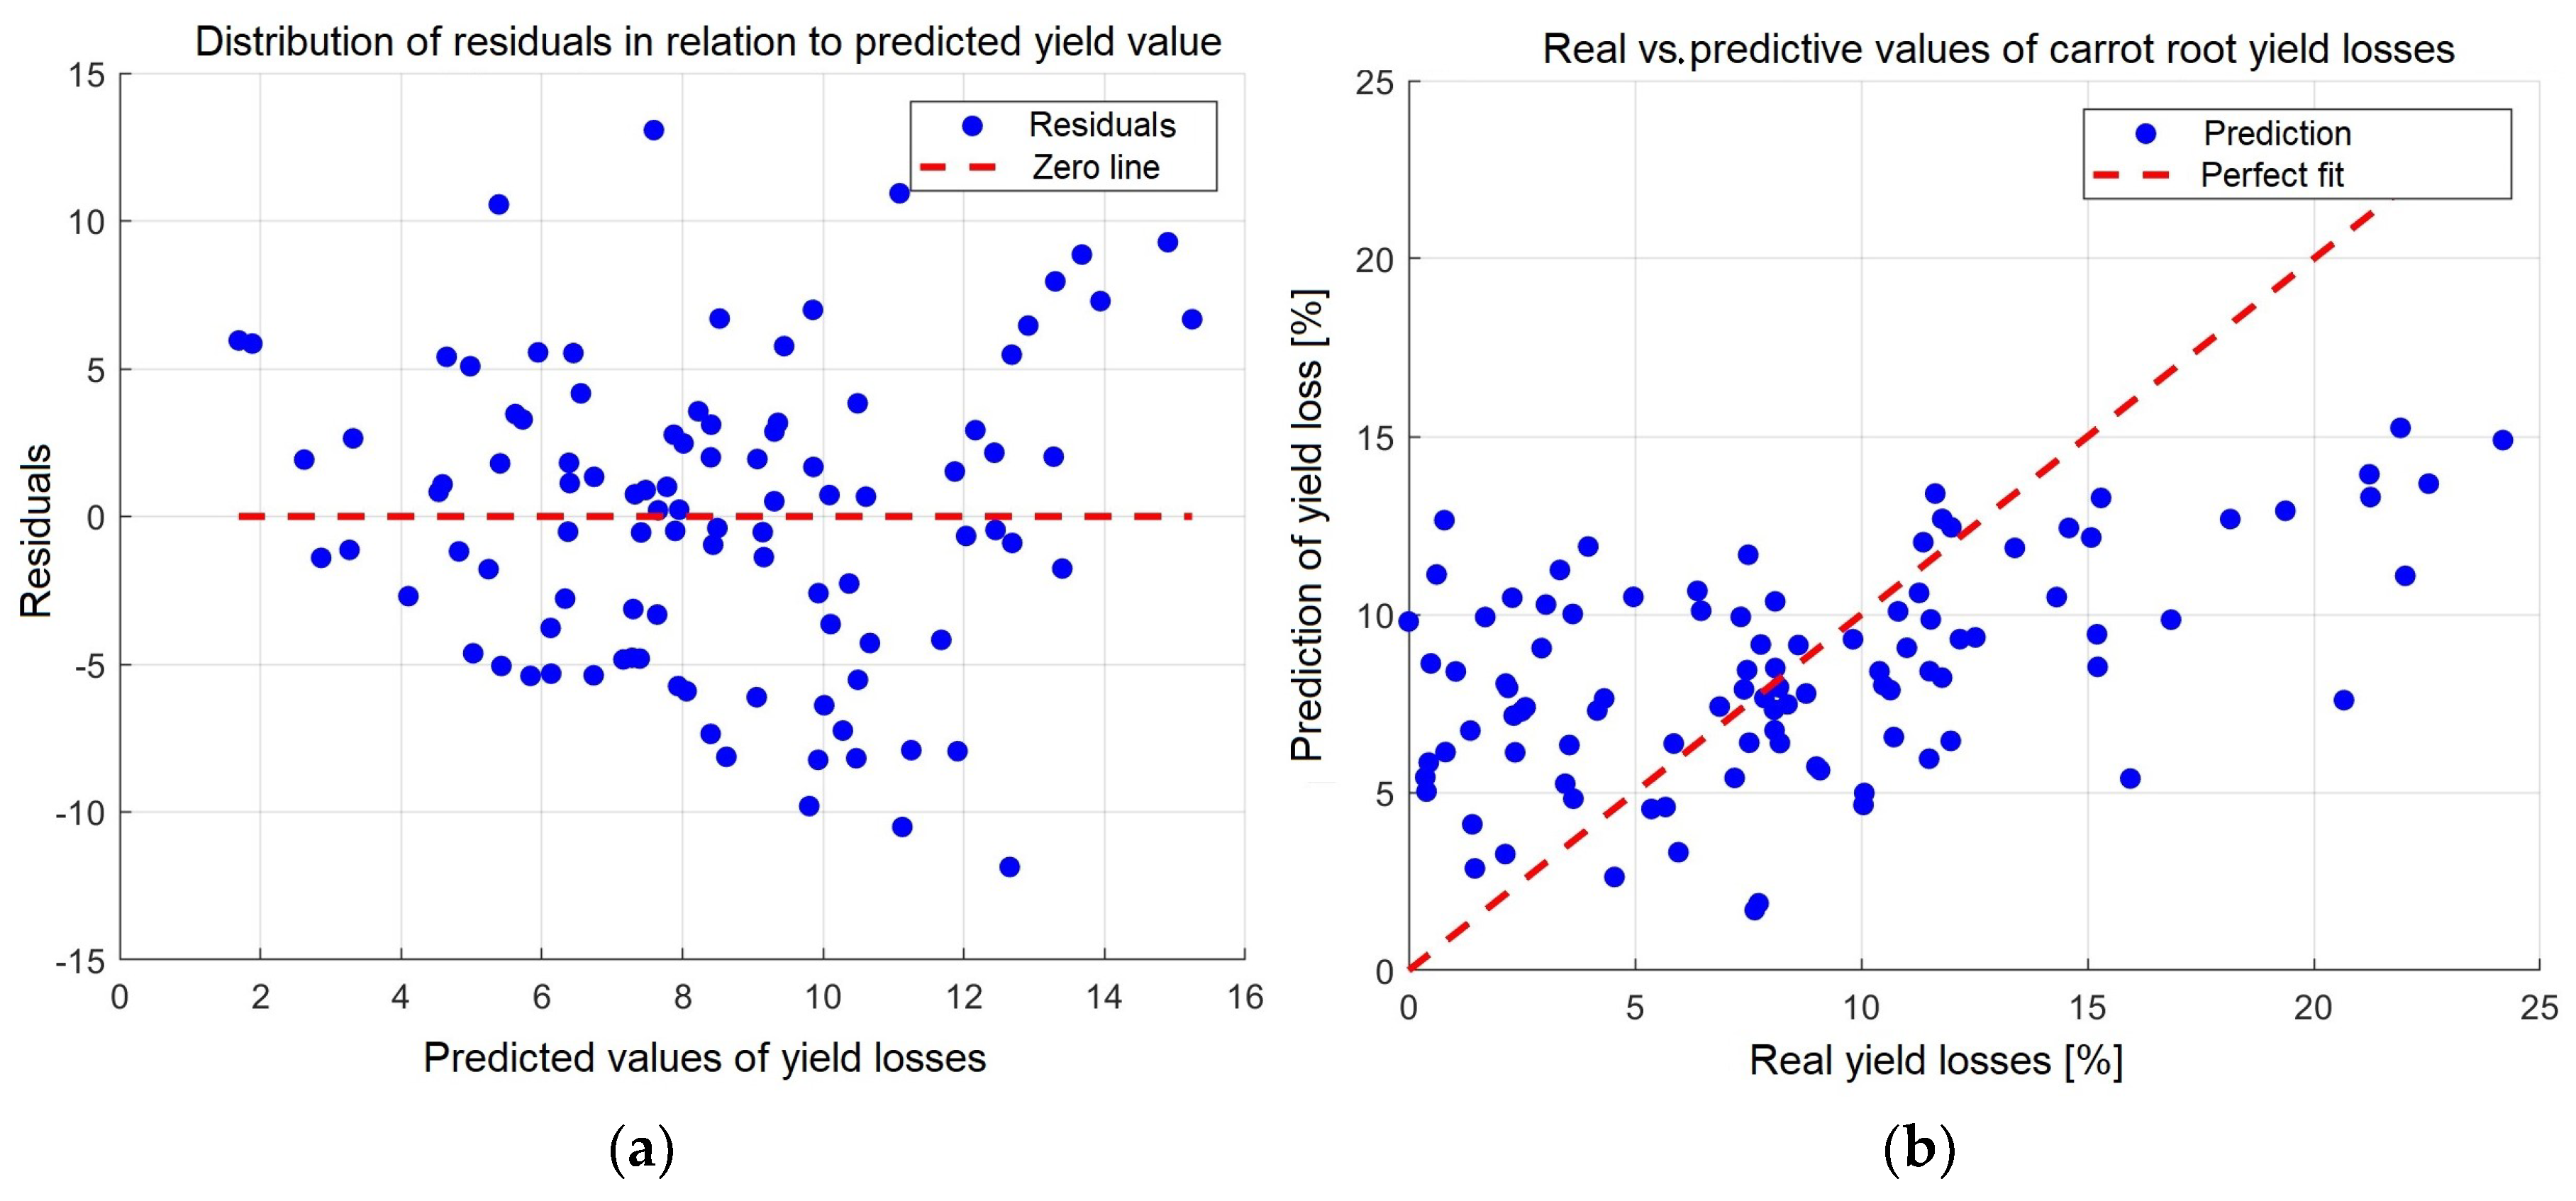
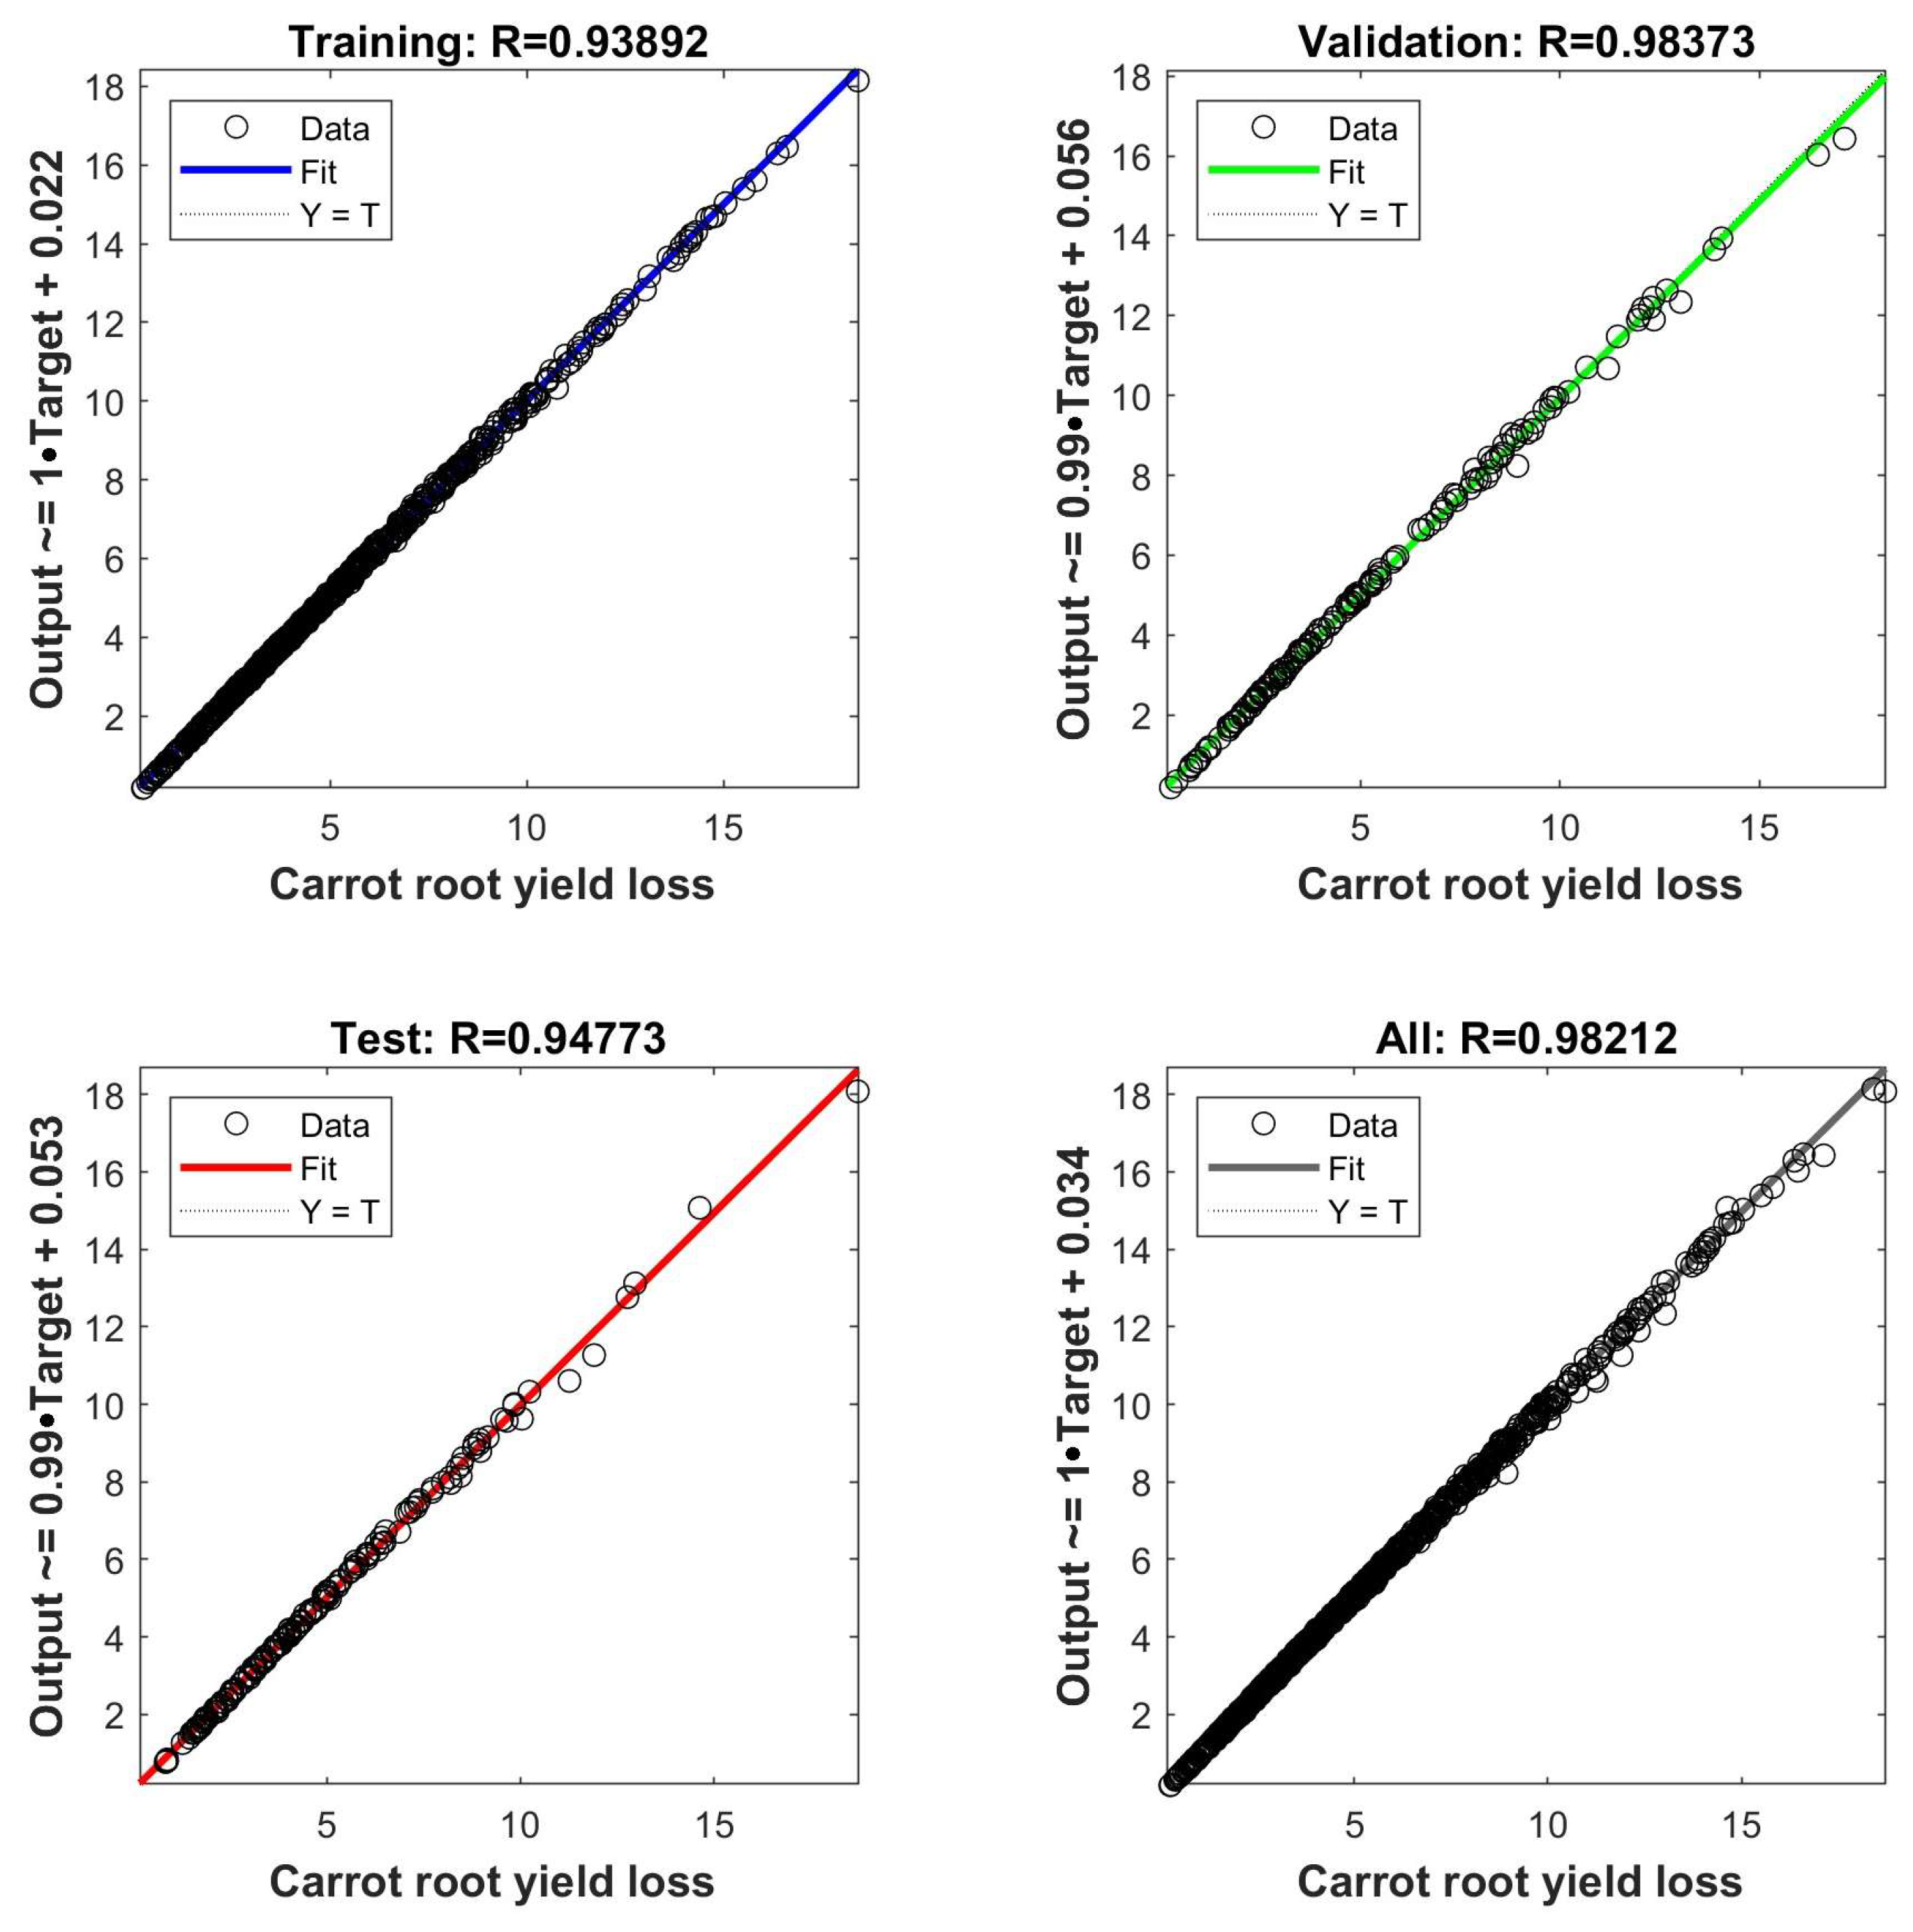
To ensure a good generalisability of the developed network model, the Vapnik–Chervonenkis dimension (VCdim) was used, which reflects the complexity of the network. The upper and lower bounds of this measure can be estimated from the relation (14):
2 K 2 N     V C d i m     2 N w 1 + l o g N w ,
where [K/2]—integer part of the number, N—number of inputs of the network (dimension of the input vector), K—number of neurons in the hidden layer, Nw—total number of connections in the network (corresponds to the number of weights), and Nn—total number of neurons in the network.
The lower bound of this measure is approximately equal to the number of connections between the input layer and the hidden layer, and the upper bound is more than twice the total number of connections in the network. In practice, the number of all defined network weights is taken as the VCdim measure. The higher the number of connections in the network, the higher the complexity of the network and consequently the higher the value of the VCdim measure.
Two software tools, MATLAB R2024a and the high-level programming language Python 3.9, together with libraries (programming environments) for scientific computing, were used to develop the following algorithms for predicting carrot root yield loss: Scikit-shape, Numpy, SciPy, Keras, Scipy, and TensorFlow 2.0.
The dataset of 1205 trials was divided into a learning set containing 723 (60% of the trials) randomly selected measurements and test and validation sets containing 241 (20% each) of the remaining trials. The number of cycles, on the other hand, depended on the achievement of the approximation criterion, i.e., when the algorithm reaches the relevant weights.

3. Results

In the first stage, a simple linear model was used to predict carrot root yield losses during heading by performing a multiple regression function analysis for root weight losses in terms of the factors causing them. A two-way stepwise selection method of variables in the model was used to select the final multiple regression model, which included criteria directly influencing losses and statistically significantly related to yield losses. The main criteria considered were distance between carrot roots in the row (x1), distance between carrot roots between rows on a ridge (x2), height of the carrot root heads (x3), height of the carrot root head overhang (x4), yield of carrot roots per 9 m2 area (x5), and height of the heading disc above the ridge surface (x11). The code for the multiple regression analysis was developed in MATLAB and published on the GITHUB platform at the link Supplementary Materials https://github.com/piotrrybacki/carrot-disc.git (code 1, accessed on 26 August 2024). The final version of the model included six causal variables (Table 3). The coefficient of determination for this model was R2 = 0.9741, and the coefficient of determination corrected for degrees of freedom was R2adj = 0.9739.
It might therefore appear that a simple statistical multiple regression model would be sufficient to predict the value of carrot root weight loss. However, it should be borne in mind that the use of a linear model is subject to strict assumptions about the variables and characteristics of the model itself. The first condition is that the dependent variable, in this case carrot root yield loss, must be normally distributed. Since weight loss is a type of mean, i.e., total loss per unit of measurement, it is assumed to have a normal distribution according to the Lindeberg–Lévy theorem, called the central limit theorem [62]. This condition is therefore fulfilled. The second basic assumption of the linear multiple regression model concerns the residuals, i.e., the differences between the values obtained from the regression model and the actual values of the dependent variable, i.e., in this study, carrot root yield loss. It is assumed that the residuals are random and that their distribution is normal [63]. In the yield loss model investigated, the residuals were not random as they did not form a random set of points on the graph representing their distribution (Figure 4).
Furthermore, an analysis of the conformity of the distribution of the residuals to the normal distribution using four different statistical tests confirmed that the distribution was not close to the normal distribution (Anderson–Darling statistic = 3.3122, Cramer-von Miles statistic = 0.6994, Kolmogorov–Smirnov statistic = 0.0780, and Shapiro–Wilk statistic = 0.9747 at the significance level α = 0.05). Difficulties in meeting the assumptions of the linear multiple regression model regarding the distribution of the residuals led to the conclusion that it was not suitable for predicting the amount of yield loss of carrot roots during the mechanical heading process. In the course of the analysis, it was concluded that non-linear models, specifically artificial neural networks, should be used.
A dataset of 1205 trials and 12 variables was used to build a predictive model of carrot yield loss during mechanical heading. The dataset was divided into a learning set containing 723 (60% of the trials) randomly selected measurements and test and validation sets containing 241 (20% each) of the remaining trials. The developed algorithm for the adopted neural network structure is available at Supplementary Materials https://github.com/piotrrybacki/carrot-disc.git (code 2, accessed on 26 August 2024).
The CH-NET neural network model with a structure of 12:3 × 12:1 and 432.00 ≤ VCdim ≤ 263.64 reached the approximation criterion in 48 cycles; i.e., the weights were adapted by the learning algorithm 48 times (Figure 5).
The quality of the model fit is shown in Figure 6, from which it can be seen that Pearson’s linear correlation coefficients for the learning (r = 0.9389), test (r = 0.9477), and validation (r = 0.9837) sets and the generalised coefficient (r = 0.9821) obtained high values. This means that the output value y obtained from the CH-NET model, i.e., the amount of yield loss of carrot roots, is close to the set values obtained from the empirical tests. This proves that CH-NET is able to correctly represent the characteristic relationships of the modelled phenomenon.
The goodness of fit of the CH-NET model was evaluated on the basis of the determined value of the global error (GE), which indicates that the proposed network makes an error of the order of 0.0931 t·ha−1 in predicting carrot root yield losses (Table 4). This demonstrates the correct choice of network architecture, where three hidden layers of 12 neurons each ensure the generalizability of the model.
As the analyses and simulations showed, some of the input variables (e.g., distance between carrot roots in a row—x1, distance between carrot roots in rows on a ridge—x2, angular speed of the heading disc—x9, and progressive speed in rotary motion—x10) did not contribute significant information to the model in terms of yield losses. The results of the correlation analysis in Figure 7 show that the main parameters influencing the amount of yield loss of carrot roots during the stunting process is the height of the carrot root head protrusion—x4 and the height of the heading disc above the furrow surface—x11.
Reducing the number of input variables simplifies the network structure. As can be seen from Table 5, the error values obtained when running the network for the dataset without these variables and the error obtained with the set of variables were close to one, which means that removing any of these variables has practically no effect on the quality of the model.
An example representation of the carrot root yield loss (y) as a function of two input variables, namely the height of the carrot root head protrusion—x4 and the height of the heading disc above the furrow surface—x11, which obtained the greatest weight in the prediction process, is shown in Figure 8. Therefore, the model developed will allow the height of the mechanical heading disc to be automatically adjusted to the field surface. The shape of the plane that determines the value of yield loss or raw material contamination (y) by undercut leaves is described in Equation (15):
y = 0.1 ·   x 4 2 + 0.4 x 11 2 0.1 x 4 × x 11
Figure 8 shows that at x4 = 55.00 mm and x11 = 0.00 mm, the highest yield losses are left in the field, reaching 12.10%. On the other hand, at x4 = 0.00 mm and x11 = 25.00 mm, the CH-NET prediction model predicts a contamination of 6.25% of the raw material by undercut leaves (Supplementary Materials https://github.com/piotrrybacki/carrot-disc.git, code 3, accessed on 26 August 2024).
From a practical point of view, the economic aspect of mechanical heading is important. It depends mainly on the amount of yield loss of carrot roots left in the field, but also on the number of undercut leaves and leaves left by the root. In the latter case, the undercut leaves are a contaminant and cause a reduction in the quality class of the entire raw material. Figure 9 shows the relationship between carrot root yield losses and raw material contamination for empirical and predictive data in terms of financial losses (Supplementary Materials https://github.com/piotrrybacki/carrot-disc.git, code 4, accessed on 26 August 2024). The CH-NET model clearly shows that the highest losses occurred when mechanical heading was directly on the ridge surface, with an average root protrusion height above the surface of 38 mm, i.e., 12.09 t·ha−1. At the same time, Figure 8 shows that the lowest yield losses left in the field were obtained by placing the heading disc at a height of 20 mm above the ridge surface, i.e., 0.26 t·ha−1. At the same time, by setting the heading disc at 25 mm above the ridge surface and an average head height of 17 mm, the degree of contamination of the raw material increases significantly to approx. 6.247 t·ha−1.

4. Discussion

Assessing the quality of harvested raw carrot root has become an important part of its storage and further processing and plays a key role in the production of high-quality products. The degree of contamination of the raw material, associated with inaccurately cut leaves, is important and determines the quality grade. Excessive mechanical heading of carrot roots, in turn, causes losses by leaving the crop in the field. In both cases, there is a measurable financial loss to the grower. Methods are therefore being sought to predict losses and optimise the parameters of the heading machine. For the analysed heading machine design, the proposed CH-NET neural network model achieves global error (GE) values for the prediction of carrot root yield losses at the level of 0.0931 t·ha−1 for all twelve adopted criteria. However, when the number of criteria is reduced, the error increases to 0.0991 t·ha−1. In another paper, Rybacki et al. [26] also proposed a model for automatic classification of carrot roots (CR-NET) using a convolutional neural network (CNN). The computational algorithm developed and repeatedly tested allowed the classification of carrot root images with an accuracy of more than 89.06%. Suarez et al. [64] proposed models for predicting carrot root yield and its spatial variability using multispectral and hyperspectral sensor data, comparing the accuracy. The authors obtained R2 < 0.57 for multispectral sensors and R2 < 0.10 for hyperspectral sensors. In another study, Suarez et al. [65] proposed a carrot root yield prediction model based on satellite imagery. The average yield prediction error of this model was estimated by the authors to be 16.90 t ha−1 (27.00% of the total yield). Satellite imagery was also used by Madugundu et al. [61] to obtain input data for the prediction model, supplemented by measurements of chlorophyll content. The basis of this model is RF, with accuracy depending on the analysis variant, measured by an R2 ≥ 0.82. de Lima Silva et al. [60] developed a model for predicting carrot yield and quality based on data from chemical analyses. They used artificial neural network (ANN), random forest (RF), and multiple linear regression (MLR) algorithms to build the model. They achieved accuracies of R2 = 0.68 (ANN), R2 = 0.67 (RF), and R2 = 0.61 (MLR). Deng et al. [25] proposed a carrot classification system based on image analysis and deep neural networks to automatically assess the root surface quality. The analyses and calculations showed that the recognition accuracy of the proposed model was 99.82%. A classification model for carrot roots based on their geometric shapes was applied by Xie et al. [1]. They extracted six colour parameters and six shape parameters, namely length, maximum diameter, average diameter, area, perimeter, and aspect ratio. Based on these twelve parameters, the authors proposed root recognition and classification models and obtained an image acquisition system with an accuracy of 96.67% in extracting carrot quality characteristics. Xie et al. [1] also proposed five quantitative indicators to define the quality of carrot roots, namely greening, degree of bending, number of fibrous roots, degree of surface breakage, and degree of breakage. By testing the models on 720 randomly selected images, they achieved an overall geometric shape recognition rate of 90.90%. In a previous study, Deng et al. [24] proposed a method to detect geometric defects in carrot roots, e.g., deformed, fibrous, and surface-fractured, with a detection accuracy of 95.50%, 98.00%, and 88.30%, respectively, which also affects yield. Wei et al. [59] developed a method to generate a carrot yield map applying a random forest (RF) on a database consisting of satellite spectral data and carrot yield samples. The entire dataset was divided into training and test sets. The developed RF yield prediction algorithm had an R2 statistic value of 0.82, which is significantly lower than the value proposed in our study.

5. Conclusions

This paper proposes an artificial neural network model CH-NET to predict the yield loss of carrot roots during harvesting at the heading stage and, indirectly, the economic losses associated with leaving the crop in the field or contaminating the raw material with undetasseled leaves. The CH-NET network model had an architecture consisting of an input layer, three hidden layers with 12 neurons each, and an output layer with one neuron. Twelve input criteria were defined for the analysis and testing of the network, eight of which related to carrot root parameters and four to the heading machine. The training, testing, and validation database of the CH-NET network consisted of the results of field trials and tests of the operation of the patented (P.242097) root heading machine.
The quality of the model fit, estimated by Pearson′s linear correlation coefficients for the learning (r = 0.9389), test (r = 0.9477), and validation (r = 0.9837) sets and the generalised coefficient (r = 0.9821) obtained high values. This means that the output value y obtained from the CH-NET model, i.e., the amount of yield loss of carrot roots, is close to the set values obtained from the empirical tests. The proposed CH-NET neural network model for all twelve adopted criteria achieves global error (GE) values for predicting carrot root yield losses of 0.0931 t·ha−1 compared to actual field trials. However, when the number of criteria is reduced to eight, the error increases to 0.0991 t·ha−1. That is, the prediction was realised with an accuracy of 90.69%.
The developed CH-NET model allows the prediction of economic losses associated with root mass left in the field or contamination of the raw material with undercut leaves. The simulations carried out showed that minimum root losses (0.263 t·ha−1) occur at an average root head projection height of 38 mm and a heading height of 20 mm from the ridge surface.

6. Patents

A predictive model was developed on the basis of criteria that are technical parameters of a patent-protected carrot root heading machine with patent number P.242097.

Supplementary Materials

The data presented in this study are available on demand from the first author. The following supporting information can be downloaded at https://github.com/piotrrybacki/carrot-disc.git (accessed on 26 August 2024).

Author Contributions

Conceptualization, P.R. and P.P.; methodology, P.R., P.P., and I.K.; software, P.R.; validation, P.R., P.P., and A.O.; formal analysis, P.R., A.O., and I.K.; resources, P.R., P.P., A.O., E.O., and I.K.; data curation, P.R., P.P., A.O., E.O., and I.K.; writing—original draft preparation, P.R., P.P., and I.K.; writing—review and editing, P.R., P.P., and I.K.; visualization, P.R. and P.P.; supervision, P.R. All authors have read and agreed to the published version of the manuscript.

Funding

The publication was co-financed by the Polish Minister of Science and Higher Education as part of the Strategy of the Poznan University of Life Sciences for 2024-2026 in the field of improving scientific research and development work in priority research areas.

Institutional Review Board Statement

Not applicable.

Data Availability Statement

The data presented in this study are original field empirical studies and are available from the authors on request. They were collected from the Department of Agronomy, Faculty of Agronomy, Horticulture and Bioengineering, Poznań University of Life Sciences.

Conflicts of Interest

The authors declare no conflict of interest.

References

  1. Xie, W.; Wang, F.; Yang, D. Research on Carrot Grading Based on Machine Vision Feature Parameters. IFAC PapersOnLine 2019, 52, 30–35. [Google Scholar] [CrossRef]
  2. Jahanbakhshi, A.; Kheiralipour, K. Evaluation of image processing technique and discriminant analysis methods in postharvest processing of carrot fruit. Food Sci Nutr. 2020, 18, 3346–3352. [Google Scholar] [CrossRef] [PubMed]
  3. Szczepańska, J.; Barba, F.J.; Skąpska, S.; Marszałek, K. High pressure processing of carrot juice: Effect of static and multi-pulsed pressure on the polyphenolic profile, oxidoreductases activity and colour. Food Chem. 2020, 307, 125549. [Google Scholar] [CrossRef] [PubMed]
  4. Eurostat. Available online: https://european-union.europa.eu/index_en (accessed on 25 May 2024).
  5. Luo, T.; Li, S.; Li, J.; Guo, J.; Feng, R.; Mu, Y.; Hu, T.; Sun, Y.; Guo, Y.; Gong, H. Image Fuzzy Edge Information Segmentation Based on Computer Vision and Machine Learning. J. Grid Comput. 2023, 21, 56. [Google Scholar] [CrossRef]
  6. Lokesh, Y.; Rithvik, M.; Madhavi, M.; Madhu, S.; Rajeshwar Rao, K. Image Classification Using CNN with CIFAR-10 Dataset. Int. J. Res. Appl. Sci. Eng. Technol. 2024, 12, 229–231. [Google Scholar] [CrossRef]
  7. Bankar, R.; Bargat, N.; Hanmante, I.; Dakore, H. Face Recognition Using Facenet Deep Learning Network for Attendance System. Int. J. Sci. Res. Comput. Sci. Eng. Inf. Technol. 2022, 8, 458–463. [Google Scholar] [CrossRef]
  8. Lemley, J.; Bazrafkan, S.; Corcoran, P. Deep learning for consumer devices and services: Pushing the limits for machine learning, artificial intelligence, and computer vision. IEEE Consum. Electron. Mag. 2017, 6, 48–56. [Google Scholar] [CrossRef]
  9. Lemley, J.; Bazrafkan, S.; Corcoran, P. Smart augmentation learning an optimal data augmentation strategy. IEEE Access. 2017, 5, 5858–5869. [Google Scholar] [CrossRef]
  10. Davoudi Kakhki, F.; Freeman, S.A.; Mosher, G.A. Use of Neural Networks to Identify Safety Prevention Priorities in Agro-Manufacturing Operations within Commercial Grain Elevators. Appl. Sci. 2019, 9, 4690. [Google Scholar] [CrossRef]
  11. Li, C.; Lu, Y.; Bian, Y.; Tian, J.; Yuan, M. Design of Safety Evaluation and Risk Traceability System for Agricultural Product Quality. Appl. Sci. 2024, 14, 2980. [Google Scholar] [CrossRef]
  12. Lu, R.; Wei, R.; Zhang, J. Human-computer interaction based on speech recognition. Appl. Comput. Eng. 2024, 36, 102–110. [Google Scholar] [CrossRef]
  13. Sainath, T.; Mohamed, A.R.; Kingsbury, B.; Ramabhadran, B. Deep convolutional neural networks for LVCSR. In Proceedings of the 2013 IEEE International Conference on Acoustics, Speech and Signal Processing, Vancouver, BC, Canada, 26–31 May 2013; pp. 8614–8618. [Google Scholar]
  14. Collobert, R.; Weston, J.; Bottou, L.; Karlen, M.; Kavukcuoglu, K.; Kuksa, P. Natural Language Processing (Almost) from Scratch. J. Mach. Learn. Res. 2011, 12, 2493–2537. [Google Scholar]
  15. van den Oord, A.; Dieleman, S.; Zen, H.; Simonyan, K.; Vinyals, O.; Graves, A.; Kalchbrenner, N.; Senior, A.; Kavukcuoglu, K. WaveNet: A generative model for raw audio. arXiv 2016, arXiv:1609.03499v2. [Google Scholar]
  16. Zhou, J.; Troyanskaya, O.G. Predicting effects of noncoding variants with deep learning-based sequence model. Nat. Methods 2015, 12, 931–934. [Google Scholar] [CrossRef] [PubMed]
  17. Esteva, A.; Kuprel, B.; Novoa, R.A.; Ko, J.; Swetter, S.M.; Blau, H.M.; Thrun, S. Dermatologist-Level Classification of Skin Cancer with Deep Neural Networks. Nature 2017, 542, 115–118. [Google Scholar] [CrossRef] [PubMed]
  18. Jermyn, M.; Mok, K.; Mercier, J.; Desroches, J.; Pichette, J.; Saint-Arnaud, K.; Bernstein, L.; Guiot, M.K.; Petrecca, K.; Leblond, F. Intraoperative brain cancer detection with Raman spectroscopy in humans. Sci. Transl. Med. 2015, 7, 274ra19. [Google Scholar] [CrossRef]
  19. Wang, K.; Wu, F.; Seo, B.R.; Fischbach, C.; Chen, W.; Hsu, L.; Gourdon, D. Breast Cancer Cells Alter the Dynamics of Stromal Fibronectin-Collagen Interactions. Matrix Biol. 2016, 60–61, 86–95. [Google Scholar] [CrossRef]
  20. Levine, S.; Pastor, P.; Krizhevsky, A.; Ibarz, J.; Quillen, D. Learning hand-eye coordination for robotic grasping with deep learning and large-scale data collection. Int. J. Robot. Res. 2018, 37, 421–436. [Google Scholar] [CrossRef]
  21. Pfeiffer, M.; Schaeuble, M.; Nieto, J.; Siegwart, R.; Cadena, C. From perception to decision: A data-driven approach to end-to-end motion planning for autonomous ground robots. In Proceedings of the 2017 IEEE International Conference on Robotics and Automation (ICRA), Marina Bay Sands, Singapore, 29 May–3 June 2017; pp. 1527–1533. [Google Scholar]
  22. Gupta, S.; Davidson, J.; Levine, S.; Sukthankar, R.; Malik, J. Cognitive Mapping and Planning for Visual Navigation. In Proceedings of the IEEE 2017 IEEE Conference on Computer Vision and Pattern Recognition (CVPR), Honolulu, HI, USA, 21–26 July 2017; pp. 2616–2625. [Google Scholar]
  23. Shalev-Shwartz, S.; Shammah, S.; Shashua, A. Safe, Multi-Agent, Reinforcement Learning for Autonomous Driving. arXiv 2016, arXiv:1610.03295. [Google Scholar]
  24. Deng, L.; Du, H.; Han, Z. A Carrot Sorting System Using Machine Vision Technique. Appl. Eng. Agric. 2017, 33, 149–156. [Google Scholar] [CrossRef]
  25. Deng, L.; Li, J.; Han, Z. Online defect detection and automatic grading of carrots using computer vision combined with deep learning methods. LWT 2021, 149, 111832. [Google Scholar] [CrossRef]
  26. Rybacki, P.; Sawinska, Z.; Kačániová, M.; Kowalczewski, P.Ł.; Osuch, A.; Durczak, K. Convolutional neural network model for the qualitative evaluation of geometric shape of carrot root. Agric. Food Sci. 2024, 33, 40–54. [Google Scholar] [CrossRef]
  27. Xie, W.; Wei, S.; Yang, D. Morphological measurement for carrot based on three-dimensional reconstruction with a ToF sensor. Postharvest Biol. Technol. 2023, 197, 112216. [Google Scholar] [CrossRef]
  28. Abdulridha, J.; Ampatzidis, Y.; Kakarla, S.C.; Roberts, P. Detection of target spot and bacterial spot diseases in tomato using UAV-based and benchtop-based hyperspectral imaging techniques. Precis. Agric. 2020, 21, 955–978. [Google Scholar] [CrossRef]
  29. Rybacki, P.; Niemann, J.; Bahcevandziev, K.; Durczak, K. Convolutional neural network model for variety classification and seed quality assessment of winter rapeseed. Sensors 2023, 23, 2486. [Google Scholar] [CrossRef] [PubMed]
  30. Rybacki, P.; Niemann, J.; Derouiche, S.; Chetehouna, S.; Boulaares, I.; Seghir, N.M.; Diatta, J.; Osuch, A. Convolutional Neural Network (CNN) Model for the Classification of Varieties of Date Palm Fruits (Phoenix dactylifera L.). Sensors 2024, 24, 558. [Google Scholar] [CrossRef]
  31. Grinblat, G.L.; Uzal, L.C.; Larese, M.G.; Granitto, P.M. Deep learning for plant identification using vein morphological patterns. Comput. Electron. Agric. 2016, 127, 418–424. [Google Scholar] [CrossRef]
  32. Sun, D.; Robbins, K.; Morales, N.; Shu, Q.; Cen, H. Advances in optical phenotyping of cereal crops. Trends Plant Sci. 2022, 27, 191–208. [Google Scholar] [CrossRef] [PubMed]
  33. Franco, M.O.K.; Suarez, W.T.; dos Santos, V.B.; Resque, I.S. A novel digital image method for determination of reducing sugars in aged and non-aged cachaças employing a smartphone. Food Chem. 2021, 338, 127800. [Google Scholar] [CrossRef]
  34. Li, L.; Wang, Y.; Jin, S.; Li, M.; Chen, Q.; Ning, J.; Zhang, Z. Evaluation of black tea by using smartphone imaging coupled with micro-near-infrared spectrometer. Spectrochim. Acta Part A 2021, 246, 118991. [Google Scholar] [CrossRef]
  35. Minz, P.; Sawhney, I.K.; Saini, C.S. Algorithm for processing high definition images for food colourimetry. Measurement 2020, 158, 107670. [Google Scholar] [CrossRef]
  36. Meenu, M.; Cai, Q.; Xu, B. A critical review on analytical techniques to detect adulteration of extra virgin olive oil. Trends Food Sci. Technol. 2019, 91, 391–408. [Google Scholar] [CrossRef]
  37. Vithu, P.; Moses, J.A. Machine vision system for food grain quality evaluation: A review. Trends Food Sci. Technol. 2016, 56, 13–20. [Google Scholar] [CrossRef]
  38. Ramirez-Paredesa, J.P.; Hernandez-Belmonteb, U.H. Visual quality assessment of malting barley using color, shape and texture descriptors. Comput. Electron. Agric. 2020, 168, 105110. [Google Scholar] [CrossRef]
  39. Hashim, N.; Onwude, D.I.; Maringgal, B. Chapter 15— Technological advances in postharvest management of food grains. In Research and Technological Advances in Food Science; Elsevier: Amsterdam, The Netherlands, 2021; pp. 371–406. [Google Scholar] [CrossRef]
  40. Hendrawan, Y.; Rohmatulloh, B.; Prakoso, I.; Liana, V.; Fauzy, M.R.; Damayanti, R.; Hermanto, M.B.; Al Riza, D.F.; Sandra, M.S. Classification of soybean tempe quality using deep learning. IOP Conf. Ser. Earth Environ. Sci. 2021, 924, 012022. [Google Scholar] [CrossRef]
  41. Xie, W.; Wei, S.; Zheng, Z.; Yang, D. A CNN-based lightweight ensemble model for detecting defective carrots. Biosyst. Eng. 2021, 208, 287–299. [Google Scholar] [CrossRef]
  42. Bhupendra, M.K.; Miglani, A.; Kankar, P.K. Deep CNN-based damage classification of milled rice grains using a high-magnification image dataset. Comput. Electron. Agric. 2022, 195, 106811. [Google Scholar] [CrossRef]
  43. Ni, J.; Liu, B.; Li, J.; Gao, J.; Yang, H.; Han, Z. Detection of Carrot Quality Using DCGAN and Deep Network with Squeeze-and-Excitation. Food Anal. Methods 2022, 15, 1432–1444. [Google Scholar] [CrossRef]
  44. Zhang, J.; Qu, M.; Gong, Z.; Cheng, F. Online double-sided identification and eliminating system of unclosed-glumes rice seed based on machine vision. Measurement 2022, 187, 110252. [Google Scholar] [CrossRef]
  45. Ahmed, I.; Yadav, P.K. Predicting Apple Plant Diseases in Orchards Using Machine Learning and Deep Learning Algorithms. SN Comput. Sci. 2024, 5, 700. [Google Scholar] [CrossRef]
  46. Hema Swathi, S.; Swetha, B.; Rohini, N.; Subalakshmi, V. Weed Remover Using Machine Learning. Int. J. Adv. Res. Sci. Technol. 2024, 13, 1308–1312. [Google Scholar] [CrossRef]
  47. Felix, F.C.; Kratz, D.; Ribeiro, R.; Nogueira, A.C. Machine learning in the identification of native species from seed image analysis. J. Seed Sci. 2024, 46, e202446002. [Google Scholar] [CrossRef]
  48. Mahajan, S.; Das, A.; Sardana, H.K. Image acquisition techniques for assessment of legume quality. Trends Food Sci. Technol. 2015, 42, 116–133. [Google Scholar] [CrossRef]
  49. Patrício, D.I.; Rieder, R. Computer vision and artificial intelligence in precision agriculture for grain crops: A systematic review. Comput. Electron. Agric. 2018, 153, 69–81. [Google Scholar] [CrossRef]
  50. Rybacki, P.; Przygodziński, P.; Osuch, A.; Blecharczyk, A.; Walkowiak, R.; Osuch, E.; Kowalik, I. The Technology of Precise Application of Herbicides in Onion Field Cultivation. Agriculture 2021, 11, 577. [Google Scholar] [CrossRef]
  51. Rybacki, P.; Przygodziński, P.; Blecharczyk, A.; Kowalik, I.; Osuch, A.; Osuch, E. Strip spraying technology for precise herbicide application in carrot fields. Open Chem. 2022, 20, 287–296. [Google Scholar] [CrossRef]
  52. Batchelor, M.M.; Searcy, S.W. Computer vision determination of the stem/root joint on processing carrots. J. Agric. Eng. Res. 1989, 43, 259–269. [Google Scholar] [CrossRef]
  53. Howarth, M.S. Reflectance characteristics of fresh-market carrots. Trans. ASAE 1990, 33, 0961–0964. [Google Scholar] [CrossRef]
  54. Howarth, M.S.; Searcy, S.W. Fresh market carrot inspection by machine vision. Opt. Agric. 1991, 1379, 141–150. [Google Scholar] [CrossRef]
  55. Howarth, M.S.; Brandon, J.R.; Searcy, S.W.; Kehtarnavaz, N. Estimation of tip shape for carrot classification by machine vision. J. Agric. Eng. Res. 1992, 53, 123–139. [Google Scholar] [CrossRef]
  56. Hahn, F.; Sanchez, S. Carrot volume evaluation using imaging algorithms. J. Agric. Eng. Res. 2000, 75, 243–249. [Google Scholar] [CrossRef]
  57. Zhu, H.; Deng, L.; Wang, D.; Gao, J.; Ni, J.; Han, Z. Identifying carrot appearance quality by transfer learning. J. Food Process Eng. 2019, 42, e13187. [Google Scholar] [CrossRef]
  58. Ni, J.; Li, J.; Deng, L.; Han, Z. Intelligent detection of appearance quality of carrot grade using knowledge distillation. Trans. CSAE 2020, 36, 181–187. [Google Scholar] [CrossRef]
  59. Wei, M.C.F.; Maldaner, L.F.; Ottoni, P.M.N.; Molin, J.P. Carrot Yield Mapping: A Precision Agriculture Approach Based on Machine Learning. AI 2020, 1, 229–241. [Google Scholar] [CrossRef]
  60. de Lima Silva, Y.K.; Furlani, C.E.A.; Canata, T.F. AI-Based Prediction of Carrot Yield and Quality on Tropical Agriculture. AgriEngineering 2024, 6, 361–374. [Google Scholar] [CrossRef]
  61. Madugundu, R.; Al-Gaadi, K.A.; Tola, E.; Edrris, M.K.; Edrees, H.F.; Alameen, A.A. Optimal Timing of Carrot Crop Monitoring and Yield Assessment Using Sentinel-2 Images: A Machine-Learning Approach. Appl. Sci. 2024, 14, 3636. [Google Scholar] [CrossRef]
  62. Ulyanov, V.V. From Classical to Modern Nonlinear Central Limit Theorems. Mathematics 2024, 12, 2276. [Google Scholar] [CrossRef]
  63. Soundararajan, K.; Xu, M.W. Central limit theorems for random multiplicative functions. J. D’anal. Math. 2023, 151, 343–374. [Google Scholar] [CrossRef]
  64. Suarez, L.A.; Robson, A.; McPhee, J.; O’Halloran, J.; van Sprang, C. Accuracy of carrot yield forecasting using proximal hyperspectral and satellite multispectral data. Precis. Agric. 2020, 21, 1304–1326. [Google Scholar] [CrossRef]
  65. Suarez, L.A.; Robertson-Dean, M.; Brinkhoff, J.; Robson, A. Forecasting carrot yield with optimal timing of Sentinel 2 image acquisition. Precis. Agric. 2024, 25, 570–588. [Google Scholar] [CrossRef]
Figure 1. Recording of field test results: (a) measurement of carrot root yield z·9 m−2, (b) measurement of weight of individual carrot roots, and (c) measurement of length and diameter of individual carrot roots [source: (a)—Przygodziński P.; (b,c)—Rybacki P.].
Agriculture 14 01755 g001
Figure 2. Carrot root mechanical heading according to patent number P.242097: (a) during work and (b) kinematic scheme: O—the centre of heading disc, A—cutting edge, ω—angular velocity of the disc, Vp—progressive speed of the disc, Vm—machine speed, C—carrot root, FC—cutting force, FR—cutting resistance force, and Mo—disc torque [source: (a)—Przygodziński P. (b)—Rybacki P.].
Agriculture 14 01755 g002
Figure 3. Structure of the CH-NET neural network model for the prediction of carrot root yield losses in the process of heading.
Agriculture 14 01755 g003
Figure 4. Graph of the scatter of residuals of carrot root yield losses during the heading process: (a) scatter of residuals vs. predicted values of yield losses and (b) actual vs. predicted values of carrot root yield losses.
Agriculture 14 01755 g004
Figure 5. Schematic of the learning, test, and validation process of the CH-NET model for the prediction of carrot root yield loss during mechanical heading. The circle indicates the 48th Epoch, where the best validation accuracy was obtained.
Agriculture 14 01755 g005
Figure 6. Linear correlation coefficients of the learning process, test, and validation of the CH-NET model for the prediction of carrot root yield loss in mechanical heading.
Agriculture 14 01755 g006
Figure 7. Correlation analysis of input variables of the CH-NET model for prediction of carrot root yield losses.
Agriculture 14 01755 g007
Figure 8. Example mapping of carrot root yield losses by CH-NET using a non-linear regression equation.
Agriculture 14 01755 g008
Figure 9. Examples of mapping by CH-NET of economic loss prediction.
Agriculture 14 01755 g009
Table 1. Criteria for prediction of carrot root yield losses during heading.
VariableCriteriaUnitRange of Values
x1Distance between carrot roots in a row m0.000–0.200
x2Distance between carrot roots in a row on a ridge m0.030–0.070
x3Heading height of carrot roots m0.000–0.055
x4Height of the head above the soil surface m0.000–0.055
x5Carrot root yield per 9 m2 areakg·m−286.230–94.010
x6Weight of a single carrot root kg0.100–0.342
x7Diameter of a single carrot rootm0.020–0.047
x8Length of a single carrot root m0.100–0.270
x9Angular speed of the discrad·s−14.710–75.880
x10Progressive speed in rotary motionm·s−11.649–26.559
x11Height of disc above ridge surfacem0.000–0.025
x12Machine progressive speedm·s−10.417–0.972
Table 2. Characteristics of carrot varieties.
Variety of CarrotLength of the Growing SeasonSowing DatesSowing NormYield
[days][day.month][million seeds·ha−1][t·ha−1]
Bangor110–12001.04–15.060.7–1.2 110.0–130.0
Komarno155–16015.04–15.050.7–0.890.0–100.0
Muleta150–16001.04–30.040.7–0.895.0–100.0
Warmia150–16015.04–15.060.7–1.095.0–100.0
Table 3. Multiple regression model of the prediction process of carrot root yield loss during the process of heading.
Analysis of variance for multiple regression model
SourceDegrees of freedomSum of squaresMean squareF statistic
Model 58953.6341754.14433848.84 **
Residual 152133.6780.4103
Total 1648756.539
Parameter estimation for multiple regression model
ParameterEstimationStandard errort statistic
Intercept47.4713 7.5989 7.10 **
x1−0.05411.1521−66.43 **
x2−1.1772 0.0162 −78.37 **
x36.5665 0.3451 22.24 **
x47.4795 0.2591 30.22 **
x5−1.3738 0.2343 −6.34 **
x111.9862 0.0354 67.53 **
** Significant at α = 0.05.
Table 4. Measures of fit of the CH-NET model of prediction of carrot root yield loss during the mechanical heading process.
Statistics Training SetTest SetValidation Set
SS0.12191.41331.3311
MAE0.00150.01550.0225
MSE0.00060.01860.0205
RMS0.06510.13880.1468
R20.93890.94770.9837
SDR0.00440.02550.0345
MAPE 90.6900%
GE 0.0931 t·ha−1
Table 5. Measures of fit of the CH-NET model of carrot root yield loss prediction with a limited number of variables.
Statistics Training SetTest SetValidation Set
SS0.12231.41551.3378
MAE0.00210.01750.0299
MSE0.00160.01910.0345
RMS0.06780.14010.1499
R20.94090.94990.9887
SDR0.00510.02970.0397
MAPE 90.0890%
GE 0.0991 t·ha−1
Disclaimer/Publisher’s Note: The statements, opinions and data contained in all publications are solely those of the individual author(s) and contributor(s) and not of MDPI and/or the editor(s). MDPI and/or the editor(s) disclaim responsibility for any injury to people or property resulting from any ideas, methods, instructions or products referred to in the content.

